Article

Formation Mechanism and Gemological Characteristics of “Yellow-Skinned” Nanhong Agate in Northeastern Yunnan, China: Evidence from Mineralogy and Geochemistry

1
Faculty of Land Resources Engineering, Kunming University of Science and Technology, Kunming 650093, China
2
Kunming Prospecting Design Institute of China Nonferrous Metals Industry Co., Ltd., Kunming 650051, China
3
Yunnan Provincial Key Laboratory of Geotechnical Engineering and Geological Hazards, Kunming 650051, China
4
China ENFI Engineering Technology Co., Ltd., Beijing 100038, China
5
School of Geosciences, Yunnan University, Kunming 650500, China
6
Key Laboratory of Critical Minerals Metallogeny in Universities of Yunnan Province, School of Earth Sciences, Yunnan University, Kunming 650500, China
*
Authors to whom correspondence should be addressed.
Crystals 2025, 15(5), 488; https://doi.org/10.3390/cryst15050488
Submission received: 9 April 2025 / Revised: 17 May 2025 / Accepted: 18 May 2025 / Published: 21 May 2025
(This article belongs to the Section Mineralogical Crystallography and Biomineralization)

Abstract

:
The “yellow-skinned” Nanhong agate represents a unique variety of Nanhong agate found in northeastern Yunnan, China, and it is highly valued for its distinctive yellow exterior and clear red–yellow interface. Owing to the limited research on this variety, the present study provides the first comprehensive analysis. Field surveys and various laboratory techniques—including polarizing microscopy, scanning electron microscopy (SEM), Fourier-transform infrared (FTIR) spectrometry, ultraviolet–visible (UV-VIS) absorption spectrometry, Raman spectroscopy, micro X-ray diffraction (µ-XRD) with Rietveld refinement, electron microprobe analysis (EPMA), and laser ablation–inductively coupled plasma mass spectrometry (LA-ICP-MS)—were utilized to investigate its gemological, microtextural, spectroscopic, and geochemical characteristics. Field surveys identified the occurrence states of the “yellow-skinned” Nanhong agate. The laboratory results indicate that the agate primarily consists of α-quartz, with minor amounts of moganite, goethite, and hematite. The coloring mechanism observed in this study is consistent with the findings of previous studies: the external yellow coloration is due to goethite, while the internal red hue is attributed to hematite. Its unique pseudo-granular silica (Type III) structure provides a foundational basis for the later formation of the “yellow-skinned” agate variety, and geochemical data reveal the distribution patterns of elements. Based on geological surveys and experimental data, the formation of the “yellow-skinned” Nanhong agate in northeastern Yunnan can be divided into two stages: first, hydrothermal fluids filled the vesicles in the Permian Emeishan Basalt Formation (P2β), leading to the formation of primary Nanhong agate. Subsequently, the Type III primary agate underwent weathering, erosion, transport, and deposition in the red–brown sandy mudstone of the Lower Triassic Feixianguan Formation (T1f). The sedimentary environment in the second stage facilitated the conversion of outer hematite into goethite, resulting in the distinct “yellow-skinned” appearance with a clear red–yellow boundary. Based on the occurrence and stratigraphic relations, this study constrains the formation age of the “yellow-skinned” Nanhong agate to approximately 261.6 Ma.

1. Introduction

Agate is one of the famous gemstones, and the finest variety is Nanhong agate. It is popular among the Chinese people owing to its vibrant red hue. Nanhong agate originates from Baoshan City, Yunnan Province, southwest China, and the name means red agate in southern China. With the development of the Nanhong agate industry, Nanhong agate from Liangshan, Sichuan, has gradually come into the public eye, while Nanhong agate from northeastern Yunnan is a type of gemstone that has only recently gained attention. The red color of Nanhong agate is bright and of high quality, making this variety popular among the public [1].
Agate is primarily found in volcanic rocks, such as basalt [2,3,4,5,6], andesite [7,8] and rhyolite [9,10,11], and some are also produced in sedimentary strata [12,13,14]. The most attractive aspect of agate is its ever-changing bands, and the band structure is an important feature that distinguishes agate from chalcedony. Therefore, chalcedony designates aggregates of parallelly grown, fibrous quartz crystals of microscopic and sub-microscopic size, and agate is a banded chalcedony intergrown and intercalated with other silica phases, together with other mineral inclusions [15,16]. The main chemical component of agate is SiO2, with the main mineral component being chalcedony (or low-temperature quartz); it also contains other SiO2 phases, such as moganite, and opal [5,6,7,17,18,19,20,21]. In addition, agate contains a certain amount of calcite, chlorite, feldspar, clay minerals, and other minerals [22,23,24,25]. Different internal microstructures may produce varying macroscopic patterns, including differences in crystal particle size, microtexture, and pore distribution. When agate contains other impure minerals, it can display different colors. According to previous research, the red and yellow colors of agate are mainly caused by Fe compounds in the form of inclusions. The red color is attributed to hematite, and the yellow color is caused by goethite [1,6,8,26,27].
Previous researchers conducted systematic studies of Nanhong agate in Baoshan, Yunnan, northeastern Yunnan, and Liangshan (Sichuan) [28,29,30,31,32,33,34]. Generally, Nanhong agate exhibits an overall red appearance, with hematite being the primary mineral responsible for its coloration [23,35,36]. In our previous study [1], we investigated different types of Nanhong agates from northeast Yunnan, including “yellow-skinned” agates, which are unique to Qiaojia County, Zhaotong City. It is characterized by a 0.5–1.5-cm wide yellow circular layer on the exterior, creating a striking contrast with the internal red layer. It differs from another type of red agate—Zhanguohong agate—from Beipiao, Liaoning, China [37] and Xuanhua, Hebei [27]. The yellow outer layer of the “yellow-skinned” Nanhong agate has a distinct interface with the inner red layer and does not exhibit the red and yellow mixed phenomenon seen in Zhanguohong agate.
In this study, we further investigated the “yellow-skinned” type of Nanhong agate. By conducting a systematic and in-depth analysis of its gemological, microtextural, spectroscopic and geochemical characteristics, we initially identified its occurrence and explored the coloration mechanisms and origins associated with the “yellow-skinned” appearance. Additionally, we attempted to constrain its formation age using stratigraphic data. This research not only provides significant insights for a deeper understanding of this novel type of Nanhong agate but also lays a foundation for future studies in related fields.

2. Geological Setting

2.1. Regional Geology

Currently, the “yellow-skinned” Nanhong agate available in the market from northeastern Yunnan is primarily sourced from the Qiaojia County in Zhaotong City, Yunnan Province, China. The strata of this region mainly consist of Permian–Triassic Formations, with the Upper Permian Emeishan Basalt Formation being widely distributed (Figure 1a). In 1929, Mr. Zhao Yazen named this set of Late Permian basalts in southwest China the “Emeishan basalt”. In 1995, Chung and Jahn proposed the term “Emeishan Large Igneous Province (ELIP)” [38], establishing the ELIP as the only large igneous province in China recognized by the international geoscience community. Large Igneous Provinces (LIPs) represent large-scale magmatic events that occurred over a short period in Earth’s history. LIPs are mainly characterized by their composition of basic rocks and their large size. Most exposed areas exceed 1 × 10⁶ km2, and they typically erupt within a short timeframe of 3 Ma or even <1 Ma [39].
The ELIP is located on the western edge of the Yangtze Plate. Small amounts of Emeishan basalt and picrite basalt are distributed in Vietnam, the Qiangtang region of Tibet, and western Guangxi [38,40,41,42]. The distribution area of the ELIP exceeds 2.5 × 10⁵ km2, and its volume is greater than 3 × 10⁵ km3 [43]. The main eruption stage of the magmatic event in the ELIP occurred at ~260 Ma [44,45]. According to the difference in the degree of erosion evident in the Maokou Formation limestone, the ELIP is divided into three zones: the inner zone, the middle zone, and the outer zone [46]. The thickness of the Emeishan basalt layer exhibits a transition from 5000 m in the inner zone to several hundred meters in the outer zone [47,48]. Qiaojia County is located in the “middle zone” of the ELIP (Figure 1a). Regionally, this set of basalts shows a pattern of violent eruption, overflow, overflow, and intermittent eruption from bottom to top. It is divided into four cycles, corresponding to the first to fourth sections of the Emeishan Formation basalts (P2β1–P2β4).
Figure 1. Geological map. (a) Geological map showing the distributions of basalts and picrites in the Emeishan large igneous province (Emeishan LIP) (modified after Kamenetsky et al., 2012 [48]; He et al., 2003 [46]; Zhang, 2021 [49]); (b) regional geologic map of Northeast Yunnan Province China; (c) field geologic survey sections.
Crystals 15 00488 g001
In northeastern Yunnan, the first cycle is absent. According to field surveys, native Nanhong agate occurs in the form of amygdales in the first submember of the fourth member of the Emeishan basalt in the Permian system (P2β4−1) and the Erya segment (P2β4−2). In the overlying strata, the Upper Permian Xuanwei Formation (P2x, yellow–green sandy shale) and the Lower Triassic Feixianguan Formation (T1f, reddish-brown sandy shale and mudstone) are both exposed. The Xuanwei Formation unconformably overlies the Emeishan basalts, while the Feixianguan Formation and Xuanwei Formation are in conformable contact (Figure 1b,c).

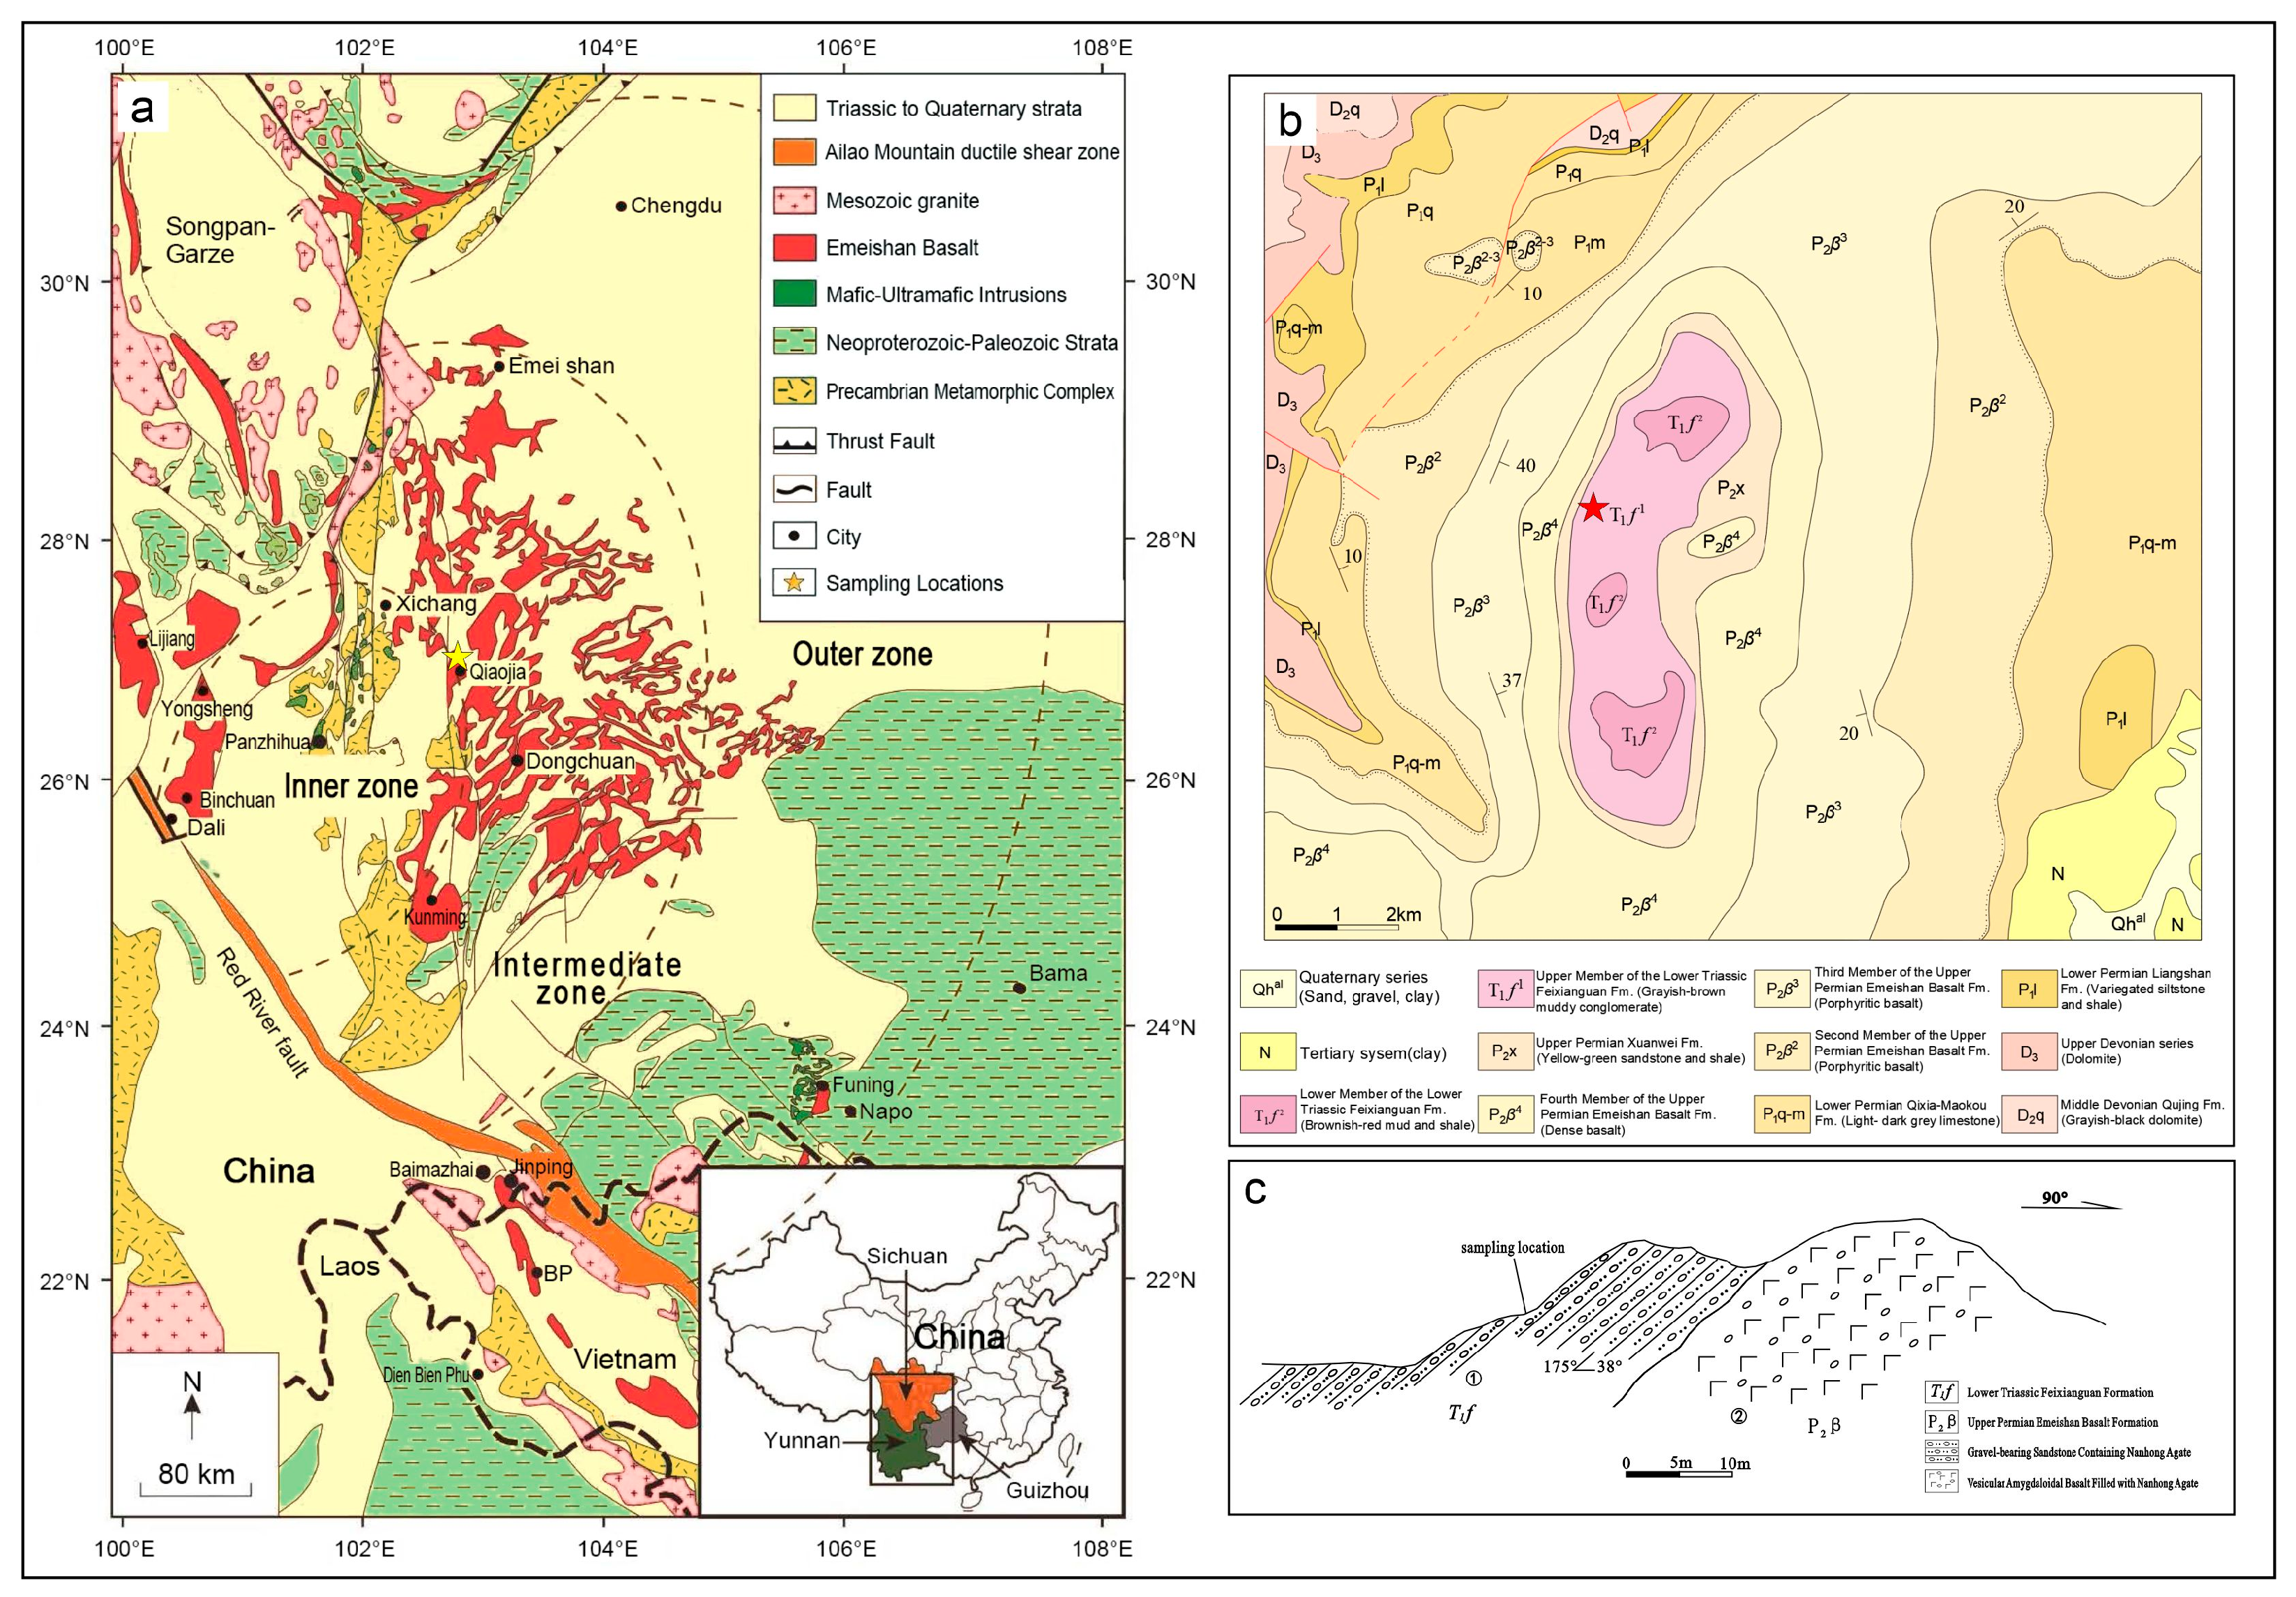
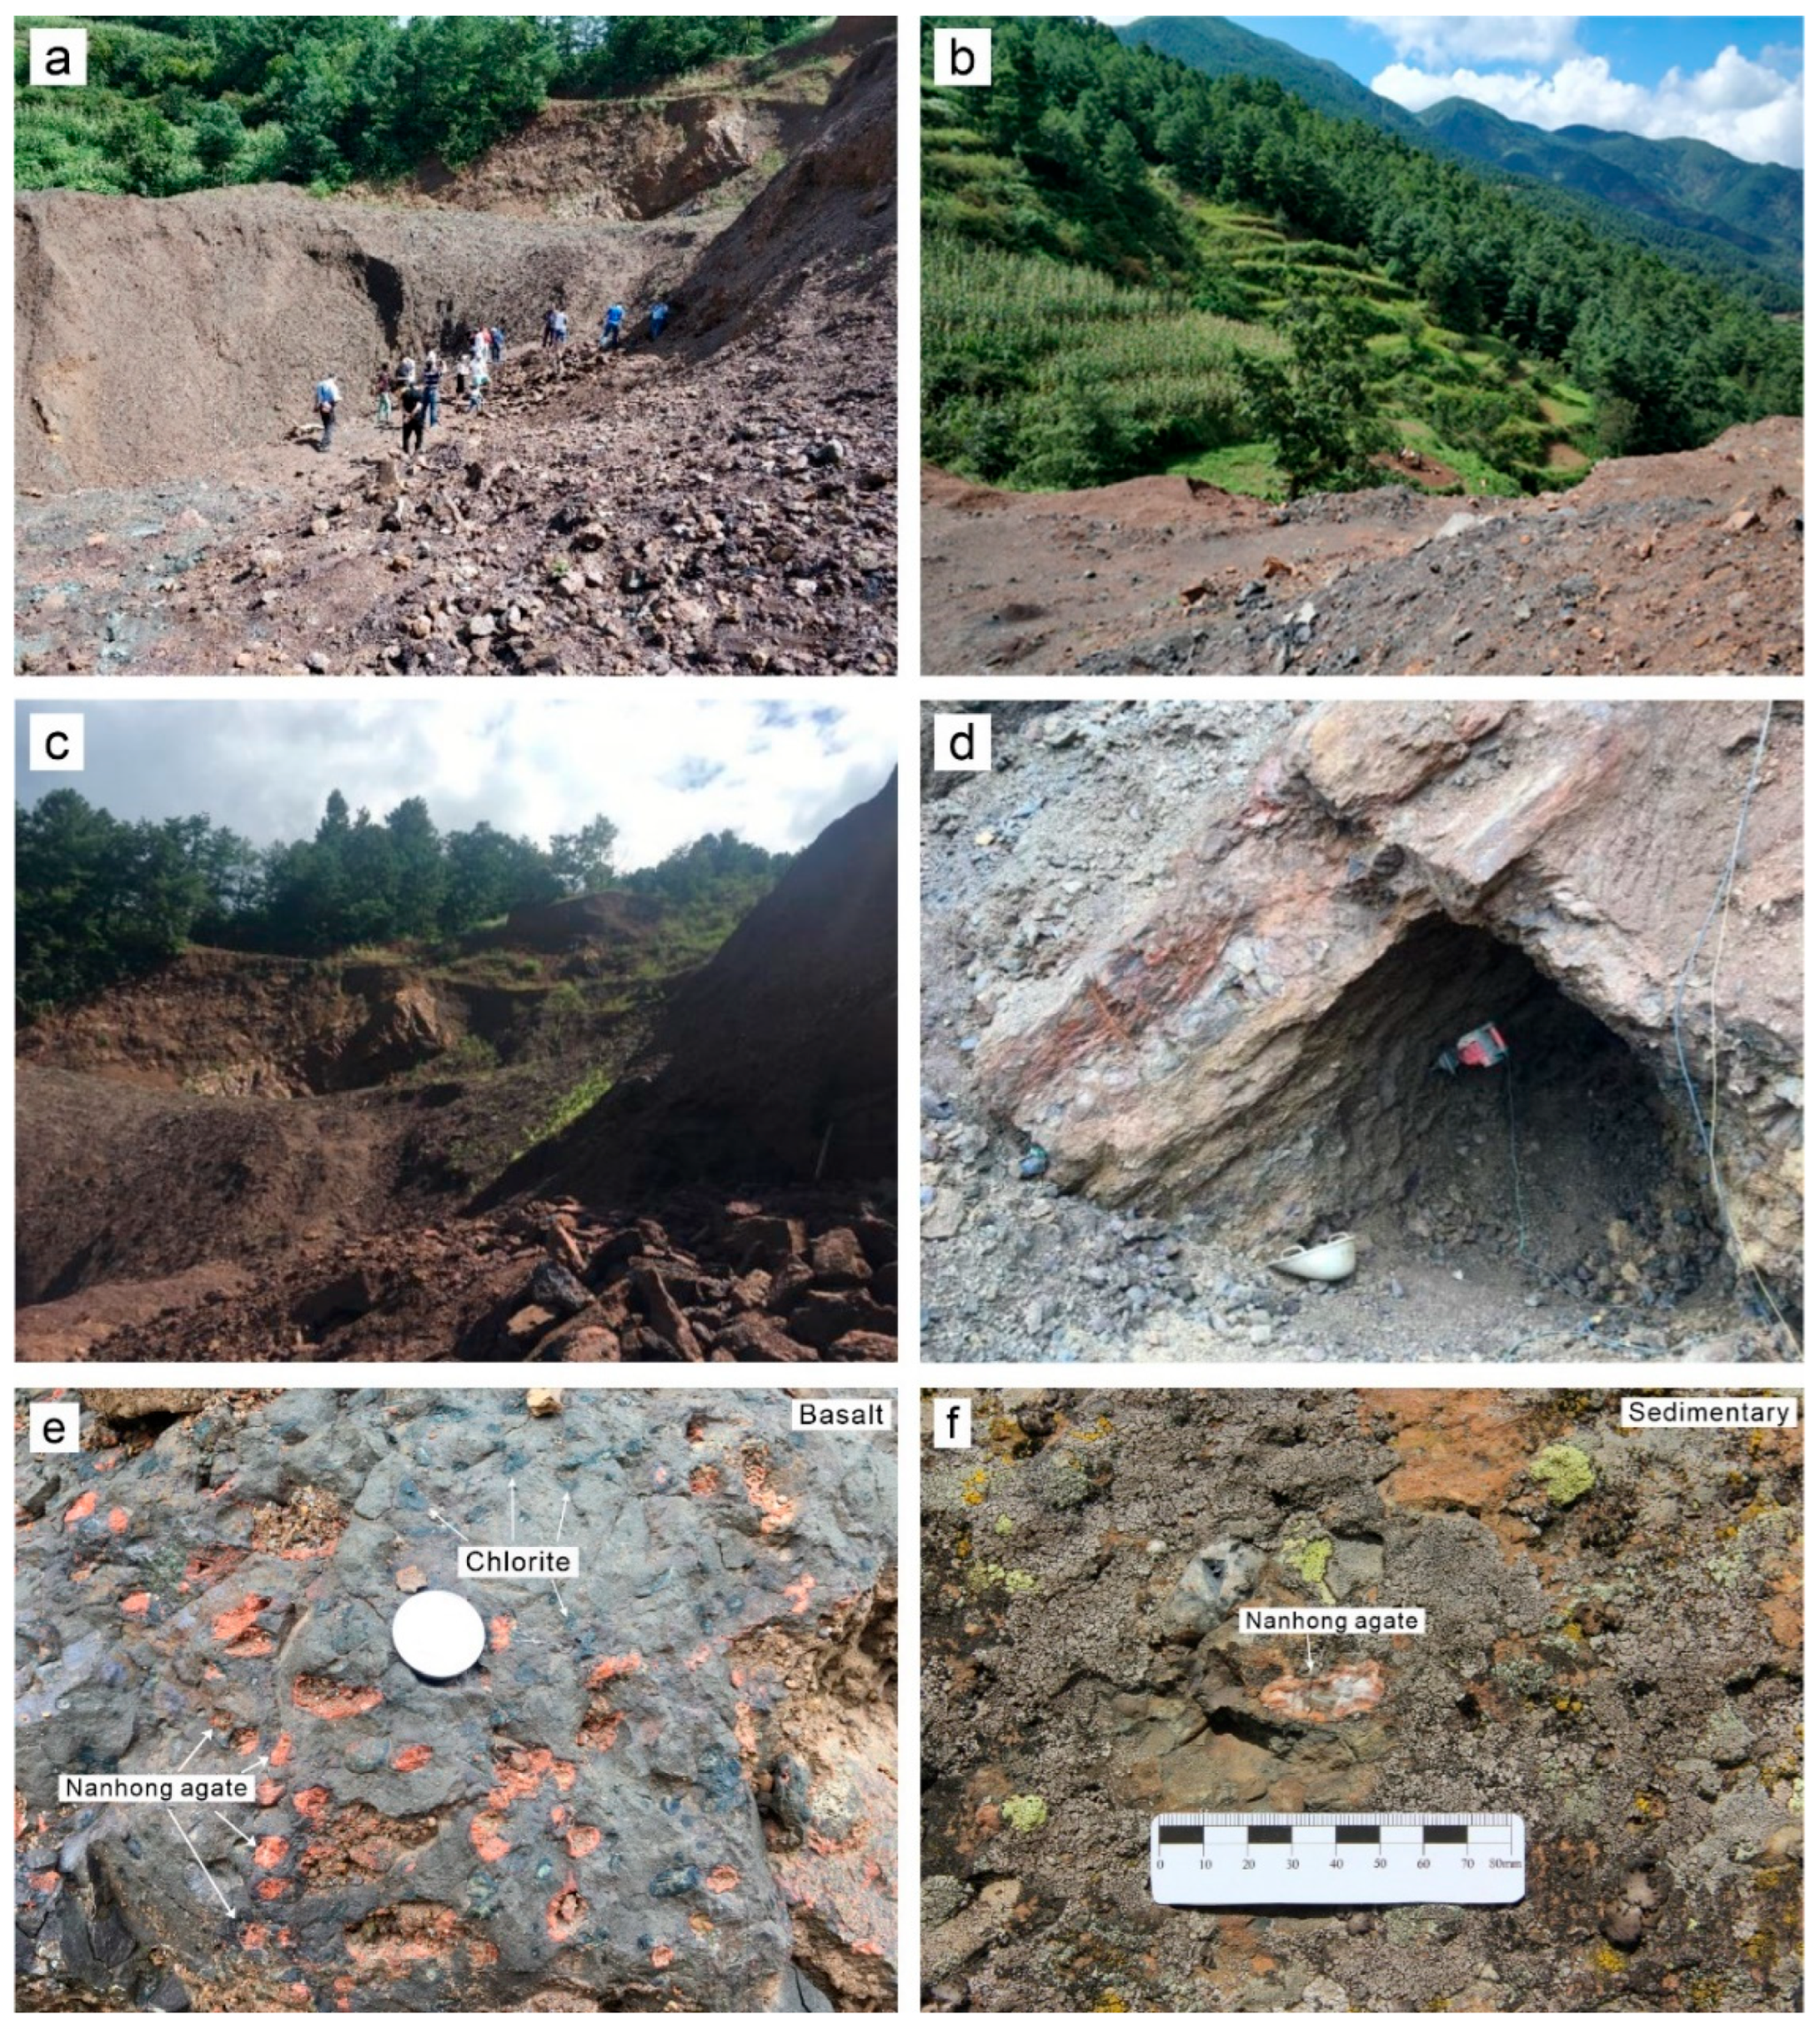
2.2. Deposit Geology

The samples analyzed in this study were obtained from Qiaojia County, Zhaotong City, Yunnan Province, China, where there is an abundant supply of Nanhong resources (Figure 2).
The mineral point is located in a syncline structure, and the trend of the syncline is NNE. The strata exposed in the core of the syncline are mainly the Permian Emeishan Basalt Formation (P2β) and the Triassic Feixianguan Formation (T1f), and the Upper Permian is exposed on both wings of the syncline. Nanhong agate occurs in the following two formations:
(1) Primary Nanhong agate in the Upper Permian Emeishan Basalt Formation (P2β4).
The Upper Permian Emeishan Basalt Formation is characterized by its thick, dark-gray basalt bands exhibiting vesicular amygdaloidal structures. Amygdales comprise 12–25% of the rock’s volume and are predominantly composed of chlorite and agate. The morphology of the agate is influenced by the geometry of the basalt vesicles, with grain sizes ranging from several millimeters to several centimeters (Figure 2e).
(2) Secondary Nanhong agate in the Lower Triassic Feixianguan Formation (T1f).
The lithology of the Feixianguan Formation in the lower Triassic is characterized by dark purple–red mudstone interbedded with minor sandstone. Nanhong agate is found at the base of this formation, comprising 5–10% of the total gravel volume. The individual agate pebbles typically range from 2 to 4 cm, with a maximum size of 8 cm (Figure 2f). The “yellow-skinned” Nanhong agate is particularly rare, accounting for only 1% of the agate content. The “yellow-skinned” Nanhong agate samples studied in this research are sourced from this formation (Figure 1c).

3. Materials and Methods

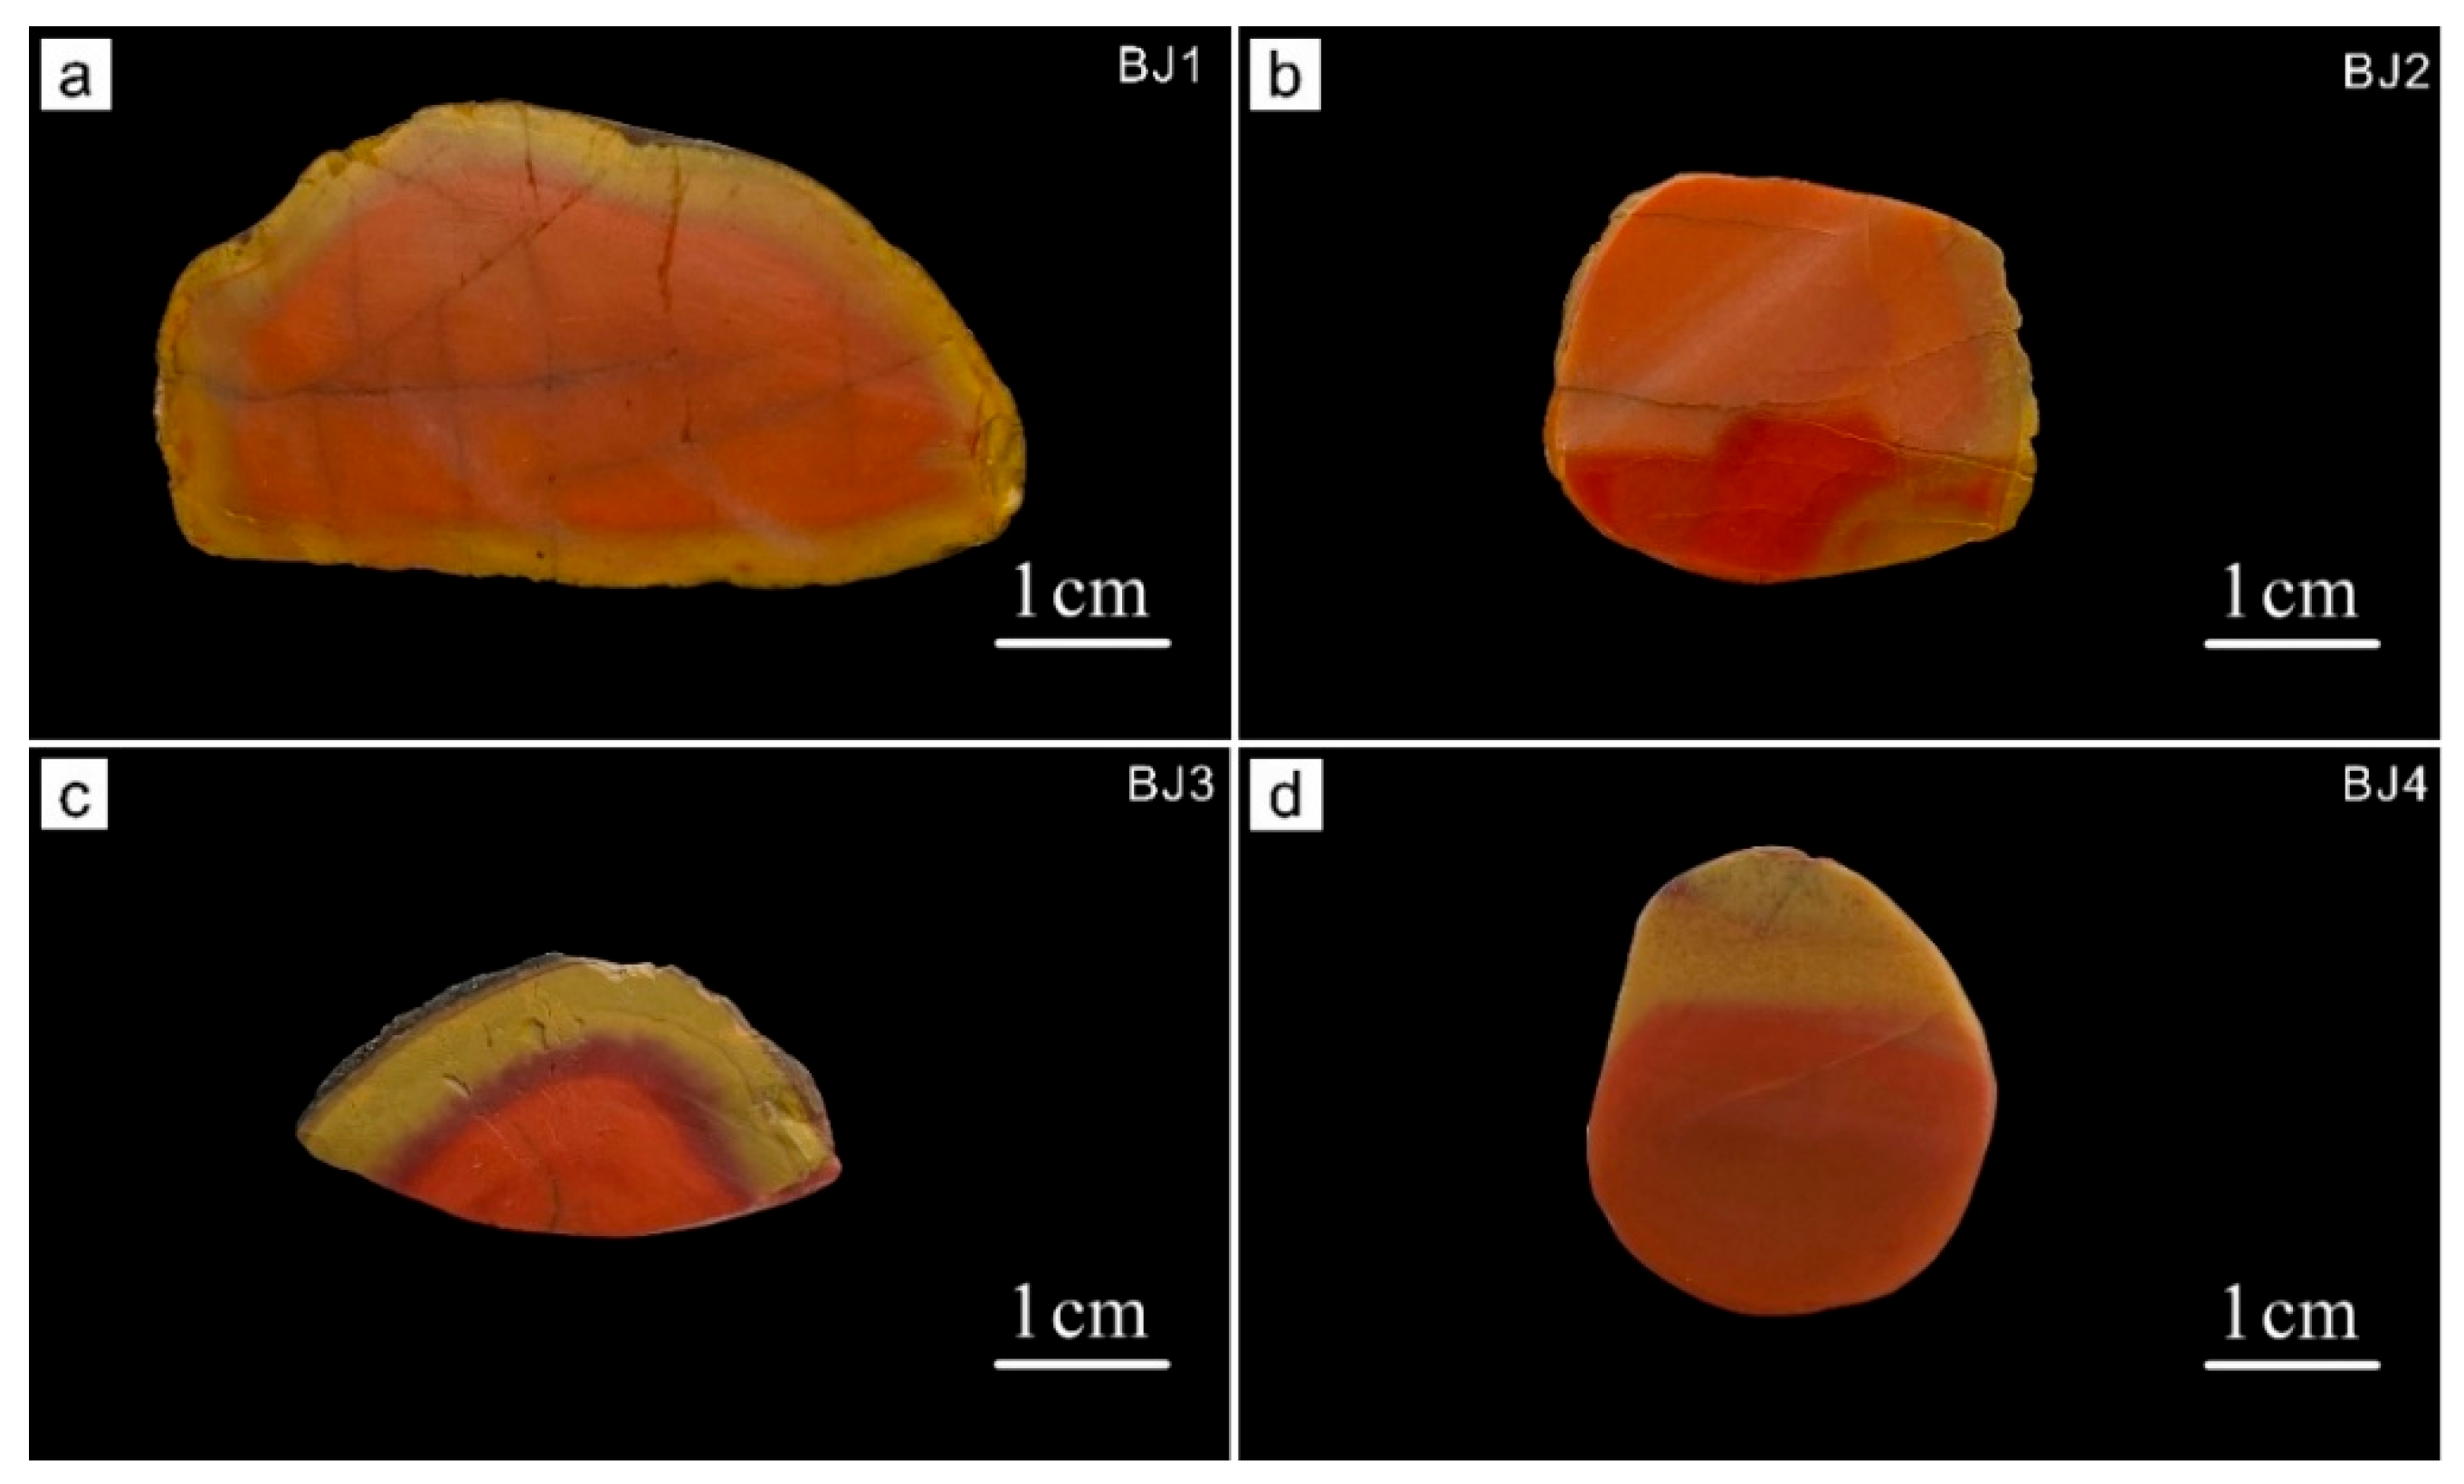
3.1. Sample Materials

A substantial number of Nanhong agate samples (>100) were collected from field surveys conducted in Zhaotong City, Huize County, Qiaojia County, and Dashanbao, located in northeastern Yunnan Province, China. After classification and selection in the laboratory, approximately 53 samples were prepared into slices with a thickness of about 1–3 mm and polished on both sides, for manual specimen observation and the identification of basic gemological characteristics. Only the secondary Nanhong agates from the Qiaojia County Lower Triassic Feixianguan Formation (T1f) were found to exhibit a “yellow-skinned” quality. Four samples from this formation were selected for detailed gemological, spectroscopic, microstructural, and geochemical characterization (Figure 3).

3.2. Analytical Methods

1. Fundamental gemological characteristics research
All of the collected samples were subjected to preliminary screening to select the “yellow-skinned” Nanhong agate. For gemological characterization, we selected and prepared samples into slices with a thickness of approximately 1–3 mm, ensuring both sides were polished in parallel. We performed basic gemological analyses, which included measuring the refractive index with a refractometer, assessing hardness using a Mohs hardness pencil, determining relative density through static water weighing, and evaluating fluorescence response under ultraviolet (UV) light. Furthermore, we utilized a Leica M205A stereomicroscope equipped with an integrated camera to observe and capture photographs of the samples’ internal features at magnification.
2. Crossed polarizer
The samples were prepared as polished thin sections with a standard thickness of 0.03 mm, without cover glass. The samples were observed using an OLYMPUS BX51 (Hachioji, Tokyo) polarized light microscope, employing various illumination methods including transmitted, reflected, and oblique light.
3. Scanning electron microscopy coupled with energy-dispersive X-ray spectrometry (SEM–EDS)
For the micromorphological observations, we used a Nova NanoSEM 450 (Hillsboro, OR, USA) high-resolution field emission scanning electron microscope from FEI. Prior to the experiments, we prepared fresh fracture surfaces of the samples and applied a platinum coating. The analyzed parameters included a voltage of 15 kV, a beam spot size of 2–3 nm, magnifications from 2500 to 40,000 times, and a working distance of about 1.5 mm. The semi-quantitative compositional analysis of the test spots was performed using an accessory-X-ray spectrometer. All analyses were performed at the Analytical Testing Research Center of Kunming University of Science and Technology.
4. Fourier-transform infrared (FTIR) spectroscopy
For the infrared spectroscopy analysis, a Thermo NICOLET iS50 (Waltham, MA, USA) Fourier transform infrared spectrometer was utilized to perform both diffuse reflectance and transmission measurements. The diffuse reflection was carried out using the UpIR accessory from Pike, while the KBr transmission accessory from Thermo (Waltham, MA, USA) was employed for direct transmission analysis. The analytical parameters were as follows: 8 scans, a resolution of 4 cm−1, a gain of 2, a moving mirror speed of 0.4747 cm/s, and an aperture setting of 80. The collection range for diffuse reflection extended from 400 to 4000 cm−1, whereas the transmission range was from 400 to 6000 cm−1. The analyses were conducted at a temperature of 20 °C and a humidity of 52%. The analyses were performed at the Kunming University of Science and Technology Analysis and Testing Research Center.
5. UV–visible (UV–Vis) spectroscopy
For the ultraviolet–visible spectral analysis, a Skyray UV100 spectrometer (Skyray Instrument Inc., Suzhou, China) was utilized under the following conditions: the spectral range spanned from 200 to 1000 nm, with an integration time of 100 ms and a smoothing width of 5. The spectral resolution was 1–2 nm (FWHM), its wavelength accuracy ±0.5 nm, and its repeatability ≤0.2 nm. The analyses were performed at the Kunming University of Science and Technology Analysis and Testing Research Center.
6. Raman spectroscopy
The Raman spectrum analysis was conducted using the LabRAM HR Evolution Raman spectrometer from HORIBA (Kyoto, Japan), France. The instrument featured a laser light source with a wavelength of 532 nm and an output power of 12.5 mW. The wavenumber range was 100–4000 cm−1, with a resolution of 1 cm−1. Each analysis involved five integrations and a detection time of 5 min. The tests were performed at the Kunming University of Science and Technology Analysis and Testing Research Center.
7. Micro X-ray diffraction (µ-XRD)
For the µ-XRD analysis, a Malvern PANalytical EMPYREAN equipped with Cu radiation (λ = 1.54056 Å), a voltage of 40 kV, and a current of 40 mA was used. The measurements were performed on a defined microarea using a 0.5 mm X-ray beam collimator. The sample was scanned over a 2θ range of 5° to 90°with a step size of 0.02°. The data acquisition time for each step was 140.25 s, and the scan speed was 0.048°/s. The total time spent at each test site was 30 min and 53 s, ensuring adequate counting statistics. The obtained diffraction patterns were analyzed using Rietveld refinement. The software used for Rietveld refinement is HighScore (Plus), version 5.2 (5.2.0.31529), produced by Malvern Panalytical B.V., Almelo, the Netherlands. The analyses were performed at the Kunming University of Science and Technology Analysis and Testing Research Center.
8. Electron probe microanalysis (EPMA)
A JXA-8230 (Tokyo, Japan) electron microprobe was used to analyze the primary chemical composition of the sample. Prior to analysis, samples were prepared as probe sheets with a thickness of 0.04 mm and then coated with carbon. The analytical parameters included an accelerating voltage of 15 kV, an accelerating current of 20 nA, and a beam spot diameter of 10 μm. All data were ZAF corrected. The analyses were performed at Wuhan Shangpu Analysis Technology Co., Ltd. (Wuhan, China).
9. Laser ablation–inductively coupled plasma mass spectrometry (LA–ICP–MS)
Trace element analysis of the agates was conducted using LA–ICP–MS. The main instrument employed was an Agilent 7900 Plasma Mass Spectrometer (Santa Clara, CA, USA), coupled with the GeoLas HD laser ablation system operating at a laser wavelength of 193 nm. The analytical settings included a laser energy of 80 mJ, a frequency of 5 Hz, and a laser spot diameter of 44 µm. The reference materials used were international standards such as NIST 610, BHVO-2G, BIR-1G, BCR-2G, and GSE-1G. The analyses were performed at Wuhan Shangpu Analysis Technology Co., Ltd.

4. Results

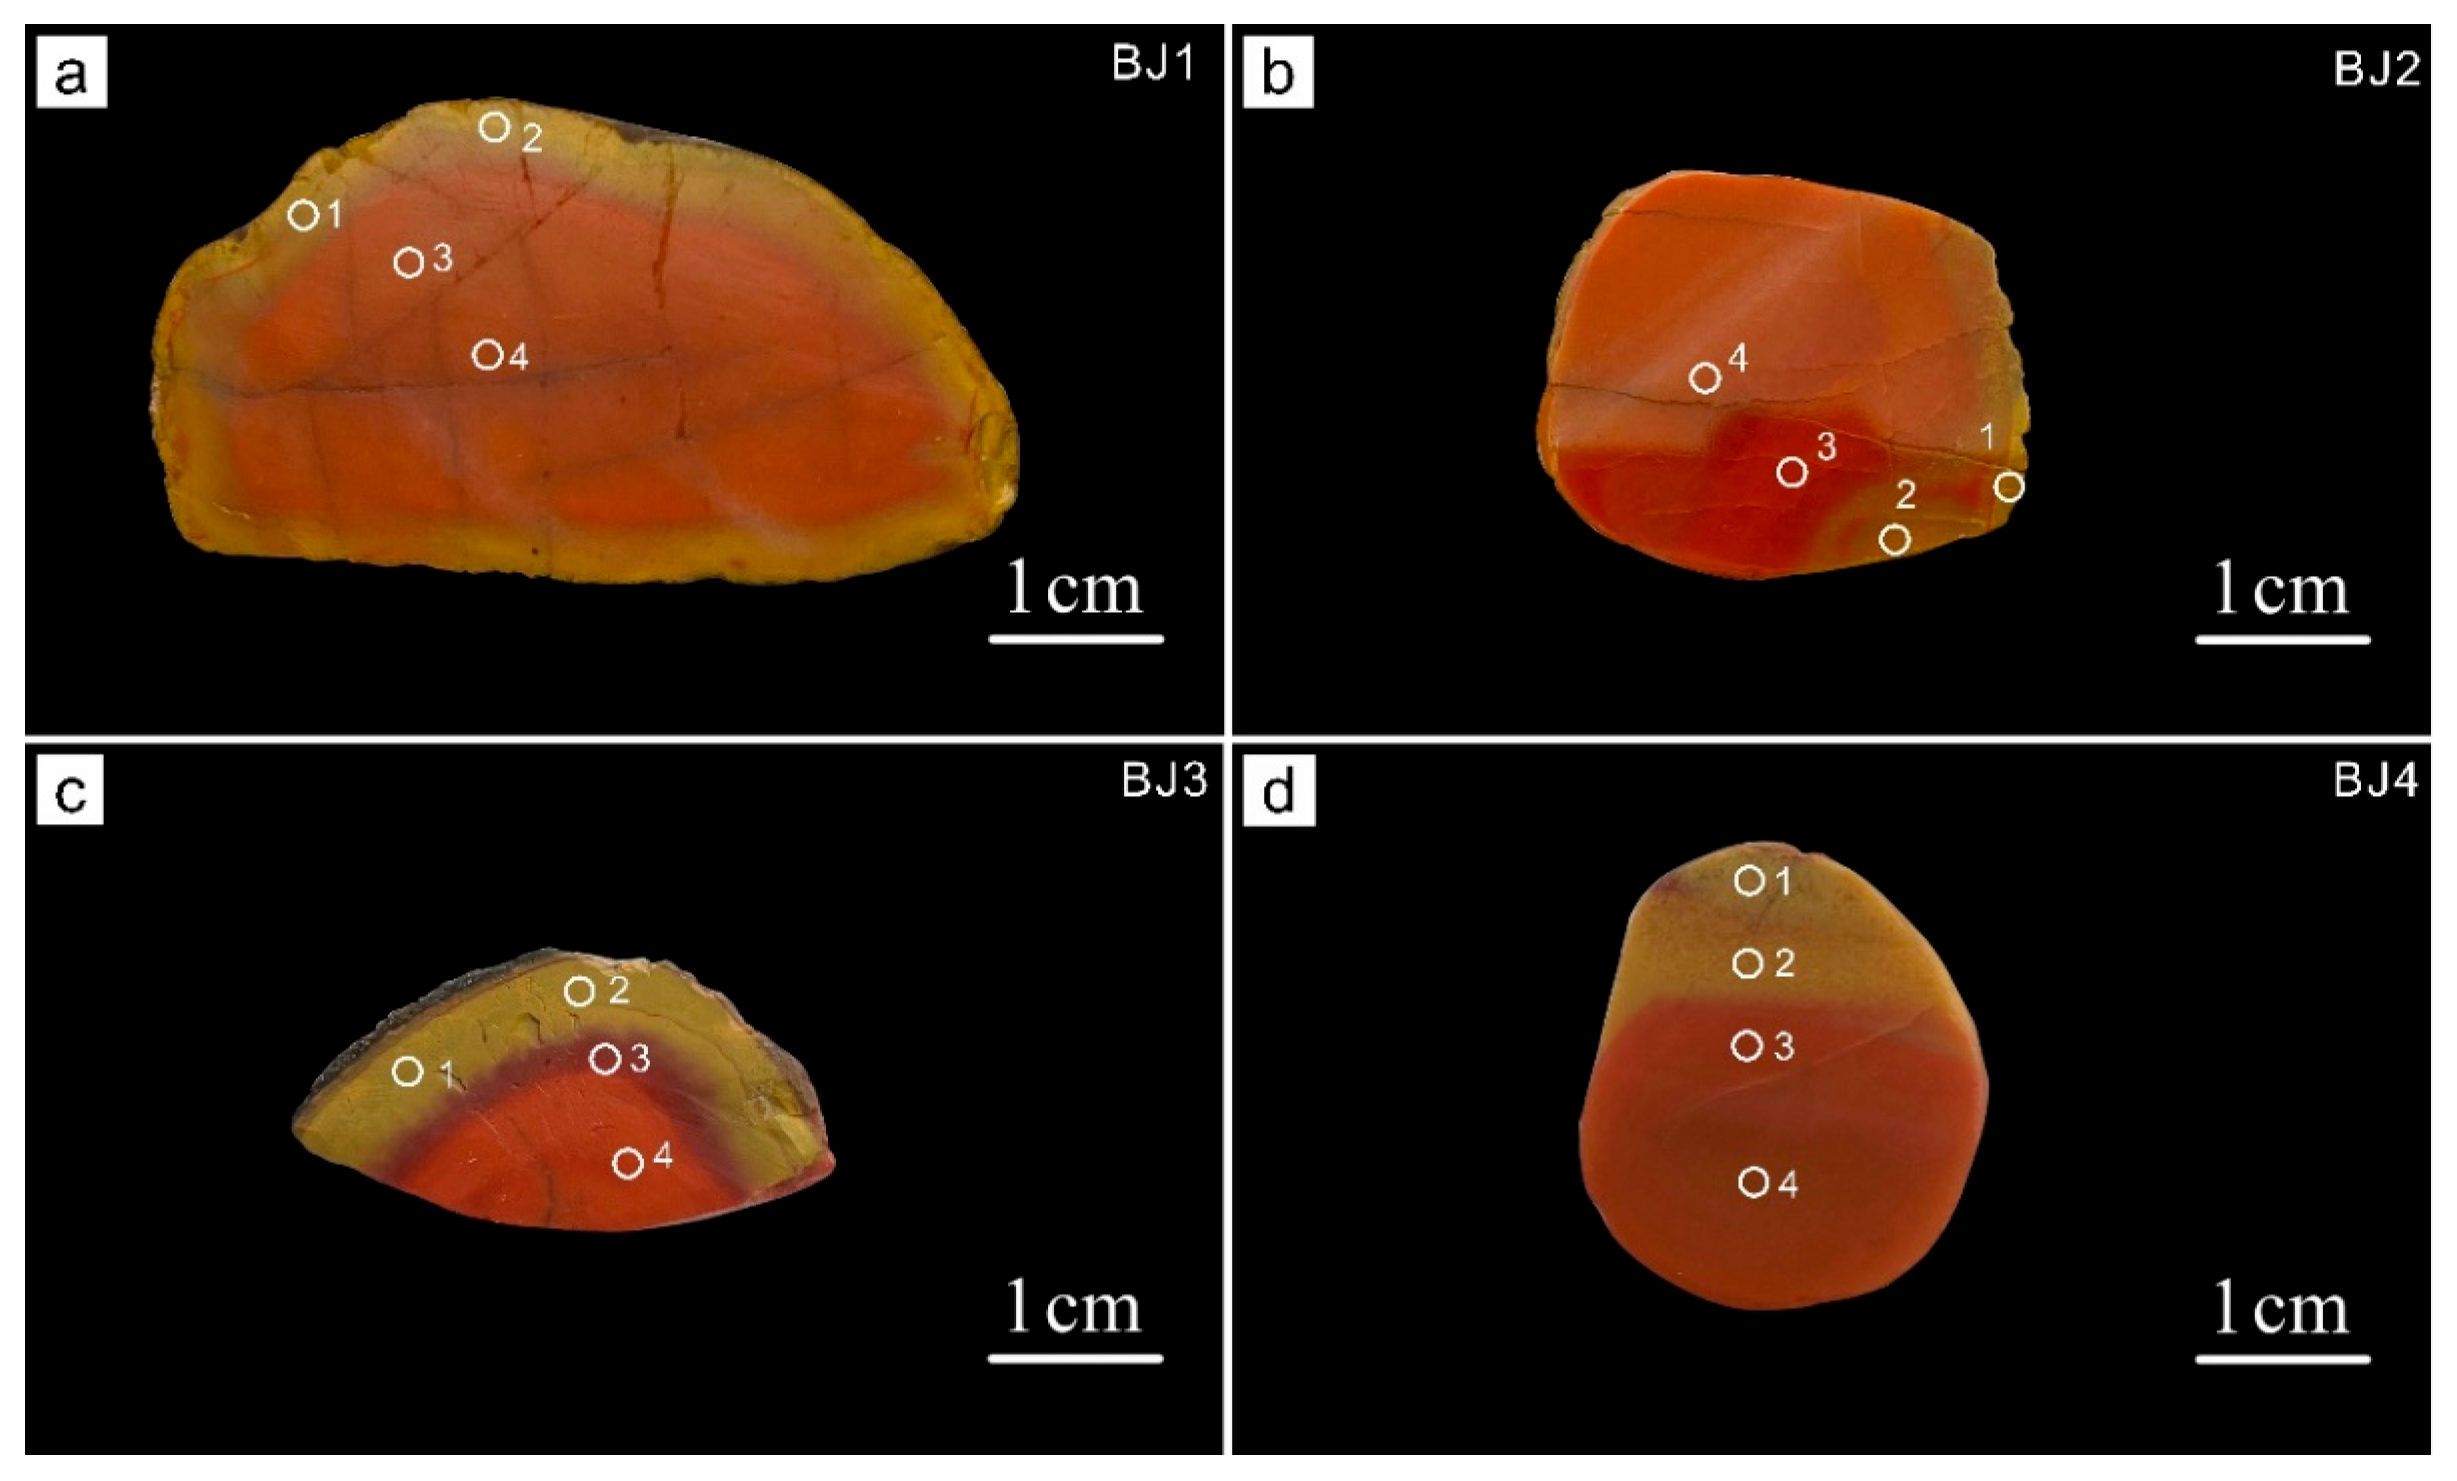
4.1. Basic Gemmological Characteristics

In this study, four samples of “yellow-skinned” Nanhong agate from northeastern Yunnan were examined. The external yellow and internal red colors of these samples are notably vivid, with a clear demarcation between the red and yellow sections. The thickness of the yellow outer layer ranges from 0.5 to 1.5 cm, and the internal structure contains numerous cracks. Compared to other types of Nanhong agate, the “yellow-skinned” variant exhibits reduced transparency, appearing semitransparent. Based on their banding characteristics, these samples are classified as wall-lining agate. The freshly fractured surfaces display a greasy luster, while the polished surfaces exhibit a vitreous luster. The refractive index is approximately 1.54, the Mohs hardness is 7, the relative density is 2.63, and they are fluorescently inert.

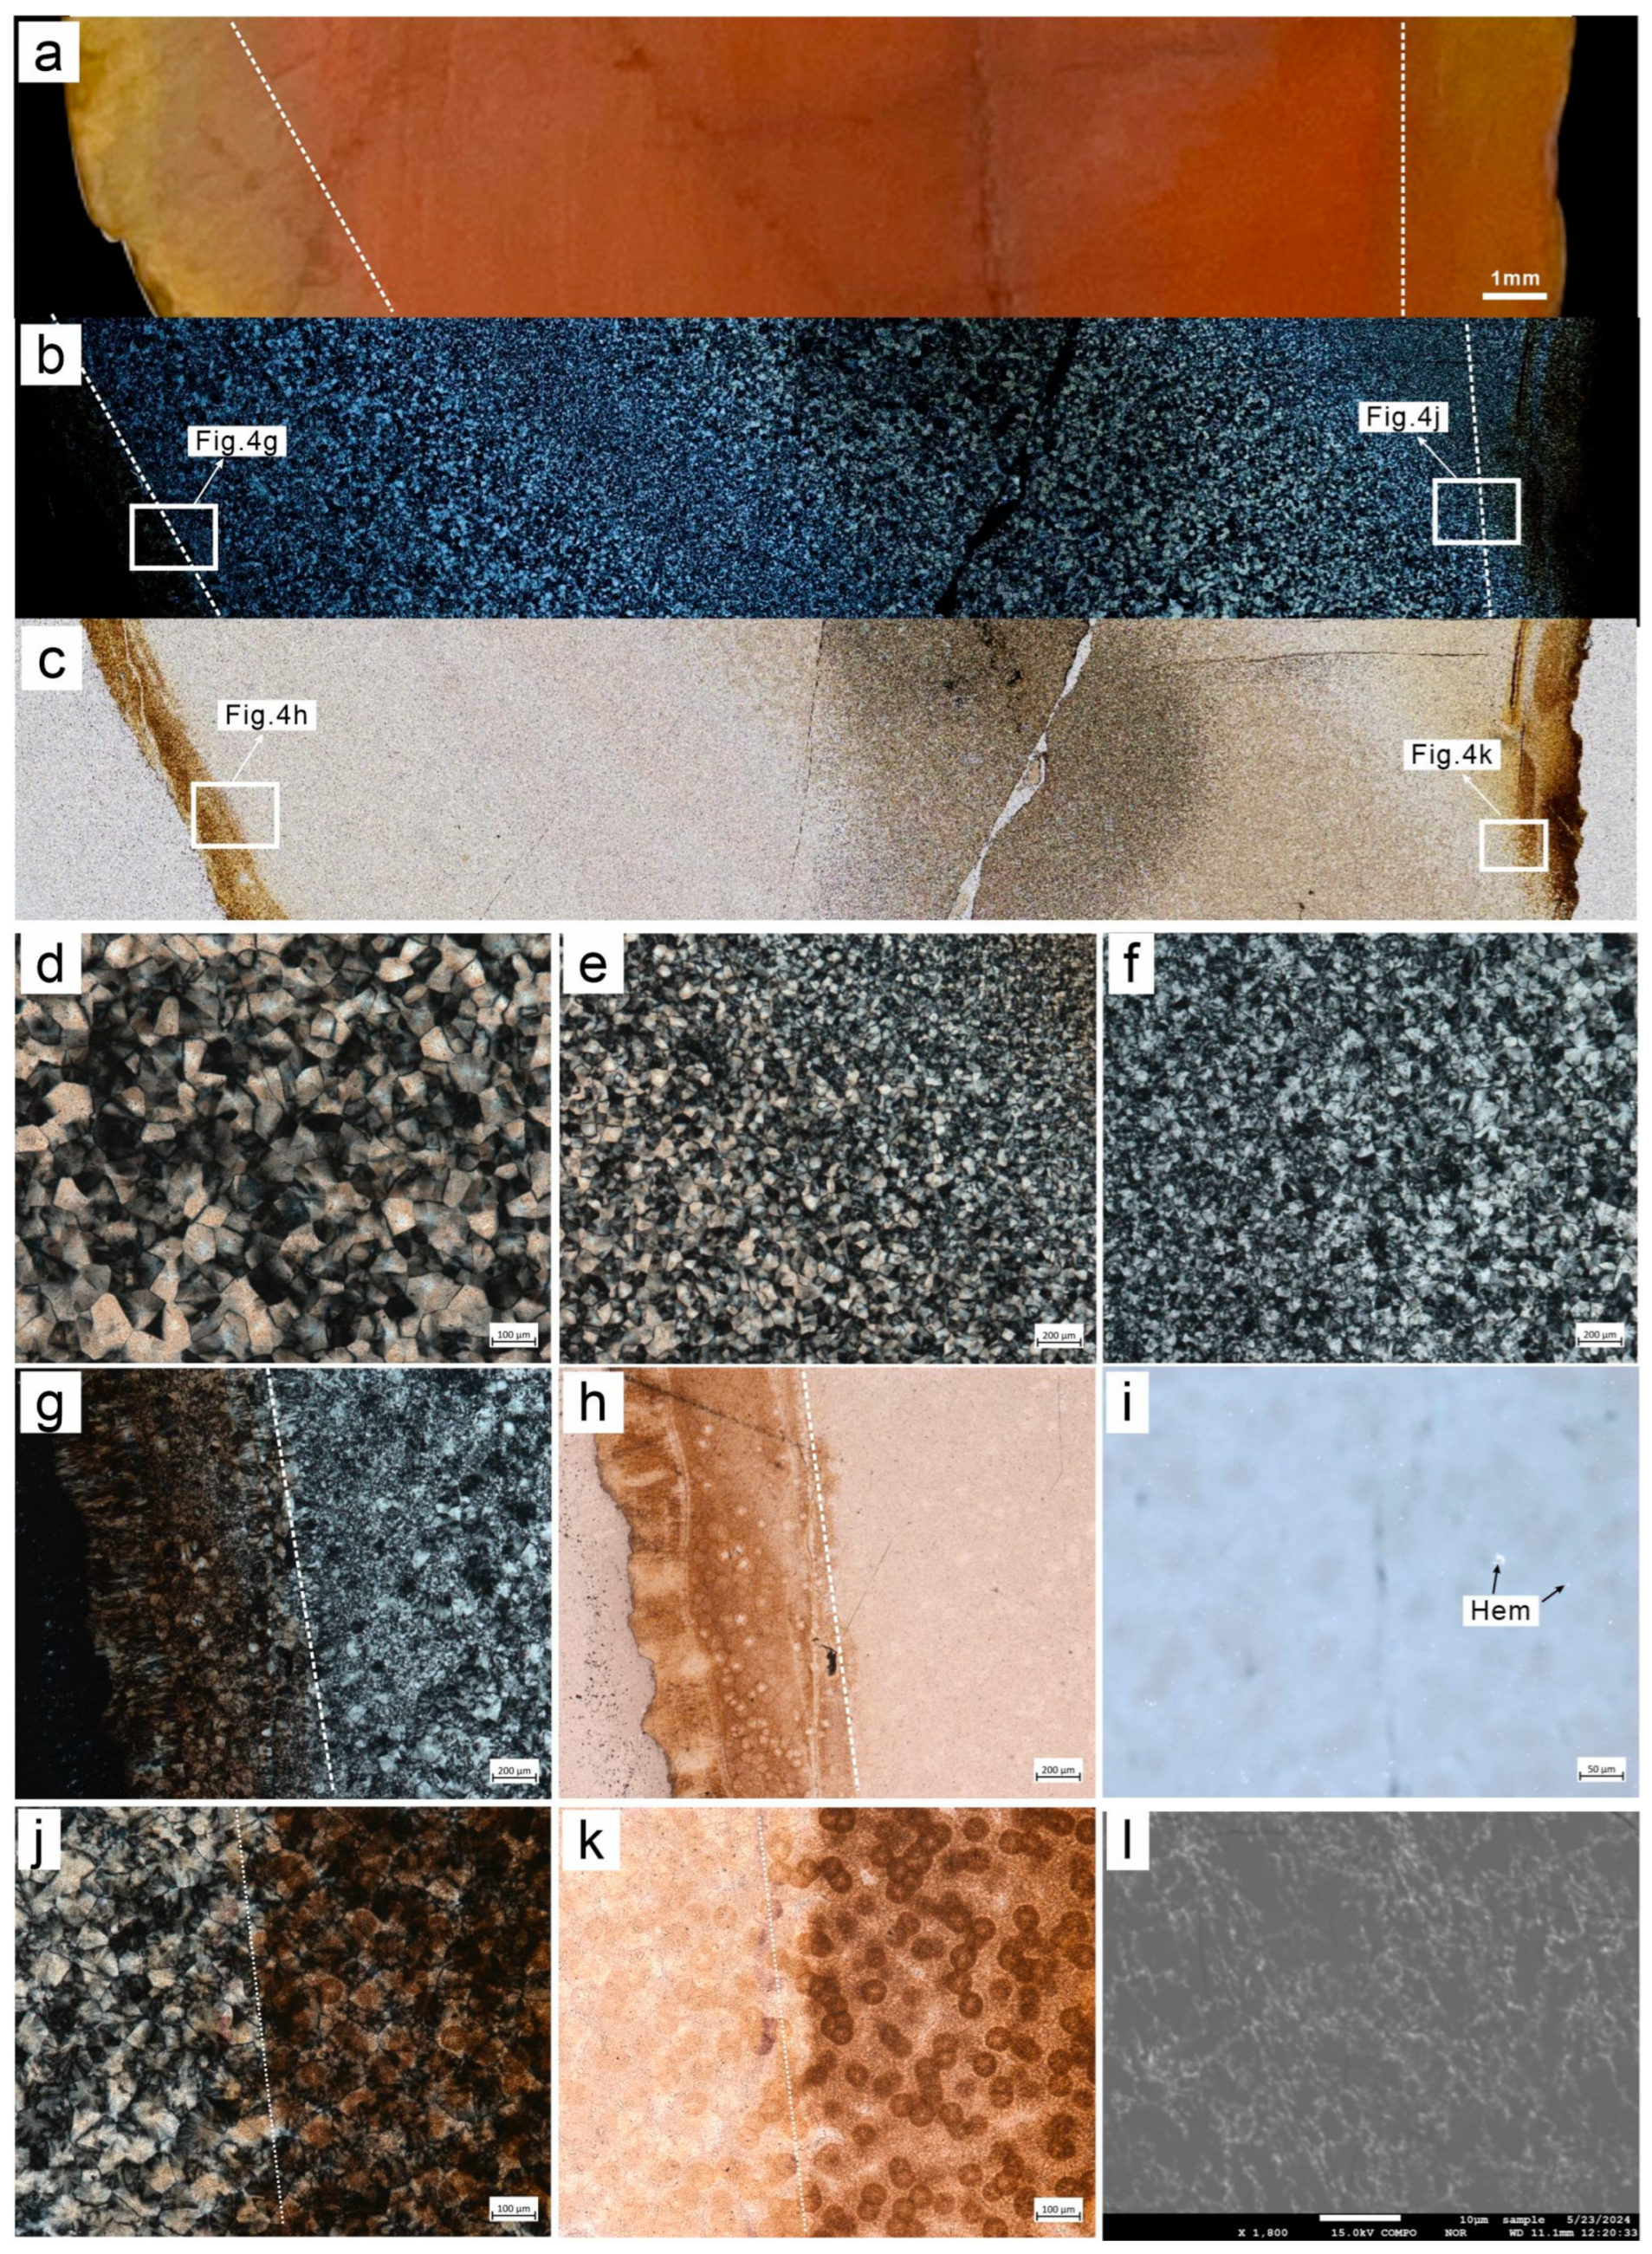
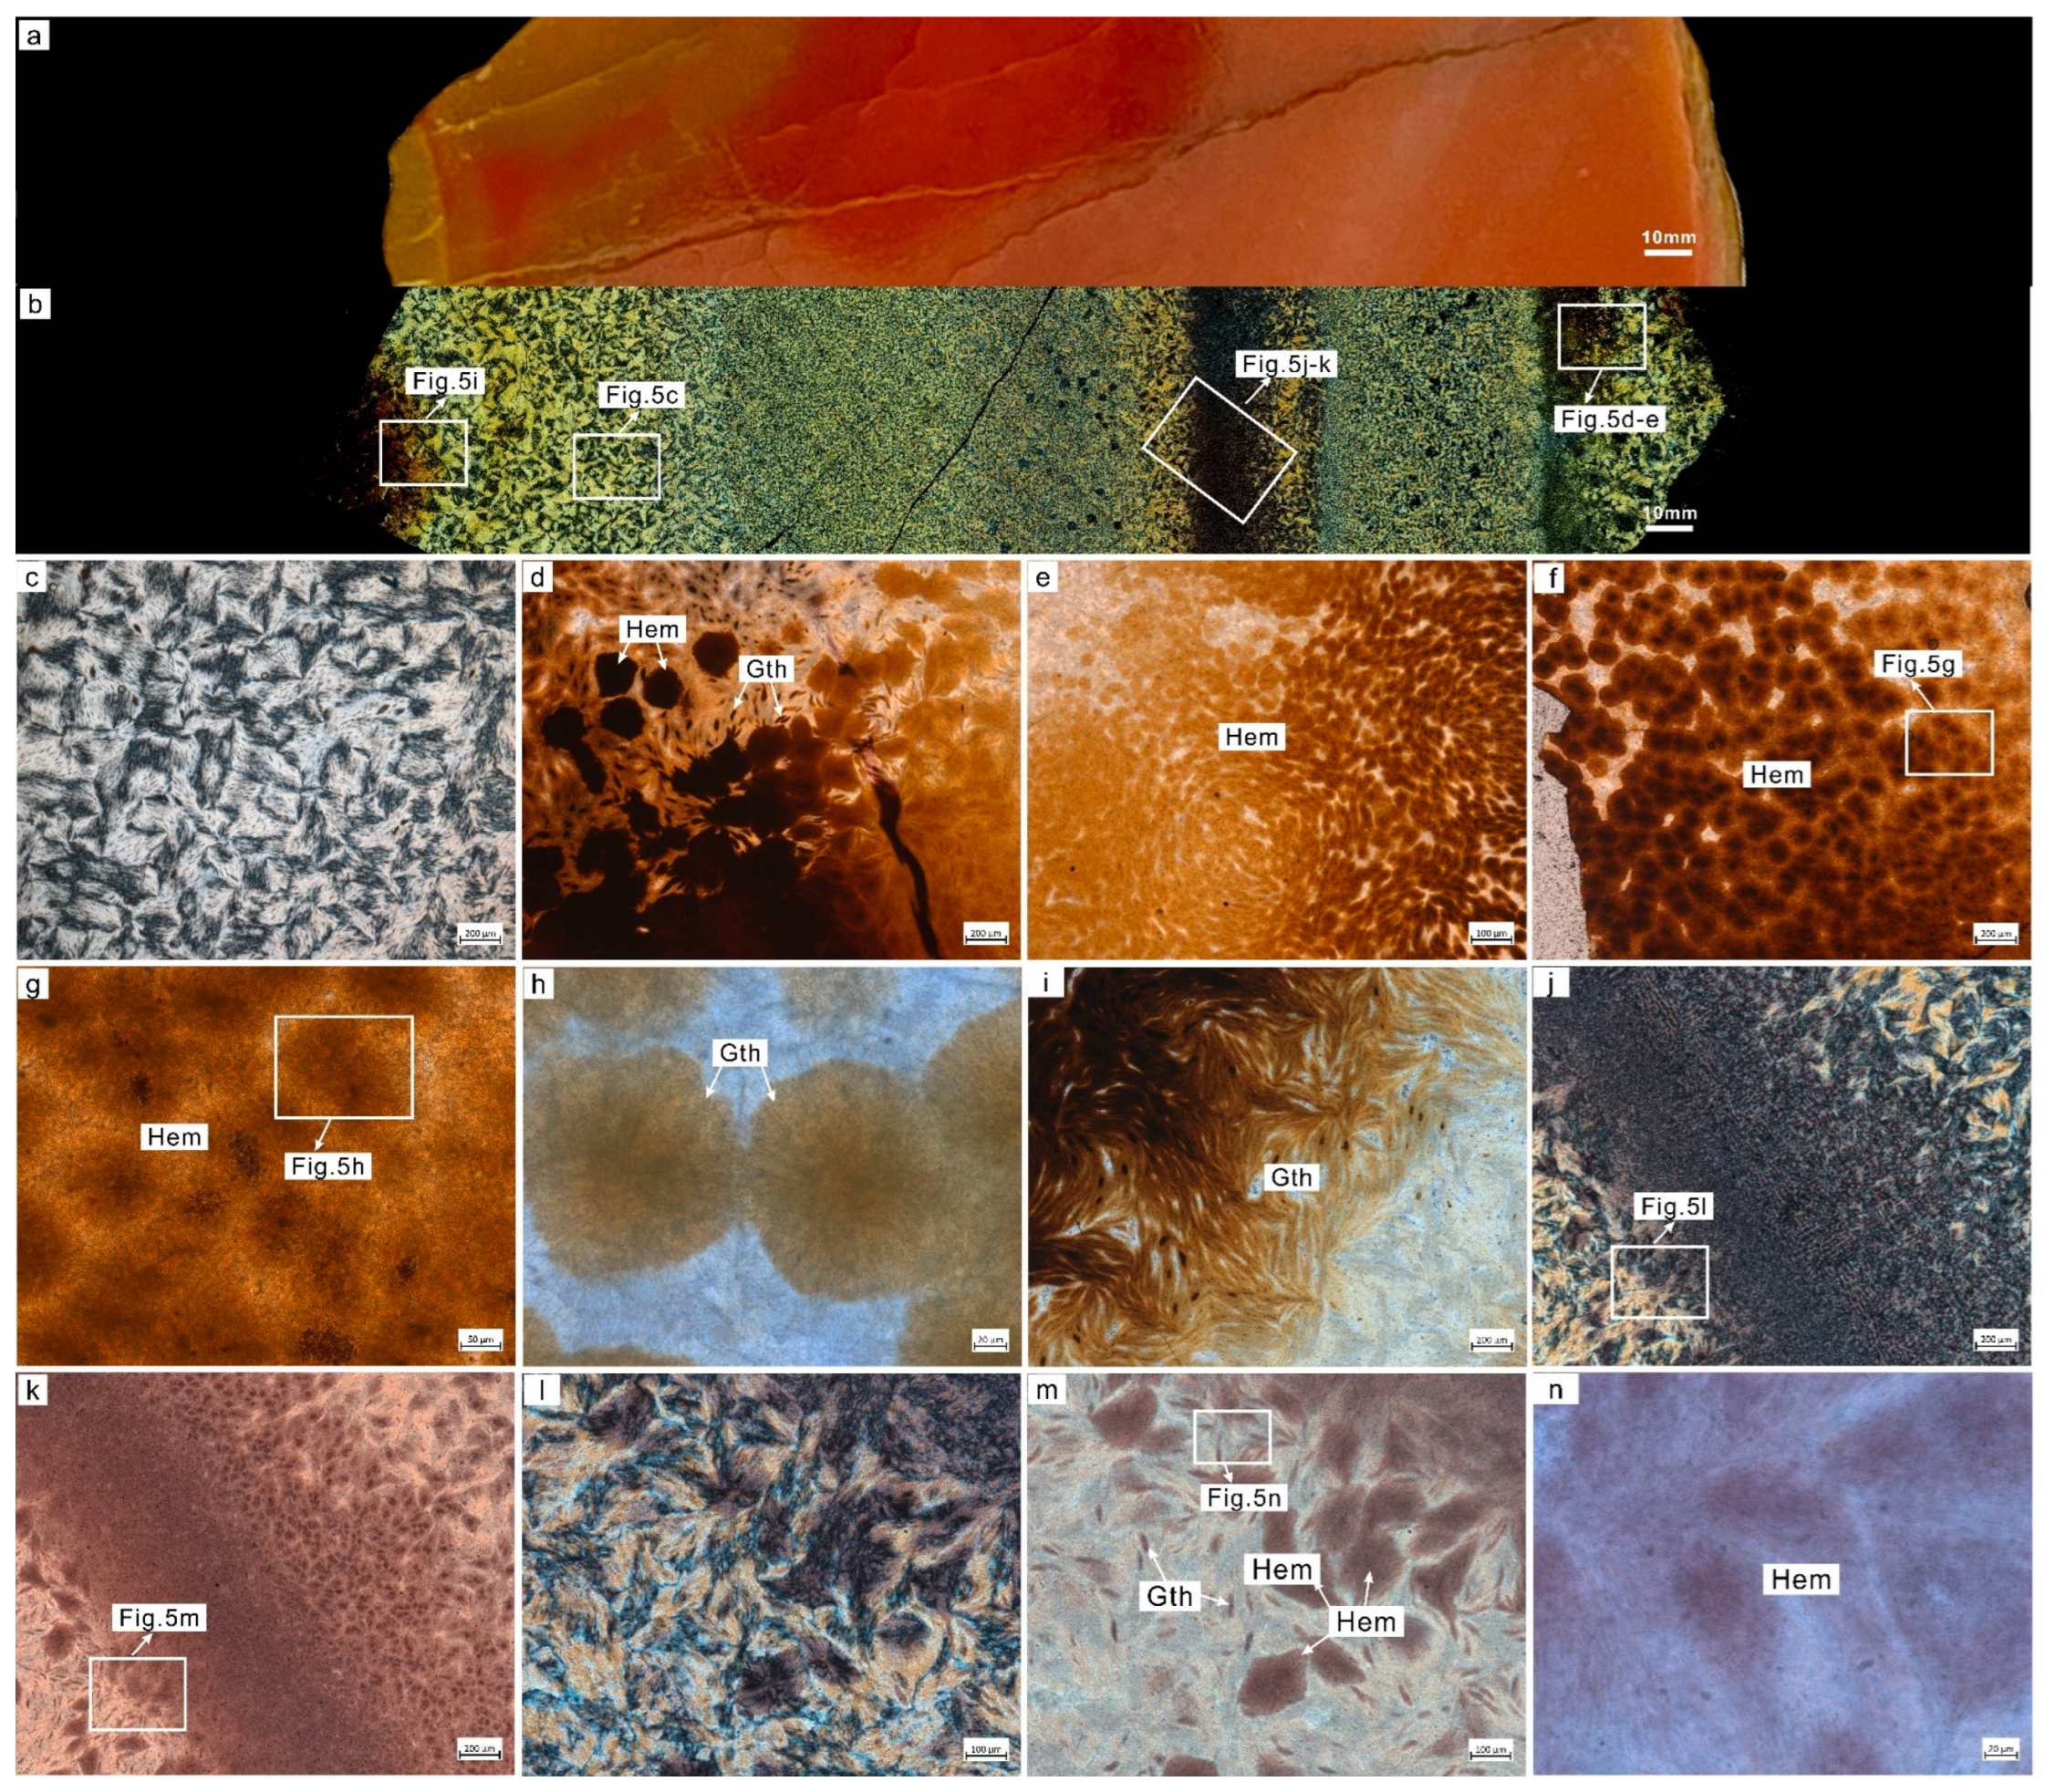
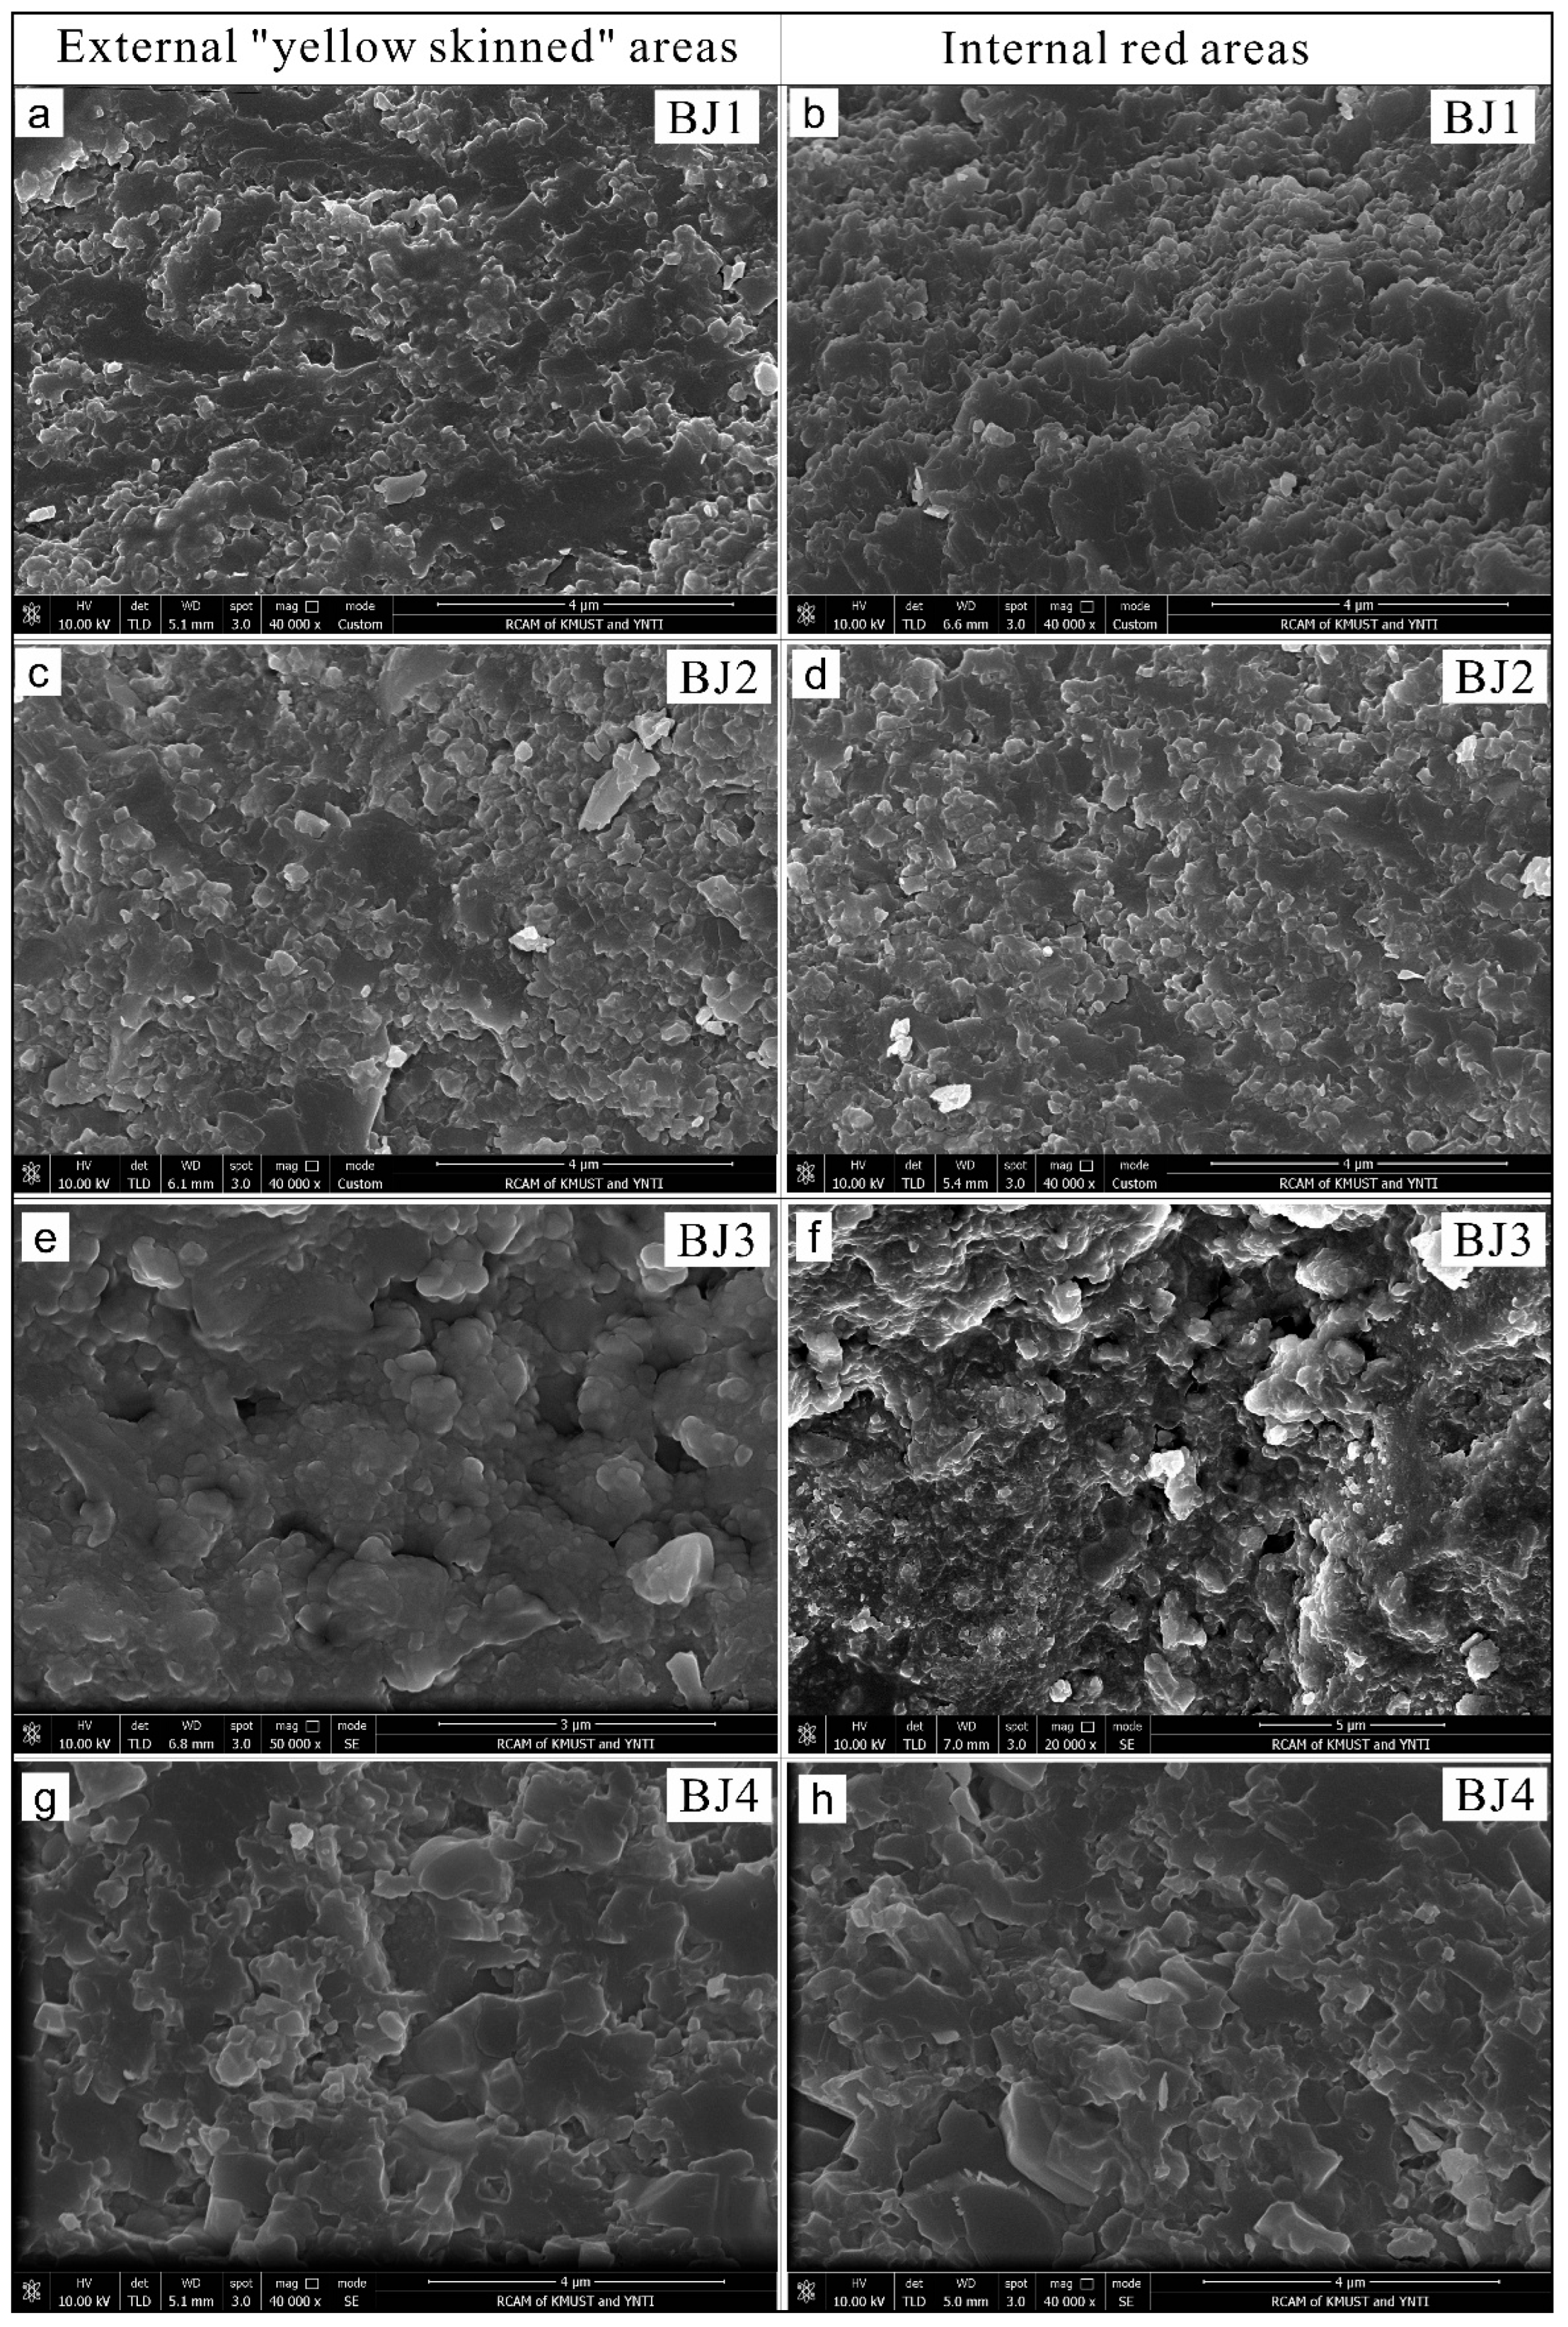
4.2. Microtextural Characteristics

The microtextural characteristics of the four samples were observed using both polarizing microscopy and scanning electron microscopy (SEM), with detailed descriptions provided below.
Sample BJ1 has a yellow outermost layer, approximately 4 mm thick, characteristic of the “yellow-skinned” variety unique to the northeastern part of Yunnan. The interior of the sample is red, with a clear boundary between the yellow and red bands, both of which exhibit cryptocrystalline structures (Figure 4a).
Under cross-polarized-light (CPL) microscopy, the banded structure of the agate is not discernible (Figure 4b,c). Both the yellow and red bands exhibit a microgranular texture (Figure 4d–f), defined as pseudo-granular silica based on previous studies [23]. The grain size gradually increases toward the center, and the crystalline morphology becomes more regular from the edge to the center. As the degree of crystallization varies, the interference color of these bands transitions from first-order gray to first-order gray–yellow.
Under single-polarized light, iron-rich inclusions are concentrated in the yellow outer layer. However, their distribution width is much smaller than that observed by the naked eye. Upon magnification, iron inclusions are distributed along the quartz aggregates, primarily forming spherical shapes and appearing nearly circular in the plane view (Figure 4g,h,j,k). In reflected light, hematite with a metallic luster can be observed in the high-magnification field of view (Figure 4i). The “yellow-skinned” part exhibits flake-like bright spots under BSE (Figure 4l), suggesting a higher iron content.
Sample BJ2, when observed with the naked eye, presents a yellow outer layer and a red interior, both exhibiting cryptocrystalline structures (Figure 5a). Under a polarized light microscope, the banded structure of the agate is markedly different. The micro mineral aggregates within the yellow layers predominantly appear in bundles (Figure 5b,c), with some exhibiting deformation. These aggregates display low interference colors, primarily first-order gray to gray–yellow. The inner red layers contrast significantly with the yellow layers, showing a microgranular structure with grain sizes increasing toward the center as well as enhanced crystallinity from the edge to the center. With changes in crystallinity, the interference color transitions from first-order gray to gray–yellow. Under single-polarized light, iron-rich inclusions in the yellow areas are distributed along the aggregates, appearing as brown–yellow, spherical (Figure 5d–h), and needle-like (Figure 5i) aggregates. In contrast to the yellow areas, the iron in the red layers predominantly forms irregular flakes (Figure 5j–n), with denser areas exhibiting darker colors.
Sample BJ3 exhibits three colors from the exterior to the interior: yellow (8 mm wide), reddish-brown (2.5 mm wide), and persimmon red. The interfaces between these color layers are distinct, and each band is composed of a cryptocrystalline structure (Figure 6a).
Under CPL microscopy, the banded structure of the agate is not prominent. The yellow, reddish-brown, and red layers exhibit microgranular structures without significant changes in the size or morphology of the crystalline grains, with the interference color being first-order gray (Figure 6b). Under single-polarized light, no obvious stratification is observed (Figure 6c). The outer “yellow-skinned” area contains goethite aggregates with diameters ranging from ~80 to 250 μm, appearing yellow. The inner red area displays hematite aggregates with diameters of 150–200 μm. Due to varying aggregation densities of the hematite spherules, the microscope reveals pleochroism, transitioning from dark gray to reddish-brown to black based on the density of the hematite spherule aggregation.
In the outer “yellow-skinned” area, intriguing and distinct forms of iron ion aggregates are observed. Overall, the iron ions are predominantly found in spherical shapes, with two types of aggregates identified in this sample (Figure 6d–i). The first type is hematite, which exists as numerous microspherical aggregates. These hematite microspheres, 1–2 μm in diameter, are densely arranged (Figure 6j,k). These microaggregates coalesce to form reddish-brown hematite “macro-spheres”, which are distinguished from the hematite microspheres, with a diameter ranging from 150 to 200 μm. These “macro-spheres” are visible to the naked eye in the highly transparent Nanhong agate, commonly referred to as “cinnabar spots”, and appear translucent red under reflected light (Figure 6l).
The other type is goethite, which displays distinct characteristics from hematite under the microscope. Under transmitted light (both cross-polarized and single-polarized), goethite exhibits significant pleochroism, varying in color from yellowish-brown to reddish-brown. In CPL, goethite forms radial aggregates alongside quartz (Figure 6m); in single-polarized light, it appears as uniform yellowish-brown “macro-spheres” (Figure 6n) without visible fine particles. Under reflected light, goethite shows high reflectivity and a yellowish-white color (Figure 6o), distinguishing it from the translucent red of hematite.
Sample BJ4 has an outermost yellow layer, approximately 1.5 cm at its widest point, with a clear boundary between the yellow and red layers (Figure 7a). Both layers exhibit cryptocrystalline structures. Under CPL microscopy, the banded structure of the agate is not prominent. Observations show that both the yellow and red layers are micrograin structures, some of which exhibit deformation, with the grain size gradually increasing toward the center and the crystal morphology becoming more regular from edge to center. The interference colors range from first-order gray to first-order gray–yellow (Figure 7b–f).
Under single-polarized light, iron-rich inclusions are concentrated in the yellow outer layer (Figure 7g,h). Contrary to the width perceived by the naked eye, their distribution width is significantly smaller. Upon magnified observation, the iron-rich inclusions are distributed along quartz aggregates, predominantly forming spherical shapes with near-circular and hexagonal planar appearances (Figure 7j,k). Under reflected light, metallic luster hematite is visible in high-magnification views (Figure 7i). In the “yellow-skinned” area, BSE imaging reveals lamellar bright spots (Figure 7l).
Furthermore, under scanning electron microscopy, the differences in color bands among the four samples are revealed to be minimal (Figure 8). Parts of different colors display relatively homogeneous and similar structures. They are primarily composed of granular or near-granular SiO2 aggregate, with most particles resembling “silica spheres”, and individual grain sizes ranging from ~0.5 to 1 μm. At a magnification of 40,000×, certain silica aggregates display a flaky morphology, characterized by a tightly oriented arrangement and unidirectional extension, with individual extensions typically measuring less than 1 micron in size. Pores or voids, which are evenly distributed and exhibit relatively high porosity, can be observed between particles or aggregates. In the “yellow-skinned” area, iron and aluminum substances are dispersed within the SiO2 matrix. Owing to their low concentrations, EDS was unable to detect their quantities.

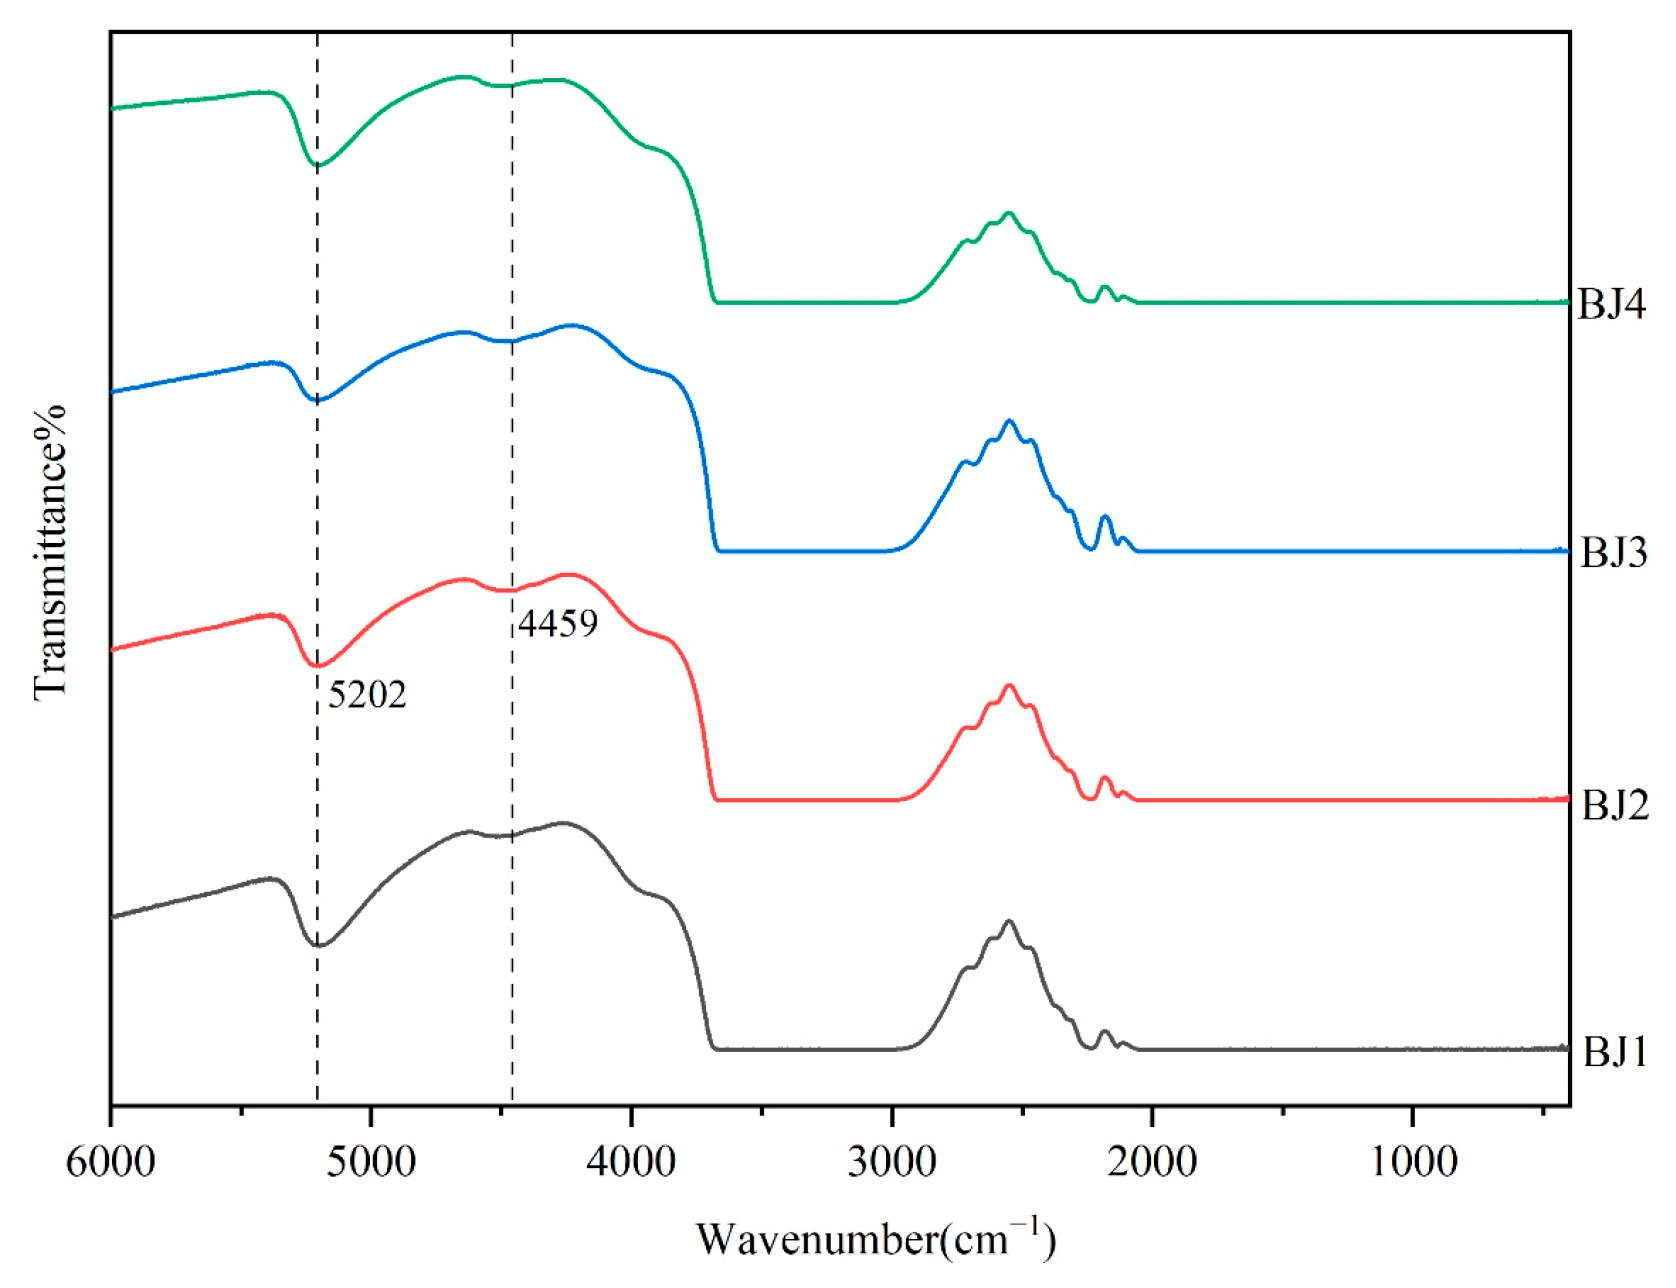
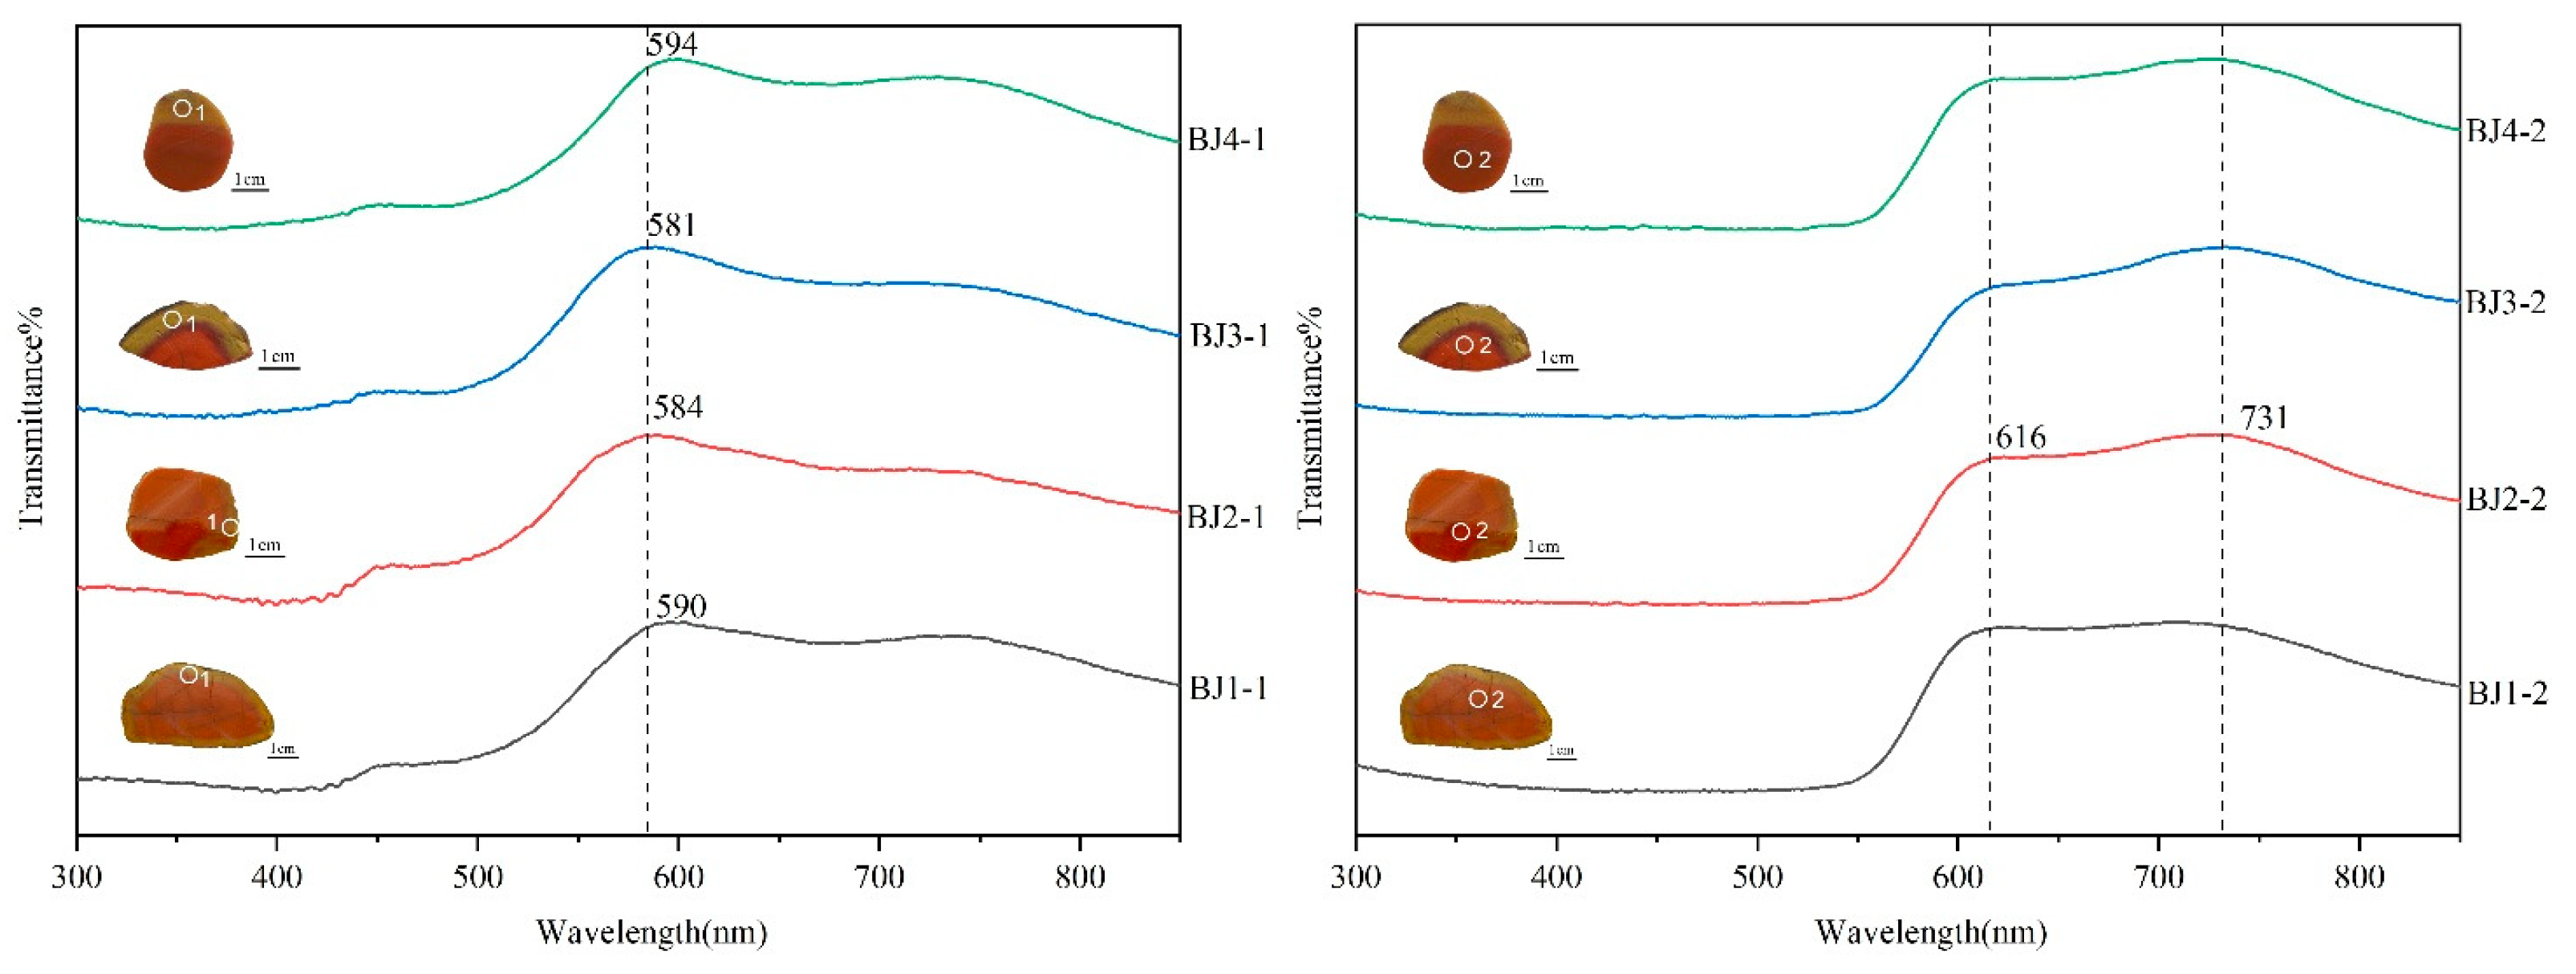
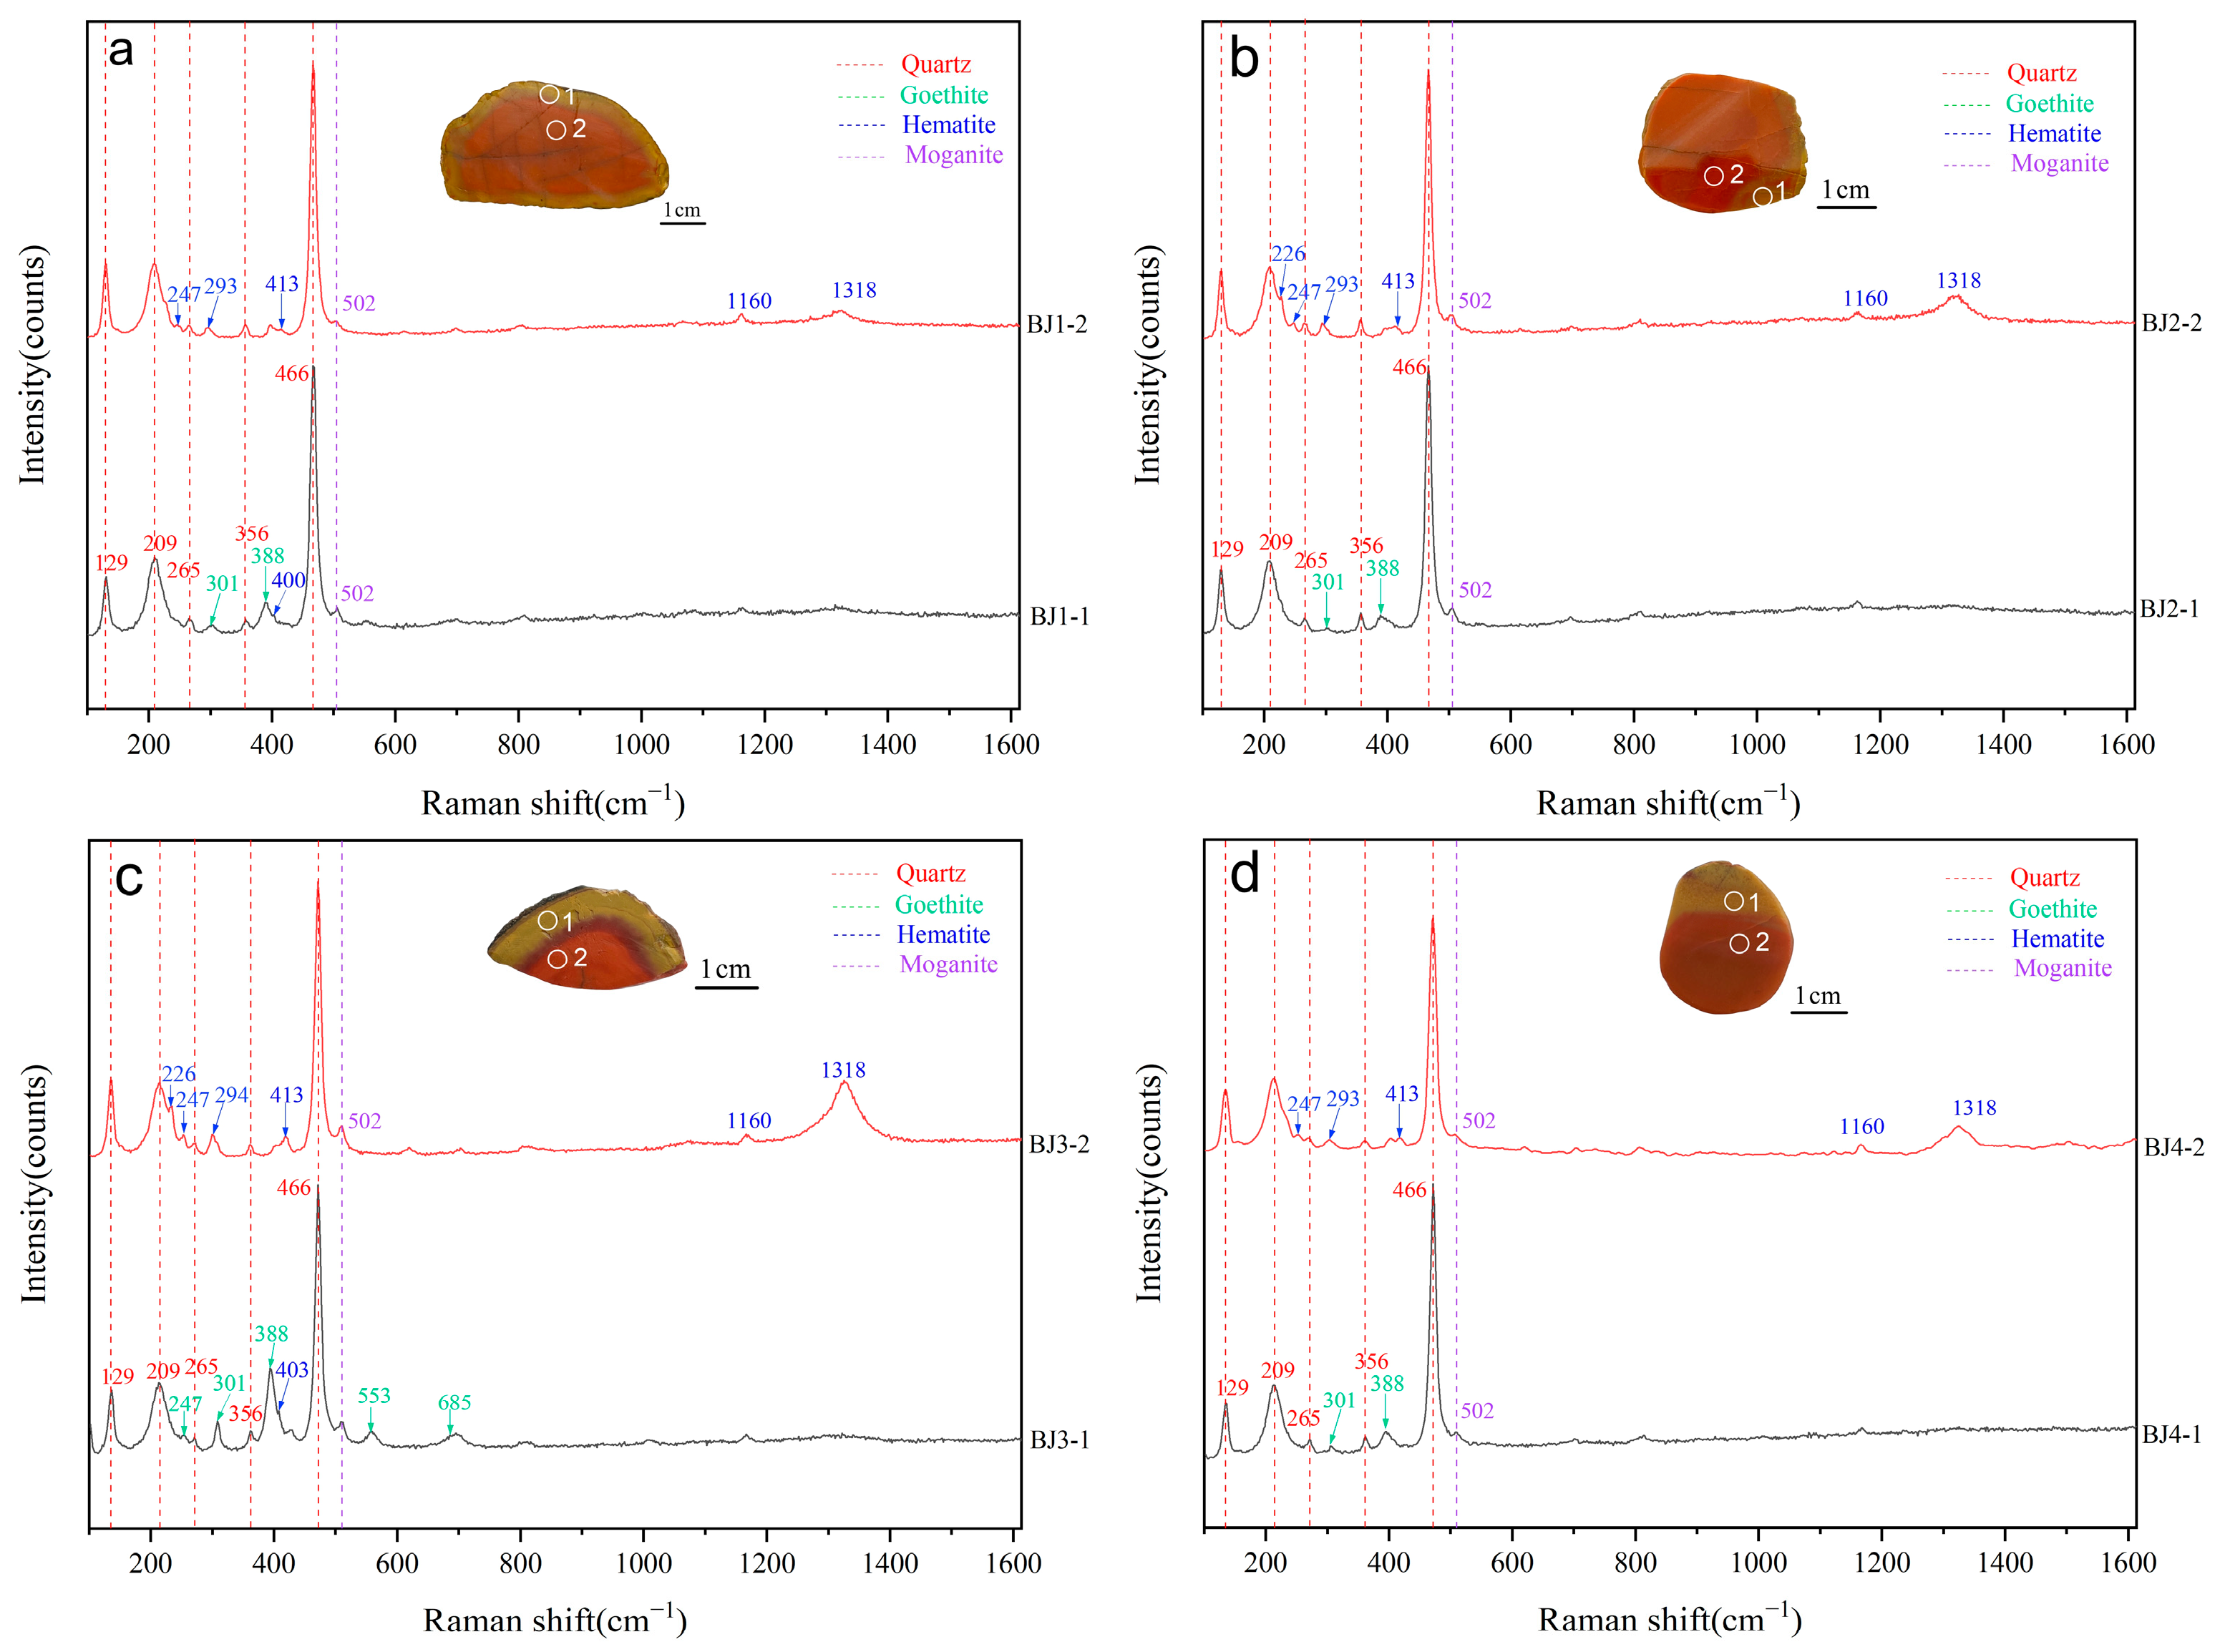
4.3. Spectral Characteristics

1. Infrared absorption spectra
Numerous researchers have utilized diffuse reflectance infrared absorption spectroscopy to investigate the material composition of agate, and their findings generally converge on the conclusion that agate is predominantly composed of α-quartz, with characteristic reflection peaks at 1181, 1109, 796, 779, 692, 534, and 475 cm−1 [1,2,3,4,5,6]. To further investigate the “yellow-skinned” Nanhong agate, diffuse reflectance infrared absorption spectra were tested on the “yellow-skinned” and red parts of the four samples. The infrared diffuse reflection spectrum exhibited a strong reflection band in the range of 1200–900 cm−1, with peaks at 1180 and 1110 cm−1, corresponding to Si–O asymmetric stretching vibrations. The characteristic absorption peak between 800 and 600 cm−1, a characteristic band of α-quartz, with peaks near 800, 780 and 690 cm−1, is attributed to Si–O–Si symmetric stretching vibrations. The peak located between 600 cm−1 and the reflection peak in the 300 cm−1 intervals, with peaks at 540 and 486 cm−1, corresponds to Si–O bending vibrations, representing the second strongest absorption peak in the absorption spectrum [21,50]. The infrared reflection patterns of the four samples are consistent with those of α-quartz (Figure 9), in keeping with previous studies [1], confirming that their component mineral is α-quartz.
Random infrared transmission tests were conducted on four samples. The results of the experiment show that all samples exhibited infrared transmission spectrum characteristics between cryptocrystalline and apparent crystalline materials (Figure 10). According to the characteristics of the spectrum, two absorption peaks appeared in the near-infrared area at 5202 and 4459 cm−1, which are similar to those of opal (opal, amorphous). There was also a hydration frequency and/or doubling frequency band, along with a distinct transmission band in the mid-infrared area. These infrared transmission spectra indicate that the “yellow-skinned” Nanhong agate, like other types of Nanhong agate [1], represents transitional forms between cryptocrystalline and macrocrystalline quartz aggregates.
2. UV–Vis absorption spectra
The color of gemstones is closely related to their absorption of visible light, resulting from the selective absorption of visible wavelengths by the materials. Ultraviolet-visible absorption spectroscopy is an important analytical method in the study of gemstone color.
The results of the UV–Vis spectroscopy analysis indicate that different colored parts correspond to distinct characteristic peaks. The first test point of samples BJ1–BJ4 corresponds to the visibly “yellow-skinned” part, while the second point corresponds to the inner red part. As shown in Figure 11, the UV–Vis absorption spectra of different parts of the four samples exhibit distinct features. The first test point of each sample exhibits a significant characteristic peak in the yellow light range (581–594 nm), with an intensity greater than that in the red-light range, giving an overall yellow appearance. The second test point of each sample shows a broad reflection band in the yellow–red light range (550–780 nm), representing an overlapping peak of yellow and red. The intensity of the red absorption peak is higher than that of the yellow absorption peak, resulting in an overall red hue. Based on the wavelength and intensity of the absorption peaks, the color of Nanhong agate can be qualitatively analyzed.
3. Raman spectra
Many scholars have employed Raman spectroscopy to investigate the material composition of agate, and their conclusions are consistent with those obtained from infrared spectroscopy. Agate is primarily composed of α-quartz, with the most intense Raman characteristic peak at approximately 465 cm−1, corresponding to the symmetric stretching vibration mode of Si-O-Si, which is the most prominent and strongest Raman peak of quartz. The secondary characteristic peaks at approximately 128 cm−1 and 206 cm−1 are associated with collective lattice vibrations (such as bending or translational modes). The peaks around 355 cm−1 and 403 cm−1 may arise from asymmetric Si-O-Si bending vibrations or other lattice vibration modes. Additionally, the peak near 1160 cm−1 (weak peak) may be related to the higher-order mode of Si-O stretching vibrations, exhibiting lower intensity. Agate also contains a certain amount of moganite, which has a Raman characteristic peak at approximately 502 cm−1 [18,51].
Raman spectroscopy was performed on the external “yellow-skinned” areas and the internal red areas of four samples, with 3–5 test points selected per sample based on visible color differences. Representative points were selected to generate a comparative Raman spectrum (Figure 12). For samples BJ1–BJ4, the first test point corresponds to the “yellow-skinned” area and the second point corresponds to the internal red area.
All eight test points exhibited Raman characteristic peaks of α-quartz at 129, 209, 265, 356, 466, and 1160 cm−1, with the peak at 466 cm−1 being essential for identifying the presence of α-quartz in agate. Additionally, a weaker characteristic peak of moganite was observed at 502 cm−1, attributed to the symmetrical bending vibration of Si–O in moganite [52]. These findings are consistent with the results of previous research [23,28,51,53], indicating that Nanhong agate primarily comprises α-quartz, along with a certain amount of moganite.
Raman spectra revealed distinct mineral compositions for the “yellow-skinned” and internal red areas. The “yellow-skinned” area exhibited goethite Raman characteristic peaks at 301 and 388 cm−1 across four test points. The more intensely yellow BJ3-1 point also displayed continuous goethite peaks at 247, 301, 388, 553, and 685 cm−1. By contrast, the internal red part showed hematite characteristic peaks at 226, 247, 293, 413, and 1318 cm−1. Therefore, the “yellow-skinned” area is inferred to be colored by goethite, while the internal red coloration is attributed to hematite [54,55,56].
4. μ-XRD analysis
Based on the abovementioned experiments, different phases of SiO2 and Fe are found to be present in the samples. We used μ-XRD to verify, distinguish, and quantify these phases. For each sample, test point 1 corresponds to the “yellow-skinned” part and point 2 corresponds to the internal red part. A total of eight spectra were collected and refined. According to the XRD refined spectra, characteristic diffraction peaks of four minerals were identified: α-quartz, moganite, hematite, and goethite. These results are consistent with the Raman spectroscopy results. Among these, the diffraction peak of α-quartz was the strongest, being narrow and sharp, indicating good crystallinity (Figure 13). The Rietveld refinement results (Table 1) show that the α-quartz content ranges from 95.6% to 99.9%, and the moganite content ranges from 0% to 4.3%, with no significant pattern in the variation of moganite content between points 1 and 2 of each sample. The goethite content ranges from 0.0% to 1.7%, with point 1 containing a higher goethite content than point 2 in all samples except BJ1. The hematite content is less than 0.1% in this test, likely due to its low content in the samples.

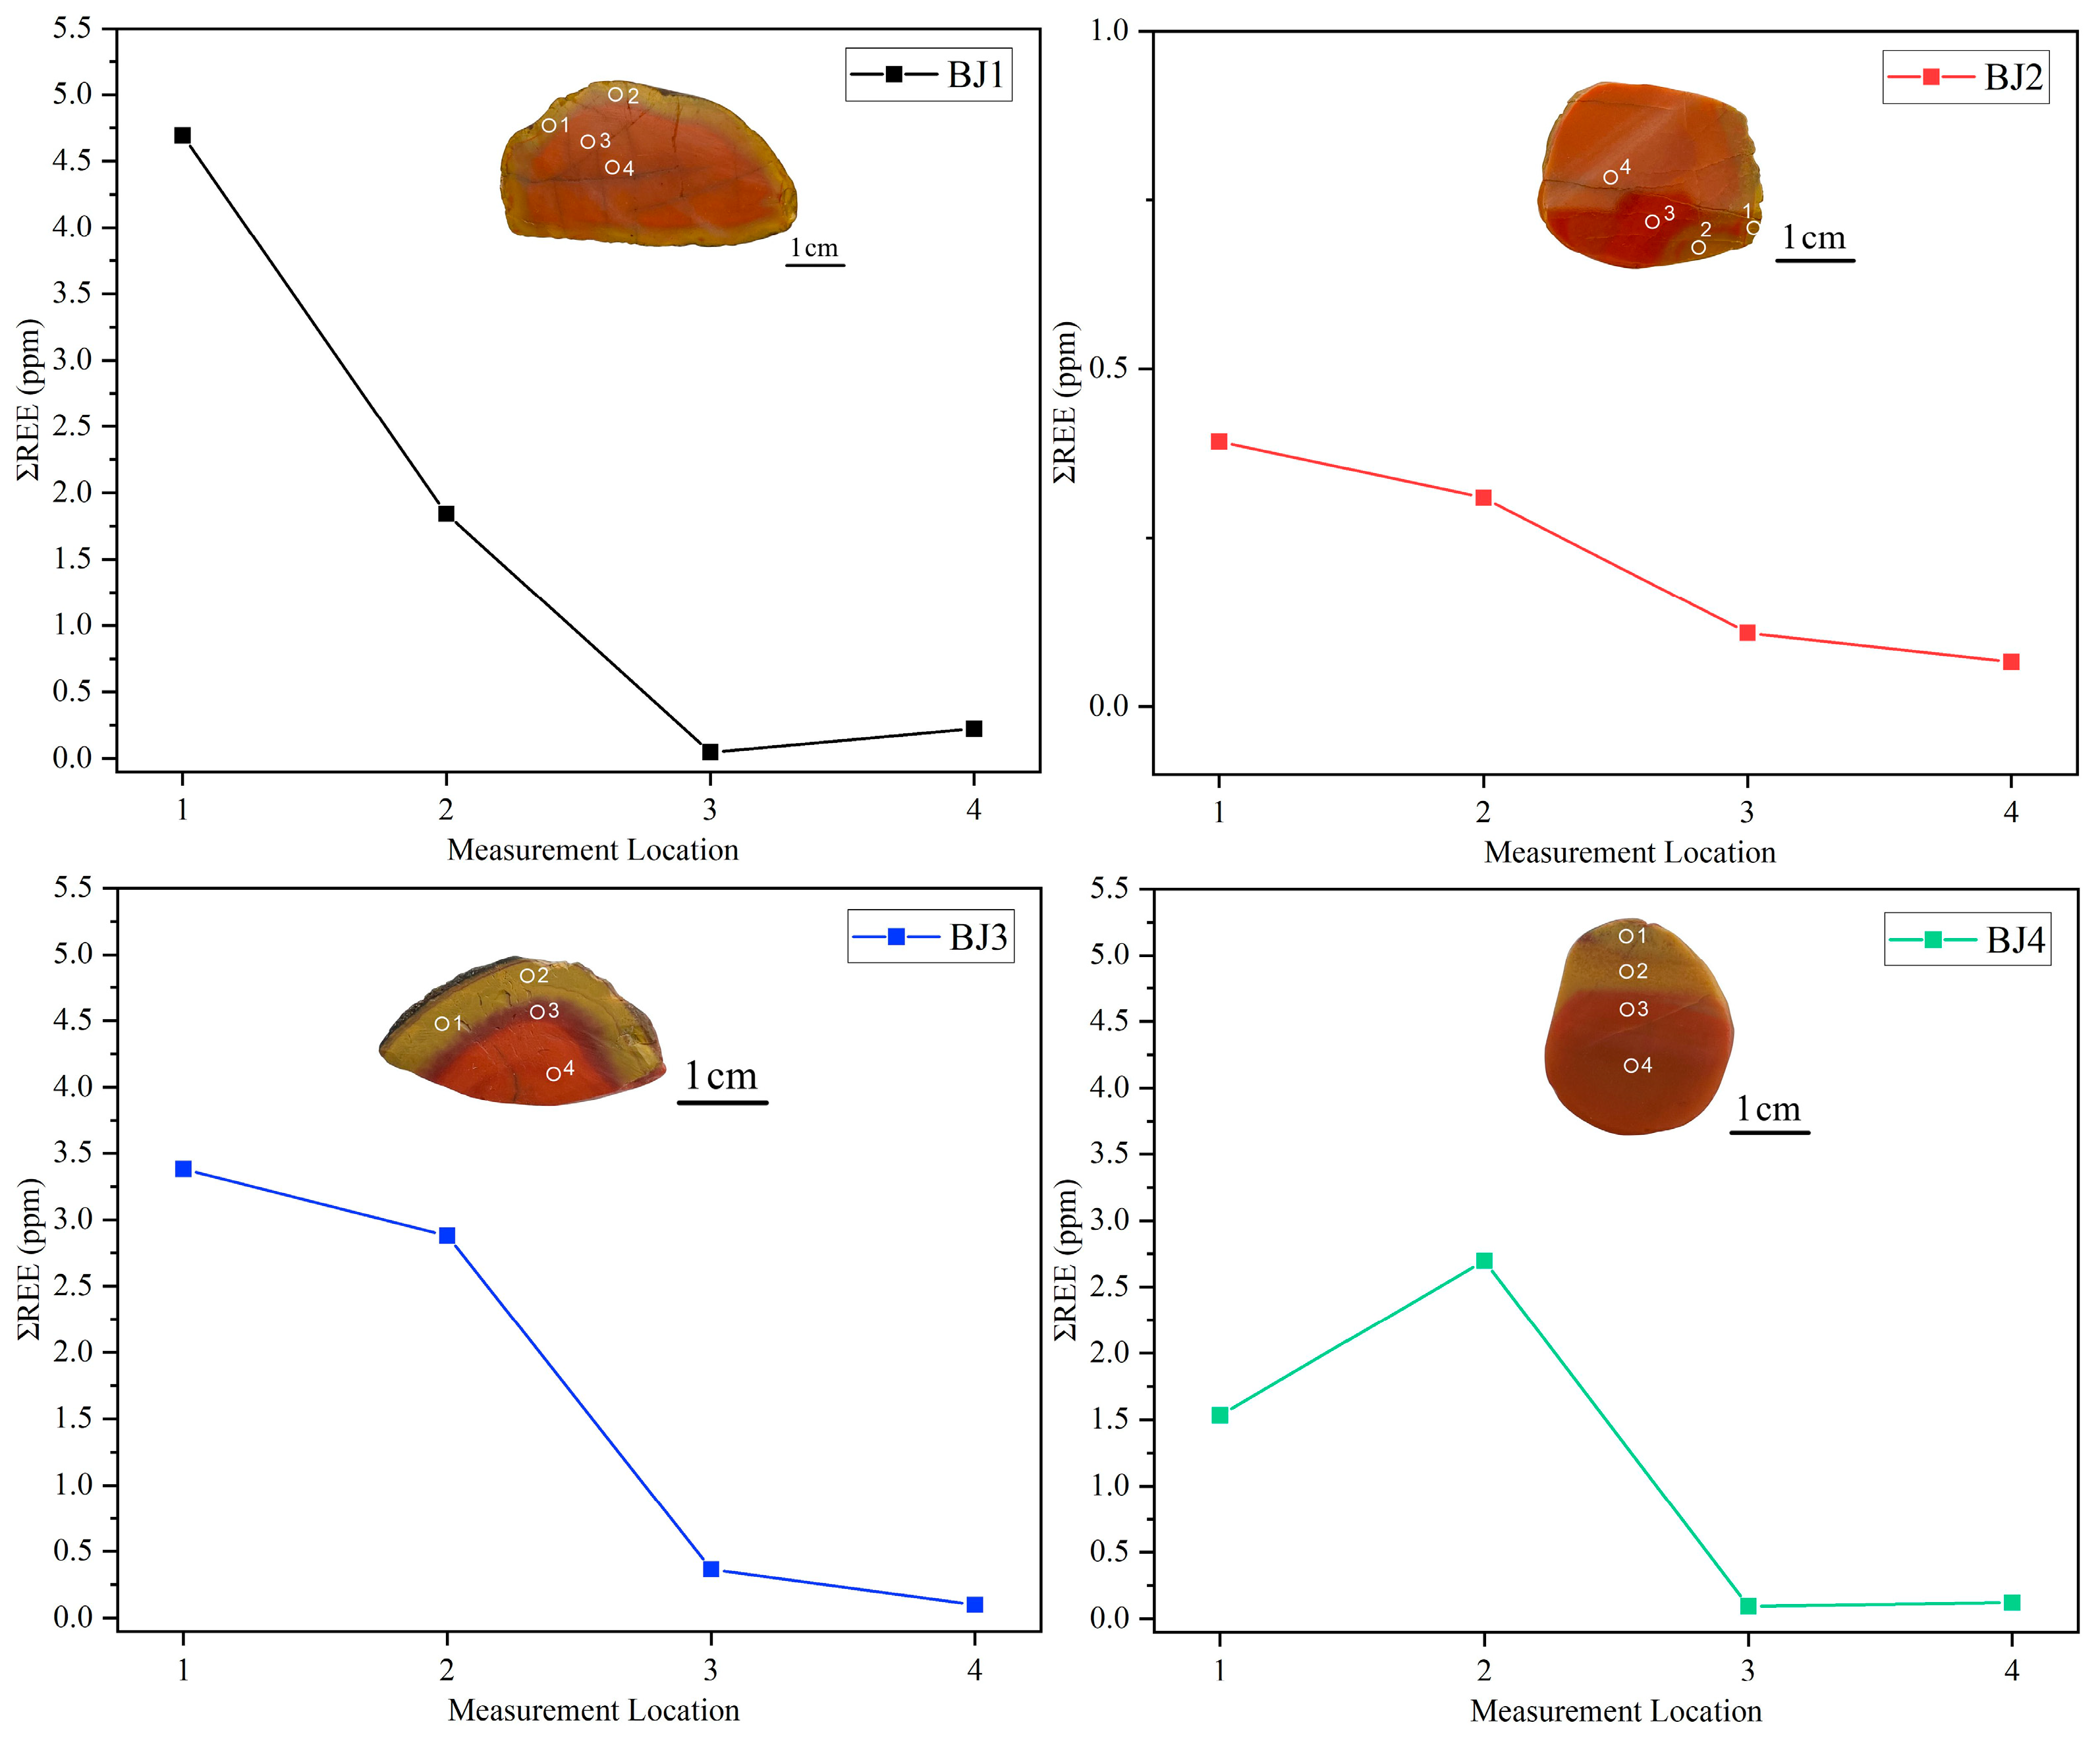
4.4. Geochemical Characteristics

The in situ microarea analyses of major and trace elements for the four samples were conducted utilizing electron probe and LA–ICP–MS techniques. For each sample, the locations of the major element test points were consistent: points 1 and 2 were located in the “yellow-skinned” area, while points 3 and 4 were situated in the internal red area (Figure 14). The results for major elements are detailed in Table 2.
The results of the EPMA analysis indicate that the Nanhong agate from northeastern Yunnan is primarily composed of SiO2, with SiO2 content ranging from 92.6 wt.% (BJ4-1) to 99.46 wt.% (BJ2–4) across the four samples. Test points 1 and 2, which correspond to the visually yellow areas, exhibit higher concentrations of Fe, Al, and Ca compared to the visually red areas at points 3 and 4. Notably, the Fe content is significantly higher in the yellow areas and demonstrates a gradual decrease from the outer surface to the interior of the samples.
The LA–ICP–MS analysis indicates that the trace element content of the samples generally decreases from the exterior to the interior (Figure 15, Table S1). Elements with relatively higher concentrations include Fe, P, Al, Ca, Na, and K, suggesting that these elements penetrate agate with relative ease. Notably, Fe exhibits significant fluctuations, with higher concentrations observed in the yellow outer layer compared to the red interior. Immobile elements such as Zr, Nb, Ti, Hf, Ta, and Th are present in very low amounts due to their high charge and small ionic radii, which render them incompatible with the mineral lattice. In high SiO2 content minerals like chalcedony, these high-field-strength elements struggle to integrate into the lattice, whereas quartz structures can accommodate ions with low charge and larger radii, such as Al (106.231–1511.099 ppm) and alkali metals. Phosphorus is relatively abundant (391.484–762.041 ppm) and exhibits distinct chemical behavior, primarily existing as phosphate (PO43−). During agate formation, phosphate ions can easily infiltrate the gaps in the quartz microcrystal lattice or accumulate along grain boundaries.

5. Discussion

5.1. Analysis of the Coloring Mechanism and Influencing Factors of the “Yellow-Skinned” Nanhong Agate

The Raman spectrum results show that only the Raman characteristic peaks of goethite are present in the outer “yellow-skinned” part and only the Raman characteristic peaks of hematite are found in the red part. Our microscopic observations reveal that the aggregation behavior of iron ions in the yellow-skinned area is completely different from that in the red area. The yellow area predominantly consists of spherical aggregates, whereas the distribution of iron ions in the red area is relatively uniform compared to the yellow area, with no considerable spherical enrichment observed. μ-XRD refinement and EPMA results indicate that the Fe content in the outer “yellow-skinned” part is considerably higher than that in the red part, with Fe content gradually decreasing from the outer skin to the interior.
Therefore, it is inferred that the “yellow-skinned” color is due to goethite, while the red color inside is caused by hematite.

5.2. Crystallization Sequence

In orthogonal polarized light microscopy, “yellow-skinned” Nanhong agate exhibits “pseudo-granular silica”, differing from the normal crystallization sequences of most other agates: pseudo-granular silica → fibrous chalcedony → crystalline quartz (Type I) [57] and pseudo-granular silica → crystalline quartz (Type II) [23]. The crystallization of “yellow-skinned” Nanhong agate remains in the first stage, which Jens Götze (2016) [10] referred to as “precursors of typical agate structures”, meaning that the entire sample consists of pseudo-granular silica. Therefore, we refer to this newly discovered silica structural evolution sequence as Type III. The characteristics of this type include irregular granular morphology under the microscope, typically showing twisted extinction under CPL, indicating random internal crystal orientation without a strict geometric arrangement and no zoning within the sample.
The “pseudo-granular silica” (Type III) structure is the foundational structure for the formation of the “yellow-skinned” type.

5.3. Characteristics of Occurrence and Formation of “Yellow-Skinned” Nanhong Agate

Field surveys indicate that primary Nanhong agate in northeastern Yunnan primarily exists as amygdaloidal bodies within the Permian Emeishan Basalt Formation, specifically in the fourth subperiod (Pβ24−1) and the second subperiod (Pβ24−2). Their shape and size are influenced by the vesicles in the basalt. The “yellow-skinned” Nanhong agate studied here mainly occurs as breccia within the red–brown sandy mudstone of the Lower Triassic Feixianguan Formation (T1f).
Based on geological profiles and partial geological context, the formation of the “yellow-skinned” Nanhong agate is inferred to occur in two stages. First, hydrothermal fluids filled the vesicles in the Permian Emeishan Basalt Formation, resulting in the formation of primary Nanhong agate. Second, through subsequent weathering, erosion, transport, and deposition, the primary Nanhong agate accumulated in the red–brown sandy mudstone of the Lower Triassic Feixianguan Formation (T1f).
The formation of the “yellow-skinned” variety requires that the primary agate structure consists of pseudo-granular silica. Previous oxygen isotope analyses indicate that the formation temperature of pseudo-granular silica ranges from 130 to 170 °C, which is often lower than that of fibrous chalcedony and crystalline quartz [23]. Given the absence of distinct banding in the sample, it is inferred to have formed from a single hydrothermal filling event. Iron ions can easily penetrate the pseudo-granular silica and exist as hematite inclusions, which is why the outer layer of most Nanhong agate appears red, gradually fading inward until the internal quartz is colorless and transparent. This phenomenon is closely related to the internal structure formed by its normal crystallization sequence. Because the entire structure of the “yellow-skinned” Nanhong agate consists of pseudo-granular silica, iron ions can readily enter, resulting in its bright and rich color.
When this type of Nanhong agate (with crystallization sequence Type III) undergoes weathering, erosion, transport, and deposition in the Lower Triassic Feixianguan Formation (T1f), the unique geological conditions—specifically, being in a closed, water-rich, reducing environment—cause the outer hematite, within a certain thickness, to undergo hydration and convert to goethite [58,59]. This process results in the current yellow skin with clear boundaries between the yellow and red, due to the relatively stable sedimentary environment.

5.4. Age of the Nanhong Agate

Based on existing studies, it can be inferred that the Nanhong agate found in the vesicles of the first subperiod (Pβ24−1) and second subperiod (Pβ24−2) of the Permian Emeishan Basalt Formation is primary, while the Nanhong agate located in the overlying red–brown sandy mudstone of the Lower Triassic Feixianguan Formation (T1f) is secondary. Previous research indicates that the main eruptive phase of the ELIP occurred around 260 Ma [44,45], with the eruption lasting for at least six million years [60]. Furthermore, studies of the Emeishan Basalt in the Zhaotong area of northeastern Yunnan suggest an eruption age of 261.6 ± 0.6 Ma [61]. Therefore, by utilizing stratigraphy to constrain the formation age of the agate, it is estimated that the “yellow-skinned” Nanhong agate studied herein formed approximately 261.6 Ma.

6. Conclusions

This study investigates the gemological, spectroscopic, microstructural, and geochemical characteristics of “yellow-skinned” Nanhong agate from northeastern Yunnan. Infrared spectroscopy, Raman spectroscopy, and μ-XRD reveal that this type of agate is primarily composed of α-quartz, with secondary components including moganite, goethite, and hematite. The yellow coloration on the exterior is attributed to goethite, while the red interior is due to hematite. Our EPMA results indicate that the primary component is SiO2, followed by Fe, with the yellow sections exhibiting significantly higher Fe content than the red sections, and a gradient of decreasing Fe concentration from the surface inward. The microstructural analysis suggests that the “yellow-skinned” Nanhong agate has a pseudo-granular silica structure (Type III), which facilitates the incorporation of iron and lays the structural foundation for the later formation of the “yellow-skinned” appearance. The study identifies the occurrence of Nanhong agate in northeastern Yunnan and proposes a two-stage formation process: initially, hydrothermal fluids filled the vesicles in the Permian Emeishan Basalt Formation (P2β), resulting in the formation of primary Nanhong agate. Subsequently, the Type III primary agate underwent weathering, erosion, transport, and deposition in the red–brown sandy mudstone of the Lower Triassic Feixianguan Formation (T1f). This sedimentary environment facilitated the conversion of hematite to goethite, leading to the distinct “yellow-skinned” appearance with clear boundaries. Based on the occurrence and stratigraphic relationships, the formation age of the “yellow-skinned” Nanhong agate is estimated to be approximately 261.6 Ma. This work establishes a foundation for the identification and further study of this type of Nanhong agate.

Supplementary Materials

The following supporting information can be downloaded at: https://www.mdpi.com/article/10.3390/cryst15050488/s1, Table S1: LA-ICPMS Trace Element Data of Samples BJ1–BJ4 (ppm).

Author Contributions

Conceptualization, Q.S., D.Z. and W.L.; data curation, Q.S. and W.P.; formal analysis, Q.S. and D.Z.; investigation, L.C. and W.P.; methodology, Q.S., S.Z. and W.L.; project administration, Q.S.; resources, Q.S.; software, Q.S. and X.C.; validation, Q.S., R.Z., S.Z. and W.L.; visualization, Q.S.; writing—original draft, Q.S.; writing—review and editing, Q.S. All authors have read and agreed to the published version of the manuscript.

Funding

This research was funded by the Key International Cooperation Project of the National Natural Science Foundation of China, “Evolutionary History and Key Drivers of Cenozoic Plant Diversity in Yunnan” (No. 42320104005), and the Yunnan Provincial Geological Survey Fund, “Metallogenic Regularity and Deep Peripheral Prospecting Prediction of Tin-Silver-Lead-Zinc-Tungsten Polymetallic Deposits in the Western Depression Zone of Bozhushan Granite, Southeastern Yunnan” (4530000HT2024006680401).

Data Availability Statement

All data are contained within the article and Supplementary Materials.

Acknowledgments

I wish to express my gratitude to all those who supported me during the course of this research. I would specially like to thank my team members for their assistance with field investigation and sampling in northeastern Yunnan. I also thank Jun Zhu from Kunming University of Science and Technology for his valuable suggestions about this manuscript. My classmate Zhen Jia offered substantial guidance and opinions during the experiment and manuscript writing processes. Lastly, I would like to thank all reviewers and editors for their constructive and beneficial comments, which have considerably improved the quality of the manuscript.

Conflicts of Interest

Qiuyun Song and Wenlian Liu were employed by the Kunming Prospecting Design Institute of China Nonferrous Metals Industry Co., Ltd. Wenzhou Pu was employed by the China ENFI Engineering Technology Co., Ltd. The remaining authors declare that the research was conducted in the absence of any commercial or financial relationships that could be construed as a potential conflict of interest.

References

  1. Song, Q.Y.; Chen, L.R.X.; Zuo, R.H.; Chen, X.C.; Sui, S.G.; Pu, W.Z.; Yang, X.Q.; Zhang, S.T.; Liu, W.L. Origin of Color and Spectral Characteristics of Nanhong Agate from Northeast Yunnan, China. Crystals 2024, 14, 388. [Google Scholar] [CrossRef]
  2. Basibueyuek, Z.; Guerbuez, M.; Akbudak, I.K. Surprise Eggs, the Miracle of Nature: Almus Agates (Tokat-Turk?Ye). Gospod. Surowcami Miner.-Miner. Resour. Manag. 2023, 39, 5–22. [Google Scholar]
  3. Dumanska-Slowik, M.; Powolny, T.; Sikorska-Jaworowska, M.; Gawel, A.; Kogut, L.; Polonski, K. Characteristics and origin of agates from Ploczki Gorne (Lower Silesia, Poland): A combined microscopic, micro-Raman, and cathodoluminescence study. Spectrochim. Acta Part A-Mol. Biomol. Spectrosc. 2018, 192, 6–15. [Google Scholar] [CrossRef]
  4. Natkaniec-Nowak, L.; Dumanska-Slowik, M.; Prsek, J.; Lankosz, M.; Wróbel, P.; Gawel, A.; Kowalczyk, J.; Kocemba, J. Agates from Kerrouchen (The Atlas Mountains, Morocco): Textural Types and Their Gemmological Characteristics. Minerals 2016, 6, 77. [Google Scholar] [CrossRef]
  5. Svetova, E.N.; Palyanova, G.A.; Borovikov, A.A.; Posokhov, V.F.; Moroz, T.N. Mineralogy of Agates with Amethyst from the Tevinskoye Deposit (Northern Kamchatka, Russia). Minerals 2023, 13, 1051. [Google Scholar] [CrossRef]
  6. Svetova, E.N.; Svetov, S.A. Agates from Mesoproterozoic Volcanics (Pasha-Ladoga Basin, NW Russia): Characteristics and Proposed Origin. Minerals 2023, 13, 62. [Google Scholar] [CrossRef]
  7. Miladinovic, Z.; Simic, V.; Nikolic, N.; Orsini, N.J.; Rosic, M. Agates of the Lece Volcanic Complex (Serbia): Mineralogical and Geochemical Characteristics. Minerals 2024, 14, 511. [Google Scholar] [CrossRef]
  8. Mrozik, M.; Götze, J.; Pan, Y.M.; Möckel, R. Mineralogy, Geochemistry, and Genesis of Agates from Chihuahua, Northern Mexico. Minerals 2023, 13, 687. [Google Scholar] [CrossRef]
  9. Götze, J.; Möckel, R.; Pan, Y.M.; Müller, A. Geochemistry and formation of agate-bearing lithophysae in Lower Permian volcanics of the NW-Saxonian Basin (Germany). Mineral. Petrol. 2023, 118, 23–40. [Google Scholar] [CrossRef]
  10. Götze, J.; Möckel, R.; Vennemann, T.; Müller, A. Origin and geochemistry of agates in Permian volcanic rocks of the Sub-Erzgebirge basin, Saxony (Germany). Chem. Geol. 2016, 428, 77–91. [Google Scholar] [CrossRef]
  11. Dumanska-Slowik, M.; Natkaniec-Nowak, L.; Kotarba, M.J.; Sikorska, M.; Rzymelka, J.A.; Loboda, A.; Gawel, A. Mineralogical and geochemical characterization of the “bituminous” agates from Nowy Kosciol (Lower Silesia, Poland). Neues Jahrb. Für Mineral.-Abh. 2008, 184, 255–268. [Google Scholar] [CrossRef]
  12. Papineau, D. Chemically Oscillating Reactions as a New Model for the Formation of Mineral Patterns in Agate Geodes and Concretions. Minerals 2024, 14, 203. [Google Scholar] [CrossRef]
  13. Svetova, E.N.; Svetov, S.A.; Lavrov, O.B. Agate Mineralization in Paleoproterozoic Organic Carbon-Rich Sedimentary Rocks of the Onega Basin (NW Russia): Insights into Genesis. Minerals 2024, 14, 447. [Google Scholar] [CrossRef]
  14. Götze, J.; Möckel, R.; Kempe, U.; Kapitonov, I.; Vennemann, T. Characteristics and origin of agates in sedimentary rocks from the Dryhead area, Montana, USA. Mineral. Mag. 2009, 73, 673–690. [Google Scholar]
  15. Götze, J.; Möckel, R.; Pan, Y.M. Mineralogy, Geochemistry and Genesis of Agate—A Review. Minerals 2020, 10, 1037. [Google Scholar] [CrossRef]
  16. Moxon, T.; Palyanova, G. Agate Genesis: A Continuing Enigma. Minerals 2020, 10, 953. [Google Scholar] [CrossRef]
  17. Conte, A.; Della Ventura, G.; Rondeau, B.; Romani, M.; Guidi, M.C.; La, C.; Napoleoni, C.; Lucci, F. Hydrothermal genesis and growth of the banded agates from the Allumiere-Tolfa volcanic district (Latium, Italy). Phys. Chem. Miner. 2022, 49, 22–34. [Google Scholar] [CrossRef]
  18. Goetze, J.; Stanek, K.; Orozco, G.; Liesegang, M.; Mohr-Westheide, T. Occurrence and Distribution of Moganite and Opal-CT in Agates from Paleocene/Eocene Tuffs, El Picado (Cuba). Minerals 2021, 11, 531. [Google Scholar] [CrossRef]
  19. Lorenzi, R.; Zullino, A.; Gagliardi, V.; Prosperi, L.; Paleari, A.; Adamo, I. Atomic and microstructural origin of banded colours in purple-blue variety of agate from Yozgat Province, Turkey. Phys. Chem. Miner. 2022, 49, 33. [Google Scholar] [CrossRef]
  20. Prsek, J.; Dumanska-Slowik, M.; Powolny, T.; Natkaniec-Nowak, L.; Tobola, T.; Zych, D.; Skrepnicka, D. Agates from Western Atlas (Morocco)-Constraints from Mineralogical and Microtextural Characteristics. Minerals 2020, 10, 198. [Google Scholar] [CrossRef]
  21. Zhang, Z.Q.; Zhao, T.; Liu, L.; Li, Y. Spectral Characteristics of Madagascar Agates. Spectrosc. Spectr. Anal. 2021, 41, 3227–3232. [Google Scholar]
  22. Powolny, T.; Dumanska-Slowik, M.; Sikorska-Jaworowska, M.; Wójcik-Bania, M. Agate mineralization in spilitized Permian volcanics from “Borowno” quarry (Lower Silesia, Poland)-microtextural, mineralogical, and geochemical constraints. Ore Geol. Rev. 2019, 114, 103–130. [Google Scholar] [CrossRef]
  23. Shen, M.M.; Lu, Z.Y.; He, X.M. Mineralogical and Geochemical Characteristics of Banded Agates from Placer Deposits: Implications for Agate Genesis. ACS Omega 2022, 7, 23858–23864. [Google Scholar] [CrossRef] [PubMed]
  24. Svetova, E.N.; Chazhengina, S.Y.; Stepanova, A.V.; Svetov, S.A. Black Agates from Paleoproterozoic Pillow Lavas (Onega Basin, Karelian Craton, NW Russia): Mineralogy and Proposed Origin. Minerals 2021, 11, 918. [Google Scholar] [CrossRef]
  25. Svetova, E.N.; Svetov, S.A. Agates from Paleoproterozoic Volcanic Rocks of the Onega Structure, Central Karelia. Geol. Ore Depos. 2020, 62, 669–681. [Google Scholar] [CrossRef]
  26. Zhang, S.X.; Cui, L.; Guo, Q.F.; Li, N.; Liu, Y.; Rao, Y.H.; Liao, L.B. A Comparative Study on Gemological Characteristics and Color Formation Mechanism of Moqi Agate, Inner Mongolia Province, China. Crystals 2023, 13, 977. [Google Scholar] [CrossRef]
  27. Zhou, D.Y.; Shi, G.H.; Liu, S.Z.; Wu, B.L. Mineralogy and Magnetic Behavior of Yellow to Red Xuanhua-Type Agate and Its Indication to the Forming Condition. Minerals 2021, 11, 877. [Google Scholar] [CrossRef]
  28. Guo, M.; Wang, W.W.; Liu, H.; Lu, Z.; Yin, Z.W. Raman Spectral Analysis on a Special Band of Nanhong Agate. Spectrosc. Spectr. Anal. 2021, 41, 1271–1275. [Google Scholar]
  29. Guo, W.; Wang, S. Mineralogical characteristics and coloration mechanism of Nanhong agate from Baoshan, Yunnan Province. Acta Petrol. Mineral. 2017, 36, 419–430. [Google Scholar]
  30. Liu, D.; Lv, X.; Huang, J.; Shao, J.; Li, Z.; Cheng, Y. Geological characteristics and genesis of Nanhong agate from Huize area of the Northeast Yunan Province. Contrib. Geol. Minerel Resour. Res. 2018, 33, 548–553. [Google Scholar]
  31. Lu, Z.Y.; He, X.M.; Lin, C.L.; Jin, X.Y.; Pan, Y.M. Identification of Beihong Agate and Nanhong Agate from China Based on Chromaticity and Raman Spectra. Spectrosc. Spectr. Anal. 2019, 39, 2153–2159. [Google Scholar]
  32. Yang, Y.; Ruan, Q.; Song, L.; Bai, F.; Zhu, S. Study On The Gemological And Mineralogical Characteristics of Nanhong Jade In Zhaotong Area, Unnan Province. J. Mineral. Petrol. 2015, 35, 28–36. [Google Scholar]
  33. Mei, G.; Zuowei, Y. Gemmological Characteristics of Nanhong Agate from Lijiang, Yunnan Province. J. Gems Gemmol. 2019, 21, 91–93. [Google Scholar]
  34. Lu, Z.; Guo, M.; Liu, H.; Yin, Z. Gemological characteristics of Yunnan Lijiang southern red agate. China Gems 2022, 199–201. [Google Scholar]
  35. Yang, L.Y.; Yan, S.W.; Wang, H.T.; Zhang, Y.T.; Wang, R.Y.; Yang, M.X.; Wang, C.W. Spectral Characteristics of Two Kinds of Nanhong Agate Imitations. Spectrosc. Spectr. Anal. 2022, 42, 835–840. [Google Scholar]
  36. Zhou, Y.F.; Liu, Z.Y.; Zhao, Z.T.; Guo, Y. Quantitative Study on Colour and Spectral Characteristics of Beihong Agate. Minerals 2022, 12, 677. [Google Scholar] [CrossRef]
  37. Zhang, X.M.; Ji, L.; He, X.M. Gemological Characteristics and Origin of the Zhanguohong Agate from Beipiao, Liaoning Province, China: A Combined Microscopic, X-ray Diffraction, and Raman Spectroscopic Study. Minerals 2020, 10, 401. [Google Scholar] [CrossRef]
  38. Chung, S.L.; Jahn, B.M. Plume-lithosphere interaction in generation of the Emeishan flood basalts at the Permian-Triassic boundary. Geology 1995, 23, 889–892. [Google Scholar] [CrossRef]
  39. Coffin, M.F.; Eldholm, O. Large igneous provinces: Crustal structure, dimensions, and external consequences. Rev. Geophys. 1994, 32, 1–36. [Google Scholar] [CrossRef]
  40. Anh, T.V.; Pang, K.N.; Chung, S.L.; Lin, H.M.; Hoa, T.T.; Anh, T.T.; Yang, H.J. The Song Da magmatic suite revisited: A petrologic, geochemical and Sr–Nd isotopic study on picrites, flood basalts and silicic volcanic rocks. J. Asian Earth Sci. 2011, 42, 1341–1355. [Google Scholar] [CrossRef]
  41. Liu, X.; Liang, Q.; Li, Z.; Castillo, P.R.; Shi, Y.; Xu, J.; Huang, X.; Liao, S.; Huang, W.; Wu, W. Origin of Permian extremely high Ti/Y mafic lavas and dykes from Western Guangxi, SW China: Implications for the Emeishan mantle plume magmatism. J. Asian Earth Sci. 2016, 141, 97–111. [Google Scholar] [CrossRef]
  42. Wang, C.; Zhou, M.F.; Qi, L. Permian flood basalts and mafic intrusions in the Jinping (SW China)–Song Da (northern Vietnam) district: Mantle sources, crustal contamination and sulfide segregation. Chem. Geol. 2007, 243, 317–343. [Google Scholar] [CrossRef]
  43. Xu, Y.; Chung, S.L.; Jahn, B.M.; Wu, G. Petrologic and geochemical constraints on the petrogenesis of Permian–Triassic Emeishan flood basalts in southwestern China. Lithos 2001, 58, 145–168. [Google Scholar] [CrossRef]
  44. Li, Y.; He, H.; Ivanov, A.V.; Demonterova, E.I.; Pan, Y.; Deng, C.; Zheng, D.; Zhu, R. 40Ar/39Ar age of the onset of high-Ti phase of the Emeishan volcanism strengthens the link with the end-Guadalupian mass extinction. Int. Geol. Rev. 2018, 60, 1906–1917. [Google Scholar] [CrossRef]
  45. Zhong, Y.; Mundil, R.; Chen, J.; Yuan, D.; Xu, Y. Geochemical, biostratigraphic, and high-resolution geochronological constraints on the waning stage of Emeishan Large Igneous Province. Geol. Soc. Am. Bull. 2020, 132, 1969–1986. [Google Scholar] [CrossRef]
  46. He, B.; Xu, Y.G.; Chung, S.L.; Xiao, L.; Wang, Y. Sedimentary evidence for a rapid, kilometer-scale crustal doming prior to the eruption of the Emeishan flood basalts. Earth Planet. Sci. Lett. 2003, 213, 391–405. [Google Scholar] [CrossRef]
  47. Xu, Y.G.; He, B.; Chung, S.L.; Menzies, M.A.; Frey, F.A. Geologic, geochemical, and geophysical consequences of plume involvement in the Emeishan flood-basalt province. Geology 2004, 32, 917–920. [Google Scholar] [CrossRef]
  48. Kamenetskysup, V.S.; Chungsup, S.-L.; Kamenetskysup, M.B.; Kuzminsup/sup, D.V. Picrites from the Emeishan Large Igneous Province, SW China: A Compositional Continuum in Primitive Magmas and their Respective Mantle Sources. J. Petrol. 2012, 53, 2095–2113. [Google Scholar] [CrossRef]
  49. Zhang, L.; Qian, S.I.; Li, N.; Hong, L.; Ren, Z.U. Simultaneous In Situ Determination of Pb Isotope Ratios and Trace Element Concentrations in Melt Inclusions by LASS-ICP-MS. Geochem. Geophys. Geosystems 2021, 22, e2020GC009451. [Google Scholar] [CrossRef]
  50. Heaney, P.J.; Post, J.E. The Widespread Distribution of a Novel Silica Polymorph in Microcrystalline Quartz Varieties. Science 1992, 255, 441–443. [Google Scholar] [CrossRef]
  51. Lu, Z.Y.; He, X.M.; Guo, Q.F. Color and Genesis of Beihong Agate and Its Spectroscopic Characteristics. Spectrosc. Spectr. Anal. 2020, 40, 2531–2537. [Google Scholar]
  52. Kingma Kathleen, J.; Hemley Russell, J. Raman spectroscopic study of microcrystalline silica. Am. Mineral. 1994, 79, 269–273. [Google Scholar]
  53. Gotze, J.; Nasdala, L.; Kleeberg, R.; Wenzel, M. Occurrence and distribution of “moganite” in agate/chalcedony: A combined micro-Raman, Rietveld, and cathodoluminescence study. Contrib. Mineral. Petrol. 1998, 133, 96–105. [Google Scholar] [CrossRef]
  54. Ilieva, A.; Mihailova, B.; Tsintsov, Z.; Petrov, O. Structural state of microcrystalline opals: A Raman spectroscopic study. Am. Mineral. 2007, 92, 1325–1333. [Google Scholar] [CrossRef]
  55. Mcmillan, P.F. Raman Spectroscopy In Mineralogy And Geochemistry. Annu. Rev. Earth Planet. Sci. 2003, 17, 255–279. [Google Scholar] [CrossRef]
  56. Nasdala, L.; Schmidt, C. Applications of Raman Spectroscopy in Mineralogy and Geochemistry. Elements 2020, 16, 99–104. [Google Scholar] [CrossRef]
  57. Lee, D.R. Characterisation of Silica Minerals in a Banded Agate: Implications for Agate Genesis and Growth Mechanisms. 2007, pp. 1–8. Available online: https://www.academia.edu/9750104 (accessed on 10 September 2020).
  58. Weiss, W. The Role of Goethite in the Transformation of Hematite. Mineral. Mag. 2004, 68, 301–311. [Google Scholar]
  59. Cudennec, Y.; Lecerf, A. The transformation of ferrihydrite into goethite or hematite, revisited. J. Solid State Chem. 2006, 179, 716–722. [Google Scholar] [CrossRef]
  60. Shellnutt, J.G.; Pham, T.T.; Denyszyn, S.W.; Yeh, M.W.; Tran, T.A. Magmatic duration of the Emeishan large igneous province: Insight from northern Vietnam. Geology 2020, 48, 457–461. [Google Scholar] [CrossRef]
  61. Yuan, Y.; Zhang, H.; Lou, Y.; Pan, J.; Zhao, J.; Liu, H. The discovery of sedimentary intercalations in Emeishan basalt in the Zhaotong area, Northeastern Yunnan: The new evidence of episodic eruption. Geol. Bull. China 2022, 41, 1772–1782. [Google Scholar]
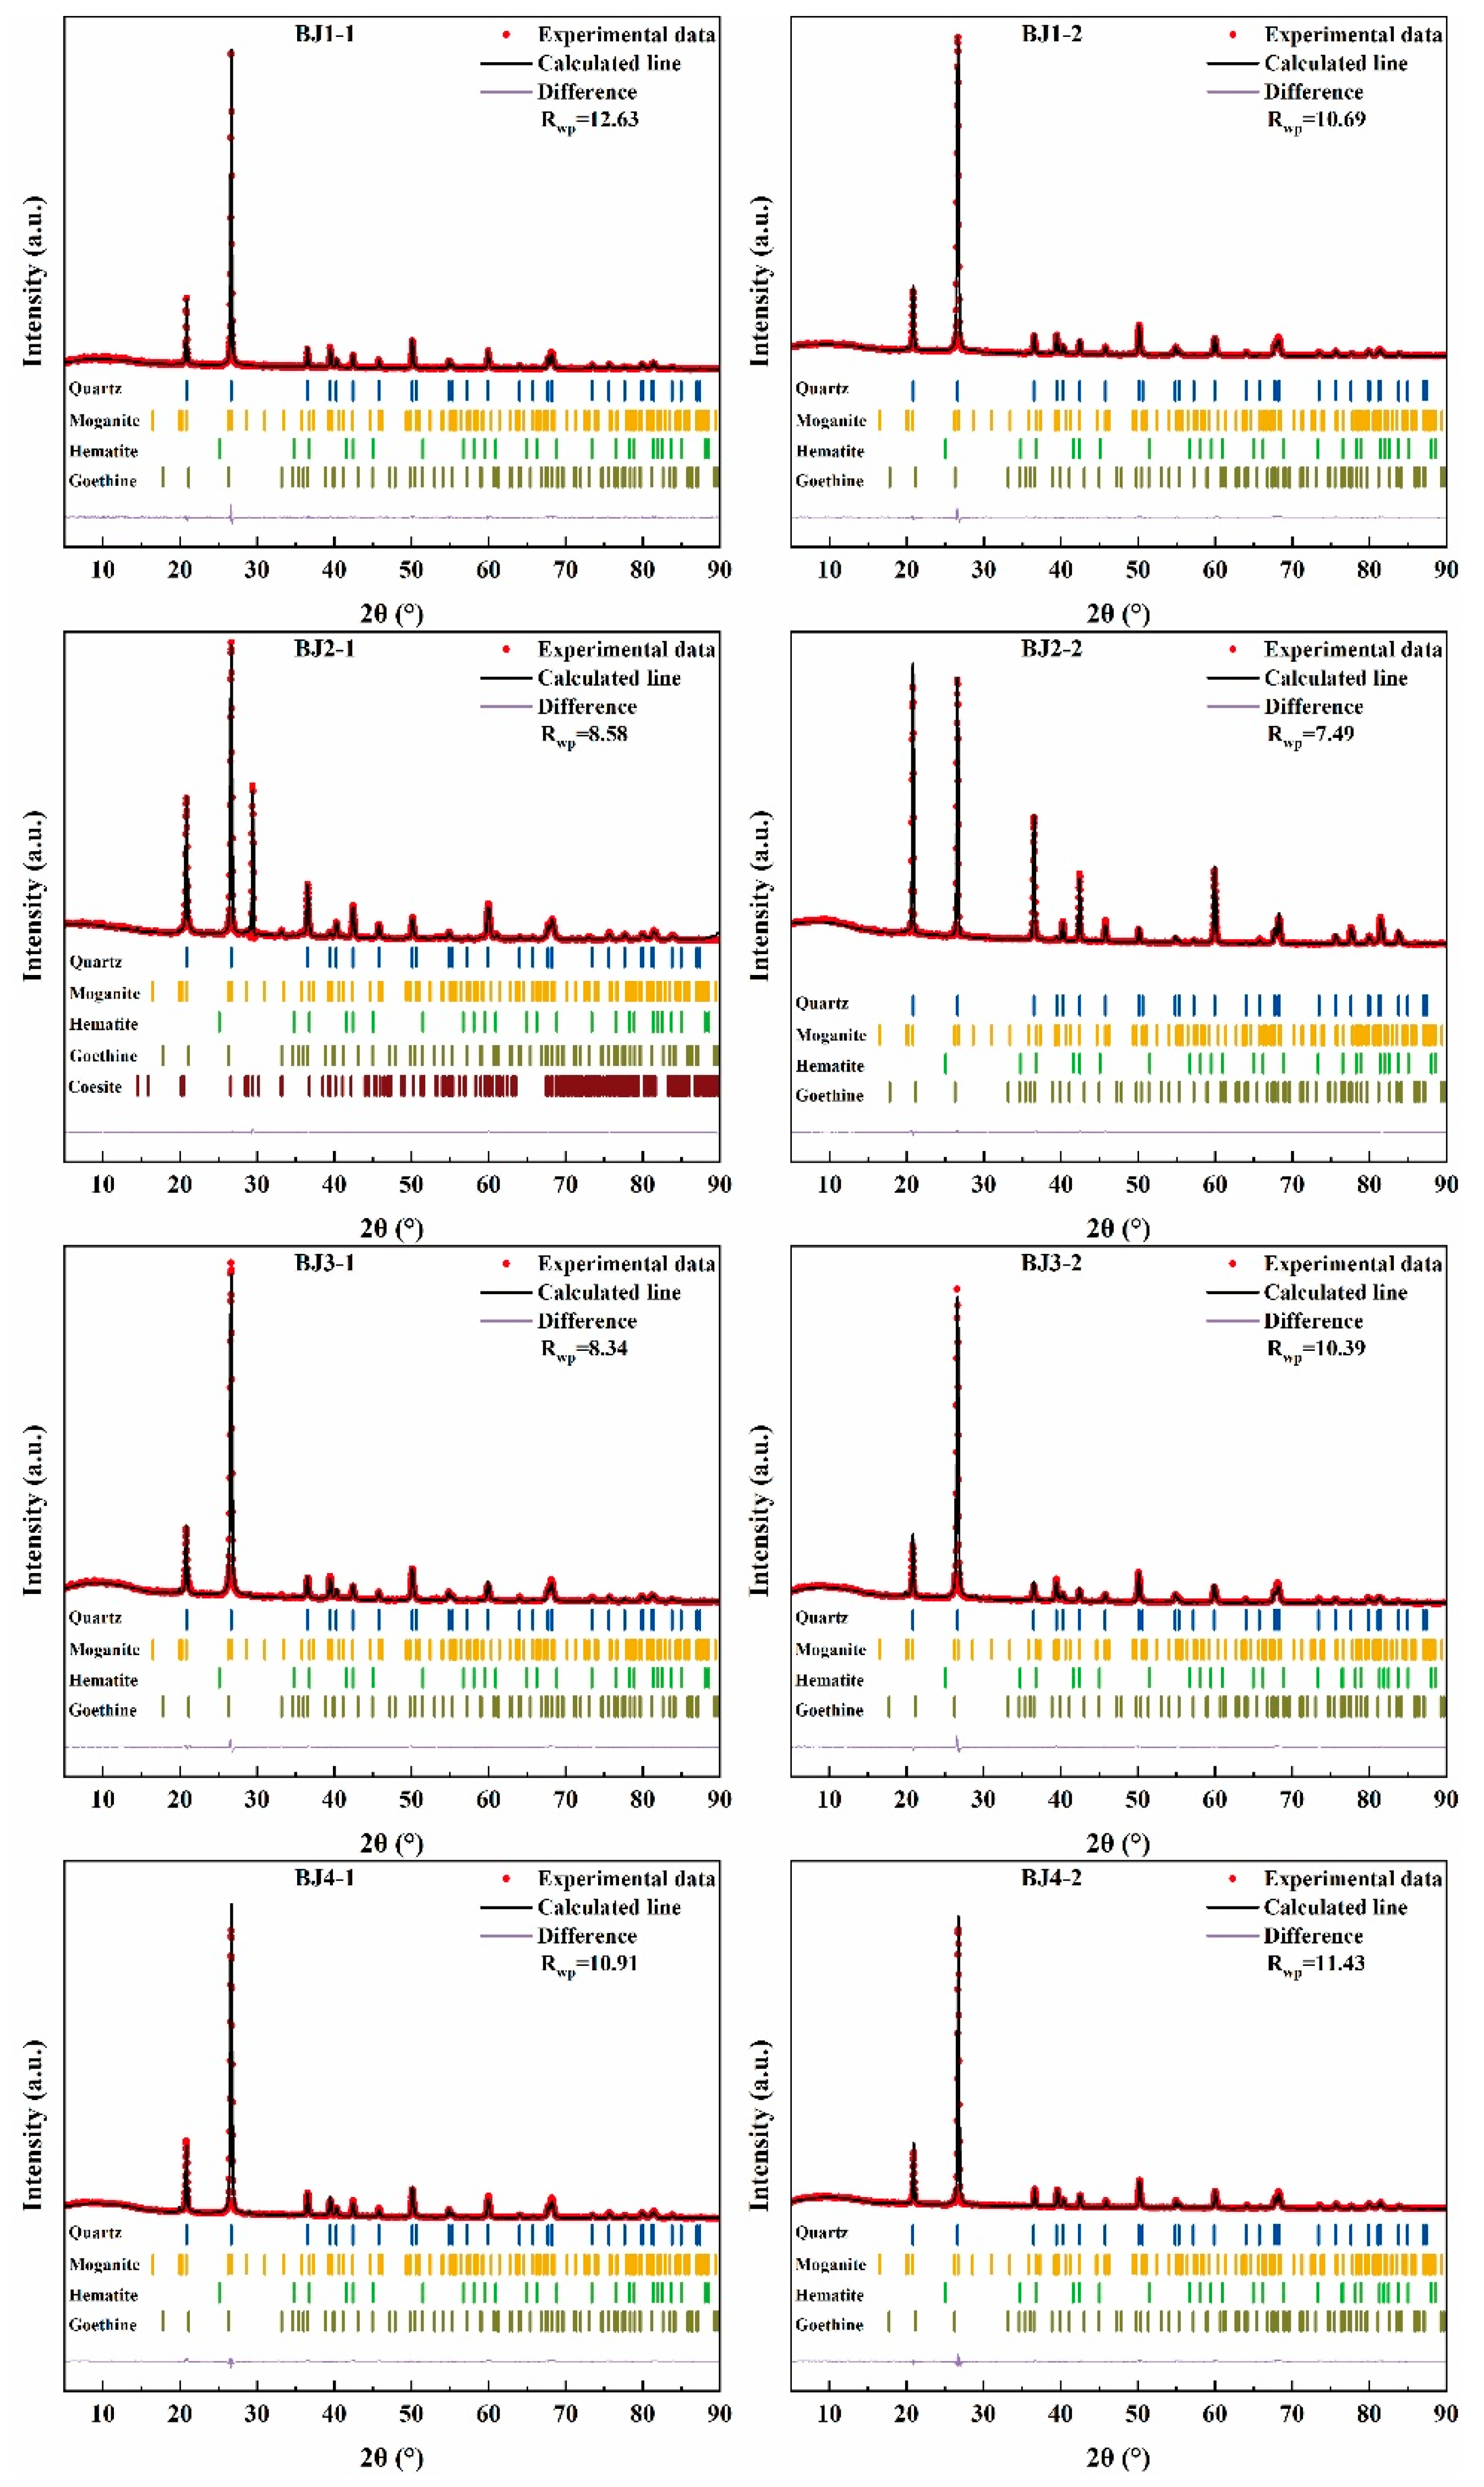
Figure 2. Field geological survey photos. (ad) Current status of Nanhong agate mining, (e) Nanhong agate occurring in basalt, and (f) Nanhong agate occurring in sedimentary rocks. The unit of the ruler in the photograph is centimeters.
Crystals 15 00488 g002
Figure 3. Photographs of samples; (a) Sample BJ1; (b) Sample BJ2; (c) Sample BJ3; (d) Sample BJ4.
Crystals 15 00488 g003
Figure 4. Structural characteristics of sample BJ1; (a) physical photograph; (b,c) corresponding photographs under cross-polarized light and plane-polarized light, respectively, for (a); (df) morphology of chalcedony under orthogonal polarized light microscopy. (g,h) Photographs under cross-polarized light and plane-polarized light at the same position of the yellow-red boundary; (i) hematite under reflected light; (j,k) photographs under cross-polarized light and plane-polarized light at the same position of the red-yellow boundary; (l) BSE image of the “yellow-skinned” area.
Crystals 15 00488 g004
Figure 5. Structural characteristics of sample BJ2; (a) physical photograph; (b) photo corresponding to (a) under crossed polarized light; (c) morphology of chalcedony in orthogonal polarized light microscopy. (di) Morphological characteristics of iron matter in the “yellow-skinned” area under plane-polarized light; (jn) Morphological characteristics of iron matter in the internal red area under plane-polarized and crossed polarized light.
Crystals 15 00488 g005
Figure 6. Structural characteristics of sample BJ3; (a) photograph of the sample; (b,c) corresponding photographs under cross-polarized light and single-polarized light, respectively; (do) microscopic characteristics of hematite and goethite under cross-polarized light, single-polarized light, and reflected light.
Crystals 15 00488 g006
Figure 7. Structural characteristics of the sample BJ4; (a) photograph of the sample; (b,c) corresponding photographs under cross-polarized light and single-polarized light, respectively; (df) morphology of chalcedony under orthogonal polarized light microscopy; (g,h) photographs of the yellow–red interface at the same location under cross-polarized light and single-polarized light; (i) hematite under reflected light; (j,k) photographs of the “yellow-skinned” area under cross-polarized light and single-polarized light; (l) BSE image of the “yellow-skinned” area.
Crystals 15 00488 g007
Figure 8. SEM images of samples BJ1-BJ4; (a) SEM image of the external “yellow skinned” area of sample BJ1; (b) SEM image of the internal red area of sample BJ1; (c) SEM image of the external “yellow skinned” area of sample BJ2; (d) SEM image of the internal red area of sample BJ2; (e) SEM image of the external “yellow skinned” area of sample BJ3; (f) SEM image of the internal red area of sample BJ3; (g) SEM image of the external “yellow skinned” area of sample BJ4; (h) SEM image of the internal red area of sample BJ4.
Crystals 15 00488 g008
Figure 9. Infrared diffuse reflectance spectra of samples; (a) Sample BJ1; (b) Sample BJ2; (c) Sample BJ3; (d) Sample BJ4.
Crystals 15 00488 g009
Figure 10. Infrared transmission spectra of samples BJ–BJ4.
Crystals 15 00488 g010
Figure 11. UV–Vis absorption spectra of samples BJ1–BJ4.
Crystals 15 00488 g011
Figure 12. Raman spectra of samples BJ1–BJ4; (a) Sample BJ1; (b) Sample BJ2; (c) Sample BJ3; (d) Sample BJ4.
Crystals 15 00488 g012
Figure 13. The μXRD–Rietveld refinement patterns of samples BJ1–BJ4.
Crystals 15 00488 g013
Figure 14. EPMA and LA-ICPMS test point locations of samples; (a) Sample BJ1; (b) Sample BJ2; (c) Sample BJ3; (d) Sample BJ4.
Crystals 15 00488 g014
Figure 15. ΣREE map of samples BJ1–BJ4.
Crystals 15 00488 g015
Table 1. Rietveld refinement results of samples BJ1–BJ4.
No.BJ1-1BJ1-2BJ2-1BJ2-2BJ3-1BJ3-2BJ4-1BJ4-2
Quartz99.90 97.80 99.597.60 96.20 95.70 95.60 99.20
Moganite0.00 2.10 0.30.70 3.40 4.30 3.40 0.70
Hematite0.10 0.10 0.10.00 0.00 0.00 0.10 0.00
Goethite0.00 0.00 0.21.70 0.50 0.00 0.90 0.10
Table 2. EPMA data of samples BJ1–BJ4 (wt.%).
No. SiO2TiO2Al2O3FeOMnOMgOCaONa2OK2OP2O5UO2SO3Total
BJ1-1 94.57 0.00 0.17 4.62 0.02 0.02 0.09 0.02 0.03 0.08 0.00 0.01 99.63
BJ1-2 96.59 0.00 0.14 2.75 0.00 0.00 0.08 0.02 0.01 0.03 0.04 0.00 99.66
BJ1-3 99.44 0.01 0.09 0.07 0.01 0.01 0.00 0.02 0.02 0.02 0.00 0.01 99.70
BJ1-4 99.28 0.02 0.06 0.03 0.00 0.00 0.00 0.00 0.00 0.00 0.11 0.00 99.52
BJ2-1 93.47 0.01 0.09 4.69 0.00 0.03 0.03 0.03 0.00 0.05 0.00 0.00 98.41
BJ2-2 95.21 0.00 0.06 2.79 0.01 0.01 0.07 0.02 0.02 0.06 0.00 0.00 98.25
BJ2-3 99.30 0.00 0.03 0.04 0.03 0.00 0.00 0.02 0.00 0.00 0.03 0.00 99.45
BJ2-4 99.46 0.02 0.01 0.08 0.03 0.00 0.00 0.00 0.01 0.00 0.01 0.00 99.62
BJ3-1 99.37 0.00 0.00 0.27 0.02 0.00 0.04 0.00 0.00 0.03 0.00 0.02 99.79
BJ3-2 96.67 0.00 0.12 1.47 0.00 0.00 0.03 0.00 0.02 0.05 0.00 0.00 98.40
BJ3-3 99.11 0.00 0.00 0.03 0.00 0.03 0.01 0.00 0.02 0.00 0.00 0.00 99.24
BJ3-4 98.49 0.01 0.01 0.35 0.00 0.00 0.02 0.01 0.00 0.00 0.00 0.00 98.89
BJ4-1 92.60 0.00 0.12 5.00 0.04 0.02 0.09 0.03 0.02 0.14 0.00 0.01 98.07
BJ4-2 97.61 0.00 0.13 0.55 0.00 0.00 0.02 0.00 0.03 0.00 0.04 0.00 98.37
BJ4-3 98.39 0.03 0.06 0.10 0.00 0.00 0.04 0.02 0.01 0.00 0.03 0.00 98.69
BJ4-4 99.18 0.02 0.03 0.09 0.02 0.01 0.00 0.00 0.02 0.07 0.00 0.00 99.44
Disclaimer/Publisher’s Note: The statements, opinions and data contained in all publications are solely those of the individual author(s) and contributor(s) and not of MDPI and/or the editor(s). MDPI and/or the editor(s) disclaim responsibility for any injury to people or property resulting from any ideas, methods, instructions or products referred to in the content.

