Article

Prediction of Dendrite Growth Velocity in Undercooled Binary Alloys Based on Transfer Learning and Molecular Dynamics Simulation

1
School of Science, Harbin University of Science and Technology, Harbin 150080, China
2
Key Laboratory of Engineering Dielectric and Applications (Ministry of Education), School of Electrical and Electronic Engineering, Harbin University of Science and Technology, Harbin 150080, China
3
School of Materials Science and Chemical Engineering, Harbin University of Science and Technology, Harbin 150080, China
*
Author to whom correspondence should be addressed.
Crystals 2025, 15(5), 484; https://doi.org/10.3390/cryst15050484
Submission received: 21 March 2025 / Revised: 13 May 2025 / Accepted: 16 May 2025 / Published: 21 May 2025
(This article belongs to the Section Crystalline Metals and Alloys)

Abstract

:
The growth velocity of the crystal–melt interface during solidification is one of the important parameters that determine the crystal growth morphology. However, both experimental investigations and theoretical calculations are time-consuming and labor-intensive. Moreover, machine learning (ML)-based methods are severely limited by the limited amount of available experimental data. In this work, the crystal–melt interface velocity of four alloy systems under different values of undercooling was calculated by molecular dynamics simulation. The results showed a similar trend to the experimental data. A framework including molecular dynamics (MD) calculation and a transfer learning (TL) model was proposed to predict the interface velocity of binary alloys during free solidification. In order to verify the effectiveness of the model, eight ML models were constructed based on pure experimental data for model comparison. The prediction ability of the different models was assessed from two perspectives: interpolation and extrapolation. The results show that, regardless of whether it is interpolation or extrapolation, the TL model driven by both physical information and experimental data is superior to ML models driven solely by experimental data. The interpretability analysis method reveals the specific role of feature values in the interface velocity prediction of binary alloys.

1. Introduction

Dendrite growth is one of the most common phenomena in the solidification process of alloys and plays a crucial role in both theoretical solidification studies and industrial practice [1,2]. The properties of the interface between the crystal and the liquid phase govern the crystal growth and ultimately the microstructure of the resulting material. Among these properties, the growth velocity of the crystal–melt interface during the solidification process is an important manifestation of the crystal growth morphology. Morphological instability is the fundamental cause of dendrite formation, arising from the combined effects of undercooling and temperature gradient during solidification. Growth velocity is the dynamic characterization of dendrite growth induced by morphological instability. By analyzing the velocity, the changing trends of undercooling and temperature gradient in the solidification system can be inferred, providing key parameters for studying the kinetics of dendritic growth [3,4]. Therefore, investigating the crystal–melt interface velocity holds significant importance and offers broad prospects for research.
In terms of experiments, many studies have been conducted to measure the interface velocity in suspended droplets using capacity proximity sensor technology, photodiode technology, and high-speed camera technology [5]. However, experiments are usually complex and require a lot of human and material resources. Therefore, simulation technology is used to compensate for the shortcomings of experiments in this regard. Computer simulation of solid–liquid interfaces and crystal growth in pure metals and binary alloys has a well-established history [6,7,8,9,10,11,12,13,14,15,16]. These studies include traditional dendrite growth analysis models, phase-field models, cellular automata, Monte Carlo methods, molecular dynamics [17,18,19,20], and other numerical simulation methods for dendrite growth and solidification. Molecular dynamics (MD) simulation has been used to study the interface velocity of various metals in some studies [21,22]. With the help of MD simulation, researchers could analyze particle systems with highly complex internal interactions at the atomic scale and study the dynamic evolution process of the system at the atomic level [23,24,25,26,27].
Conventionally, studies on materials have predominantly relied on experiments or theoretical calculations. When confronted with the vast expanse of the material search space, such an approach results in substantial consumption of both human and material resources [28,29,30]. In recent years, following the paradigms of experimentally driven, theory-driven, and computationally driven research, the data-driven material research paradigm has received widespread attention. With the growth of material data and the improvement of algorithms, machine learning (ML) can effectively and automatically predict a variety of material properties. In contrast to classical theoretical or numerical approaches, ML utilizes data as its fundamental “raw material” and can manifest learning capabilities without the need for explicit programming. ML has been widely used in material research and has made important contributions in various scenarios, such as the fields of high-entropy alloys [31,32,33,34,35] and batteries [36,37].
Recently, in the field of dendrite growth and solidification, there have been studies using ML methods to predict the interface growth velocity of alloys. Vanga et al. [38] predicted the interface velocity using ML algorithms trained on experimental data. In this work, five algorithms were considered, and the R2 score of the artificial neural network (ANN) was greater than 0.89. However, the data in this study consist solely of experimental results and lack physical information. In our previous work [39], the thermophysical parameters of the Galenko–Danilov free dendrite growth model (GD model) [40,41] were introduced into an ML model to predict the interface velocity, and it was confirmed that the combination of ML and a physical model could improve the prediction effectiveness. However, there is a certain gap between the rationality and physical knowledge contained in the GD model and MD. The model employed in this study is comparatively simplistic, and the methodology for acquiring physical information also exhibits potential areas for enhancement.
However, current ML research regarding the interface velocity is confronted with the problem of data shortage. Typically, data for an alloy consist of merely several to dozens of data points. This scarcity renders it arduous to construct an accurate model for the interface velocity. The challenge is compounded when attempting to predict and analyze alloys of other systems using the known data from a few alloys, a process known as extrapolation. In order to address the issue of data scarcity, MD calculation data can be introduced. These data are obtained based on physical knowledge, which can be integrated into the dual drive of physics information and experimental data. Introducing physical information into ML models can effectively compensate for the lack of data. In scenarios where the calculated data fail to precisely align with the experimental conditions, transfer learning presents itself as a viable and sophisticated solution. Its core objective is to leverage the knowledge acquired from one or multiple related tasks to effectively address another target task. It breaks through the limitation that traditional ML needs a large number of target task data, thus greatly improving the generalization ability and learning efficiency of the model. It has become a new research hotspot and development direction in the field of ML, and has been proved to be effective in the field of materials. Although TL has been applied in many fields, such as predicting alloy strength and plasticity [42], as well as predicting the creep fracture life of high-temperature titanium alloys [43], it has not yet been applied in the field of solidification.
In this work, we propose an interface velocity modeling framework combining MD simulation and TL. First, experimental data of the dendrite growth velocity of four binary alloys were collected. Second, the interface velocities of the four alloys were calculated by MD simulation and compared with the experimental data. Third, two types of ML models were constructed. One is driven by pure experimental data. The other introduces MD simulation data into the ML model through the TL strategy, and the model is driven by both physical information and experimental data. From the perspective of interpolation and extrapolation abilities, the ability of the model to predict the interface velocity was explored. Finally, the influence of features on the interface velocity was analyzed through the interpretability method.

2. Materials and Methods

The workflow of this work is illustrated in Figure 1. It can be seen that this work consists of four parts. First, experimental data on the crystal interface velocity of four binary alloys were collected, including NiZr, NiCu, CoCu, and FeCu. Second, the dynamic solidification process of the four alloys was simulated using MD, and the interface velocity was calculated. Third, eight ML models driven by experimental data and a TL model driven by both physical information and experimental data were built. Subsequently, the interpolation and extrapolation capabilities of these two types of models were investigated. Finally, the influence of different features on the prediction of the interface velocity of dendrites was analyzed through interpretability analysis.

2.1. Dataset Briefing
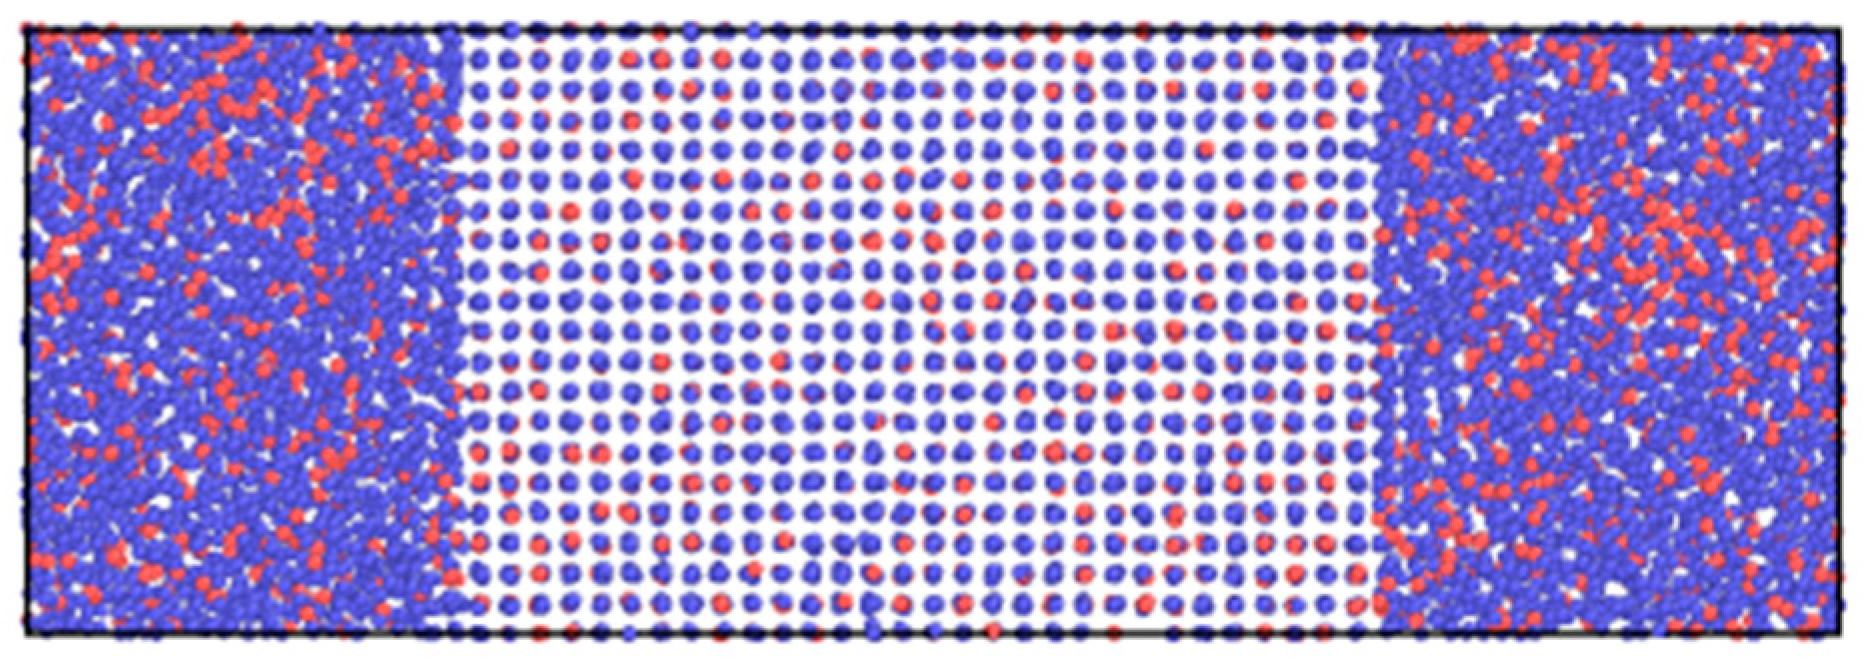
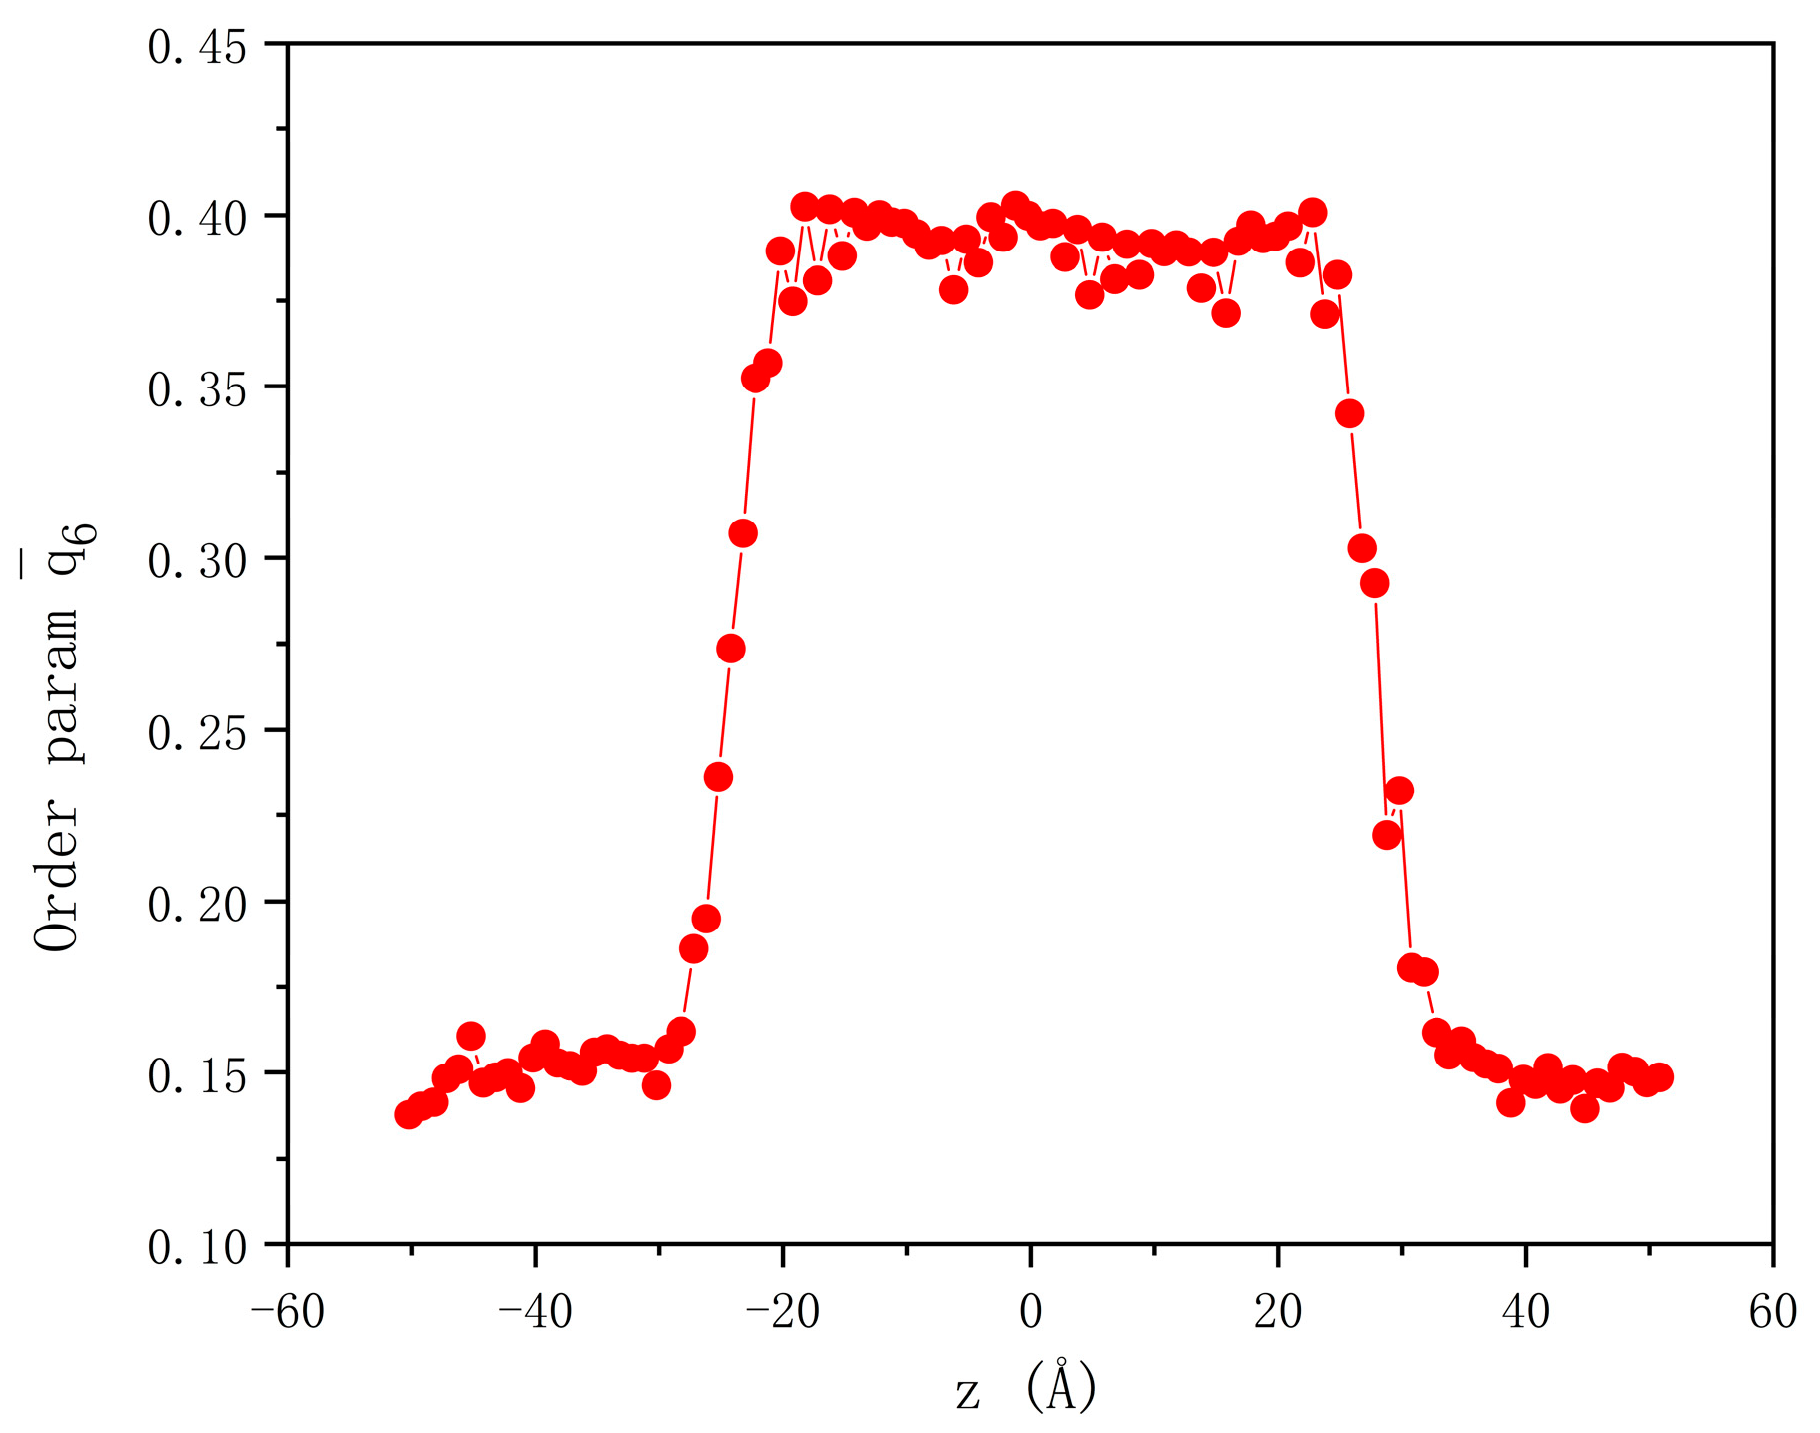
A comprehensive review of existing experimental studies on the interface velocity of binary alloys under different values of undercooling reveals that current experimental data are primarily obtained through electromagnetic levitation equipment (EML) for free dendritic growth in undercooled single-phase solid-solution alloys. EML can provide a container-free curing environment to achieve deep undercooling of droplets. Specifically, this work compiles data from four alloy systems (Ni99Zr1, Ni30Cu70, Fe92.8Cu7.2, and Co81.2Cu18.8, where the subscript indicates the proportion of each element) [44,45,46,47], and the undercooling range of all alloys spans 0–300 K. The collected experimental dataset includes 21 experimental points for Ni99Zr1, 28 experimental points for Ni70Cu30, 13 experimental points for Fe92.8Cu7.2, and 23 experimental points for Co81.2Cu18.8, totaling 85 data points, which constitutes a typical small dataset. The interface velocity distribution of the four alloys at different values of undercooling is shown in Figure 2.
In the data collected for constructing the ML model, the prediction label is the interface velocity, and the features are composition, undercooling, and liquidus temperature. Due to the introduction of MD in this work, the thermophysical parameters in the GD model that might cause conflicts were removed compared to previous work [39]. The proportion of different elements in binary alloys directly determines the basic physical and chemical properties of the alloy. As is well known, undercooling serves as a control parameter for achieving different solidification microstructures [48]. The liquidus temperature is the temperature at which an alloy begins to solidify, reflecting the thermodynamic properties of the alloy system. The importance of specific features will be further explained in Section 3.4.

2.2. MD Simulation

MD simulation was conducted using open-source software, namely Large-scale Atomic/Molecular Massively Parallel Simulator (LAMMPS) [49]. The interface velocities of NiZr and NiCu at different undercooling values were studied using the embedded atom method (EAM) [50,51], and the interface velocities of FeCu and CoCu were studied using the modified embedded atom method (MEAM) potential function [52,53].
In the construction process of the initial system, in order to avoid any surface effects, periodic boundary conditions were applied in all directions. Four alloy models were constructed by random substitution based on the proportion of experimental alloys. The size was 10a × 10a × 30a (a is the lattice constant for the crystallized phase; please refer to the potential functional files in the Supplementary Materials for specific values), containing 12,000 atoms. In order to create a solid–liquid interface, the upper and lower parts of the system (perpendicular to the Z direction) were melted by equilibrium melting at a temperature higher than the melting temperature, while the middle part was maintained at a temperature lower than the melting temperature. For this purpose, a constant number of atoms, pressure, and temperature (NPT) ensemble was used, and a time step of 1 femtosecond was maintained throughout the entire research process. Subsequently, the entire system was relaxed at the estimated melting point temperature. The conditions under which both solid and liquid phases coexisted were the equilibrium melting conditions (i.e., combinations of pressure, P, and temperature, T). Finally, these solid–liquid simulation cells were used for the subsequent free solidification simulation. A typical starting configuration depicting the projected atomic positions in Co81.2Cu18.8 is shown in Figure 3. In order to obtain the melting temperature, we changed the estimated temperature at intervals of 10k and repeated the above steps, visually observing the data through OVITO until the interface position did not move after a period of relaxation. The calculated melting temperatures of NiCu, CoCu, NiZr, and FeCu were 1400 K, 1500 K, 1690 K, and 1745 K, respectively.
In the simulation of free solidification, in order to promote interface growth, the solid–liquid system was equilibrated at different temperatures (using the NPT ensemble with P = 0). The position of the solid–liquid interface was clearly tracked relative to time. To accurately locate the interface position, bond-orientational order [54] was used to distinguish atoms in the solid and liquid phases. The averaged local bond order parameter is as follows:
q l m i = 1 N ~ b i k = 0 N ~ b i     q l m k ,
where N ~ b ( i ) is the number of all neighboring atoms of atom i (k = 0 represents atom i itself). The local order parameter [55] can effectively distinguish local ordered structures:
q l i = 4 π 2 l + 1 m = l m = l     q l m i 2 ,
Based on these definitions and functions, the q ¯ 6 parameter was employed to distinguish between atoms in the solid phase and those in the liquid phase, and to differentiate various crystal structures. The q ¯ 6 parameter for each atom was calculated over periodic time intervals. The entire system was divided into uniform cells perpendicular to the Z direction, and the average order parameter of all atoms within each cell was computed. Figure 4 shows the order parameters of the CoCu system in its initial state. The q ¯ 6 parameter value of the crystal-phase region is about 0.4, while that in the liquid-phase region is about 0.15. The order parameter undergoes a sudden change near the liquid–solid interface, and we use this to determine the interface position. Through the acquisition of the interface position at every instant, the interface velocity corresponding to different values of undercooling can be computed according to the temporal variations in the interface position.

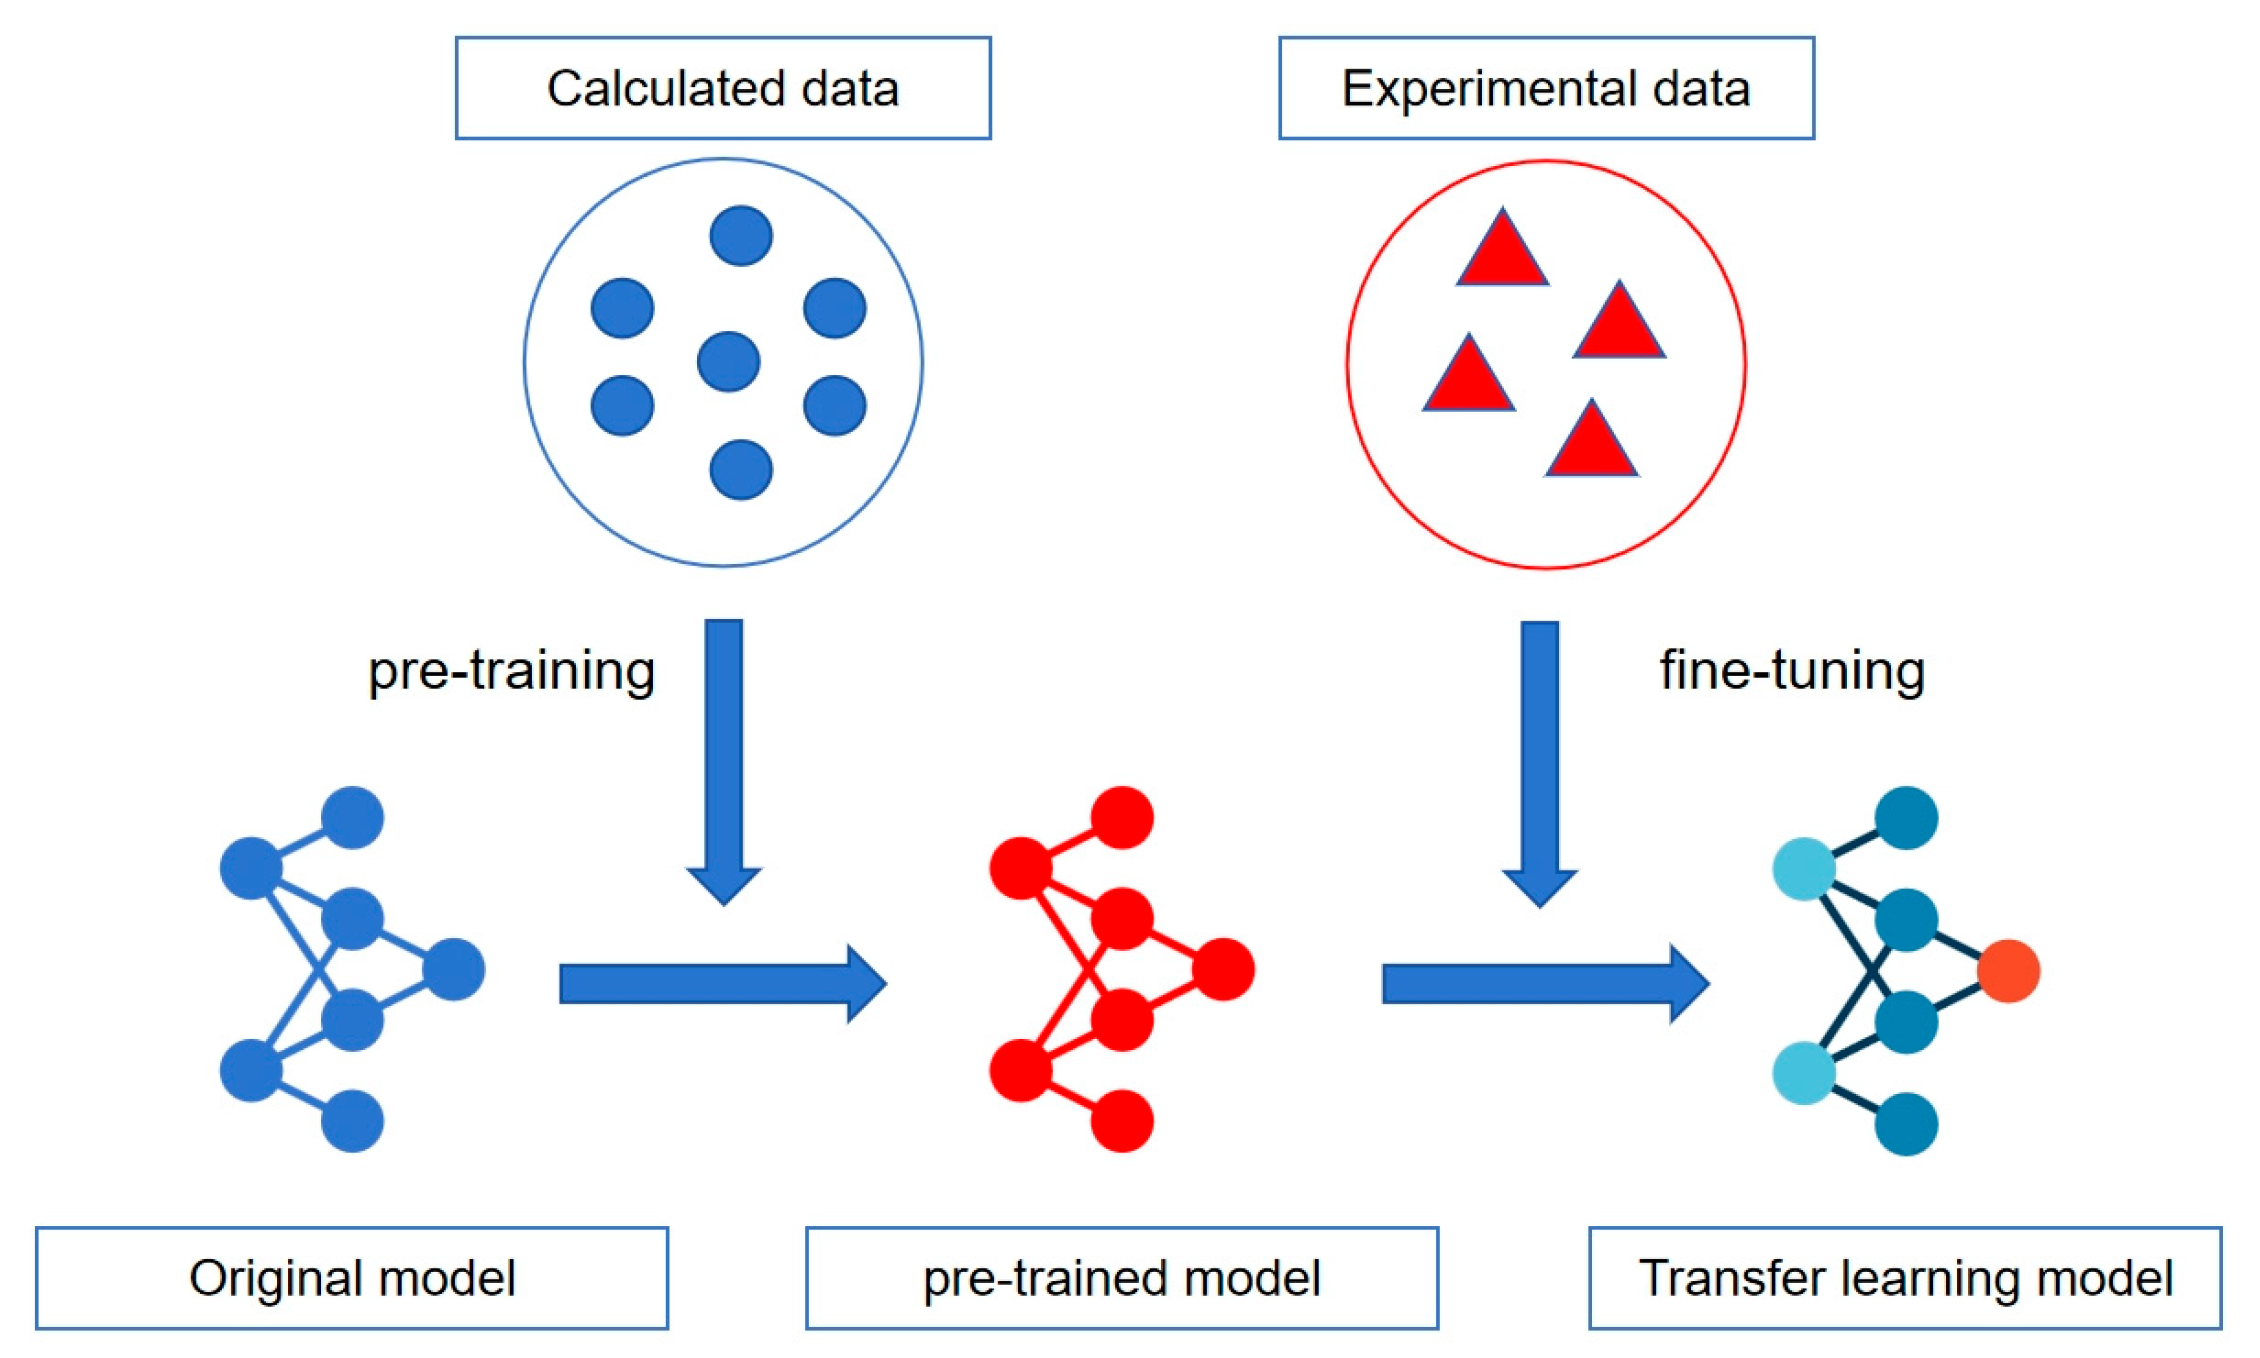
2.3. Transfer Learning Strategy

In many cases, the data volume of the target task, i.e., the target domain, is limited or the acquisition cost is high, while other related tasks or fields, i.e., the source domain, possess a large amount of data and knowledge. TL is an ML strategy of breaking through these limitations, by utilizing rich data and knowledge from the source domain to assist in model construction for the target domain [56].
Figure 5 shows the flowchart of the TL framework in this work. The source domain is the data calculated from the MD simulation, and the target domain is the experimental data. To enable the ANN model to learn knowledge and feature–label relationships from the source domain, the ANN is pre-trained in the source domain and then fine-tuned in the target domain to adapt the model to new application scenarios. The purpose is to indirectly learn physical information from MD calculation data and apply this physical information to predict actual experimental data. Compared to the studies in references [38] and [39], this work incorporates MD simulation data and applies the TL model, which can fully explore the feature–label patterns in both MD and experimental data while mitigating the negative effects caused by their discrepancies.

3. Results and Discussion

In order to comprehensively evaluate the prediction ability of the model in terms of the interface velocity, two cases are considered in combination with the actual situation. One is the interpolation, which refers to the ability of the model to predict unknown data with the same alloy system or data distribution as the training data. The other is the extrapolation, which refers to the ability of the model to predict completely unknown alloy systems. In both cases, eight traditional ML models were constructed based on experimental data to facilitate comparison with our proposed framework. Subsequently, a TL model driven by physical information and experimental data was constructed.

3.1. Interface Velocity Calculation by MD

The evolution of the liquid–solid interface over time during the crystal growth process of NiZr alloy under an undercooling of 100 K is shown in Figure 6. The interface velocity at this undercooling could be calculated based on the relationship between the interface position and solidification time. Similarly, the interface velocities of the four different alloys under different undercooling conditions could be calculated separately. Given the presence of inherent errors in this method, the final velocity value was determined as the average of three measurements. A total of 50 data points for the four alloys were calculated through MD simulation.
Investigating the correlation between the interface velocity and undercooling stands as a crucial determinant in comprehending the solidification behavior of alloys. Figure 7 shows the relationship between the interface velocity and undercooling for the four alloy systems (CoCu, NiZr, NiCu, and FeCu) calculated by MD. It is evident that in all investigated alloy systems, there is a clear trend indicating an increase in interface velocity as the undercooling rises. For the CoCu alloy system, as the undercooling increases from 0 K to approximately 200 K, the velocity steadily rises from nearly 0m/s to about 45 m/s, showing a good linear correlation. This indicates that an augmentation in undercooling can effectively promote crystal growth. A similar pattern is exhibited in the NiZr alloy system, in which the velocity increases from nearly 0m/s to about 60 m/s when the undercooling of the system increases from 0 K to about 250 K, and the augmentation in velocity is the most significant among the four alloy systems. For NiCu alloy, when the undercooling reaches around 140 K, the growth rate of the interface velocity decreases. The growth rate of FeCu alloy is relatively slow during the undercooling process from 0 to 50 K, and relatively fast after exceeding 50 K. There are differences in the interface velocity of various alloy systems at the same undercooling, which reflects the significant influence of the alloy system and its composition on crystal growth kinetics. These results provide important data support for a deeper understanding of the micromechanisms during alloy solidification, and also provide a theoretical basis for regulating the microstructure and properties of alloys by controlling undercooling. A total of 50 interface velocity data points for the four alloys were calculated through MD simulation.
By comparing Figure 2 and Figure 7, the MD simulation results show a similar trend to the experimental data, yet differences in the specific values and distribution still exist. In reality, due to the curved tip of dendrites, there exists the Gibbs–Thomson effect [57], and changes in interface curvature can affect the results. In contrast, in the current MD simulation, a flat interface is assumed. The significance of simulation lies in its ability to conduct a detailed analysis of internal principles from microscopic mechanisms at the atomic level. In addition, different potential functions could also affect the calculation results, but this is not the main focus of this work. Furthermore, due to the limited size of the simulation region, the accuracy of the simulation results can also be affected (see the analysis of the interfacial composition in Table S4 in the Supplementary Materials). Subsequently, the physical information hidden in the simulation results will be used in TL to improve its predictive ability for interface velocity.

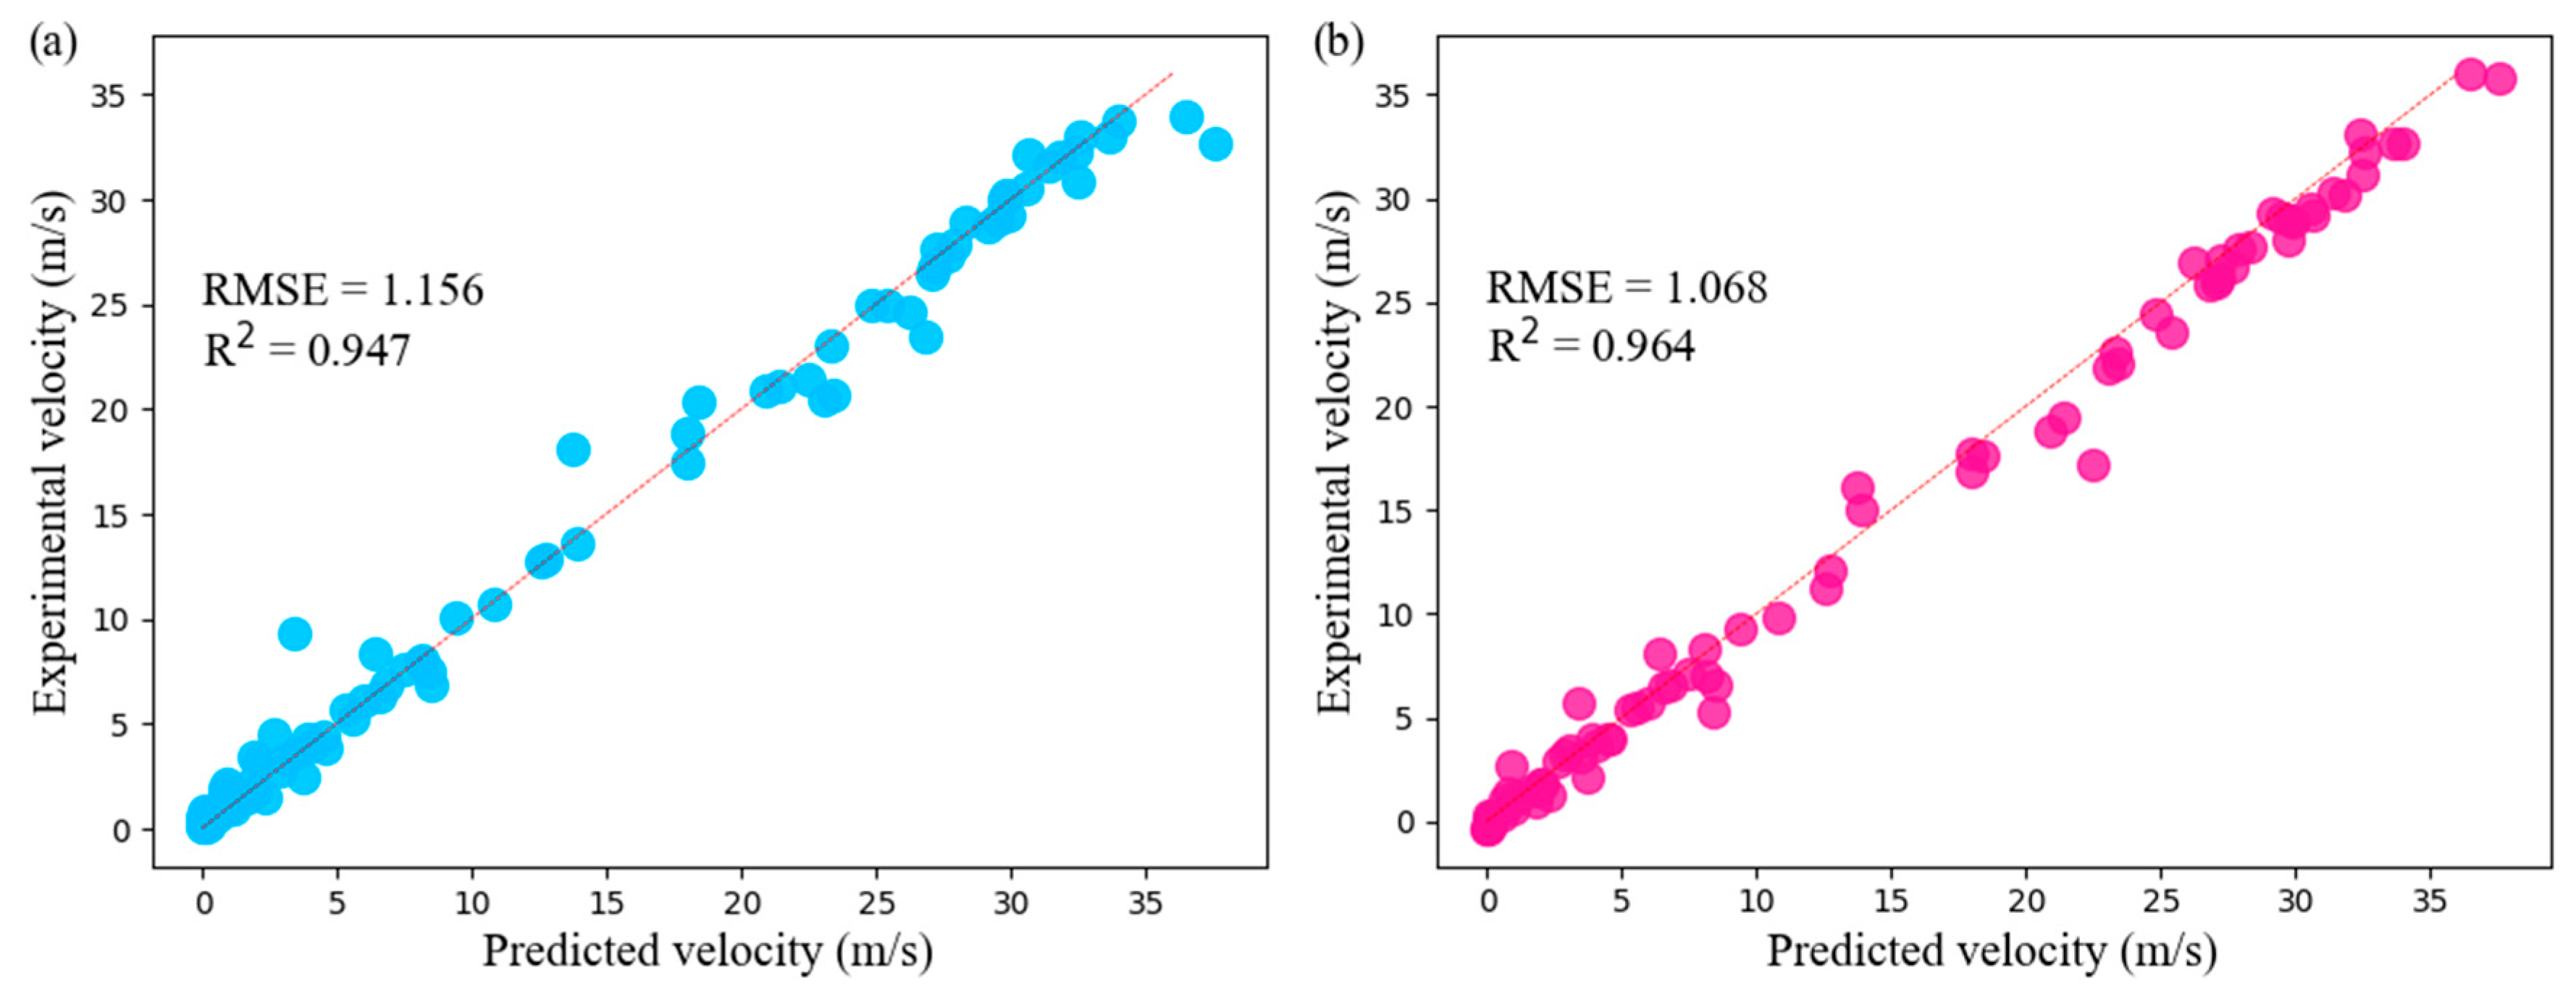
3.2. Interpolation Ability

Interpolation refers to the ability of the model to predict unknown data with the same alloy system or data distribution as the training data; therefore, 10-fold cross-validation is adopted to evaluate the model. Ten-fold cross-validation could avoid the over-fitting of the model and ensure the reliability of the evaluation results. Root mean square error (RMSE) and R-squared (R2) are selected as evaluation indicators.
For the ML model construction based on the pure experimental data, eight typical ML algorithms were considered in the present work, including support vector regression (SVR), random forest regression (RF), extra trees regression (ETR), adaptive boosting regression (AdaBoost), gradient boosting decision tree regression (GBR), k-nearest neighbor regression (KNN), bootstrap aggregating regression (Bagging), and ANN. For the model construction driven by both physical information and experimental data, an ANN was created using Keras API [41] to construct the TL model. In order to obtain physical information, the model was pre-trained on a computational dataset (source domain). Subsequently, the parameters were fine-tuned on the training set of experimental data (target domain) to obtain the TL model. The parameter ranges of each model are shown in Tables S1 and S2 of the Supplementary Materials. Figure 8 shows the 10-fold cross-validation results of these models, and their specific results are shown in Table 1. As for the eight models, most models achieve an R2 value of up to 0.9. Notably, the ETR and GBR models exhibit relatively good prediction performance in terms of the R2, both reaching 0.947. Regarding the RMSE, the ETR model has a lower value of 1.156. This indicates a minimal deviation between the ETR model prediction values and actual values.
For the TL model, the R2 score and RMSE achieved values of 0.964 and 1.068, representing a notable enhancement over the eight ML models based on the experimental data. This confirms the excellent prediction ability of the TL model. Owing to the physical information derived from MD calculations, the TL model is better equipped to capture the overall data trends in the experimental data. Figure 9 shows the interpolation 10-fold cross-validation prediction results of the ETR model and TL model.
It is worth noting that the prediction performance of the eight ML models which were trained on mixed training data of computation data and original experiment training data was also evaluated. The results showed poor prediction performance and the emergence of over-fitting. Although the calculated data show a similar trend to the experimental data, there are also differences in the specific values and distribution. These differences would cause outliers and noise points in the mixed data, seriously hindering model learning. The TL model’s distinctive framework has the potential to alleviate the negative impact of these differences. Instead, it could learn physical knowledge that is invaluable for model construction.

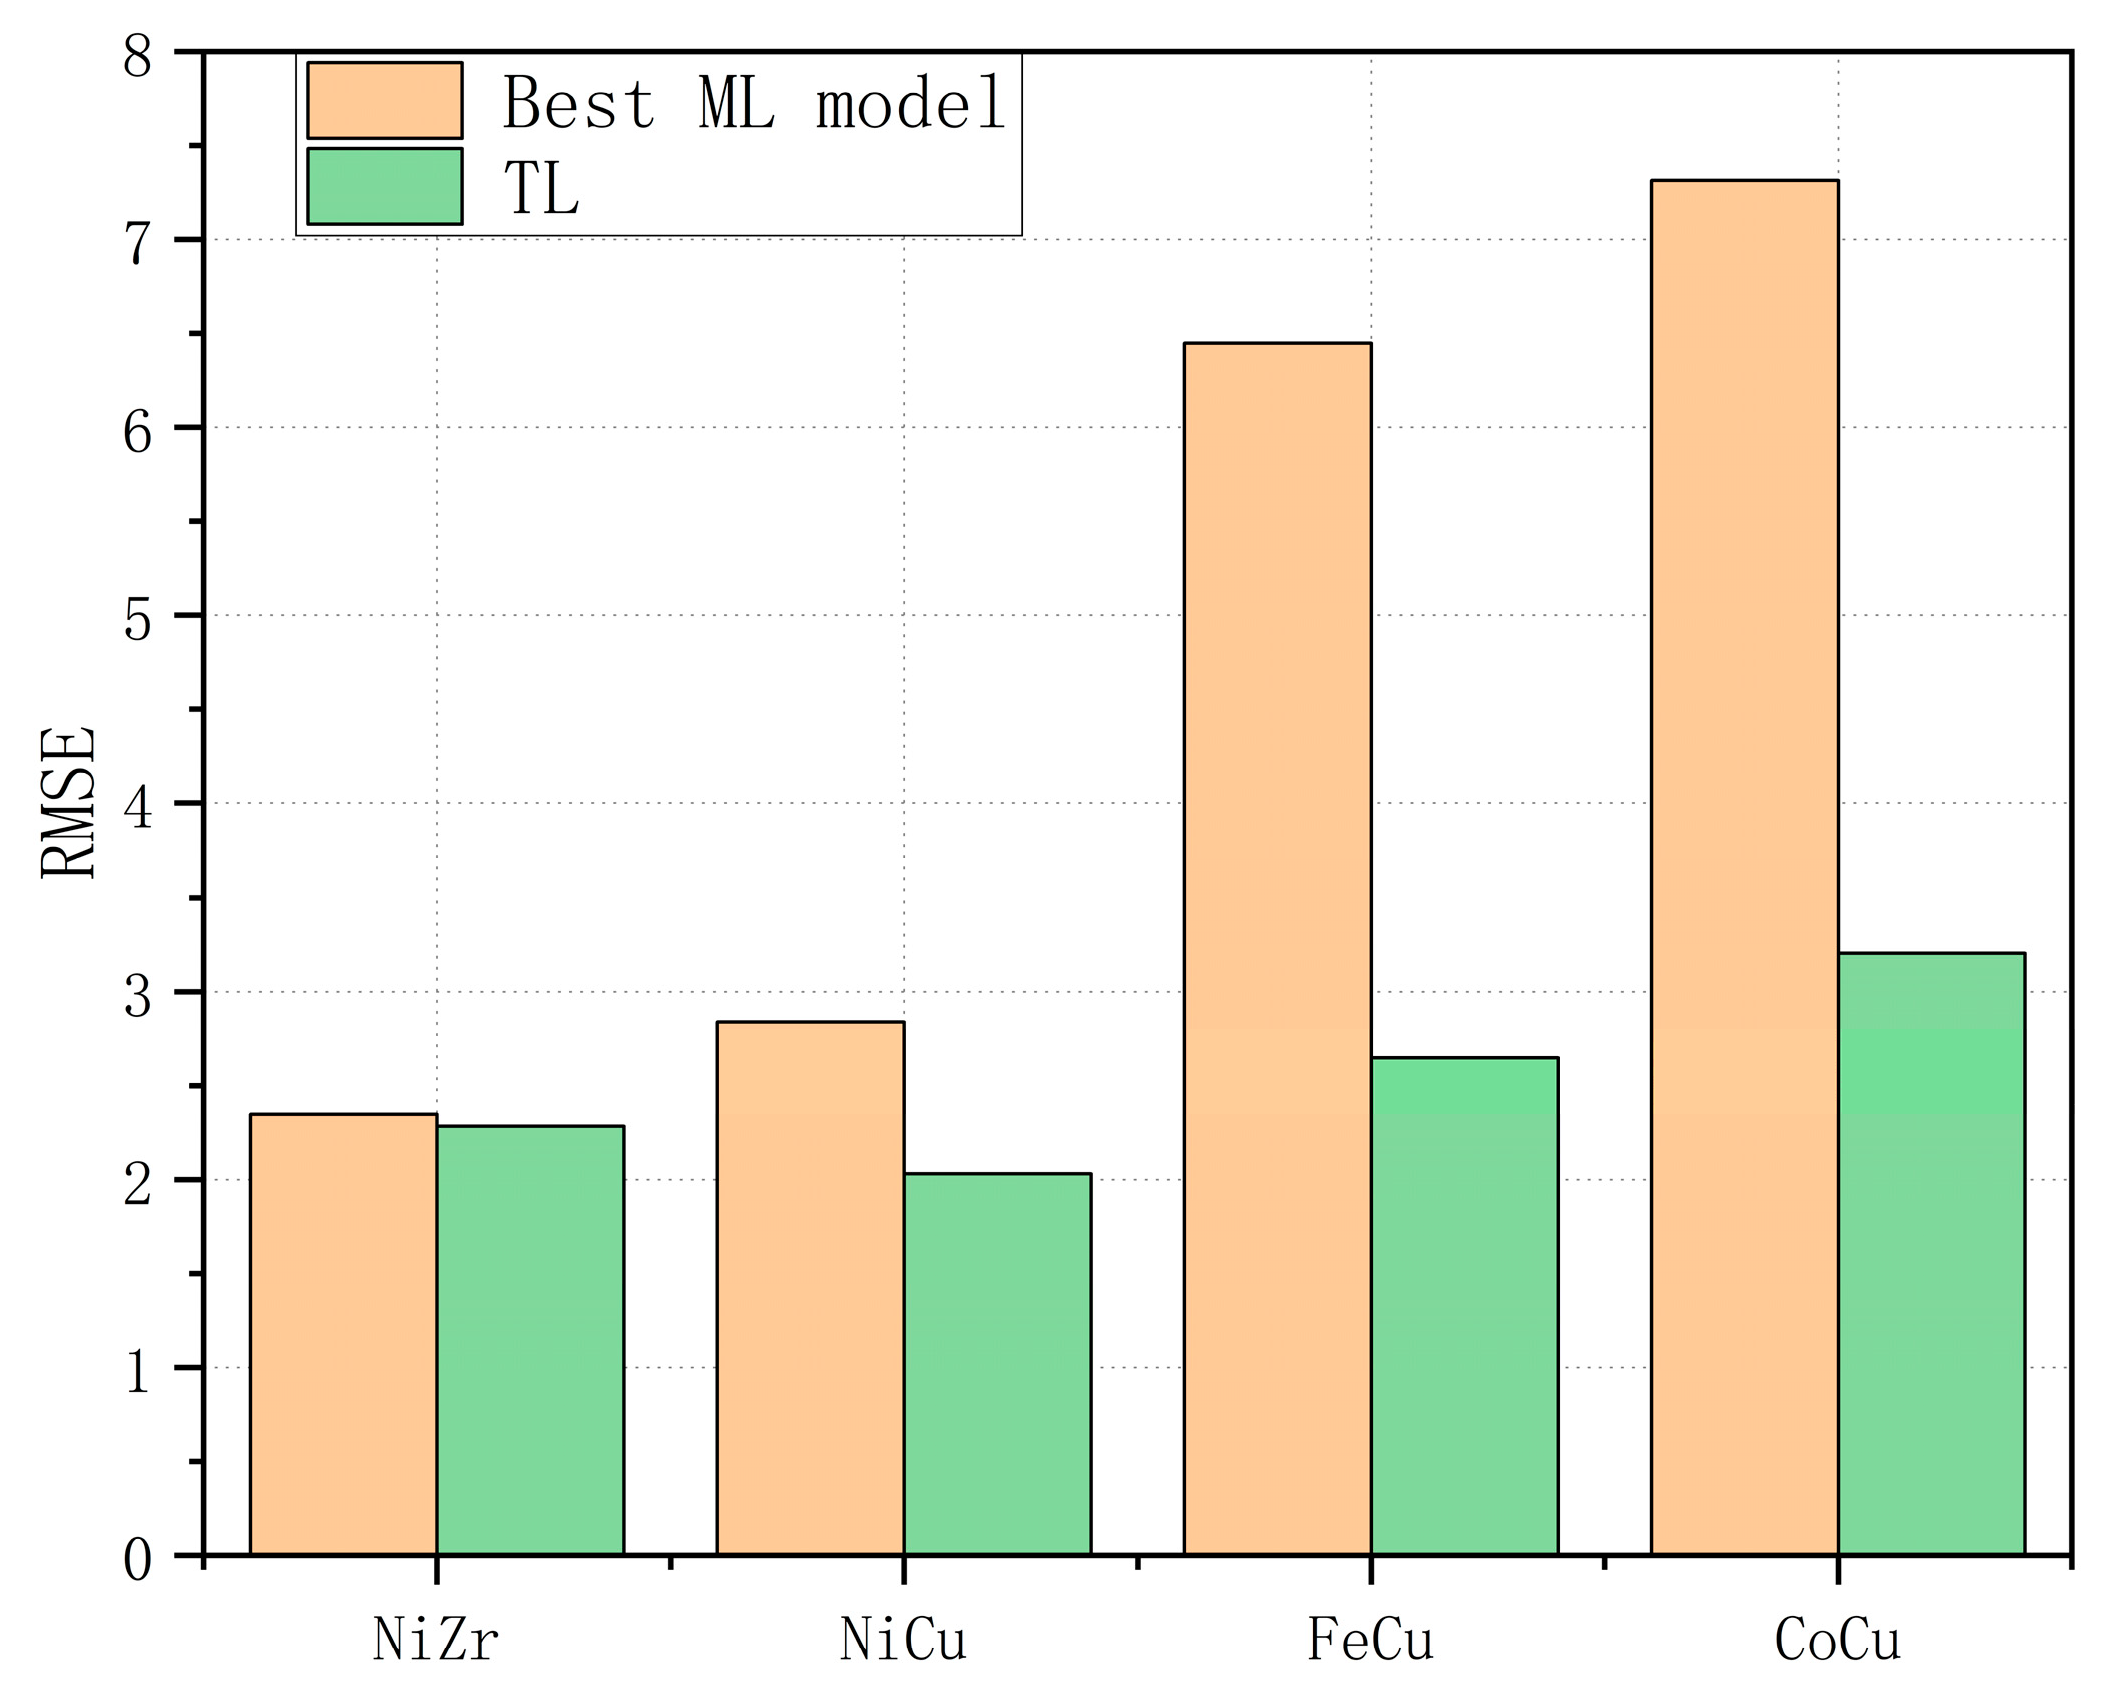
3.3. Extrapolation Ability

Extrapolation refers to the ability of the model to predict unknown data with unknown alloy systems, and in these tasks, there is a huge scarcity of available experimental data. Therefore, the extrapolation ability of the model is estimated by employing the data of any three alloys from these four alloys as the training set and the data of the remaining alloy as the testing set. Specifically, as for the four alloy systems discussed in this work, the ML model learns the functional relationship between material features (composition, undercooling, and liquidus temperature) and interface velocity from three alloy systems, and then applies this ML model to predict the interface velocity of the fourth, entirely unseen alloy system. This demonstrates a strict extrapolation task, as no data from the target alloy system are included during training. If the model possesses satisfying extrapolation performance, it can make reasonable predictions of the interface velocity of alloys without relying on the experimental data of the corresponding alloy. This approach not only curtails the expenses associated with the requisite experiments but also holds significant guiding implications for future experiments and research.
The extrapolation prediction results of the eight ML models based on pure experimental data and the TL model for each alloy system are shown in Table 2. It is evident that the extrapolation efficacy of ML models varies across different alloys. This variation is primarily attributed to the differing degrees of similarity between the extrapolation alloy and the alloys incorporated in the training set. The reason why most models have relatively good extrapolation ability for NiZr and NiCu systems is that the training data contain alloy systems containing Ni and Cu, and their proportions are high. The reason why Zr has a small negative impact on NiZr extrapolation prediction is that the proportion of Zr in NiZr is very small. On the contrary, the poor extrapolation ability of FeCu and CoCu systems can be attributed to the large proportion of iron and cobalt in their respective systems, and the absence of other alloy systems containing iron and cobalt in the training data. It can be concluded that ML models based on pure experimental data have significantly insufficient extrapolation results, especially for the alloy system which contains elements that do not exist in the training set. It is evident that this particular situation represents the most challenging one. Meanwhile, it holds immense value in both application and research, and it has the potential to significantly reduce a substantial amount of experimental expenses. It is worth noting that for the NiCu system, the R2 of SVR was negative; therefore, sensitivity analysis was conducted, as shown in the Supplementary Materials.
As for the eight models, the optimal models corresponding to the different alloy systems were different. In contrast, the TL model showed the best prediction ability in extrapolation for each alloy. Figure 10 shows the comparison between the results of the TL model and the optimal model among the eight models trained based on pure experimental data. It can be observed that for CoCu and FeCu alloys, the value of R2 increases from 0.635 and 0.77 to 0.93 and 0.961, respectively, and the RMSE values decreases from 7.315 and 6.447 to 3.205 and 2.649, respectively. As for NiCu alloy, there is also a pleasing improvement for the TL model. There is no significant improvement for NiZr alloy, mainly because the GBR model’s prediction performance for it is already very good. This result is primarily attributed to the fact that through the introduction of MD calculations, physical knowledge can be incorporated into the TL model prediction of unknown alloys. It could effectively compensate for the deficiencies inherent in pure data-driven approaches. Therefore, it has been proven that TL models driven by physical information and experimental data have excellent ability in predicting unknown alloy systems without corresponding experimental data. The comparison results and related conclusions regarding the prediction performance of the eight ML models trained on mixed data of computational data and experimental data are as general as in the case of interpolation.

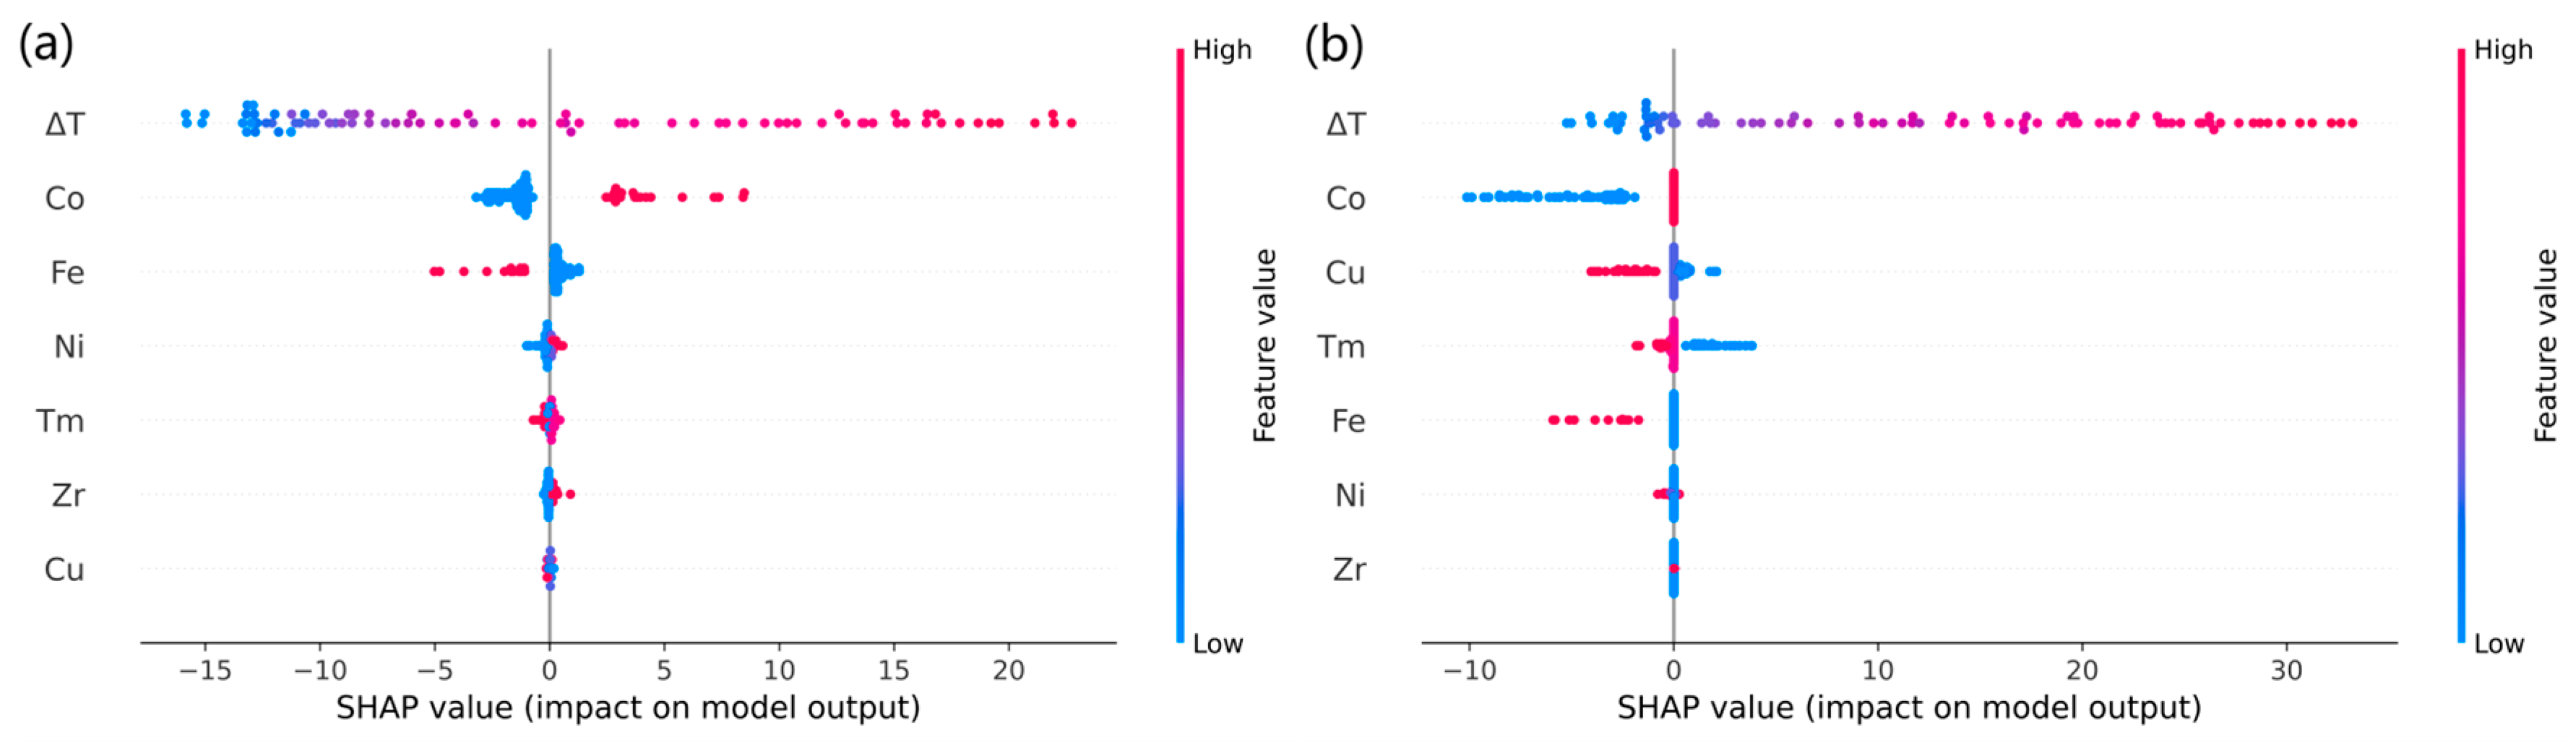
3.4. Interpretability Analysis

In the field of predicting material properties using ML models, it is imperative for researchers to comprehend the specific mapping process of ML models and explore the physical mechanisms governing material properties. The ANN model exhibits weak explanatory power and is considered a “black box” model. In order to explore the specific mapping process of the model, the SHapley Additive exPlanation (SHAP) method was used for interpretability analysis. SHAP is a game-theory-based approach that combines the optimal allocation of interpretive “credit” with local model interpretation by building a supplementary model for explanation. It takes all features into account as “contributors” and assigns SHAP values to each feature for each sample prediction. The SHAP value represents the deviation between the predicted result and the baseline result caused by the feature value. Moreover, the SHAP method is capable of yielding excellent visualization effects.
ETR consistently performed well and was used for comparison with the TL model. In order to analyze the overall patterns contained in the current dataset, the ETR model was trained with all the experimental data, and the TL model was trained with the computational data and all the experimental data. Based on the experimental data used in this work, the means of the SHAP absolute values of features, i.e., feature importance of the global interpretability, for the ETR model and TL model are shown in Figure 11. The importance of each element varies, which may be due to the different data volumes of alloys containing that element. It can be observed that for both models, the importance of undercooling (ΔT) is far ahead. The reason why the importance of liquidus temperature (Tm) is not significant may be that the Tm of the alloy systems are relatively close.
The SHAP summary plots for the model prediction of interface velocity are shown in Figure 12. The labels on the left-hand side of the vertical axis are the feature names, which are arranged in descending order according to their importance values. The horizontal axis represents the SHAP values of the features. Each point in every row corresponds to an actual sample, and the color of the data point is decided by the value of the corresponding feature. The greater the feature value, the redder the color of the point; conversely, the smaller the feature value, the bluer the color of the point. This can jointly demonstrate the impact of feature values on the prediction of all samples. Taking undercooling as an example, it can be observed that the higher the ΔT, the higher the SHAP value, which means that it has a positive promoting effect on the interface velocity.
Through the comparison and analysis of the SHAP results, it can be inferred that the fact that the TL model has stronger prediction ability than other models is related to the different roles played by features in different models. In terms of feature utilization, the TL model is more accurate in grasping key features (ΔT, Co, etc.) and more effective in the feature–label mapping process. It is reasonable to believe that the data from MD calculations guide the TL model to acquire physical knowledge in MD calculations. The TL model driven by both physical information and experimental data has a more suitable complexity, resulting in better performance in velocity prediction. The interpretability analysis of the extrapolation section can be found in the Supplementary Materials.

4. Conclusions

In this work, an ML framework that includes MD computation and a TL model was constructed to predict the interface velocity of binary alloys during free dendrite solidification, and the prediction performance in both interpolation and extrapolation abilities was estimated. The conclusions are as follows:
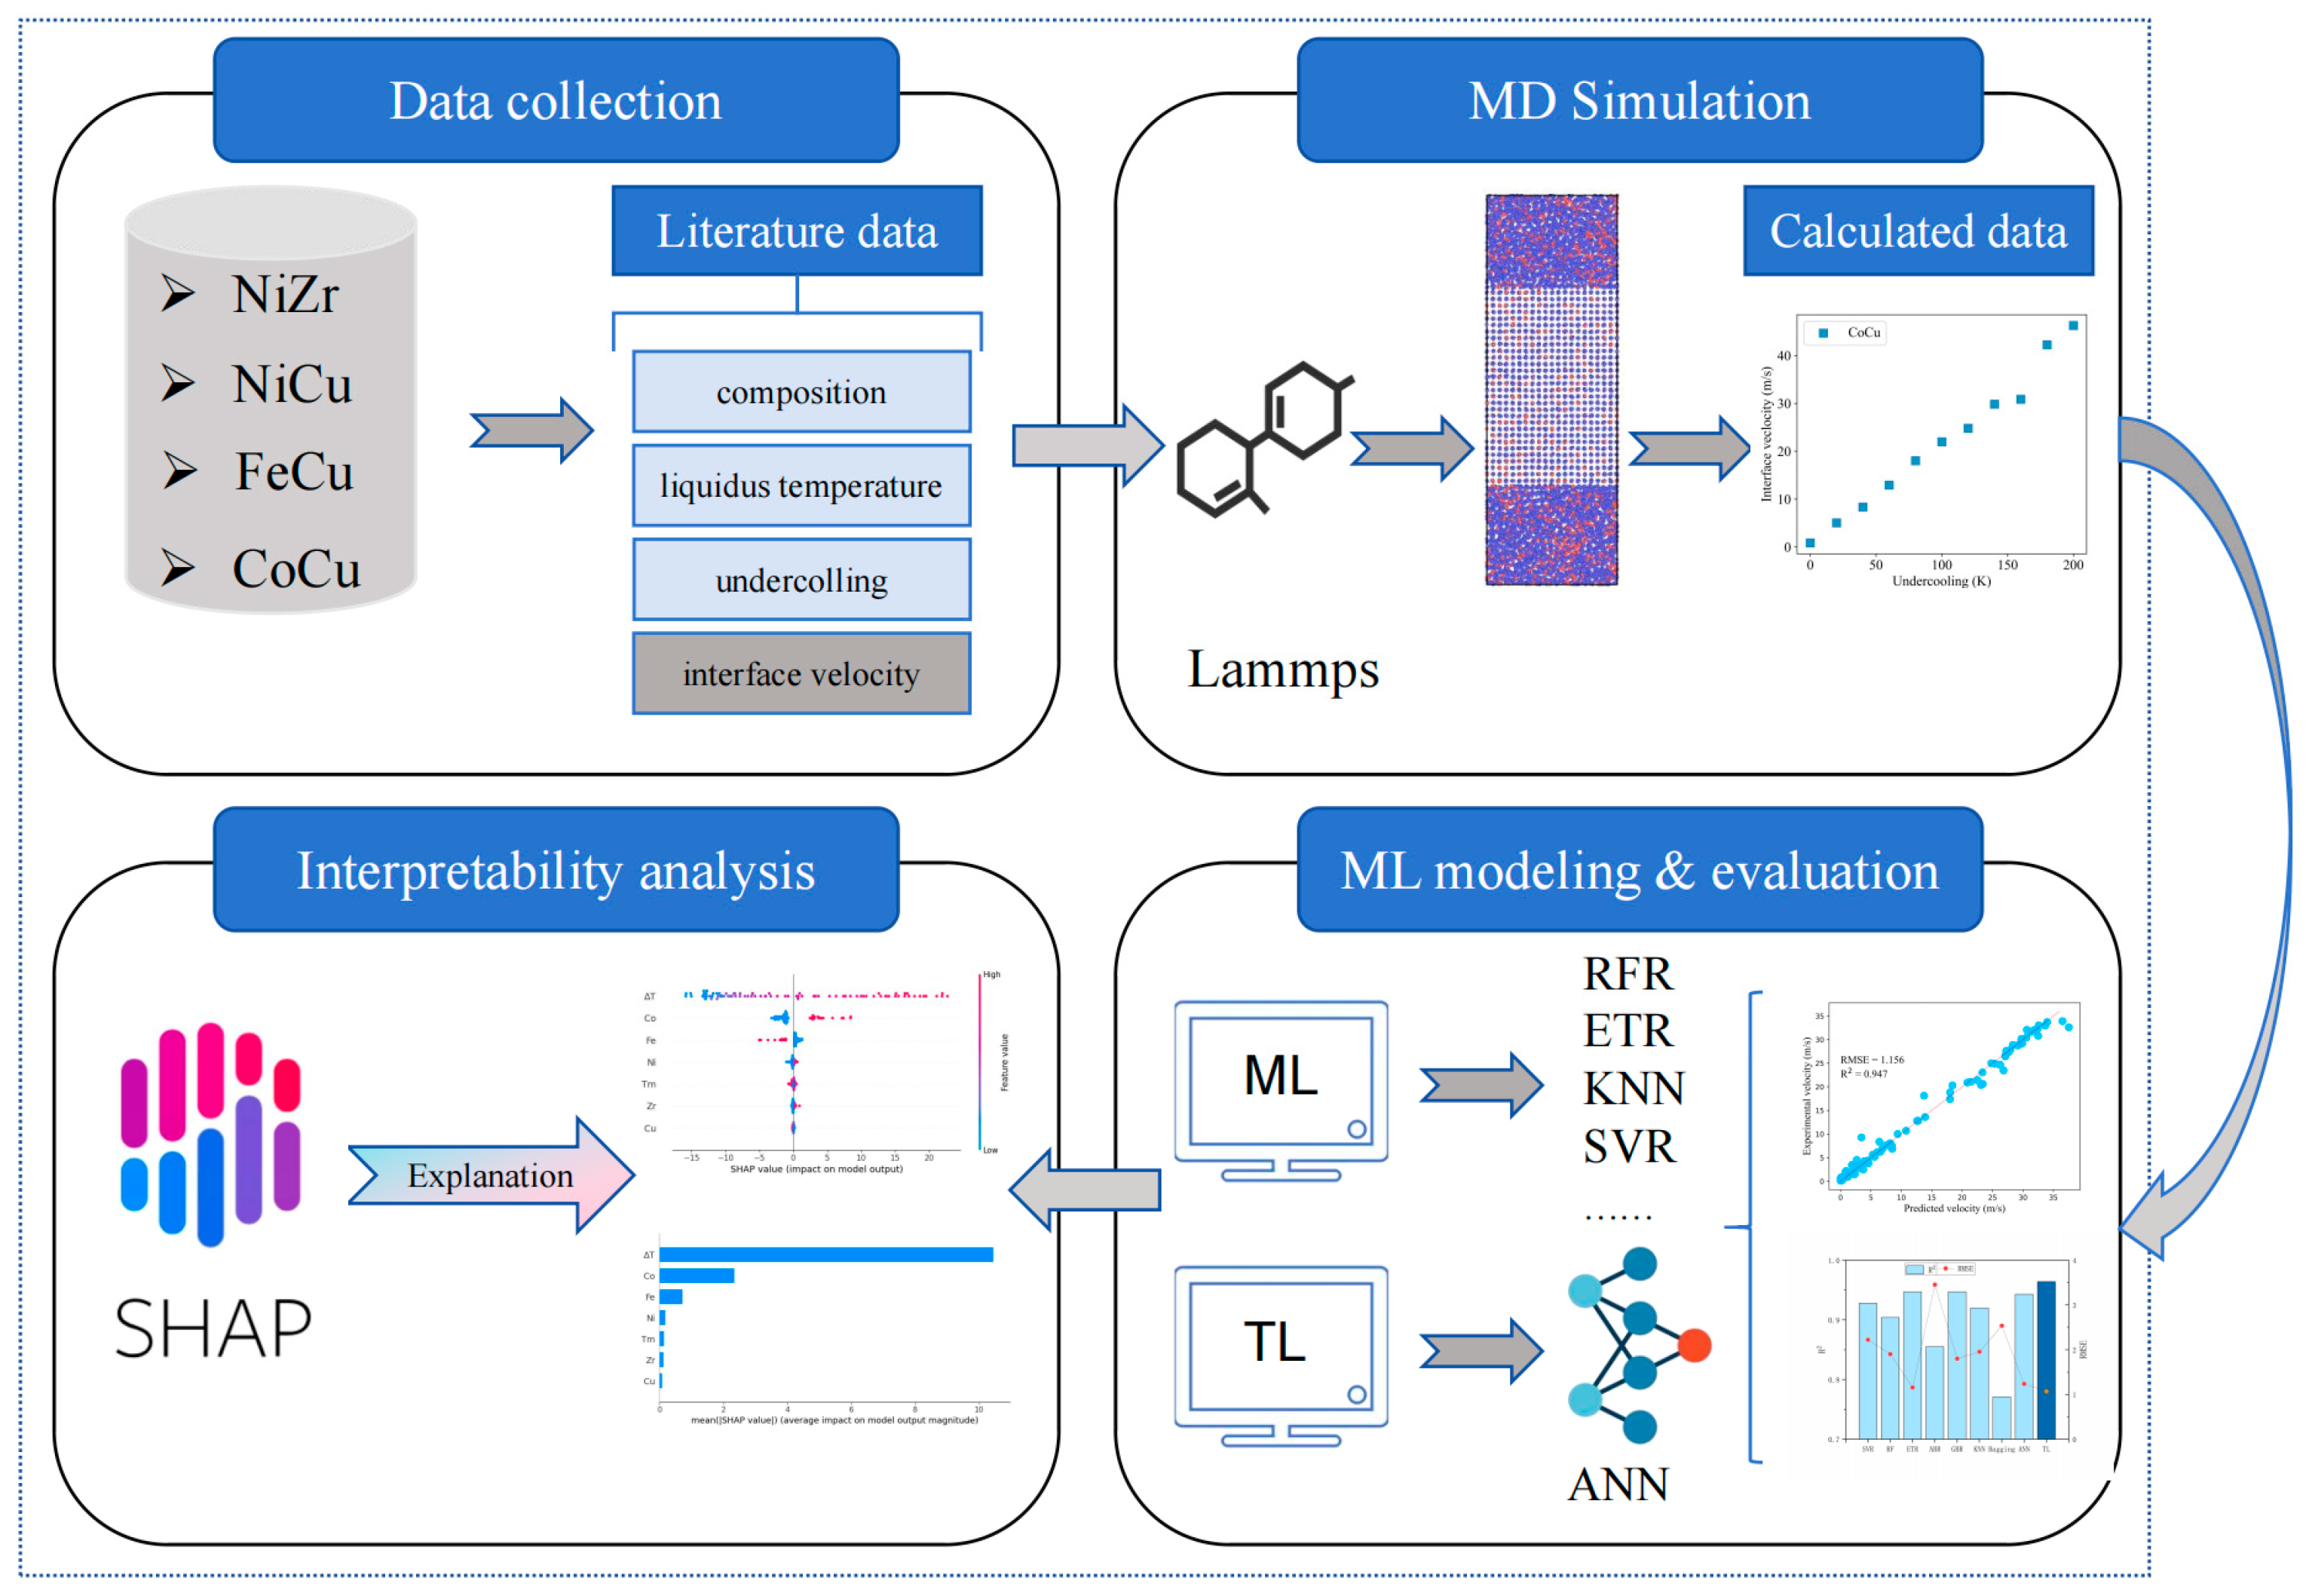
  • The solidification process of the four alloy systems was simulated via MD, and the corresponding interface velocity results demonstrated a similar trend to the collected experimental data.
  • For both interpolation and extrapolation, the TL model, which is driven by both physical information and experimental data, demonstrates superior performance compared to the ML models, which rely solely on experimental data. Especially for the extrapolation prediction of an alloy system, its constituent elements are not fully included in the experimental data used to train the ML models.
  • Interpretability analysis revealed the importance ranking of features and demonstrated the way in which features affect the model prediction. By comparing the interpretability analyses of the ML models only driven by experimental data and the TL model, it is concluded that the data calculated by MD improve the way features work in the TL model by introducing physical information indirectly.
In summary, an ML framework integrating MD computation and a TL model has been successfully constructed to predict the interface velocity of binary alloys. It possesses significant application value not only for predicting alloy interface velocities but also for other material research scenarios characterized by limited experimental data. This framework is anticipated to offer robust technical support for the advancement of various fields.

Supplementary Materials

The following supporting information can be downloaded at: https://www.mdpi.com/article/10.3390/cryst15050484/s1, Figure S1: Feature importance bar charts for the global interpretability of interface velocity prediction in CoCu system for the (a) ETR model and (b) TL model; Figure S2: SHAP summary plots for the global interpretability of interface velocity prediction in CoCu system for the (a) ETR model and (b) TL model; Table S1: Possible values of different hyper-parameters for ML algorithms; Table S2: Optimum parameters used for ANN; Table S3: Bayesian tuning takes the average of the results from 100 different parameter combinations; Table S4: Atomic ratio in solid and liquid phases of NiCu system during undercooled solidification at 20 K.

Author Contributions

J.W.: conceptualization, data curation, formal analysis, investigation, methodology, software, validation, visualization, writing—original draft, writing—review, and editing. M.Z.: conceptualization, data curation, formal analysis, investigation, methodology, software, validation, visualization, writing—original draft. S.L. (Shuai Li): conceptualization, data curation, formal analysis, investigation, methodology, software, validation, visualization, writing—original draft. S.L. (Shu Li): Conceptualization, formal analysis, funding acquisition, investigation, methodology, project administration, resources, supervision, validation, writing—original draft, writing—review and editing. All authors have read and agreed to the published version of the manuscript.

Funding

This work was supported by the National Natural Science Foundation of China (Nos. 51671075 and 51971086) and the Natural Science Foundation of Heilongjiang Province of China (No. LH2022E081).

Data Availability Statement

The data that support the findings of this study are available from the corresponding author upon reasonable request.

Acknowledgments

We acknowledge the National Natural Science Foundation of China and the Natural Science Foundation of Heilongjiang Province of China.

Conflicts of Interest

The authors declare no conflicts of interest.

References

  1. Kurz, W.; Rappaz, M.; Trivedi, R. Progress in modelling solidification microstructures in metals and alloys. Part II: Dendrites from 2001 to 2018. Int. Mater. Rev. 2021, 66, 30–76. [Google Scholar] [CrossRef]
  2. Alexandrov, D.V.; Galenko, P.K. A review on the theory of stable dendritic growth. Phil. Trans. A 2021, 379, 20200325. [Google Scholar] [CrossRef] [PubMed]
  3. Alexandrov, D.V.; Galenko, P.K. The Mullins–Sekerka theory: 60 years of morphological stability. J. Appl. Phys. 2024, 136, 055103. [Google Scholar] [CrossRef]
  4. Mullins, W.W.; Sekerka, R.F. Stability of a planar interface during solidification of a dilute binary alloy. J. Appl. Phys. 1964, 35, 444–451. [Google Scholar] [CrossRef]
  5. Galenko, P.K.; Phanikumar, G.; Funke, O.; Chernova, L.; Reutzel, S.; Kolbe, M.; Herlach, D.M. Dendritic solidification and fragmentation in undercooled Ni–Zr alloys. Mater. Sci. Eng. 2007, 449, 649–653. [Google Scholar] [CrossRef]
  6. Hoyt, J.J.; Asta, M. Atomistic computation of liquid diffusivity, solid-liquid interfacial free energy, and kinetic coefficient in Au and Ag. Phys. Rev. B 2002, 65, 214106. [Google Scholar] [CrossRef]
  7. Sun, D.Y.; Asta, M.; Hoyt, J.J. Kinetic coefficient of Ni solid-liquid interfaces from molecular-dynamics simulations. Phys. Rev. B 2004, 69, 024108. [Google Scholar] [CrossRef]
  8. Sun, D.Y.; Asta, M.; Hoyt, J.J. Crystal-melt interfacial free energies and mobilities in fcc and bcc Fe. Phys. Rev. B 2004, 69, 174103. [Google Scholar] [CrossRef]
  9. Hoyt, J.J.; Asta, M.; Sun, D.Y. Molecular dynamics simulations of the crystal–melt interfacial free energy and mobility in Mo and V. Philos. Mag. 2006, 86, 3651–3664. [Google Scholar] [CrossRef]
  10. Ashkenazy, Y.; Averback, R.S. Atomic mechanisms controlling crystallization behaviour in metals at deep undercoolings. Europhys. Lett. 2007, 79, 26005. [Google Scholar] [CrossRef]
  11. Xia, Z.G.; Sun, D.Y.; Asta, M.; Hoyt, J.J. Molecular dynamics calculations of the crystal-melt interfacial mobility for hexagonal close-packed Mg. Phys. Rev. B—Condens. Matter Mater. Phys. 2007, 75, 012103. [Google Scholar] [CrossRef]
  12. Ashkenazy, Y.; Averback, R.S. Kinetic stages in the crystallization of deeply undercooled body-centered-cubic and face-centered-cubic metals. Acta Mater. 2010, 58, 524–530. [Google Scholar] [CrossRef]
  13. Fang, T.; Wang, L.; Qi, Y. Molecular dynamics simulation of crystal growth of undercooled liquid Co. Phys. B Condens. Matter. 2013, 423, 6–9. [Google Scholar] [CrossRef]
  14. Sun, G.; Xu, J.; Harrowell, P. The mechanism of the ultrafast crystal growth of pure metals from their melts. Nat. Mater. 2018, 17, 881–886. [Google Scholar] [CrossRef]
  15. Wu, L.; Zhu, Y.; Wang, H.; Li, M. Crystal–melt interface kinetic behaviors of iron. AIP Adv. 2021, 11, 035241. [Google Scholar] [CrossRef]
  16. Hu, G.; Wu, L.; Ren, Z.; Shi, J.; Li, Y.; Xu, B.; Luo, C. olecular dynamic calculation of solidification kinetic coefficient of metallic γ metallic uranium. J. Nucl. Mater. 2022, 559, 153369. [Google Scholar] [CrossRef]
  17. Zhao, Y. Understanding and design of metallic alloys guided by phase-field simulations. npj Comput. Mater. 2023, 9, 94. [Google Scholar] [CrossRef]
  18. Reuther, K.; Rettenmayr, M. Perspectives for cellular automata for the simulation of dendritic solidification–A review. Comput. Mater. Sci. 2014, 95, 213–220. [Google Scholar] [CrossRef]
  19. Pal, P.; Abhishek, G.S.; Karagadde, S. A Monte Carlo approach to simulate dendritic microstructures during binary alloy solidification. Modell. Simul. Mater. Sci. Eng. 2020, 28, 085001. [Google Scholar] [CrossRef]
  20. Chan, W.L.; Averback, R.S.; Cahill, D.G.; Ashkenazy, Y. Solidification velocities in deeply undercooled silver. Phys. Rev. Lett. 2009, 102, 095701. [Google Scholar] [CrossRef]
  21. Mendelev, M.I.; Rahman, M.J.; Hoyt, J.J.; Asta, M. Molecular-dynamics study of solid–liquid interface migration in fcc metals. Modell. Simul. Mater. Sci. Eng. 2010, 18, 074002. [Google Scholar] [CrossRef]
  22. Ramakrishnan, R.; Phanikumar, G.; Sankarasubramanian, R. Crystal–Melt Interface Growth Velocity of Ni–Zr Alloys Through Molecular Dynamics Simulations. Trans. Ind. Inst. Met. 2015, 68, 1113–1117. [Google Scholar] [CrossRef]
  23. Kavousi, S.; Novak, B.R.; Zaeem, M.A.; Moldovan, D. Combined molecular dynamics and phase field simulation investigations of crystal-melt interfacial properties and dendritic solidification of highly undercooled titanium. Comp. Mater. Sci. 2019, 163, 218–229. [Google Scholar] [CrossRef]
  24. Rozas, R.E.; Orrego, J.L.; Toledo, P.G. Interfacial properties and crystal growth of Ni and Ni50Al50 from molecular dynamics simulations. J. Appl. Phys. 2023, 133, 214701. [Google Scholar] [CrossRef]
  25. Cui, D.; Zhang, J.; Li, X.; Liang, Z.; Zhang, X.; Yang, Y.; Wang, H. Atomistic insights into sluggish crystal growth in an undercooled CoNiCrFe multi-principal element alloy. J. Alloys Compd. 2023, 941, 168881. [Google Scholar] [CrossRef]
  26. Han, X.J.; Chen, M.; Guo, Z.Y. A molecular dynamics study for the thermophysical properties of liquid Ti–Al alloys. Int. J. Thermophys. 2005, 26, 869–880. [Google Scholar] [CrossRef]
  27. Wang, X.L.; Dong, Y.; Mohr, M.; Fecht, H.J.; Wang, X.D.; Cao, Q.P.; Zhang, D.X.; Dai, Z.W.; Jiang, J.Z. Correlation between viscosity and local atomic structure in liquid Zr56Co28Al16 alloy. Microgravity Sci. Technol. 2022, 34, 10. [Google Scholar] [CrossRef]
  28. Agrawal, A.; Choudhary, A. Perspective: Materials informatics and big data: Realization of the “fourth paradigm” of science in materials science. Apl Mater. 2016, 4, 053208. [Google Scholar] [CrossRef]
  29. Johnston, D.C. The puzzle of high temperature superconductivity in layered iron pnictides and chalcogenides. Adv. Phys. 2010, 59, 803–1061. [Google Scholar] [CrossRef]
  30. Saal, J.E.; Kirklin, S.; Aykol, M.; Meredig, B.; Wolverton, C. Materials design and discovery with high-throughput density functional theory: The open quantum materials database (OQMD). JOM 2013, 65, 1501–1509. [Google Scholar] [CrossRef]
  31. Li, S.; Li, S.; Liu, D.; Zou, R.; Yang, Z. Hardness prediction of high entropy alloys with machine learning and material descriptors selection by improved genetic algorithm. Comp. Mater. Sci. 2022, 205, 111185. [Google Scholar] [CrossRef]
  32. Yang, Z.; Li, S.; Li, S.; Yang, J.; Liu, D. A two-step data augmentation method based on generative adversarial network for hardness prediction of high entropy alloy. Comp. Mater. Sci. 2023, 220, 112064. [Google Scholar] [CrossRef]
  33. Li, S.; Li, S.; Liu, D.; Yang, J.; Zhang, M. Hardness prediction of high entropy alloys with periodic table representation of composition, processing, structure and physical parameters. J. Alloys Compd. 2023, 967, 171735. [Google Scholar] [CrossRef]
  34. Li, J.; Xie, B.; Fang, Q.; Liu, B.; Liu, Y.; Liaw, P.K. High-throughput simulation combined machine learning search for optimum elemental composition in medium entropy alloy. J. Mater. Sci. Technol. 2021, 68, 70–75. [Google Scholar] [CrossRef]
  35. Huang, W.; Martin, P.; Zhuang, H.L. Machine-learning phase prediction of high-entropy alloys. Acta Mater. 2019, 169, 225–236. [Google Scholar] [CrossRef]
  36. Wang, Y.; Li, S.; Li, S.; Chen, M. Prediction, interpretation and extrapolation for shear modulus and bulk modulus of solid-state electrolytes based on machine learning. Mater. Today Commun. 2024, 38, 108294. [Google Scholar] [CrossRef]
  37. Zhang, Z.; Wang, Y.; Li, S.; Li, S.; Chen, M. Interpretable Machine Learning Prediction of Voltage and Specific Capacity for Electrode Materials. Adv. Theory Simul. 2024, 7, 2400227. [Google Scholar] [CrossRef]
  38. Goud, V.S.; Rahul, M.R.; Phanikumar, G. Prediction of growth velocity of undercooled multicomponent metallic alloys using a machine learning approach. Scr. Mater. 2022, 207, 114309. [Google Scholar] [CrossRef]
  39. Wang, X.; Li, S.; Liu, F. Modeling for free dendrite growth based on physically-informed machine learning method. Scr. Mater. 2024, 242, 115918. [Google Scholar] [CrossRef]
  40. Galenko, P.K.; Danilov, D.A. Local nonequilibrium effect on rapid dendritic growth in a binary alloy melt. Phys. Lett. A 1977, 235, 271–280. [Google Scholar] [CrossRef]
  41. Galenko, P.K.; Danilov, D.A. Model for free dendritic alloy growth under interfacial and bulk phase nonequilibrium conditions. J. Cryst. Growth 1999, 197, 992–1002. [Google Scholar] [CrossRef]
  42. Jiang, L.; Zhang, Z.; Hu, H.; He, X.; Fu, H.; Xie, J. A rapid and effective method for alloy materials design via sample data transfer machine learning. npj Comput. Mater. 2023, 9, 26. [Google Scholar] [CrossRef]
  43. Zhou, C.; Yuan, R.; Su, B.; Fan, J.; Tang, B.; Zhang, P.; Li, J. Creep rupture life prediction of high-temperature titanium alloy using cross-material transfer learning. J. Mater. Sci. Technol. 2024, 178, 39–47. [Google Scholar] [CrossRef]
  44. Galenko, P.K.; Kolbe, M.; Herlach, D.M.; Rettenmayr, M. Kinetics of dendrite growth and dendritic fragmentation in theundercooled Co81. 2Cu18. 8 alloy’smelt. Metall. Res. Technol. 2014, 111, 295–303. [Google Scholar] [CrossRef]
  45. Galenko, P.K.; Reutzel, S.; Herlach, D.M.; Danilov, D.; Nestler, B. Modelling of dendritic solidification in undercooled dilute Ni–Zr melts. Acta Mater. 2007, 55, 6834–6842. [Google Scholar] [CrossRef]
  46. Herlach, D.M. Non-equilibrium solidification of undercooled metallic metls. Mater. Sci. Eng. R Rep. 1994, 12, 177–272. [Google Scholar] [CrossRef]
  47. Xia, Z.C.; Wang, W.L.; Luo, S.B.; Wei, B. Specific heat capacity and dendritic growth kinetics of liquid peritectic Fe-Cu alloys. Chem. Phys. Lett. 2016, 658, 220–223. [Google Scholar] [CrossRef]
  48. Rahul, M.R.; Samal, S.; Phanikumar, G. Metastable microstructures in the solidification of undercooled high entropy alloys. J. Alloys Compd. 2020, 821, 153488. [Google Scholar] [CrossRef]
  49. Plimpton, S. Fast parallel algorithms for short-range molecular dynamics. J. Comput. Phys. 1995, 117, 1–19. [Google Scholar] [CrossRef]
  50. Wilson, S.R.; Mendelev, M.I. Anisotropy of the solid–liquid interface properties of the Ni–Zr B33 phase from molecular dynamics simulation. Philos. Mag. 2015, 95, 224–241. [Google Scholar] [CrossRef]
  51. Howells, C.A.; Mishin, Y. Angular-dependent interatomic potential for the binary Ni–Cr system. Modell. Simul. Mater. Sci. Eng. 2018, 26, 085008. [Google Scholar] [CrossRef]
  52. Lee, B.J.; Wirth, B.D.; Shim, J.H.; Kwon, J.; Kwon, S.C.; Hong, J.H. Modified embedded-atom method interatomic potential for the Fe-Cu alloy system and cascade simulations on pure Fe and Fe-Cu alloys. Phys. Rev. B 2005, 71, 184205. [Google Scholar] [CrossRef]
  53. Wang, J.; Oh, S.H.; Lee, B.J. Second-nearest-neighbor modified embedded-atom method interatomic potential for Cu-M (M=Co, Mo) binary systems. Comput. Mater. Sci. 2020, 178, 109627. [Google Scholar] [CrossRef]
  54. Steinhardt, P.J.; Nelson, D.R.; Ronchetti, M. Bond-orientational order in liquids and glasses. Phys. Rev. B 1983, 28, 784. [Google Scholar] [CrossRef]
  55. Lechner, W.; Dellago, C. Accurate determination of crystal structures based on averaged local bond order parameters. J. Chem. Phys. 2008, 129, 114707. [Google Scholar] [CrossRef]
  56. Hosna, A.; Merry, E.; Gyalmo, J.; Alom, Z.; Aung, Z.; Azim, M.A. Transfer learning: A friendly introduction. J. Big Data 2022, 9, 102. [Google Scholar] [CrossRef]
  57. Perez, M. Gibbs–Thomson effects in phase transformations. Scr. Mater. 2005, 52, 709. [Google Scholar] [CrossRef]
Figure 1. Flowchart of this work.
Crystals 15 00484 g001
Figure 2. Experimental data of interface velocity as a function of undercooling [44,45,46,47].
Crystals 15 00484 g002
Figure 3. Typical starting configuration for free solidification simulation (projected on XZ plane system: Co81.2Cu18.8, where Co atoms are represented as blue and Cu atoms are represented as red).
Crystals 15 00484 g003
Figure 4. Average atomic order parameter ( q ¯ 6 ) of each layer in CoCu alloy system at t = 0.
Crystals 15 00484 g004
Figure 5. TL framework of this work.
Crystals 15 00484 g005
Figure 6. Evolution of liquid–solid interface position during crystal growth of NiZr alloy under undercooling condition of 100 K.
Crystals 15 00484 g006
Figure 7. Relationship between calculated interface velocity and undercooling for (a) CoCu, (b) NiZr, (c) NiCu, and (d) FeCu.
Crystals 15 00484 g007
Figure 8. Interpolation prediction results of different models.
Crystals 15 00484 g008
Figure 9. The 10-fold cross-validation results of the (a) ETR model and (b) TL model in the interpolation case.
Crystals 15 00484 g009
Figure 10. Comparison of TL model and best ML model based on pure experimental data for extrapolation prediction RMSE.
Crystals 15 00484 g010
Figure 11. Feature importance bar charts for the global interpretability of interface velocity in the (a) ETR model and (b) TL model.
Crystals 15 00484 g011
Figure 12. SHAP summary plots for the global interpretability of interface velocity prediction in the (a) ETR model and (b) TL model.
Crystals 15 00484 g012
Table 1. Ten-fold cross-validation of R2 scores and RMSE results using various ML models and TL model.
SVRRFETRABRGBRKNNBaggingANNTL
R20.9280.9040.9470.8550.9470.9200.7710.9430.964
RMSE2.2221.9011.1563.4531.8001.9542.5341.2361.068
Table 2. Extrapolation prediction performance R2 (RMSE) of different ML models for four alloys.
NiZrNiCuFeCuCoCu
SVR0.508 (7.704)−2.839 (11.636)0.034 (13.224)0.598 (7.684)
RF0.950 (2.448)0.801 (5.180)0.580 (8.716)0.390 (9.467)
ETR0.907 (3.342)0.940 (2.839)0.707 (7.285)0.566 (7.982)
ABR0.887 (3.687)0.755 (5.758)0.658 (7.870)0.535 (8.265)
GBR0.954 (2.349)0.851 (4.488)0.562 (8.901)0.278 (10.297)
KNN0.418 (8.378)0.519 (8.065)0.770 (6.447)0.628 (7.391)
Bagging0.919 (3.115)0.793 (5.290)0.562 (8.901)0.508 (8.501)
ANN0.938 (2.716)0.879 (4.036)0.623 (8.257)0.635 (7.315)
TL0.956 (2.286)0.969 (2.032)0.961 (2.649)0.930 (3.205)
Disclaimer/Publisher’s Note: The statements, opinions and data contained in all publications are solely those of the individual author(s) and contributor(s) and not of MDPI and/or the editor(s). MDPI and/or the editor(s) disclaim responsibility for any injury to people or property resulting from any ideas, methods, instructions or products referred to in the content.

