3.1. Analysis of XRD and TEM-EDS Characterization Results of Ag-Doped Molecularly Imprinted TiO2
Figure 1 illustrates several overlapping XRD diffraction peaks between MIP-Ag-TiO
2 and Ag-TiO
2 within the 20° to 90° range. When plotting the absorption peaks from the PDF#21-1272 standard anatase colorimetric card as dashed lines and comparing them with the XRD patterns of MIP-TiO
2 and TiO
2, it is evident that both exhibit consistent XRD diffraction peaks on the {101}, {004}, {105}, and {211} crystal planes, indicating that the primary component is anatase [
14]. Additionally, MIP-TiO
2 and TiO
2 display peaks on the {110} crystal plane, suggesting that some anatase has converted to the rutile phase [
15,
16]. The findings indicate that silver doping significantly retards the transformation of anatase into the rutile phase in MIP-TiO
2. Ag-related diffraction peaks are not seen in XRD, which may be due to the fact that Ag is doped at 1%, which is lower than 5% and difficult to recognize. According to the calculation results of JADE 6.0 software, the calculated grain sizes of TiO
2, MIP-TiO
2, Ag-TiO
2, and MIP-Ag-TiO
2 are 39.38 nm, 37.33 nm, 29.12 nm, and 21.61 nm, respectively. MIP-Ag-TiO
2 has the smallest grain size, and it is close to 20 nm, so it has a better nano-size effect.
As shown in
Figure 2a–c, the morphology of MIP-Ag-TiO
2 was examined using transmission electron microscopy (TEM), revealing that the material consists of nanoparticles interconnected within a size range of 200 nm.
Figure 2b presents the statistical size distribution of 100 randomly chosen particles from
Figure 2a, indicating that the catalyst particles predominantly have diameters between 10 and 40 nm. This suggests a nano-restricted domain effect that enhances the catalytic reaction’s efficiency [
17,
18]. Additionally, the TEM-EDS mapping shown in
Figure 2d–g indicates a uniform distribution of the elements Ti, O, and Ag on the catalyst’s surface, aligning with the profiles observed in the original TEM images and corroborating the findings from the XRD analysis.
3.2. Performance Analysis of Different Catalysts for SA Degradation
To assess the material’s adsorption capacity, adsorption isothermal experiments were conducted in the dark before the photocatalytic reaction, with the results presented in
Figure 3a. The findings indicated that various photocatalysts achieved adsorption equilibrium within 30 min, revealing a limited dark adsorption effect. This can be attributed to the catalysts’ lower adsorption capacity and quicker desorption rates. A high adsorption capacity could lead to the catalyst being surrounded by organic matter, which would disrupt the reaction’s continuity [
19,
20]. In contrast, weaker and faster adsorption characteristics are more beneficial for maintaining an effective photocatalytic reaction. The physical and chemical adsorption of SA by TiO
2, MIP-TiO
2, Ag-TiO
2, and MIP-Ag-TiO
2 was minimal under stable pH and temperature conditions, leading to the decision not to conduct further dark adsorption tests in upcoming experiments.
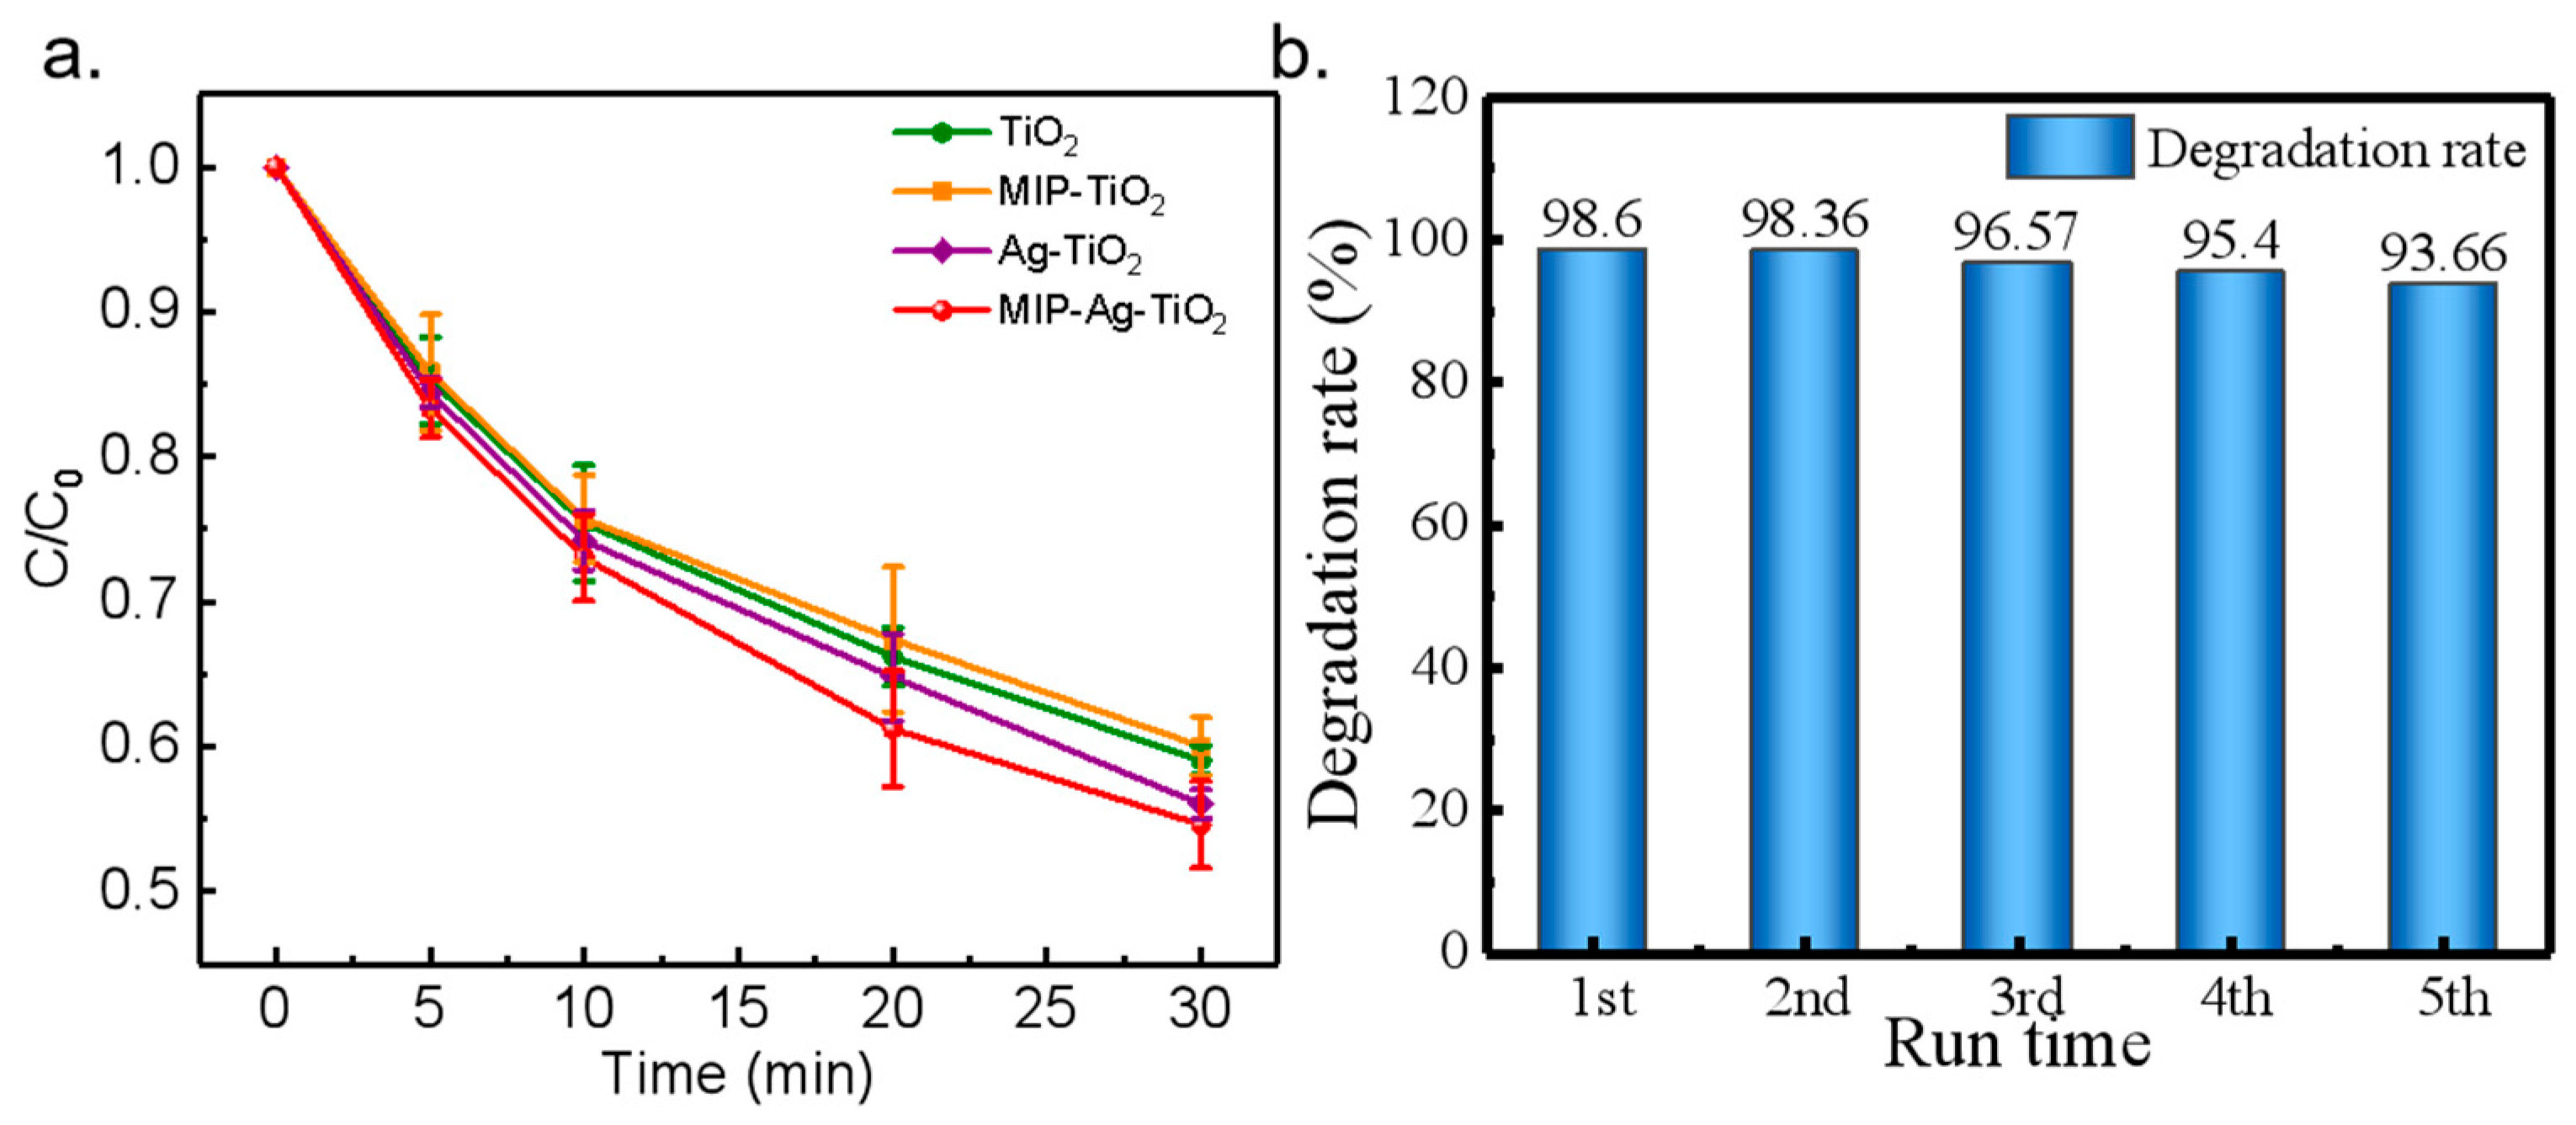
In
Figure 3b, it is evident that the four photocatalysts—TiO
2, MIP-TiO
2, Ag-TiO
2, and MIP-Ag-TiO
2—achieved degradation rates of 49.12%, 63.51%, 94.04%, and 98.60% of SA within 30 min, respectively. The findings indicate that the catalytic performance of silver-doped TiO
2 was significantly improved following surface modification. This improvement is likely linked to the unique spatial structure, the presence of numerous specific functional groups, the distinctive mesoporous structure, and the increased specific surface area of MIP-Ag-TiO
2 [
21]. Furthermore, an optimal level of Ag doping can effectively capture holes on the TiO
2 surface, thereby reducing the recombination of photogenerated carriers and further boosting photocatalytic activity [
22,
23].
As shown in
Table 1, the fitted R
2 values of the first-stage reaction kinetics of the four catalysts were all greater than 0.9 or above, which exhibited better fitting results, indicating that they all conformed to the photocatalytic first-stage reaction kinetics.
Figure 3c shows that the absolute values of the rate constants for TiO
2 and MIP-TiO
2 are relatively close to each other, at 0.1663 and 0.2463, respectively. The rate constant for MIP-Ag-TiO
2 is significantly higher, at 0.6998, which is an enhancement of 3.2-fold with respect to TiO
2.
As shown in
Figure 3d–f, the effects of different influencing factors on the performance of the photocatalysts were explored according to the principle of the controlled variable method. The results showed that the optimal degradation rate of SA reached 98.6% when the molar ratio of tetra-n-butyl titanate to the template molecule was 5:1, the calcination temperature was 550 °C (2 h), and the doping amount of Ag was 1% (molar ratio). The photocatalytic performance of the catalysts exhibited an initial increase followed by a decrease as the amount of Ag doping varied, with the highest performance observed at 1% doping. This indicates that the photocatalytic efficiency of MIP-Ag-TiO
2 is significantly influenced by different levels of Ag doping under consistent calcination temperature conditions. Variations in Ag amounts may alter the catalysts’ microstructure and phase distributions, which can greatly impact their catalytic performance. Additionally, the quantity of imprinted molecules is crucial to the photocatalytic characteristics of MIP-Ag-TiO
2. Different molecular weights of these imprinted molecules can modify the number of selectively recognized active sites on the catalyst’s surface, thereby influencing its catalytic effectiveness [
24].
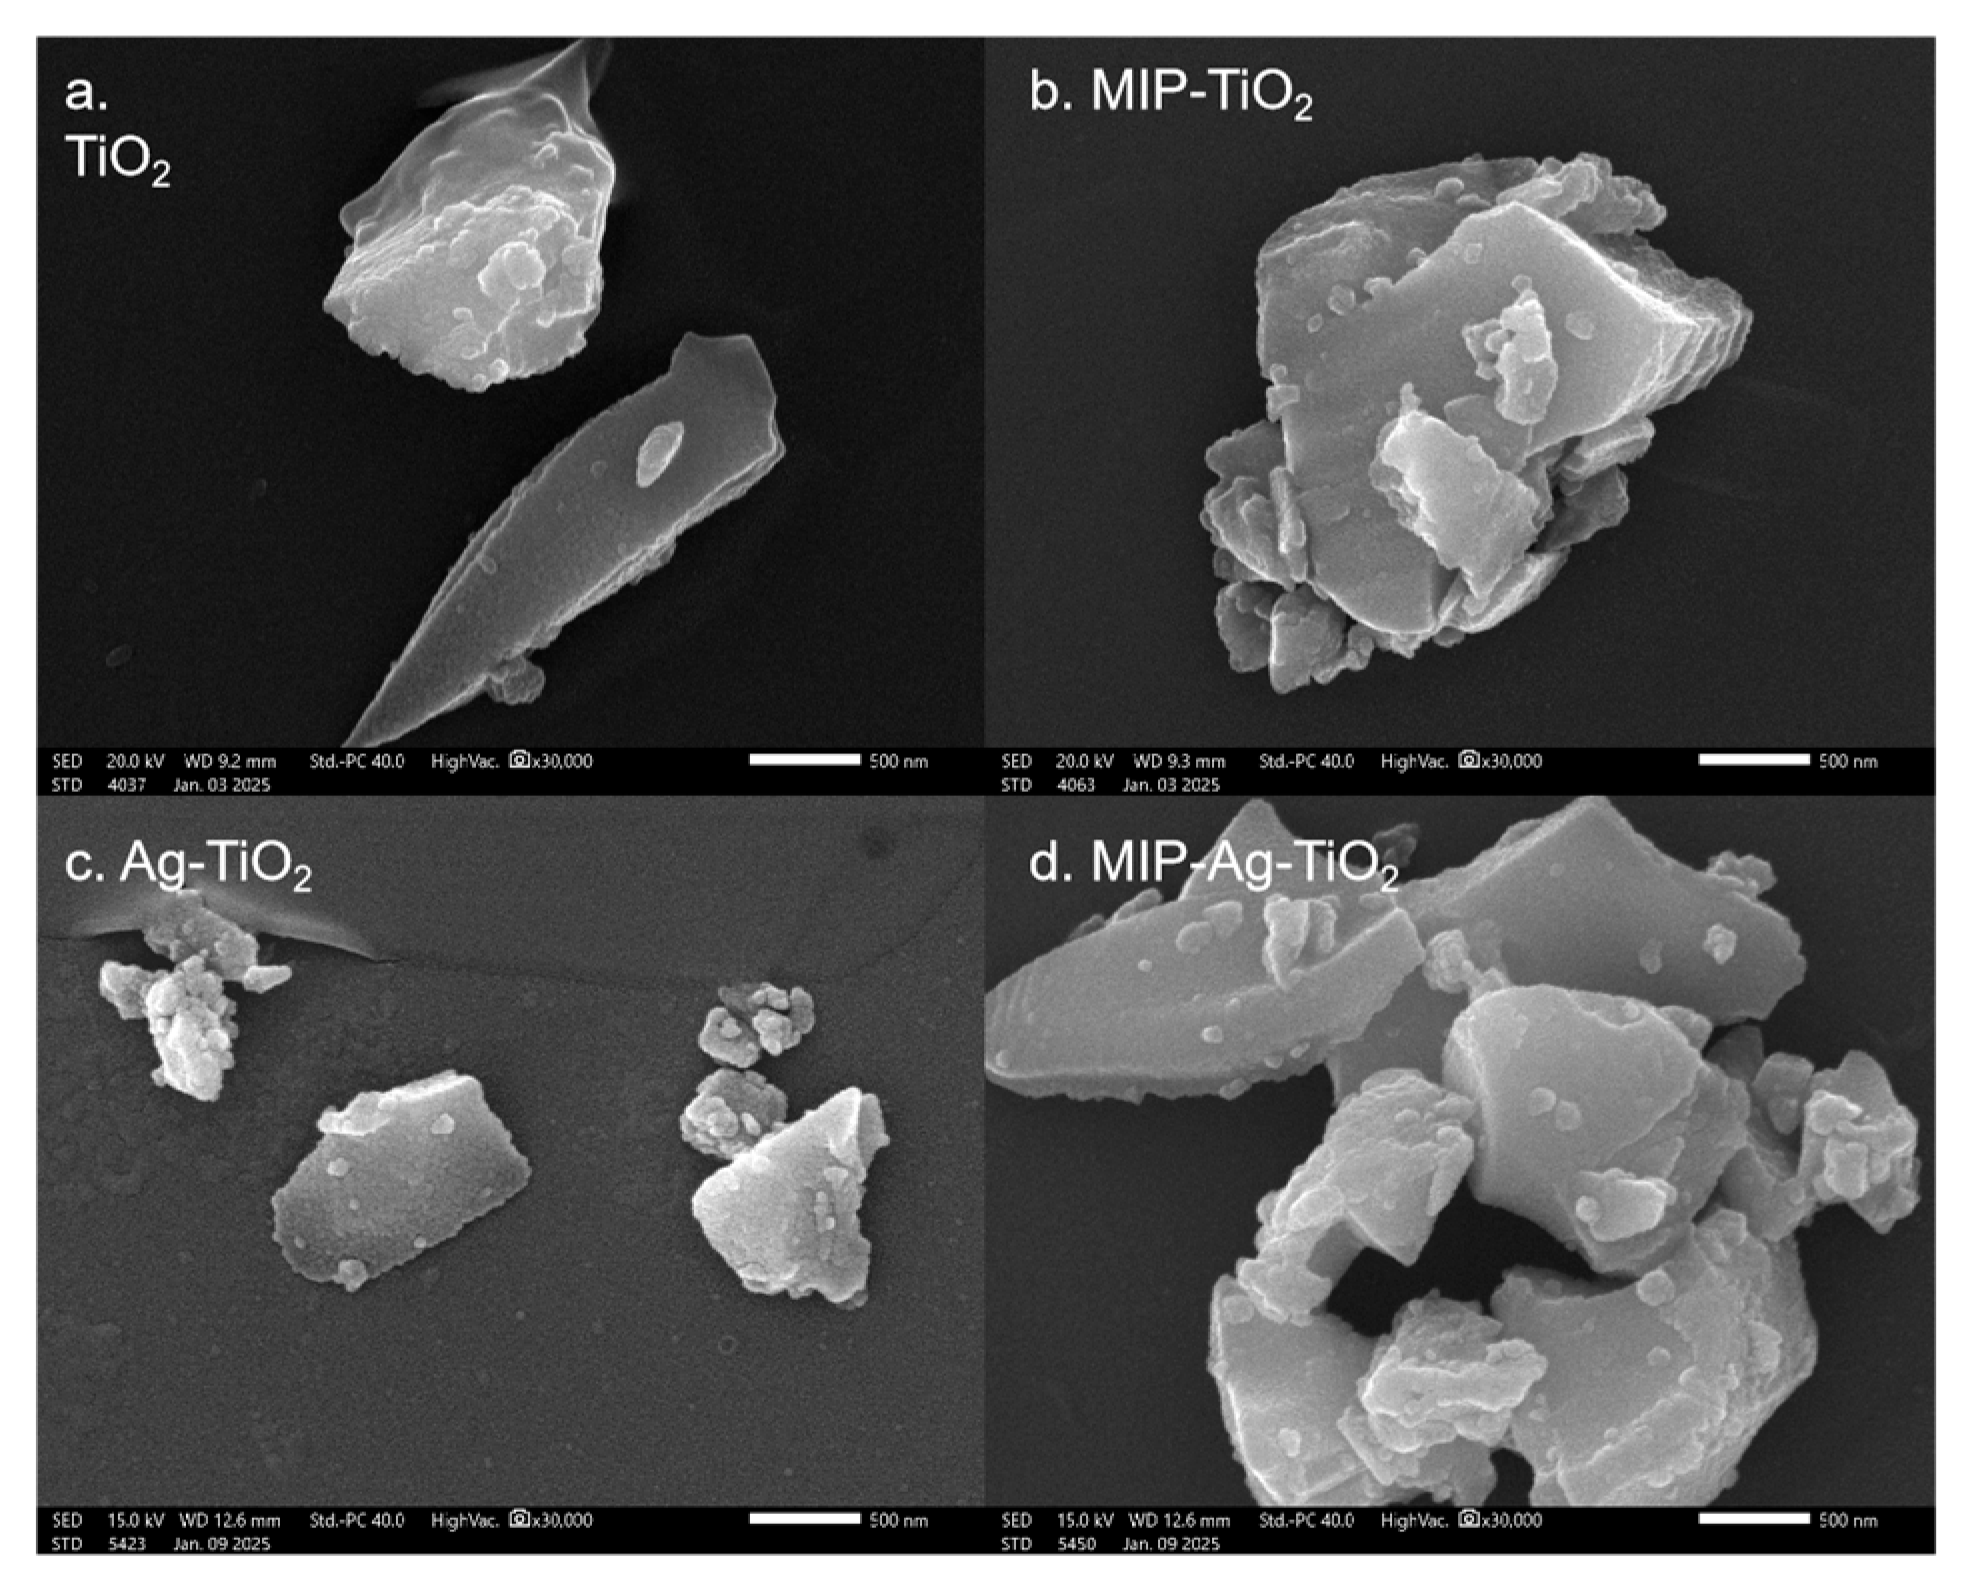
In
Figure 4a–d, it can be seen that the particles of TiO
2, MIP-TiO
2, Ag-TiO
2, and MIP-Ag-TiO
2 are at the nanoscale but show a degree of agglomeration. As can be seen from the SEM, the material appears micron-sized (>3 microns). This level of agglomeration may be closely linked to the challenges in controlling the morphology during its synthesis [
25,
26].
There is a clear relationship between the nano-size effect of MIP-Ag-TiO
2 and its specific surface area, which is why BET specific surface area characterization experiments were conducted in this research.
Figure 5 illustrates the nitrogen adsorption–desorption curves for TiO
2, MIP-TiO
2, Ag-TiO
2, and MIP-Ag-TiO
2. The data show that all four catalysts exhibit a distinct H3-type adsorption hysteresis loop, indicating a significant presence of mesoporous structures within these materials [
27]. Based on IUPAC classification for mesoporous materials, all of them fit the characteristics of a Langmuir-type IV curve, confirming their classification as mesoporous materials [
28,
29]. By integrating the results from XRD analysis with observations from photocatalytic experiments, it can be inferred that smaller grain sizes correlate with enhanced photocatalytic activity. Since MIP-Ag-TiO
2 has a smaller grain size and a larger specific surface area compared to TiO
2, its ability to adsorb pollutant molecules is significantly improved, thereby boosting its effectiveness in the photocatalytic degradation of organic matter.
Meanwhile, the BET specific surface areas of the four catalysts were 5.04 m2/g, 9.29 m2/g, 24.73 m2/g, and 24.67 m2/g, respectively, and the results showed that Ag doping significantly increased the specific surface area of TiO2, and this improvement helped to enhance its photocatalytic performance. The specific surface area of MIP-Ag-TiO2 (24.67 m2/g) was significantly enhanced compared with that of pure TiO2 (5.04 m2/g), and its mesoporous structure (average pore size of 7.03 nm) matched with the size of pollutant molecules, which enhanced the adsorption capacity and mass transfer efficiency. Combined with the XRD results, the decrease in grain size and the increase in specific surface area together increased the density of surface active sites, promoting the effective utilization of photogenerated carriers. In addition, the multiple light scattering effect of the mesoporous structure enhances the light trapping ability, which synergistically optimizes the charge separation efficiency and ultimately achieves the enhancement of the degradation performance.
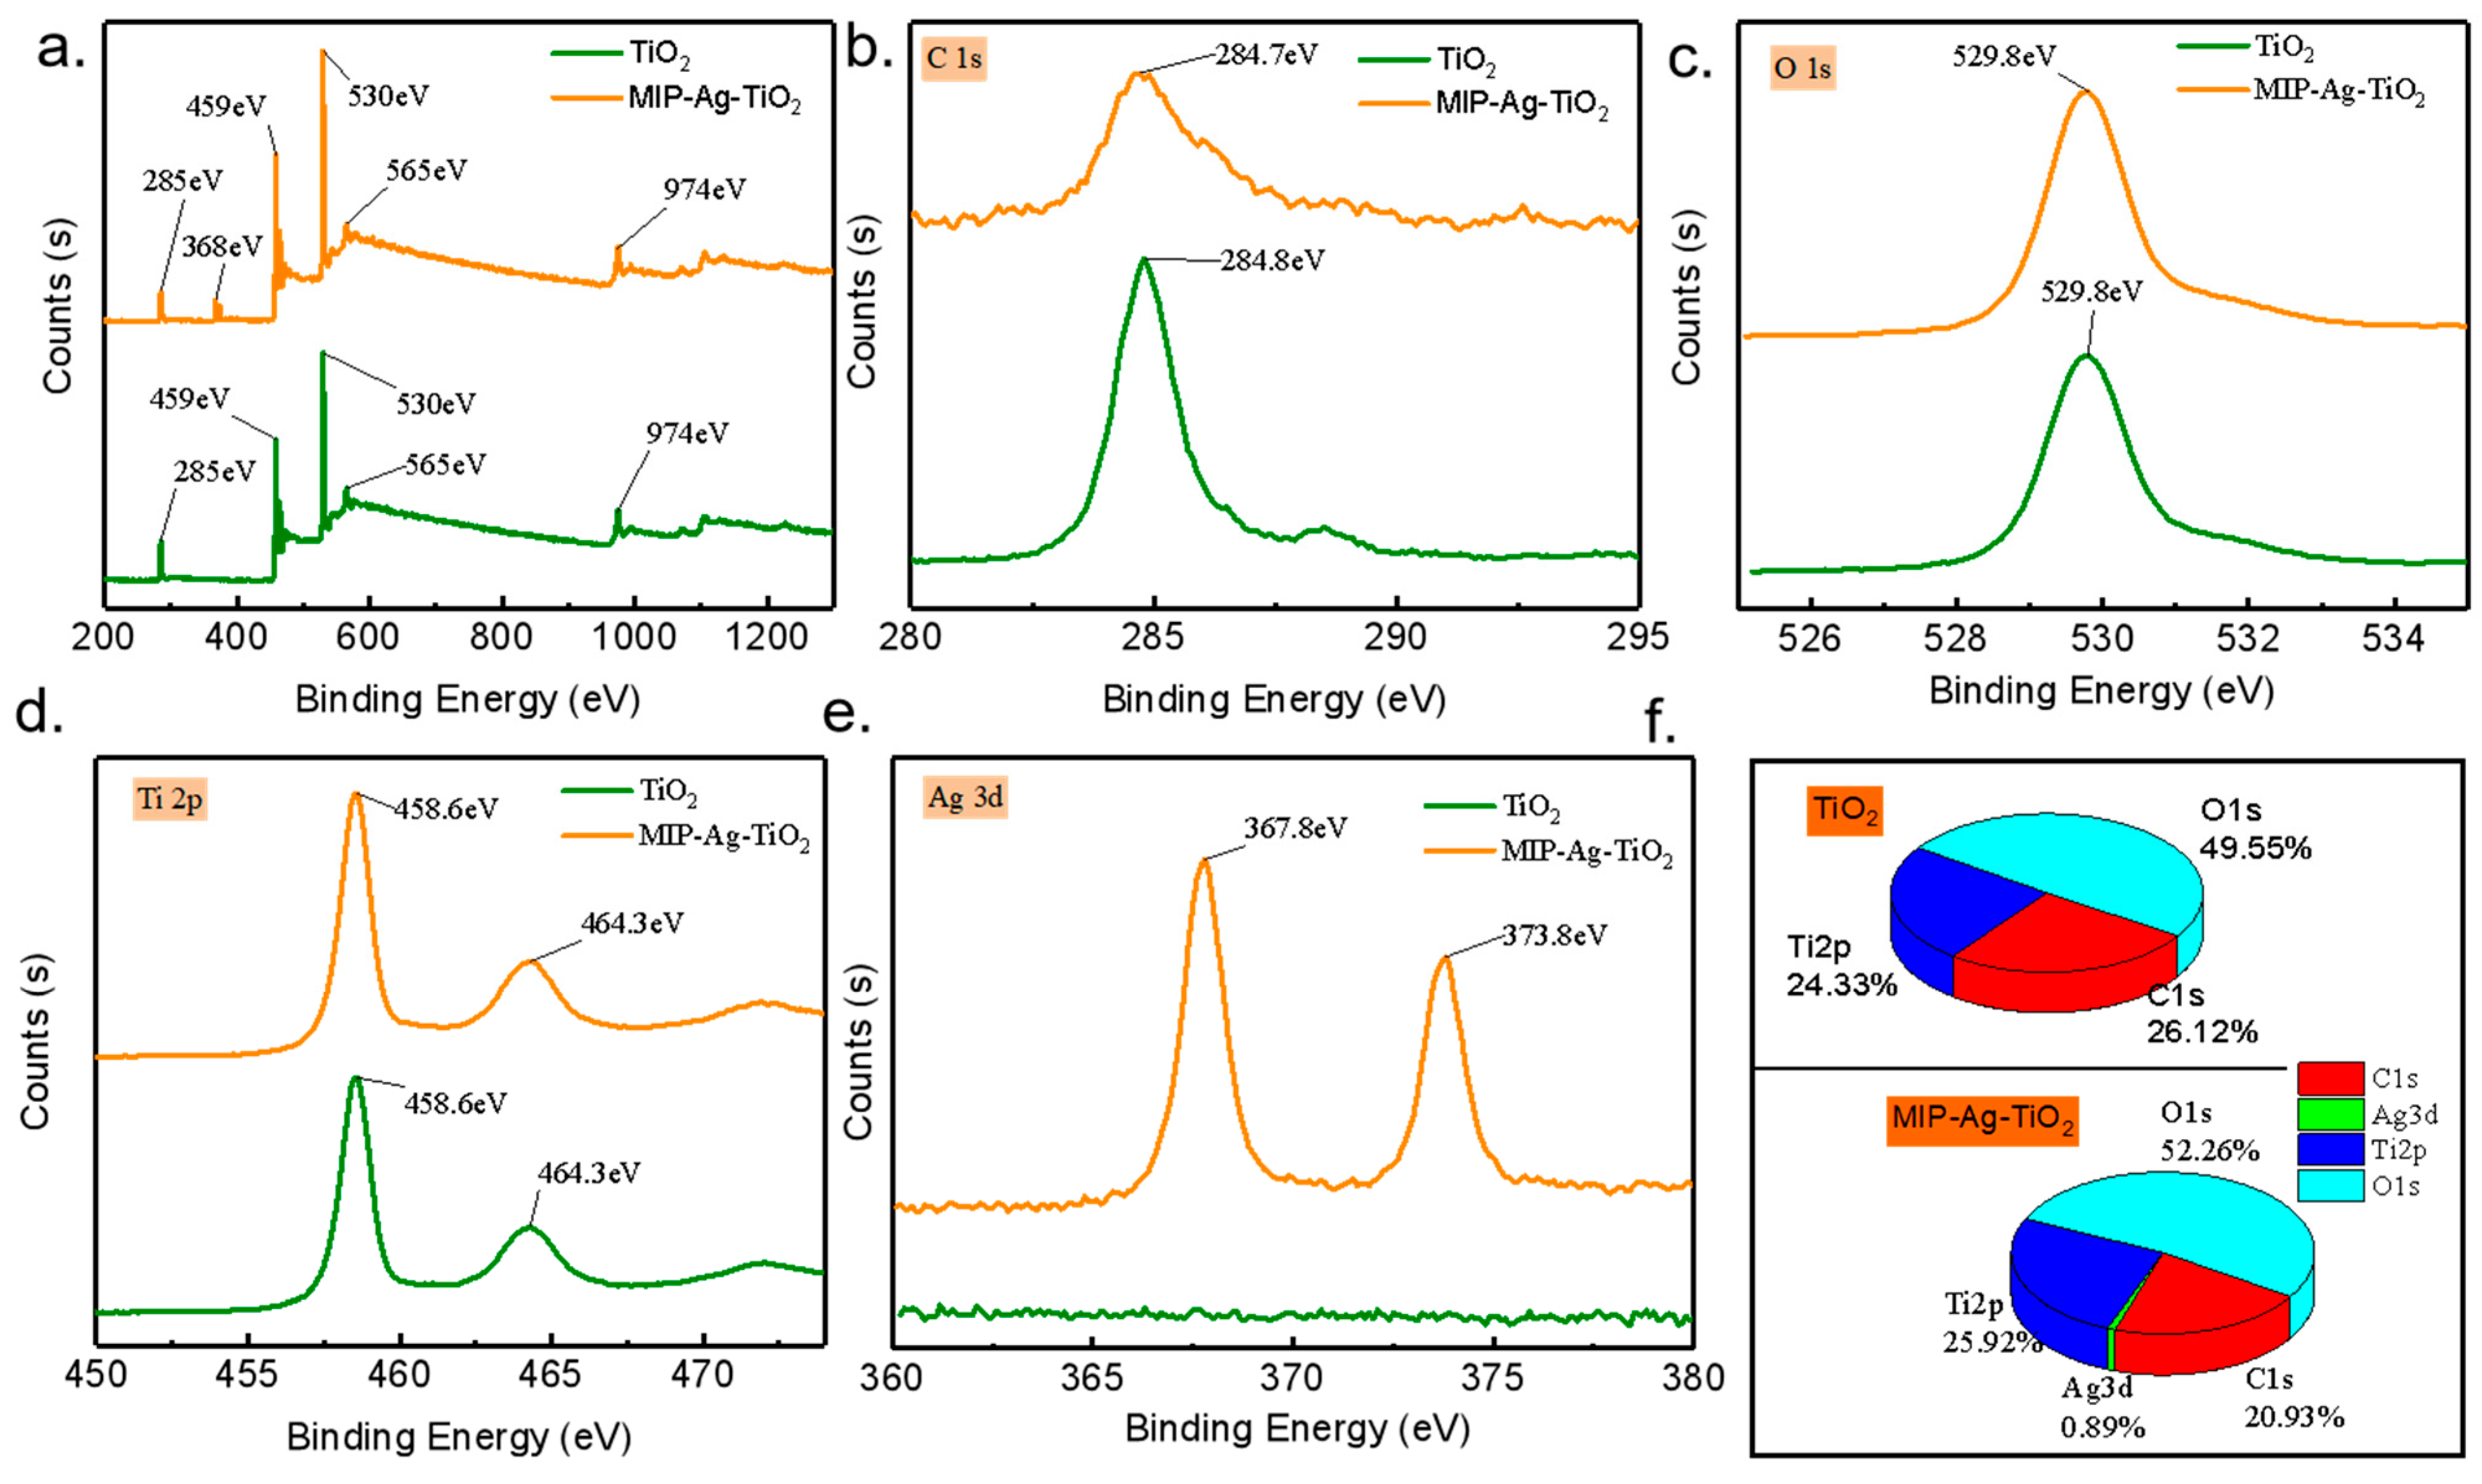
XPS analysis provides a detailed examination of the surface elemental composition and charge states of the synthesized catalysts.
Figure 6a–f present the XPS spectra for MIP-Ag-TiO
2 compared to TiO
2. The spectra reveal that MIP-Ag-TiO
2 exhibits an additional characteristic absorption peak for Ag, indicating successful doping of Ag into MIP-Ag-TiO
2. Additionally, as illustrated in
Figure 6a, both catalysts show significant elemental C signals in their full XPS spectra, likely due to the introduction of elemental C for instrument calibration during testing. The elemental content analysis in
Figure 6f indicates that the atomic percentages of Ti, Ag, O, and C in MIP-Ag-TiO
2 are 25.92%, 0.89%, 52.26%, and 20.93%, respectively, while TiO
2 has atomic proportions of Ti, O, and C at 24.33%, 49.55%, and 26.12%. These findings not only confirm the successful doping of Ag but also provide crucial data on elemental distribution for optimizing catalyst performance and further understanding their potential photocatalytic activities. Ag 3D high-resolution spectra show binding energies located at 367.8 eV (Ag 3d5/2) and 373.8 eV (Ag 3d3/2), indicating that silver coexists in a metallic state (Ag⁰) and a small amount in an oxidized state (Ag
2O). The localized surface plasmon resonance effect of the Ag⁰ nanoparticles significantly enhances the visible absorption (as confirmed by the UV-Vis DRS redshift), while the surface Ag
2O can act as an electron trap to promote the migration of photogenerated electrons from the TiO
2 conduction band to Ag and inhibit carrier complexation (62% reduction in PL intensity). In addition, Ag doping led to a negative shift of the Ti 2p binding energy by 0.3 eV (
Figure 6c), indicating that the increased electron density on the TiO
2 surface, together with the oxygen vacancy formation (531.5 eV peak enhancement in the O 1s spectra), optimized the interfacial charge transfer efficiency and ultimately synergistically enhanced the photocatalytic degradation activity (3.2-fold enhancement in SA degradation rate).
The FT-IR spectral analysis shown in
Figure 7 indicates that the spectra of the four catalysts remained largely unchanged, suggesting that the SA molecules were completely eliminated after elution, leaving no residual organic groups on the surface of MIP-Ag-TiO
2. Notably, there were no vibrational absorption peaks in the 3000 to 3300 cm
−1 range, further confirming the absence of intact SA molecules in MIP-Ag-TiO
2. This finding is essential for evaluating the catalyst’s purity and removal efficiency. Additionally, the absorption peaks in the 500–1000 cm
−1 range of MIP-Ag-TiO
2 increased with higher SA concentrations, indicating a strengthened interaction through hydrogen bonds. This suggests that the presence of SA enhances the selective recognition of target pollutants by MIP-Ag-TiO
2, potentially boosting its photocatalytic degradation efficiency of SA. Thus, the FT-IR analysis not only validated the successful removal of SA but also highlighted how varying SA concentrations improved the catalyst’s recognition and degradation capabilities, providing a significant foundation for the advancement of more effective photocatalytic materials.
3.3. Photocatalytic Selectivity and Recyclability Analysis
To assess the selectivity of the catalysts, we selected phenol, which has a similar structure to the target pollutant SA, as a reference. TiO
2 was used as a control catalyst to examine the degradation effects of various catalysts on both SA and phenol, with the results presented in
Figure 8a. We define the selectivity coefficient R as the ratio of the kinetic rate constant of the target pollutant to that of the comparison pollutant. Furthermore, the ratio of the selectivity coefficient of the target catalyst to that of the control catalyst is termed the selectivity factor α.
The selectivity coefficient R and selectivity factor α were used to examine the selectivity of the catalysts. They were calculated as follows, respectively [
30]:
where
R and
α denote the selectivity coefficient and selectivity factor, respectively;
K1 and
K2 denote the kinetic parameters of the first-stage reaction for the degradation of target and non-target pollutants, respectively; and
RMIP and
RNIP denote the selectivity coefficients of molecularly imprinted (
MIP) and non-molecularly imprinted (
NIP) catalysts, respectively.
In assessing the photocatalytic efficiency of TiO2, we found that the kinetic rate constants for the first-order reactions in the degradation of SA and phenol were 0.166 and 0.131, respectively. This information enabled us to determine a selectivity coefficient R of 1.272, indicating that the catalyst exhibits a degree of selectivity towards SA. This finding implies that TiO2 can preferentially break down this specific pollutant.
The test results for MIP-TiO2 indicated a selectivity coefficient R of 1.950, demonstrating some selectivity in the degradation of SA. In contrast, MIP-Ag-TiO2 exhibited a selectivity coefficient R of 7.128, which is 3.66 times greater than that of MIP-TiO2. This notable enhancement suggests that the addition of silver enhances the selectivity of MIP-TiO2, giving MIP-Ag-TiO2 a greater capacity for degrading SA.
Moreover, the selectivity factor α of MIP-Ag-TiO
2 was measured at 5.645, significantly exceeding the threshold of 2 (see
Table 2). This finding reinforces the notion that MIP-Ag-TiO
2 exhibits considerable selectivity for SA, suggesting its superior effectiveness in addressing particular pollutants. Overall, these results demonstrate that MIP-Ag-TiO
2 not only has high selectivity but also significantly improves the degradation efficiency of SA, thereby strongly supporting its use in environmental remediation.
When the substances on the catalyst surface are not strongly chemisorbed, catalyst activity can typically be restored through simple water washing. However, if chemisorption or strong physisorption occurs, it may be necessary to use acid or alkali washing or other regeneration techniques to regain activity. In this research, MIP-Ag-TiO
2 demonstrated a low adsorption capacity, indicating that it did not establish a strong physical or chemical bond with SA. Consequently, the research team evaluated the reusability of the MIP-Ag-TiO
2 catalyst by washing and drying it, with the results presented in
Figure 8b.
The test results clearly show that the degradation rate of MIP-Ag-TiO
2 only decreased by 4.94% after being reused five times (
Figure 8b). This suggests that MIP-Ag-TiO
2 has excellent reusability for the photocatalytic degradation of SA pollutants. Its sustained catalytic performance not only enables the catalyst to remain highly efficient during repeated use but also helps lower operating costs and enhance economic efficiency in real-world applications. Consequently, the outstanding performance of MIP-Ag-TiO
2 indicates significant potential for application and promising prospects in the field of photocatalysis.
3.4. Effect of pH and Analysis of TOC Results
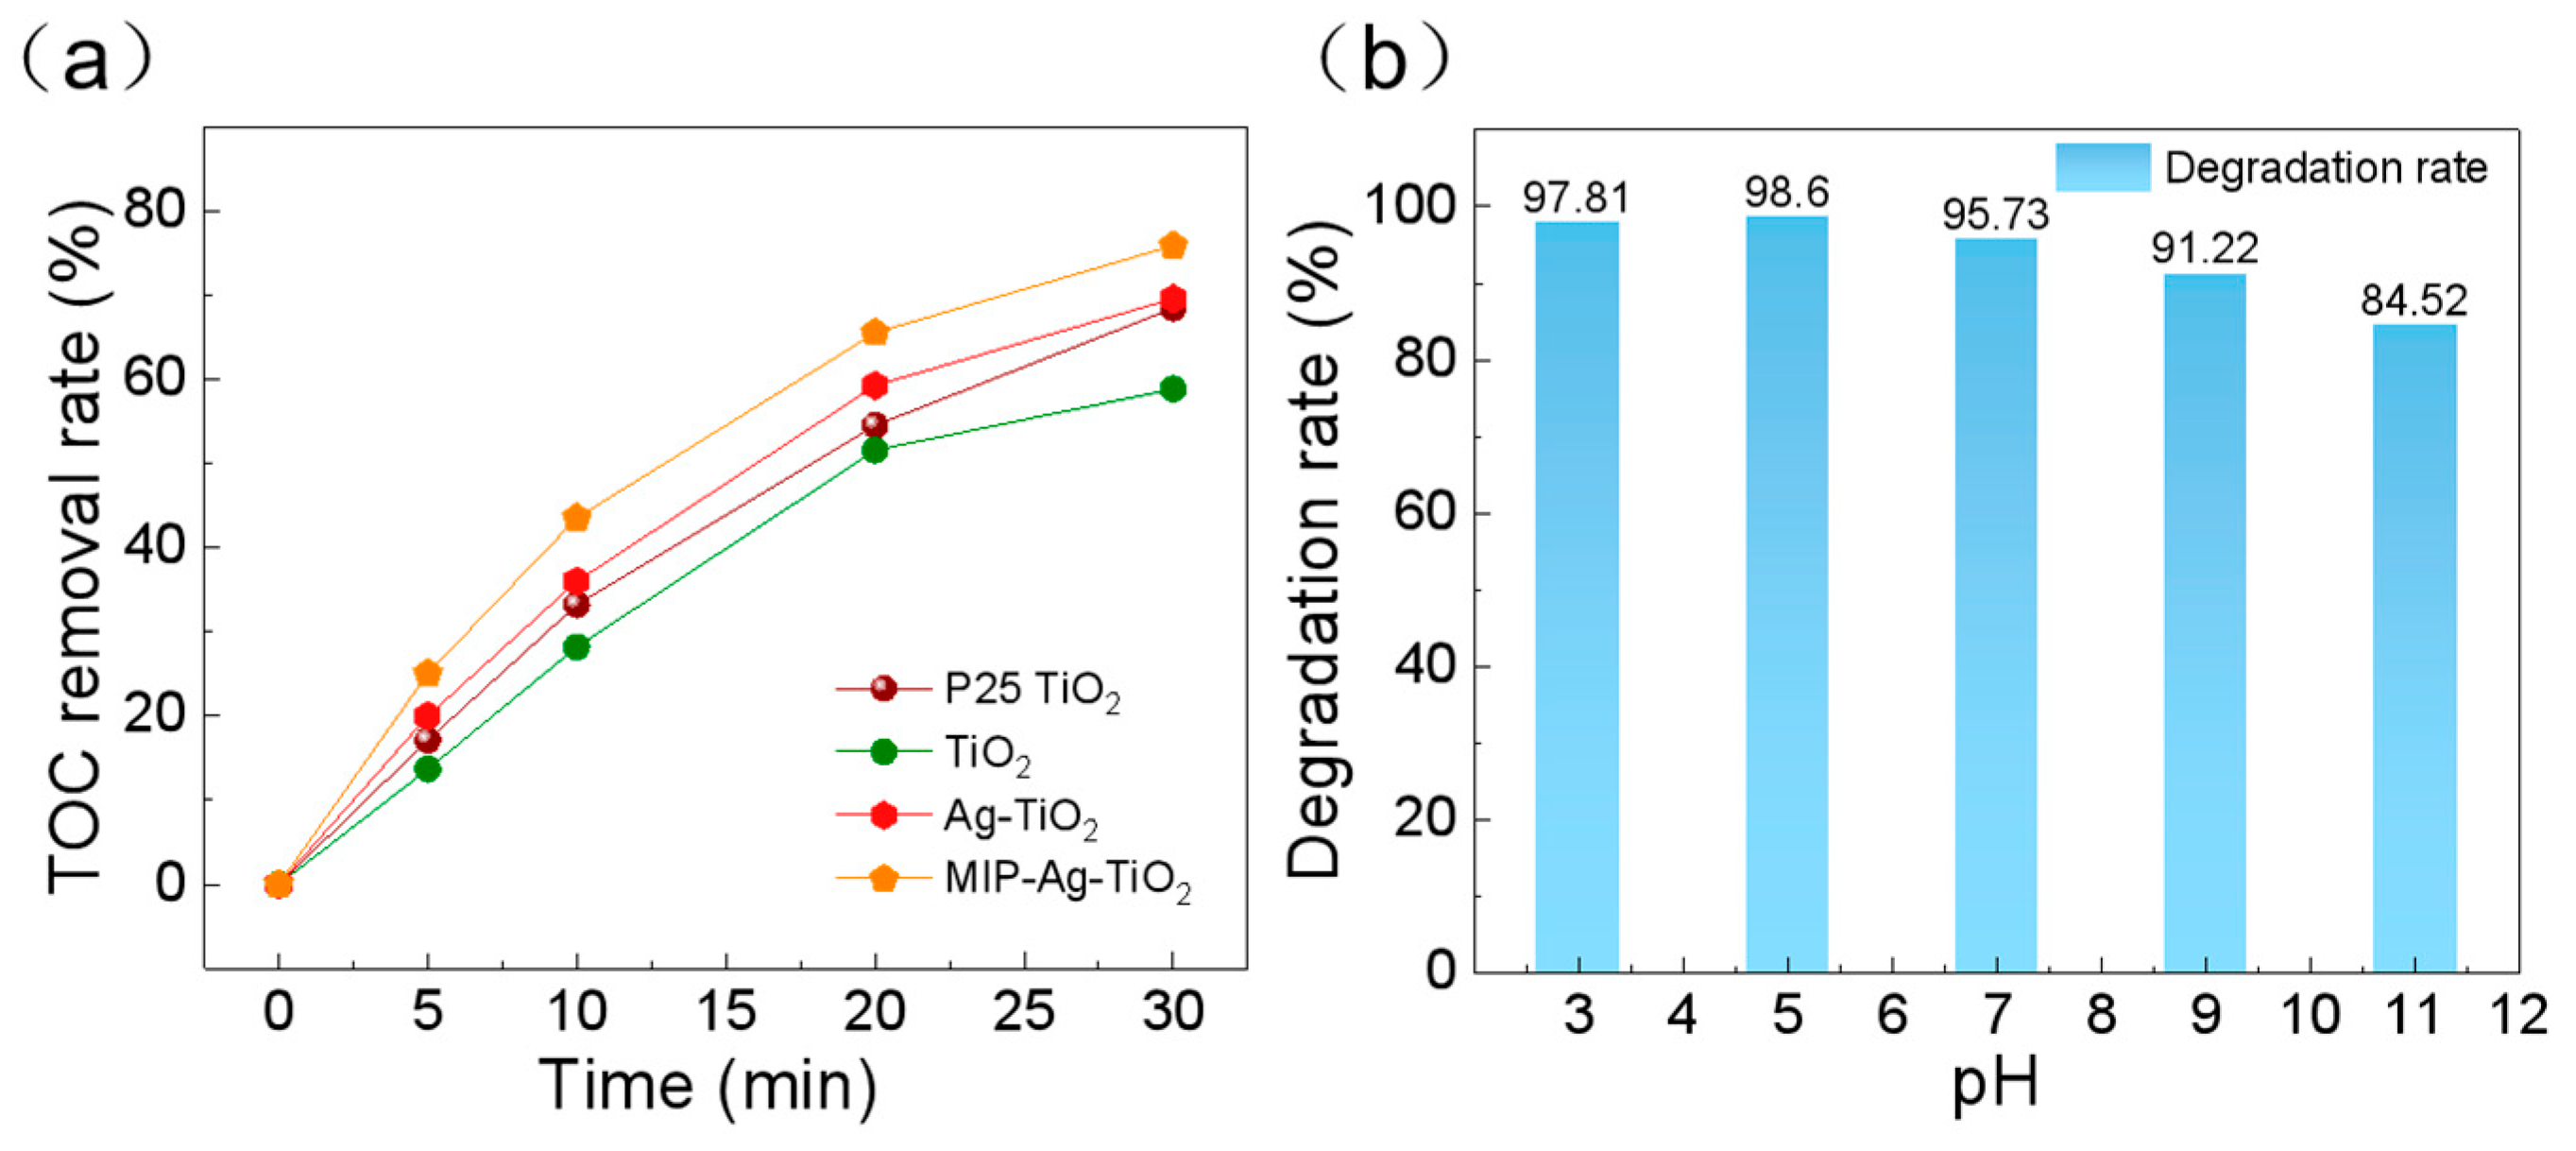
Based on the mineralization data of total organic carbon (TOC) during photocatalytic degradation (
Figure 9a), the mineralization efficiencies of the four groups of catalysts showed obvious gradient differences within 2 h. The mineralization efficiencies of the four groups of catalysts were significantly higher than those of the commercial P25 TiO
2. The commercial P25 TiO
2 exhibited a mineralization rate of 68.43%, which was significantly higher than that of normal TiO
2 (58.85%), attributed to its optimized anatase/rutile heterojunction structure, which could effectively inhibit photogenerated carrier complexation. The Ag nanoparticle-modified Ag-TiO
2 system elevated the mineralization rate to 69.56%. Notably, the significant enhancement of the mineralization rate over the simple degradation rate (a 10–15% gap usually exists in the literature) indicates that the system not only destroys the SA molecular structure but also further oxidizes the intermediates (e.g., benzene ring-opening products, short-chain carboxylic acids, etc.) to CO
2 and H
2O, which is attributed to the multi-stage pore structure in MIP-Ag-TiO
2.
As shown in
Figure 9b, the degradation efficiency of salicylic acid (SA) by the MIP-Ag-TiO
2 photocatalytic system showed a significant dependence on the solution pH. The removal of SA was enhanced from 97.81% to 98.6% in the range of strong to weak acidity (pH = 3~5), which reached the optimal reaction interval. This phenomenon can be attributed to the dynamic regulation of the charge state on the surface of the photocatalyst: when the pH is close to the isoelectric point of TiO
2 (pHpzc ≈ 6.2), the degree of protonation on the surface of the catalyst is increased, and the positively charged surface is more likely to adsorb the carboxylate anionic form of SA through electrostatic interaction (SA exists in the form of C
6H
4(OH)COO- at pH > 2.9), thus enhancing the interfacial mass transfer efficiency. Meanwhile, the acidic environment is beneficial to maintain the stability of Ag nanoparticles and avoid their oxidative deactivation, and H
+ as a trapping agent for holes (h
+) can inhibit the complexation of photogenerated carriers and promote the generation of -OH radicals.
However, the degradation efficiency decreased significantly from 95.73% to 84.52% when the solution was shifted to neutral to weakly alkaline conditions (pH = 7~11). This change involves multiple inhibitory mechanisms: first, the enhanced hydroxylation of the catalyst surface leads to increased electrostatic repulsion with SA anions and a decrease in the specific adsorption capacity; second, Ag may be partially converted to Ag2O under a high pH or may form [Ag(O)] with OH to in turn form [Ag(OH)2]-complexes, weakening its surface plasmon resonance effect; in addition, alkaline conditions alter the generation path of reactive oxygen species, and the superoxide radical (-O2−) is blocked by protonation (-O2− + H + → HO2−, pKa ≈ 4.8), leading to a decrease in their oxidizing capacity. Notably, deprotonation of SA molecules may occur at pH > 9 to generate bis-negative ions (C6H4(O-)COO-), whose spatial site-barrier effect with the catalyst surface and electron cloud repulsion further inhibit the degradation kinetics. This pH-responsive property differs from the behavior of typical TiO2-based photocatalysts reported in the literature and may originate from the modulation effect of the molecularly imprinted layer (MIP): the three-dimensional cavity structure of MIP enhances the recognition and adsorption of SA through hydrogen bonding and π–π interactions under acidic conditions, whereas deactivation of the binding sites occurs due to deprotonation of the functional groups in alkaline environments. This finding provides important guidance for practical wastewater treatment—by preadjusting the pH of the system to weakly acidic (pH ≈ 5), the surface properties of the catalyst, the pollutant adsorption efficiency, and the kinetics of radical generation can be optimized simultaneously to maximize the degradation efficacy.
3.5. Quenching Experiments and Analysis of EPR Results
In the field of photocatalytic degradation, it is crucial to deeply investigate the influence of active substances on the degradation efficiency. Taking the process of MIP-Ag-TiO
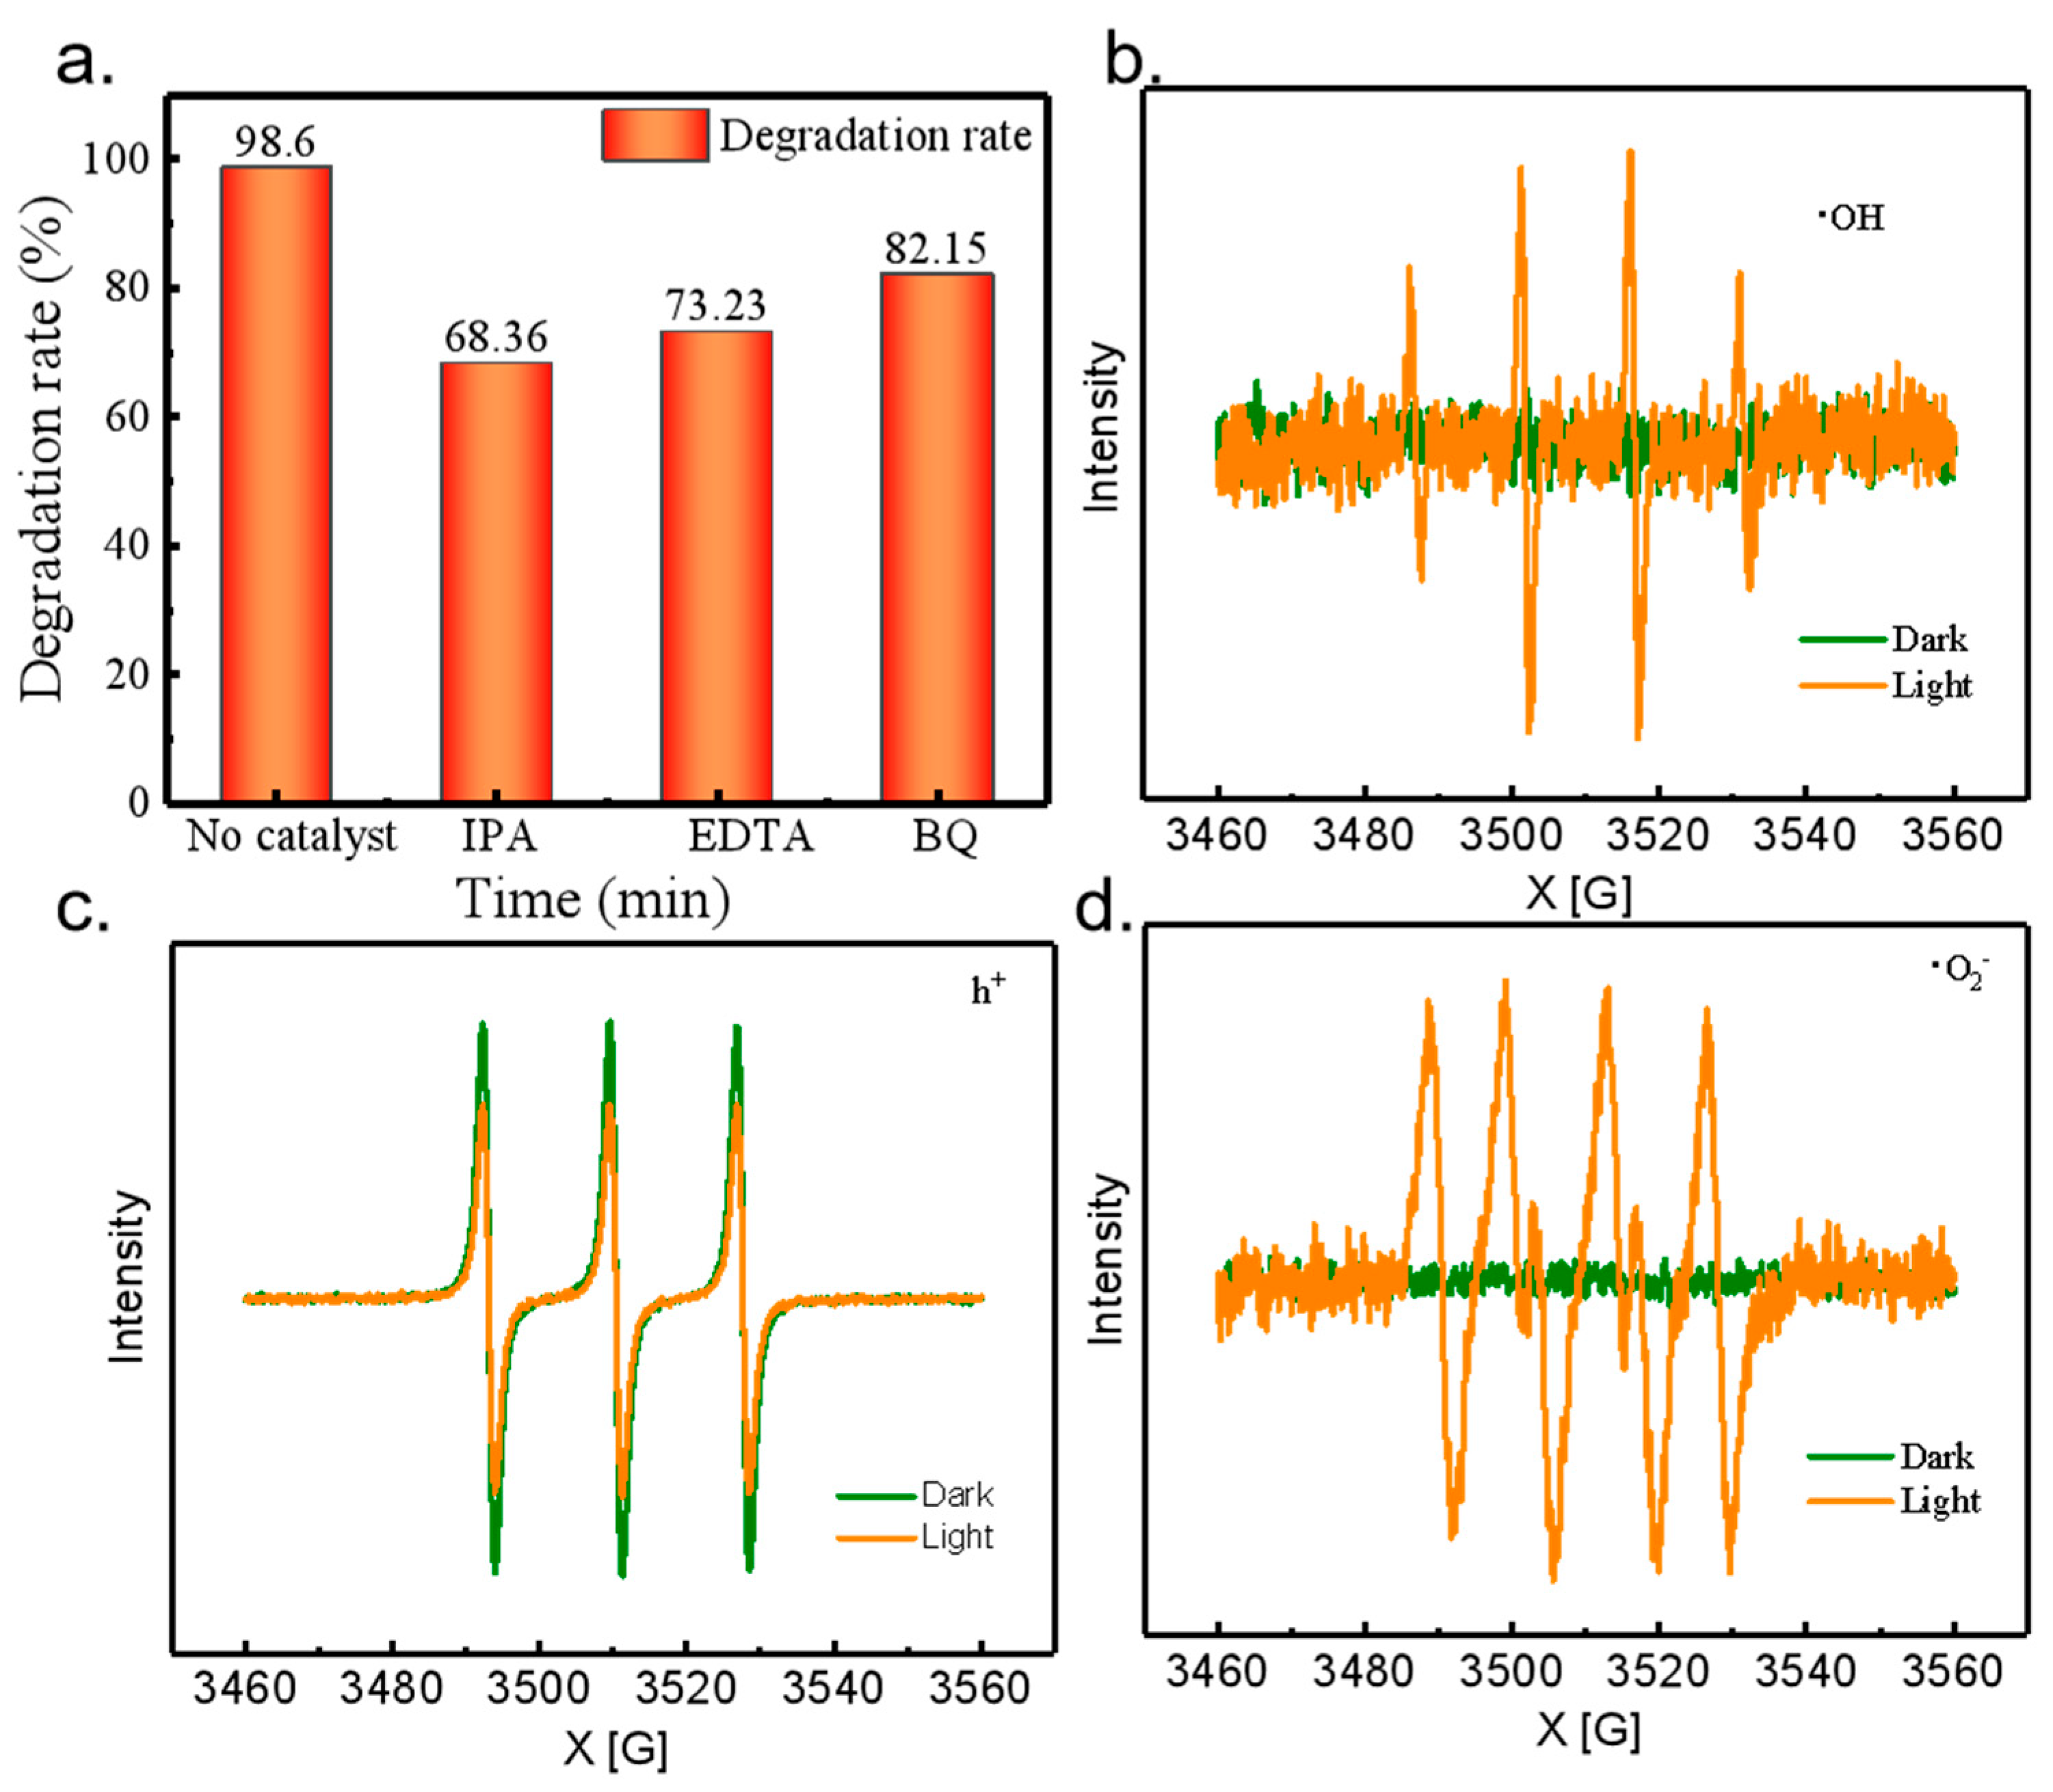
2 photocatalytic degradation of SA wastewater as an example, we can obtain key information from the experimental data and characterization analysis. From the experimental results in
Figure 10a, it can be seen that the degradation rate of SA by MIP-Ag-TiO
2 showed significant changes when isopropanol, EDTA, and p-benzoquinone were added to the reaction system, respectively. The degradation rate was as high as 98.6% when these substances were not added, while it decreased to 68.36% after the addition of isopropanol, became 72.23% after the addition of EDTA, and was 82.15% after the addition of p-benzoquinone. Since isopropanol was mainly used to capture •OH, EDTA was used to capture h
+, and p-benzoquinone was used to capture •O
2−; the significant decrease in the degradation rate indicated that during the photocatalytic degradation of SA wastewater by MIP-Ag-TiO
2, three active substances, •OH, h
+, and •O
2−, were involved in the reaction, and judging from the decrease in the degradation rate, the main active substance was likely •OH, followed by h
+ and •O
2−.
To further verify this conclusion, EPR characterization of MIP-Ag-TiO
2 was carried out (
Figure 10b–d). From the characterization results, we can clearly observe that the photocatalytic system is able to produce h
+, •OH, and •O
2− continuously and stably. Three characteristic peaks of DMPO-•OH adduct, DMPO-h
+, and DMPO-•O
2− were detected after 15 min of UV lamp irradiation, a phenomenon that visually proves the presence of these three active substancs during the reaction process and that that they play a key role in the degradation of SA [
31]. This result is highly consistent with the results of the previous quenching experiments, which further validates our inference based on the quenching experimental data. Hence, both the changes in degradation rate in the quenching experiments and the detection of characteristic peaks in the EPR characterization fully indicated that the three active substances, •OH, h
+, and •O
2−, were indispensable in the photocatalytic degradation of SA wastewater by MIP-Ag-TiO
2. This research result is of great significance for understanding the photocatalytic degradation mechanism of MIP-Ag-TiO
2, optimizing the photocatalytic reaction conditions, and improving the degradation efficiency of SA wastewater.


