1. Introduction
Solid-state electrolytes (SSEs) in all-solid-state lithium-ion batteries (ASSLIBs) have been actively investigated recently. The systems were focused on oxide-, sulfide-, halide-, oxysulfide-, and oxyhalide-based compounds with amorphous, nanocrystalline, microcrystalline, or polycrystalline (ceramic) phases [
1,
2,
3]. The optimized nanocrystalline LiTa(Nb)OCl
4 [
4] reached a high level of Li-ion conductivity (σ > 10 mS cm
−1) with a specially low activation energy (
Ea < 0.25 eV) at room temperature (RT; = 25 °C), being comparable to or surpassing that of organic liquid electrolytes (~10 mS cm
−1).
Li-Ta-oxychlorides (LTOCs)/Li-Nb-oxychlorides (LNOCs), constructed by introducing a mixed anion strategy in halide matrices, hold the following advantages [
5]: (1) coupled weak/strong Coulombic forces between Cl
−-Li
+ and O
2−-Li
+, and wide/narrow Li
+-transport channel formed by large/small anions (
= 0.181 nm,
= 0.140 nm;
r—effective ionic radius [
5]); (2) better air stability and recoverability than sulfide-, halide-, and oxysulfide-based SSEs; and (3) coupled weak/strong bond strength with polyanions, softer/harder lattice structures, and high/low Cl
−/O
2− polarizability to guarantee the SSEs’ good mechanical deformability for easily assembled ASSLIBs [
1,
2,
3,
4,
6].
Amorphous Li-Ta(Nb)-halides and Li-Ta(Nb)-oxyhalides emerged as promising candidates for SSEs in ASSLIBs very recently within four categories: (i) ball-milled resultants from oxide-halide mixtures:
xLi
2O-TaCl
5 (
x = 1−2; σ = 6.6 mS cm
−1 @
x = 1.6) [
7] and 1.5Li
2O-0.9TaCl
5-0.1TaF
5 (2.3 mS cm
−1) [
8]; (ii) halides:
a-LiTaCl
6 (7.16 mS cm
−1 @30 °C [
9]; 10.95 mS cm
−1 [
10]; 11.0 mS cm
−1 (calculated) [
11]),
a-LiNbCl
6 (13.5 mS cm
−1 (calculated) [
11]),
a-LiTa
0.5Nb
0.5Cl
6 (15.7 mS cm
−1 (calculated) [
11]), and
a-LiTaCl
5F (4.37 mS cm
−1 [
10]); (iii) nitrohalides:
a-Li
3xTaCl
5N
x (1 ≤ 3
x ≤ 1.4; 7.34 mS cm
−1 @3
x = 1.25 & 30 °C) [
12]; and (iv) oxyhalides:
a-LiTaCl
5O
0.5 (7.75 mS cm
−1 [
10]) and
a-LiTaOCl
4 (5.03 mS cm
−1 @30 °C [
13]).
The above amorphous/glassy SSEs were all synthesized via high-energy ball-milling (HEBM) or a mechanochemical process at 100–500 rpm/min for 2–200 h, while some were with post-annealed at mild temperatures (
c.f. 120 °C × 2 h [
10]).
Nanocrystalline LTOCs/LNOCs were a huge breakthrough by Tanaka et al. in 2023 [
4]. They were synthesized from LiOH and TaCl
5/NbCl
5 by HEBM at 500 rpm/min for 40 h and post-annealed at 300/100 °C, respectively. They exhibited extremely high σ values at RT (12.4 and 10.4 mS cm
−1, respectively).
The structure of nanocrystalline LiNbOCl
4 was resolved and refined (based on LiVOF
4) to a Li-ordered orthorhombic system, i.e.,
o-LiNbOCl
4 (
Cmc2
1, No. 36), which consist of 1D chains of apex-O-sharing [NbO
2Cl
4]-octahedra with (LiCl
4)-tetrahedra residing between those chains [
4].
In 2024, Adams [
14] argued the
o-LiNbOCl
4 structure and revised it to
t-LiNbOCl
4 (
I4/
m, No. 87) using ab initio molecular dynamics (AIMD) simulations. The structure consists of parallel (NbO
2/
2Cl
4)
∞ polyanion chains, and the pronounced Li-disorder leads to a more uniform packing within it.
Subsequently, Singh et al. [
15] modified the above
o-/
t-LiNbOCl
4 structures to
m-LiNbOCl
4 (
Cc, No. 9) (4.4–10.7 mS cm
−1) by combining experiments with X-ray/neutron diffraction, pair distribution function (PDF) analysis, and density functional theory (DFT)/AIMD simulations. It crystallizes at ~120 °C and exhibits nanocrystalline behavior with a short coherence length (~10 nm). It features isolated 1D chains of [NbO
2Cl
4]-octahedra bound together by a relatively low concentration of highly delocalized Li-ions, as well as weak van der Waals interactions [
15].
The processing conditions, such as HEBM rotation speed/time, annealing temperature/time etc., are closely correlated with the crystallinity, crystal structure, and ionic conductivity of SSEs. There are two controversial results for this mutual relationship.
(1) Case 1: Higher crystallinity leads to higher ionic conductivity.
Increasing the annealing temperature/time would increase the crystallinity and σ values of SSEs [
4,
15] (Equations (1) and (2)). Increasing the HEBM time would decrease the crystallinity and σ values of SSEs [
15] (Equation (3)).
Otherwise, the σ values of Li
3YBr
6 (Equation (4)) [
16] and Li
3InCl
6 (Equation (5)) [
17] were also consistent with this case.
This case corresponds to nano/microcrystalline structures with high temperature stability and slower crystallization. The structurally ordered (annealed) phase turns out to be superior in terms of ionic conductivity (σ
total) to the disordered (as-milled) one because
≈
and
>
[
16,
17,
18].
(2) Case 2: Higher crystallinity leads to lower ionic conductivity.
In contrast with Case 1, increasing the annealing temperature/time would increase the crystallinity (in some cases, the crystal structure changes, such as Equation (6)) [
19], but the σ values of SSEs are reduced (Equations (6) and (7);
, No. 164) [
19,
20]. Increasing the HEBM time (intense milling) would decrease the crystallinity and increase the σ values of SSEs. This contribution originates from factors (metastable nonperiodic features) beyond ideal and periodic atomic arrangements, such as defects, surface structure, particle size, strain, amorphous phase, etc. [
19].
The structurally ordered (annealed) phase turns out to be inferior in terms of ionic conductivity (σtotal) to the disordered (as-milled) one because > and ≈ << .
Essentially, the above cases depend on the thermodynamic and kinetic stability ranges of SSEs. Even though
o-LiTaOCl
4/
o-LiNbOCl
4 reached, respectively, the highest σ values of 12.4/10.4 mS cm
−1 in oxyhalide-based SSEs, there is a desperate need for deeper research on the corresponding maximal achievable crystalline phases. To increase the crystallinity, a thermodynamic stability range at mild temperatures (100–120 °C; < 150 °C for 0.5–12 h) was found for metastable
a-LiNbOCl
4. Due to the slower crystallization kinetics from the amorphous precursor, the thermodynamically stable region for
o-LiTaOCl
4 should locate at higher temperatures (>300 °C) [
4,
14,
15].
Otherwise, an unknown phase was found in
o-LiTaOCl
4, and LiCl (~2.8 wt.%) was found in
o-LiNbOCl
4. During crystal structure resolution and refinement, passing incomplete crystallization from the amorphous phase led to very broad peaks, further limiting the ability to conclusively fit complex (orthorhombic-/tetragonal-/monoclinic-) structure models or to ascertain the presence of structural distortions [
4,
14,
15].
Therefore, challenges exist in elaborate material synthesis, crystal structure construction/refinement, electrochemical stability, and applications well over ambient temperatures. Herein, we report new SSEs of LTOCs that exhibit outstanding ionic conductivity (>7 mS cm−1) at RT.
2. Materials and Methods
2.1. Material Preparation
Thermodynamic deficiency (metastable nonperiodic features) existed in HEBM methods [
4,
14,
15,
19]. To synthesize crystalline LiTaOCl
4-type SSEs, a preliminary experiment was conducted in quartz tubes at 180–500 °C for 2–10 h using LiOH and TaCl
5 as the raw materials (
Figure S1). Pure
m-LiTaOCl
4 phase was attained via Equation (S1) by calcining at 260 °C for 2 h and 180 °C for 10 h (
Figure S1a,b). But the obtained σ values were as low as 0.47 and 0.24 mS cm
−1, respectively (
Figure S1c). Other samples were extremely impure (
Figure S1a,b), which reacted as in Equation (S2). They attained σ values ranging from 0.01 to 1.48 mS cm
−1 (
Figure S1c). Except for
m-LiTaOCl
4, at least three phases (
m-LiTaO
2Cl
2,
o-Li
2Ta
2O
5Cl
2, and
m-Li
2Ta
2O
5Cl
2) were found in the samples. Moreover, quite a few unreacted TaCl
5 crystals were found on the wall of the quartz tube after calcining.
Because the resultants included gaseous HCl while the raw material of TaCl
5 was extremely easy to sublimate and evaporate (m.p. = 223.75 °C; b.p. = 229.55 °C [
21]), the closed circumstances of a quartz tube were not suitable to synthesize the target LiTaOCl
4-type SSEs using LiOH and TaCl
5 as the raw materials.
Therefore, a new multi-factor experimental design was adopted in this work (
Figure S2;
Table S1). Samples of series
A (Li
1+xTaO
1+xCl
4−x, −0.70 ≤
x ≤ 0.50) and series
B (LiTaO
2+yCl
2−2y, −1.22 ≤
y ≤ 0) were prepared in quartz tubes at different calcining temperatures (
T = 260/380/460 °C) and dwell times (
D = 2/10 h). By using Li
2O, TaCl
5, and LiTaO
3 as the raw materials, gaseous resultants such as HCl were avoided.
The commercial Li2O (Aladdin Co., Ltd., Shanghai, China; 99.99 wt.%), TaCl5 (Aladdin Co., Ltd., Shanghai, China; 99.99 wt.%), and LiTaO3 (Energy Chem. Co., Ltd., Xiamen, China; 99.9 wt.%) powders were mixed, pressed into tablets (90 MPa), and sealed in quartz tubes (26 cm3/tube; 1 g/tube) under vacuum (5 Pa). After calcining, the tablets were taken out, ground to powder, and preserved in the glove box.
Firstly, the reaction process (Equation (8)) was designed for series
A (Li
1+xTaO
1+xCl
4−x, −0.70 ≤
x ≤ 0.50).
Pure
m-LiTaOCl
4 phase could be attained under some synthesis conditions. But the corresponding σ values were very low, similar to the results of the preliminary experiment. In some samples with high σ values (5.20−7.35 mS cm
–1), three phases (
m-LiTaO
2Cl
2,
o-Li
2Ta
2O
5Cl
2 and
m-Li
2Ta
2O
5Cl
2) coexisted according to Equation (9), while
m-LiTaO
2Cl
2 was the main phase.
Secondly, another reaction process (Equation (10)) was designed for Series
B (LiTaO
2+yCl
2−2y, −1.22 ≤
y ≤ 0) because samples with high σ values in series
A had
m-LiTaO
2Cl
2 as the main phase.
There were two side-reactions (Equations (11) and (12)) accompanying Equation (10):
Samples in series A and B were labelled, respectively, as Ax/T-D# and By/T-D# where the ±|x| indicated over-/under-lithiated values in Series A and ±|y| were peroxy-/anoxic values in Series B, respectively. For example, sample A−0.60/380-2# represented Li0.40TaO0.40Cl4.60 (x = −0.60) calcined at 380 °C for 2 h, sample B−0.67/460-10# represented LiTaO1.33Cl3.33 (y = −0.67) calcined at 460 °C for 10 h, and so on. Seven representative samples with high phase purity and/or high σ values were emphatically studied, where I#—A−0.60/380-2#, II#—A−0.60/460-10#, III#—A0/460-10# (= B−1/460-10#), IV#—A0.10/460-10#, V#—A0.20/460-10#, VI#—B−1.22/460-10#, and VII#—B−0.67/460-10#.
2.2. Material Characterization
The morphology and elemental distribution of the electrolyte powders were tested using a scanning electron microscope (SEM; TESCAN MIRA LMS, Brno, Southern Moravia, Czech Republic) equipped with an energy dispersive spectrometer (EDS; Xplore 30, Oxford Instr., Oxford, England, UK). Total elemental analyses except Cl (because of the chloric solvent) were performed using an inductively coupled plasma-optical emission spectrometer (ICP; Prodigy 7, Teledyne Leeman Labs. Inc., Mason, OH, USA). Single-element analysis (Li and Ta) was performed using an atomic absorption spectrophotometer (AAS; Agilent 200AA, Agilent Technologies Inc., Santa Clara, CA, USA).
Electrovalence was determined using an X-ray photoelectron spectrograph (XPS; ESCALAB 250Xi, Thermo Fisher Sci., Waltham, MA, USA) equipped with a focused monochromatized AlKα X-ray source. Binding energy was calibrated by the adventitious C 1s peak (284.8 eV). The parameters for survey/narrow scans were as follows: pass energy 100/30 eV, spot size 600/300 nm, number of scans 1/5, dwell time 100/50 ms, and energy step size 1.00/0.10 eV, respectively. Spectra were analyzed with Advantage v.5 software using a Gaussian–Lorentzian peak shape function and removing the Shirley background contribution from the data.
Phase identification of the powder electrolytes was carried out using an X-ray diffractometer (XRD) with Cu
Kα1 radiation (λ = 0.1540598 nm, 40 kV, 40 mA) at a continuous scan rate of 0.02 °/s (Empyrean, PANalytical B.V., Almelo, The Netherlands). Samples were isolated from water and oxygen via a special sample stage (Deen Optics Co., Shanghai, China) with shielding argon and Kapton tape. Structure refinements were performed using the Rietveld method implemented in GSAS/EXIGUI software [
22] with the models of
m-NaNbO
2F
2 (CSD 23,238/pdf 22-1392,
P1 2
1/
c 1, No. 14) [
23],
m-LiNbOCl
4 (
Cc, No. 9) [
15], and
o-Li
2Nb
2O
5F
2-I (
Cmc2
1, No. 36) [
24].
Electrochemical impedance spectra (EIS) were determined via assembled blocking cells of SS//LTOC//SS (SS—stainless steel) under a constant pressure of 90 MPa on an electrochemical workstation (CHI660e, Shanghai Chenhua Instr. Co., Ltd., Shanghai, China). Testing frequencies ranged from 1 Hz to 1 MHz with a voltage amplitude of 5 mV at 25−75 °C. Therein, a blocking cell was assembled as follows: First, 260 mg powder of LTOC (series
A or
B) was pressed into a sheet (ϕ12 × 0.8 mm) under 315 MPa for 1 min. Then, it was sandwiched between two pieces of SS foil in a homemade battery testing unit, which provided a water/air-proof, heating, pressing, and electrode contact environment [
25]. The ionic conductivity (σ) of LTOCs was obtained from the EIS results and calculated according to the formula σ =
L/(
RS), where
L represents the thickness of electrolyte plate,
R is the resistance (
Z′), and
S the surface area of the electrode. The activation energy (
Ea) was calculated using the Arrhenius formula σ =
Aexp
, where
A is the pre-exponential factor,
T is the absolute temperature, and k
B is the Boltzmann constant.
Initial charge–discharge curves were tested via assembled ASSLIBs of NCM//LTOC//LPSC//Li-In (NCM—composite cathode; LPSC—Li6PS5Cl) under a constant pressure of 90 MPa on a battery test system (CT2001A, Wuhan LAND Electronic Co., Ltd., Wuhan, Hubei, China). Testing cut-off voltages ranged from 2.0 to 3.7 V at 35 °C and the current density was 0.2 C (1 C = 200 mA g−1). Therein, the NCM was prepared by grinding (for 1 h) powders of LTOC (one of the above-mentioned seven representative samples I#−VII#) and commercial LiNi0.8Co0.1Mn0.1O2 (NCM811, 2–4 μm, 99 wt.%; Shenzhen Huaqing New Mater. Technol. Co., Ltd., Shenzhen, Guangdong, China) while LTOC:NCM811 = 30:70 (wt.%). The dual-layer LTOC//LPSC was used as the electrolyte. An ASSLIB was assembled as follows: First, 140 mg powder of LTOC was pressed into a sheet (ϕ12 mm) under 90 MPa for 1 min. Then, 70 mg LPSC and 15 mg NCM were pressed successively on two sides of the LTOC sheet under 315 MPa for 1 min. Finally, a Li-In foil was pressed on the LPSC side of the sheet under 90 MPa. All processes were conducted in an argon-filled glove box.
3. Results
3.1. Chemical Compositions (ICP/AAS)
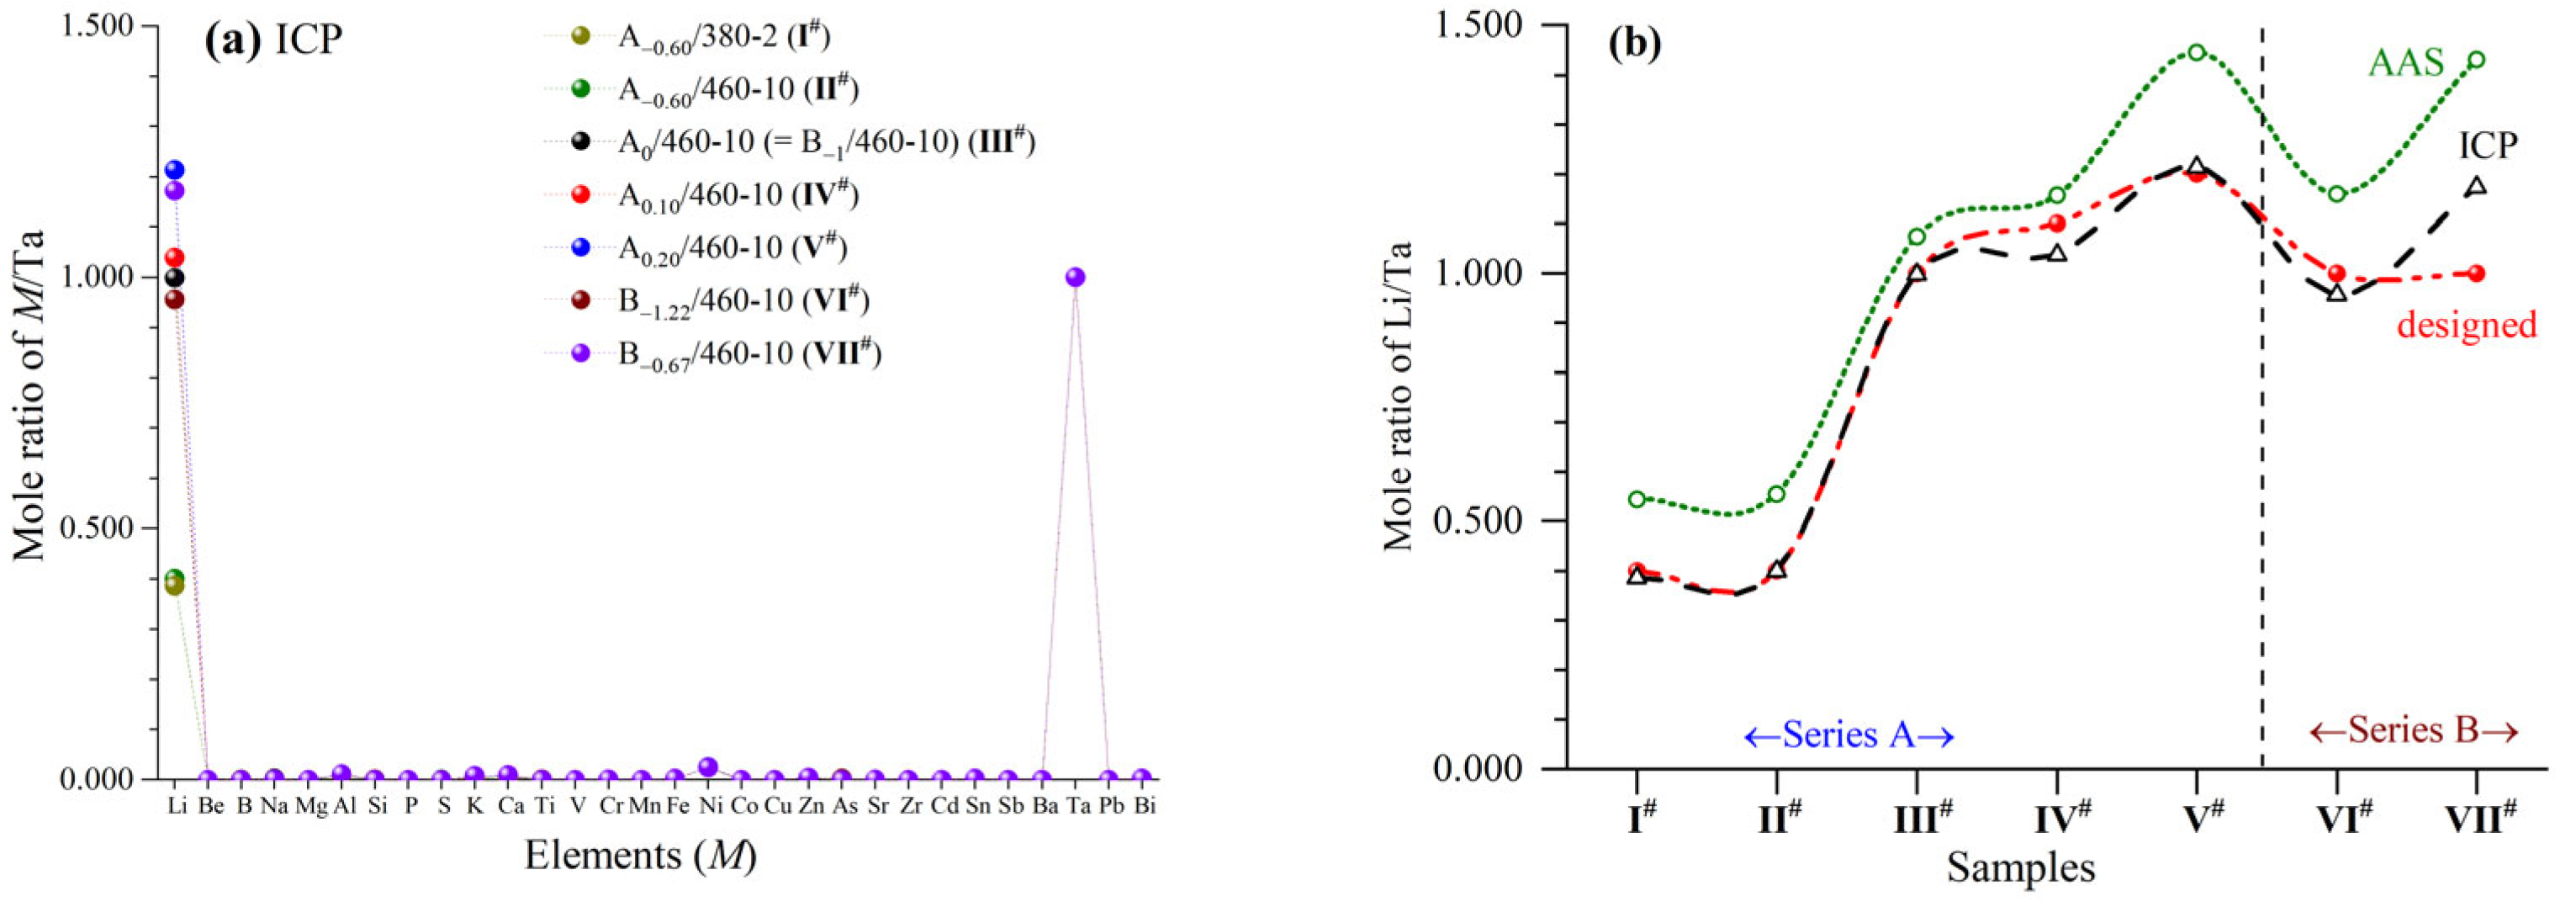
Samples
I#−
VII# had high contents of Li and Ta with trace Al, K, Ca and Ni (
Figure 1). The ICP/AAS results were all close to the designed compositions, while the ICP values were nearer. The mole ratios of Li/Ta via ICP in
I# and
II# were 0.386 and 0.399, respectively, corresponding to the phase content results in XRD patterns (see later in
Section 3.3) and
Table S1. Namely, pure phases of
m-Li
0.40TaO
0.40Cl
4.60 (A
−0.6/380-2
#) and
m-Li
0.40TaO
0.40Cl
4.60 (A
−0.6/460-10
#) existed in
I# and
II#. Besides
I# and
II#, the mole ratios of Li/Ta via ICP in other samples were 0.956−1.214, also corresponding to the phase content results in XRD patterns (see later in
Section 3.3) and
Table S1. Even though three phases (
m-LiTaO
2Cl
2,
m-LiTaOCl
4 and
o-Li
2Ta
2O
5Cl
2) coexisted in
III#−
VII#, their mole ratios of Li/Ta were all equal to 1. The above results also indicated that all of the raw material of TaCl
5, being extremely easy to sublimate and evaporate, had reacted completely.
3.2. Morphology, Elemental Distribution (SEM/EDS), and Ta-Ion-Valence (XPS)
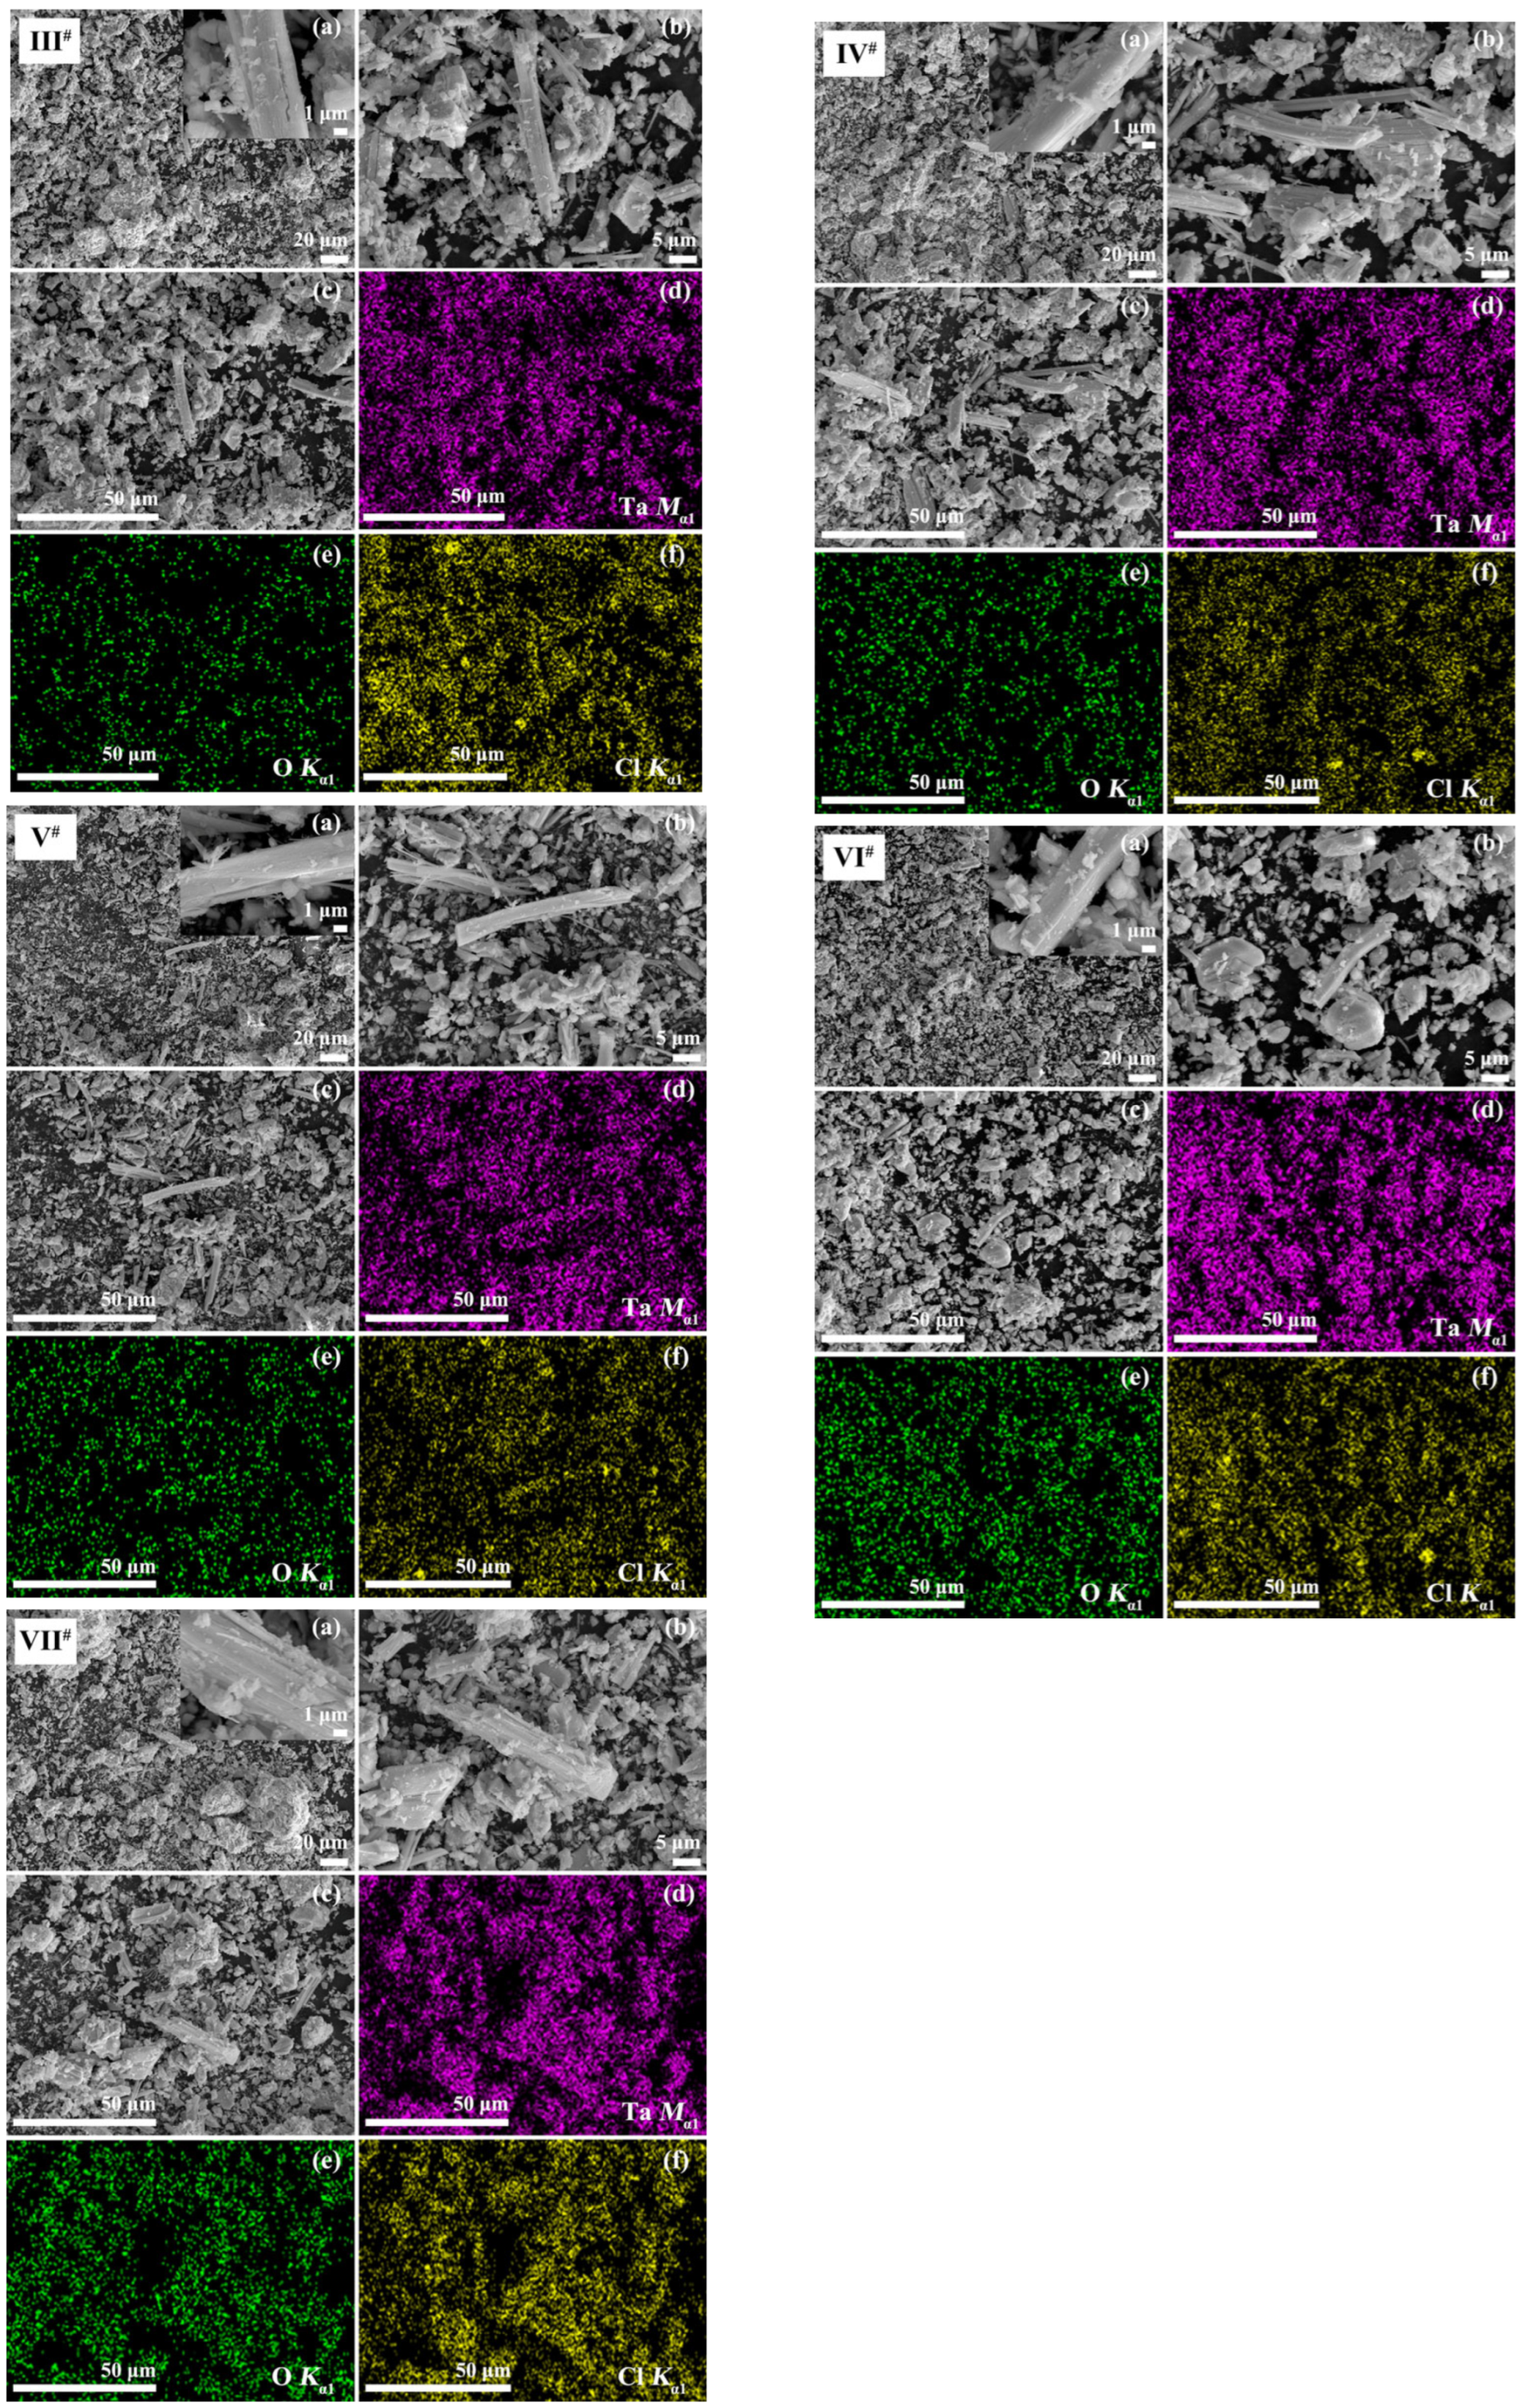
SEM images (
I#(a,b)–
VII#(a,b)) and EDS elemental mappings (1 k×;
I#(c,d)–
VII#(c,d)) are shown in
Figure 2. The morphology of the powders varied from strips to irregular nano/microparticles. There were more thicker strips and coarser blocks in the lower-temperature and shorter-time calcined powder (
I# @380 °C × 2 h) than in the higher-temperature and longer-time calcined powders (
II#–
VII# @460 °C × 10 h). Changes in particle shape caused by chemical composition were very small among series
A (
II#–
V# @460 °C × 10 h) and
B (
VI#–
VII# @460 °C × 10 h). Elements of Ta, O, and Cl were distributed homogeneously in all particles.
By using XPS (
Figure S3), the main peaks of Ta 4f
7/2/4f
5/2 centered at 26.73/28.63 eV for sample
II# and 26.77/28.66 eV for sample
VI#, respectively, were determined. They were assigned to Ta
5+ species, which demonstrated the formation of LTOCs [
26,
27].
3.3. Phases and Crystal Structures
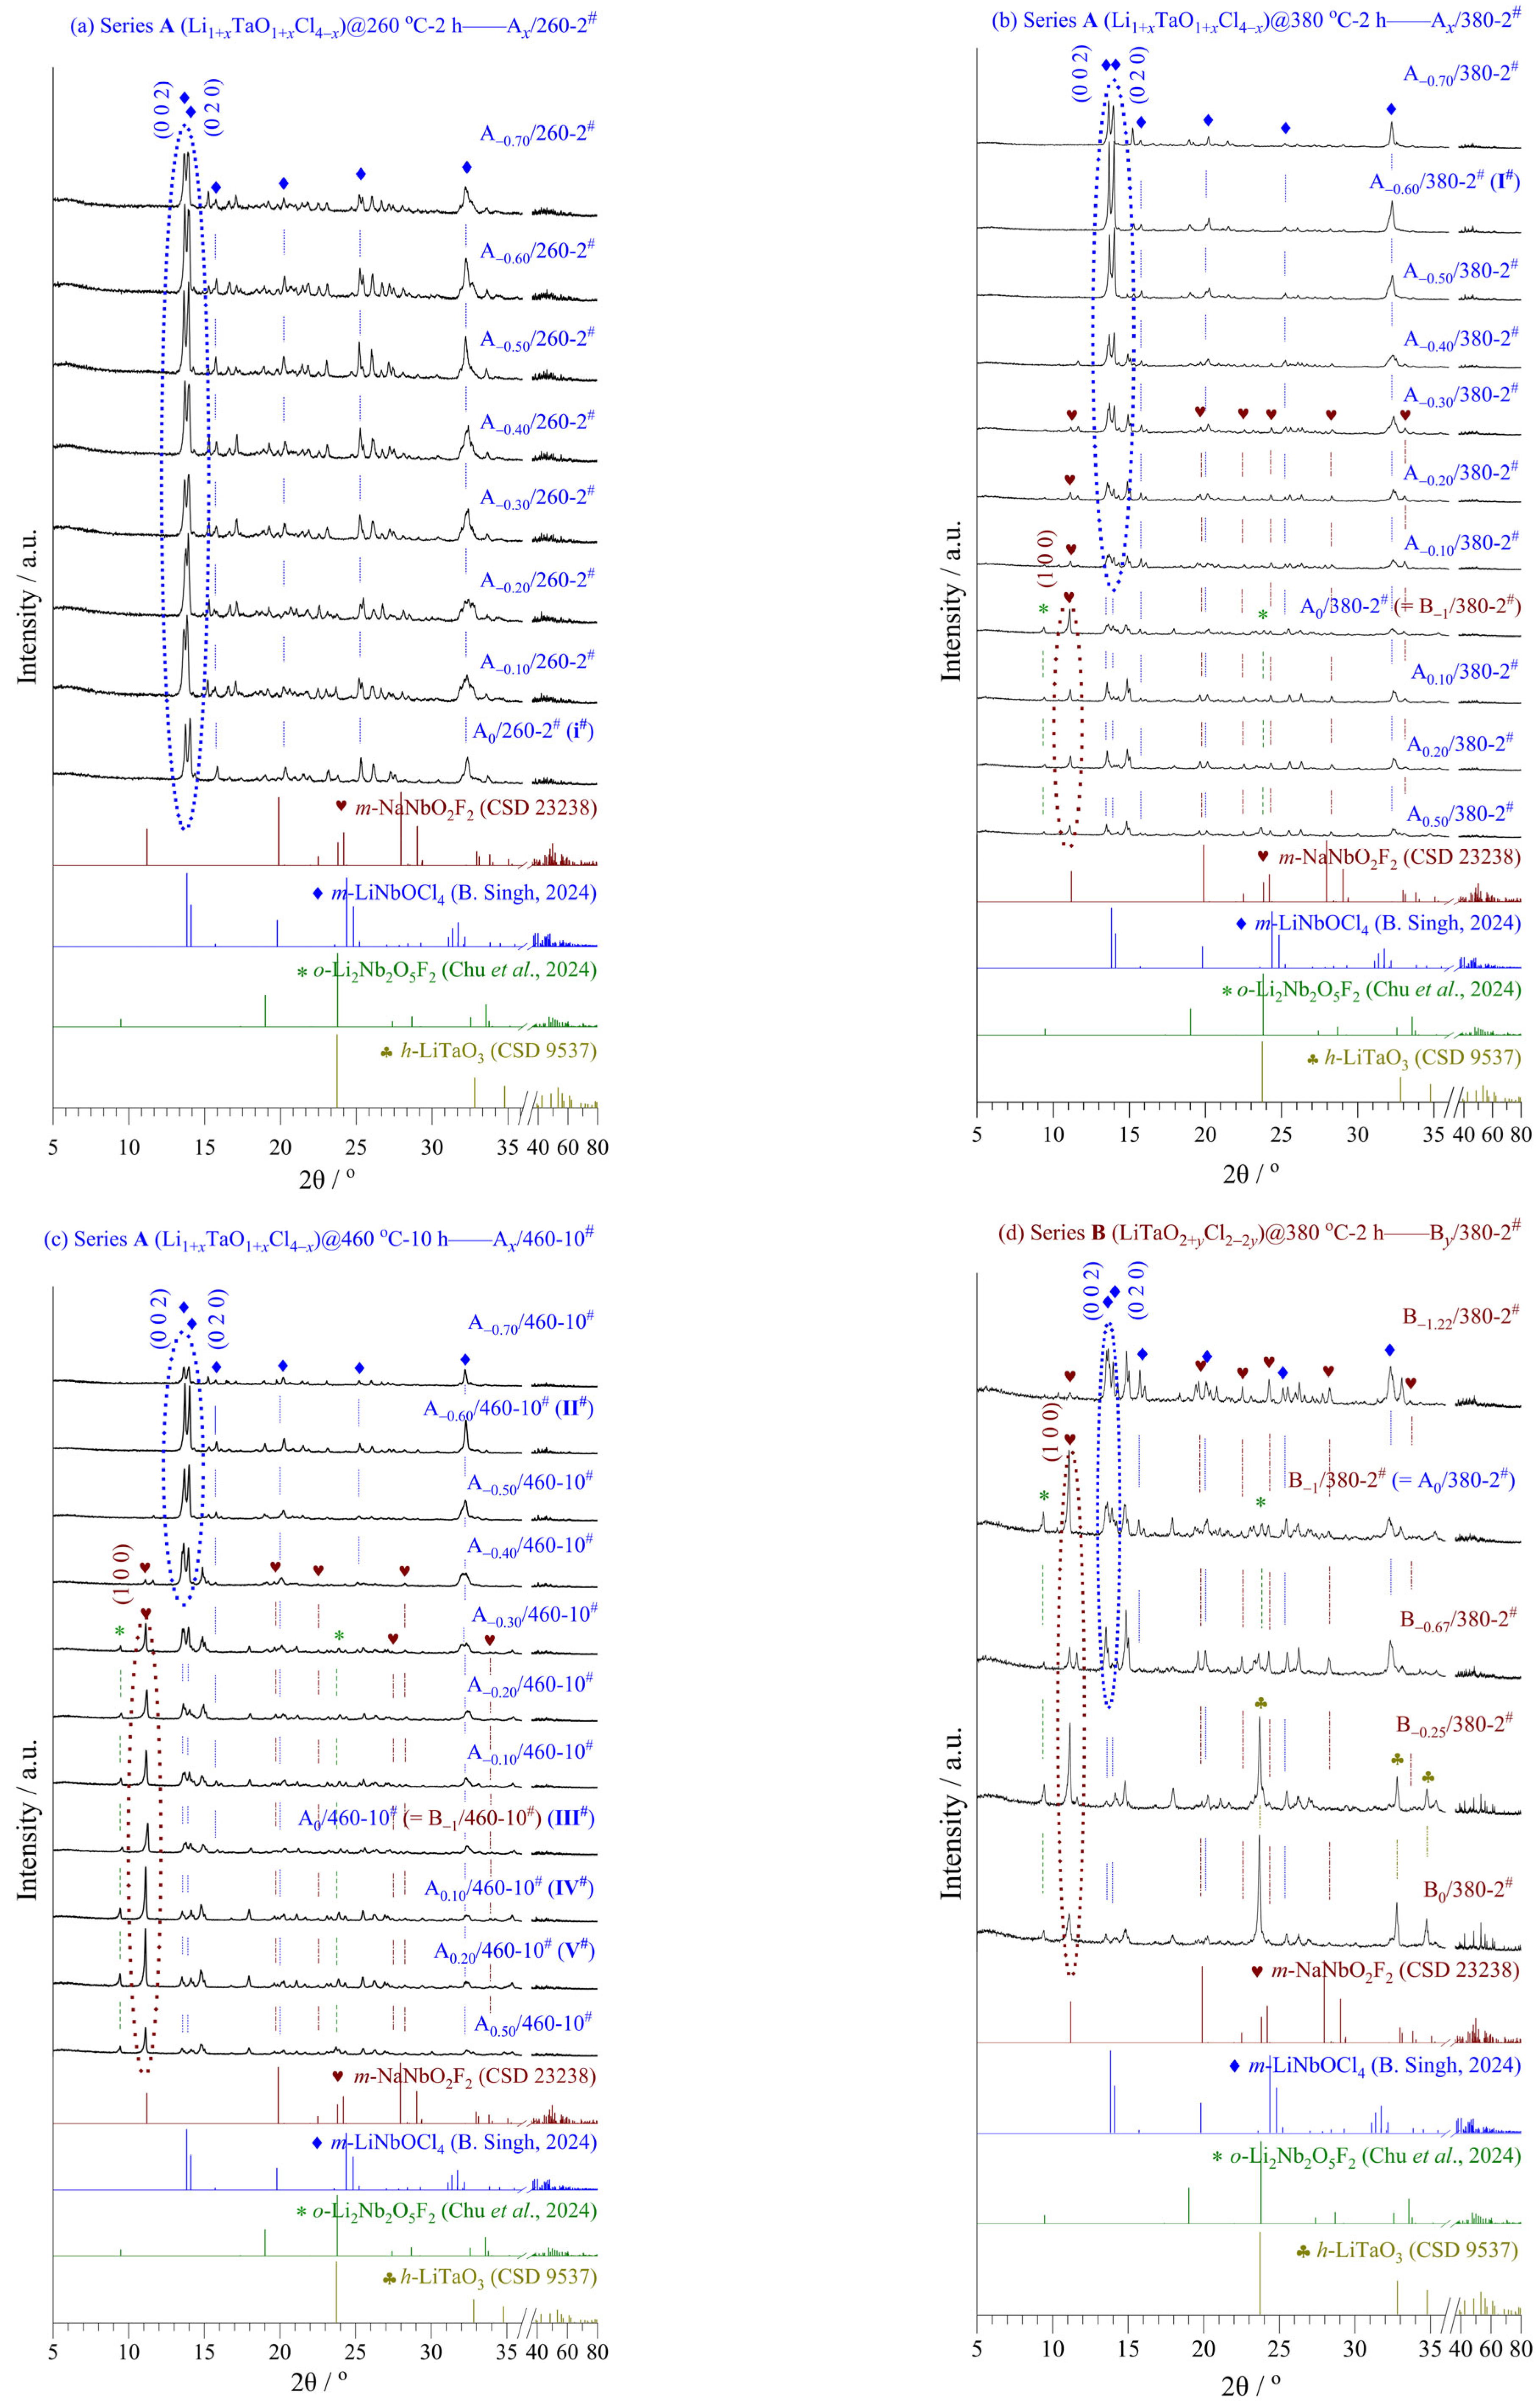
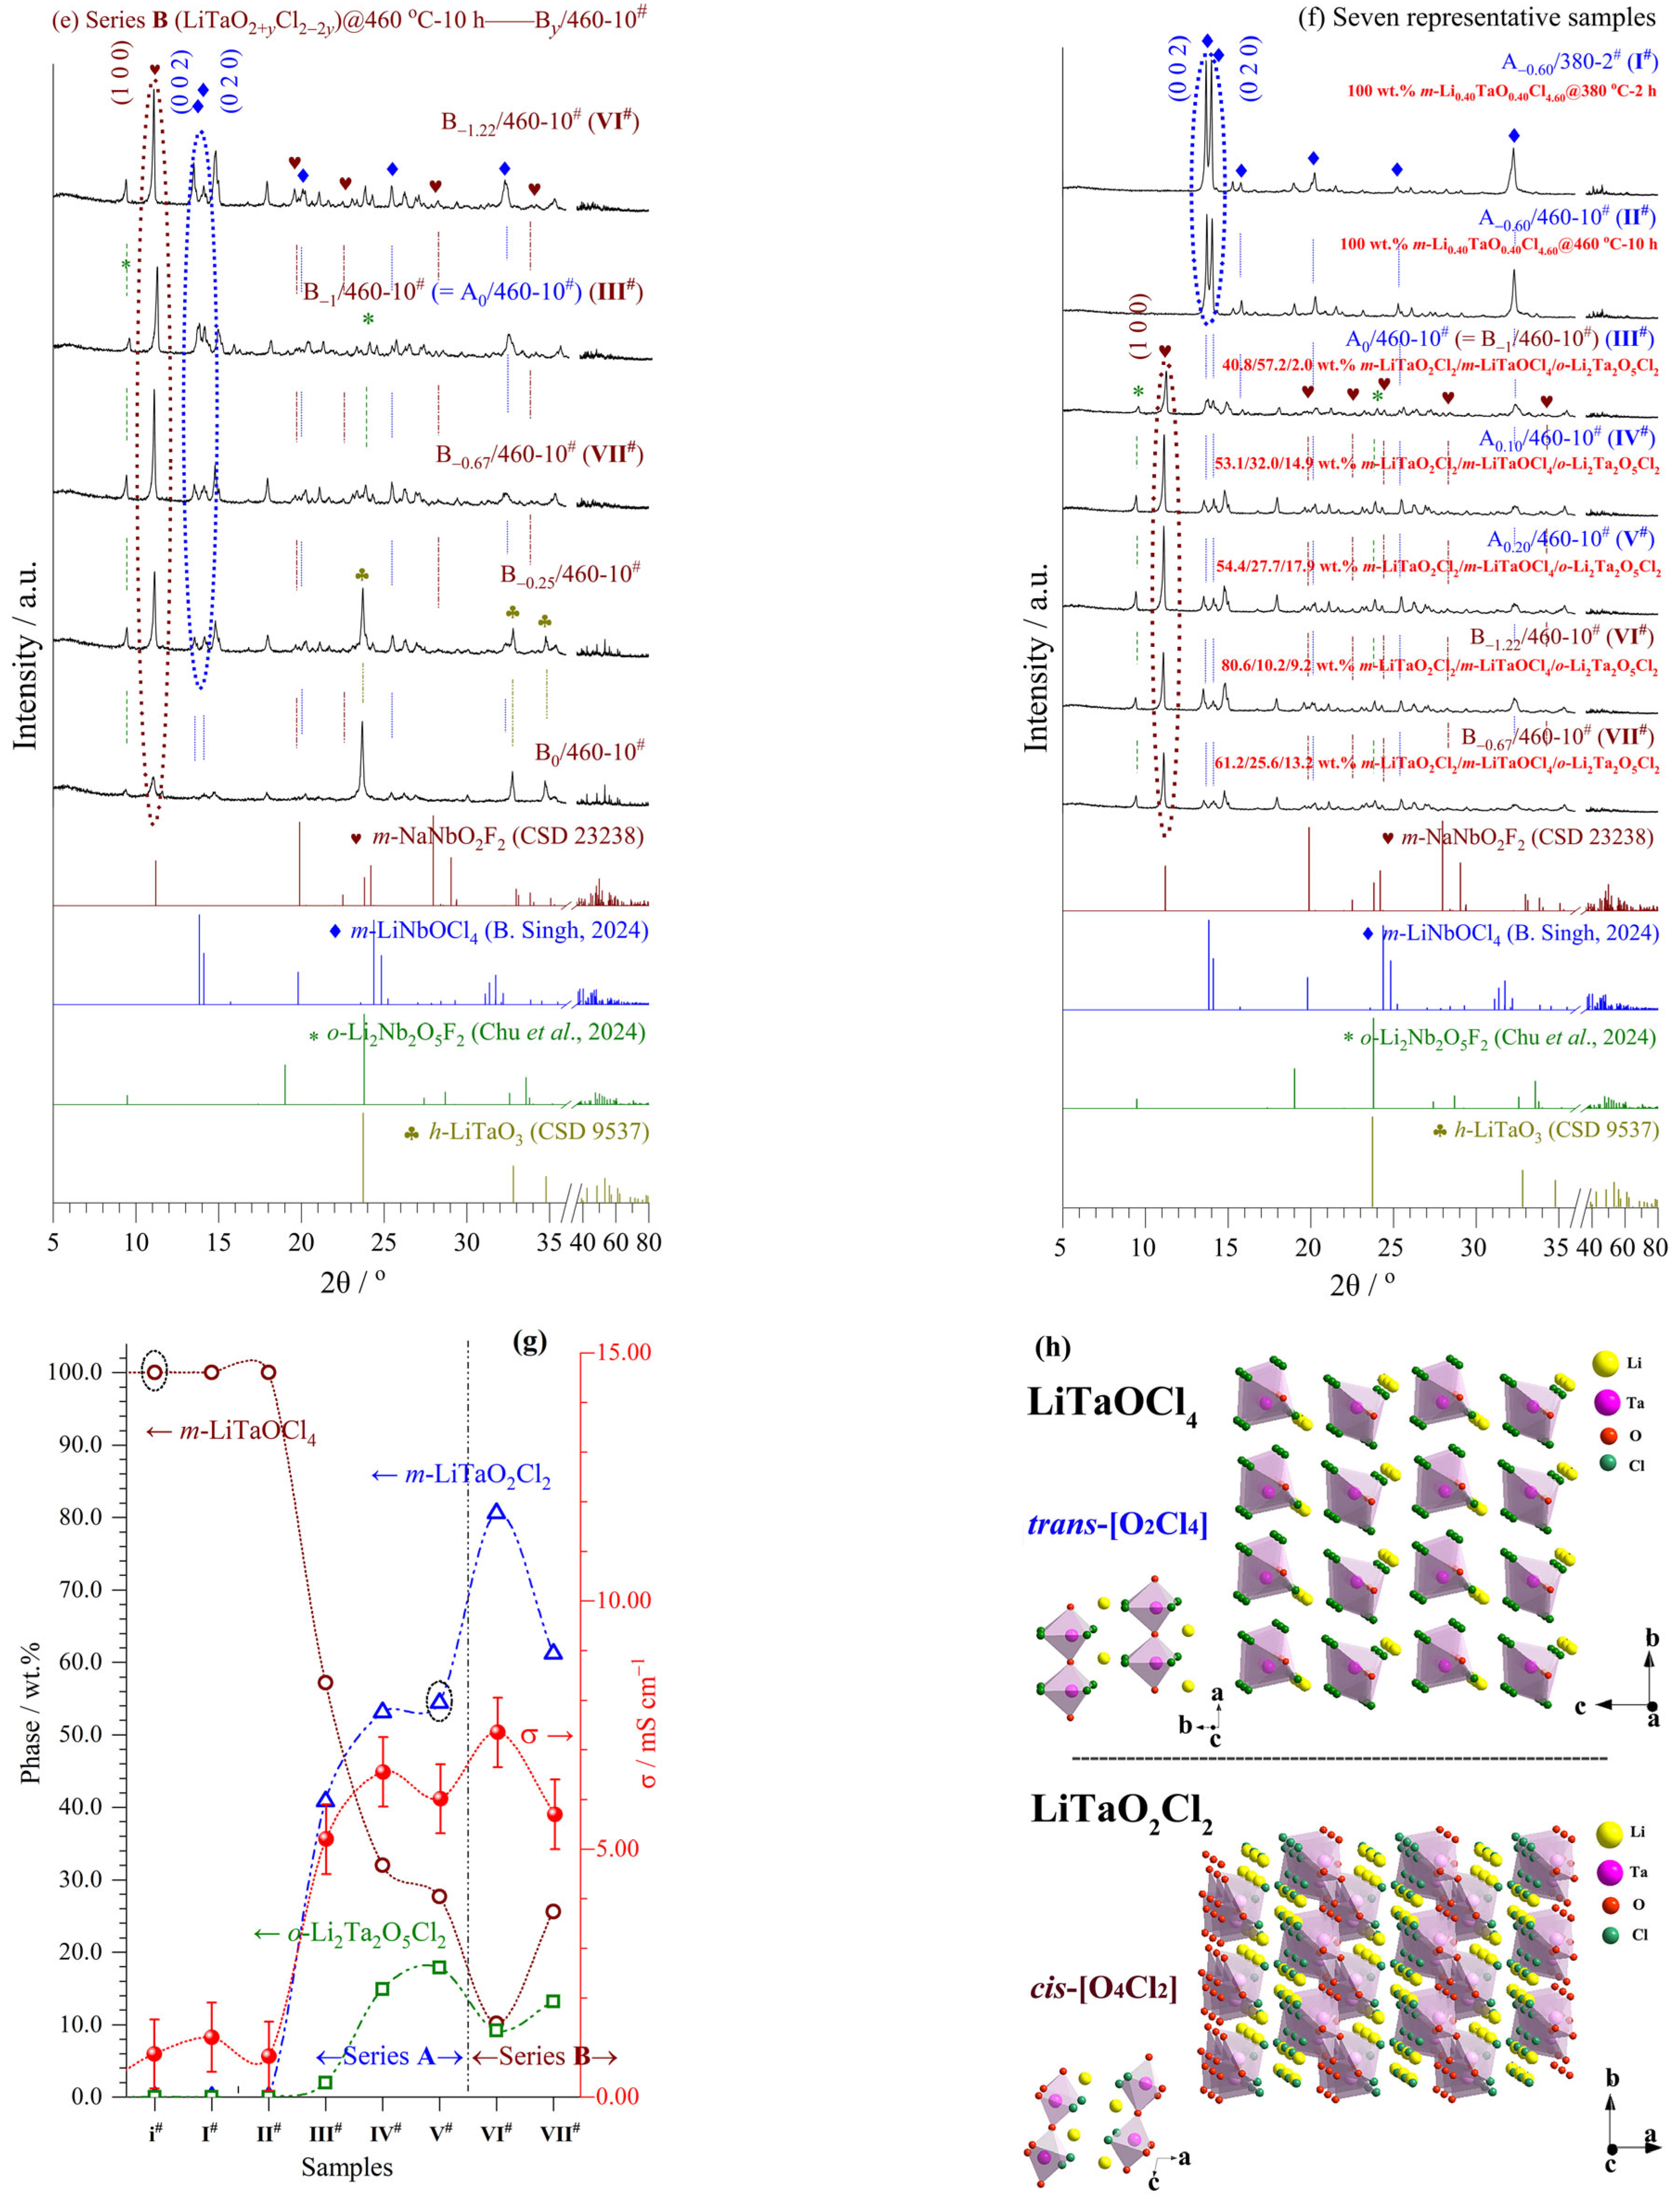
Figure 3 and
Tables S2 and S3 show the XRD patterns, phase contents, and refined crystal structures of series
A (Li
1+xTaO
1+xCl
4−x, −0.70 ≤
x ≤ 0.50) and
B (LiTaO
2+yCl
2−2y, −1.22 ≤
y ≤ 0), including seven representative samples
I#−
VII#.
In series A, samples A−0.70~0/260-2#, A−0.70~−0.10/380-2#, and A−0.70~−0.40/460-10# were obtained via reaction Equation (8), while m-LiTaOCl4 was the main phase. In other words, these samples had matching nominal-realizable compositions and belonged to LiTaOCl4-type SSEs.
A−0.10~0.50/380-2# and A−0.40~0.50/460-10# were obtained via reaction Equation (9), where three phases coexisted, i.e., m-LiTaO2Cl2 (main), m-LiTaOCl4 (2nd phase), and o-Li2Ta2O5Cl2 (3rd phase). There were relatively large differences between their nominal and realizable compositions, belonging more to LiTaO2Cl2-type SSEs.
In series
B, samples B
−1/380-2
# and B
−1.22~−0.67/460-10
# were obtained via reaction Equation (10), having matching nominal-realizable compositions, while
m-LiTaO
2Cl
2 was the main phase. Sample B
−1.22/460-10
# (
VI#) attained the highest σ value (7.35 mS cm
–1) with the highest content of
m-LiTaO
2Cl
2 in the two series (see later in
Section 3.4).
B−1.22/380-2# and B−0.67/380-2# were obtained via reaction Equation (11), having unmatched nominal-realizable compositions, while m-LiTaOCl4 and m-LiTaO2Cl2 were the main/2nd phases, respectively.
B−0.67~0/380-2# and B−0.67~0/460-10# were obtained via reaction Equation (12), while unreacted h-LiTaO3 and m-LiTaO2Cl2 were the main/2nd phases, respectively.
The refined monoclinic structure of LiTaOCl
4 [
28] (
Figure 3h) belongs to the space group
Cc (No. 9) with a cell volume (
V) of 0.6395(3) nm
3 (
Z = 4). It consists of 1Li, 1Ta, 1O, and 4Cl ions occupying 4
a sites in the lattice (
Table S2). A polyanion group of
trans-[O
2Cl
4] octahedra constitute the isolated (in the
bc-plane) 1D framework chains along the
a-axis and, being remarkably flexible, are connected by O but lack bridging Ta-Cl-Ta bonds. The Li ions occupy interstitial sites along the 1D chains, which exhibit an energetically favorable orientation and extensive disorder. This leads to multiple octahedra orientations and creates a frustrated 3D energy landscape with fast Li-ion diffusivity [
4,
14,
15]. The evidence is from very widely dispersed Cl-Ta-Cl bond angles, which may originate from the empty Ta
5+ d-orbitals.
The refined monoclinic structure of LiTaO
2Cl
2 [
29] (
Figure 3h) belongs to the space group
P1 2
1/
c 1 (No. 14) with a cell volume (
V) of 0.3388(5) nm
3 (
Z = 4). It consists of 1Li, 1Ta, 2O, and 2Cl ions occupying 4
e sites in the lattice (
Table S3). A polyanion group of
cis-[O
4Cl
2] octahedra share only their 4O vertices with each other to build infinite {TaO
2Cl
2}
∞ layers with outward-facing 2Cl vertices. The Ta ions displace toward O ions located
trans to Cl ones, increasing the overall bonding strength and enhancing inherent distortions of
cis-[O
4Cl
2] octahedra [
23,
30]. The zigzag {TaO
2Cl
2}
∞ layers are stacked along the
a-axis and separated from each other by Li ions located in an irregular environment—a distorted octahedra with only Cl ions or 7-fold coordinated Cl plus the nearest O ion.
In short, there exist highly disordered Li ions coupled with prominent trans-[O2Cl4] framework flexibility in m-LiTaOCl4 and abundant ordered Li ions uniformly distributed around the cis-[O4Cl2] framework with strong ionic interactions in m-LiTaO2Cl2. The synergistic effect facilitates a low activation energy for Li-ion diffusion and high ionic conductivity.
3.4. Ionic Conductivity and Activation Energy
Figure 4a shows that the σ values are dependent on the composition of series
A (Li
1+xTaO
1+xCl
4−x, −0.70 ≤
x ≤ 0.50). For sample A/260-2
#, the σ values were low and changed a little (0.12−0.87 mS cm
−1) when −0.70 ≤
x ≤ 0. For samples A/380-2
# and A/460-10
#, the σ values increased gradually from 0.24/0.14 mS cm
−1 to peak values of 5.44/6.56 mS cm
−1 when −0.70 ≤
x ≤ 0.10, respectively (there were small experimental errors around
x = −0.10). Conversely, for samples with larger
x values than 0.10, the σ values decreased to 2.50/3.92 mS cm
−1 until
x = 0.50, respectively.
In short, when the lithiated value (x) varied between −0.70 and 0.10, larger x, higher temperature, and longer time, ranging from 260 °C/2 h to 460 °C/10 h, attained higher crystallinity and larger σ values for SSEs in Series A.
Figure 4b shows that the σ values are dependent on the composition of series
B (LiTaO
2+yCl
2−2y, −1.22 ≤
y ≤ 0). For sample B/380-2
#, the σ value increased gradually from 2.36 mS cm
−1 to a peak value of 4.63 mS cm
−1 when −1.22 ≤
y ≤ −0.25. Then, the σ value decreased to 2.38 mS cm
−1 until
y = 0. For sample B/460-10
#, a few TaCl
5 crystals were found on the wall of the quartz tube after calcining when
y ≤ −1.22. The σ value reached a peak of 7.35 mS cm
−1 when
y = −1.22. Then, the σ value decreased gradually from the peak value to 1.31 mS cm
−1 until
y = 0 (there was a small error when
y = −1).
In short, when the anoxic value (y) varied between −1.22 and −0.67, lower y, higher temperature, and longer time, ranging from 380 °C/2 h to 460 °C/10 h, attained higher crystallinity and larger σ values for SSEs in Series B.
Figure 4c and
Table S1 summarize the σ values in relation to chemical composition, synthesis temperature (
T = 260−460 °C), and dwell time (
D = 2−10 h). The ionic conductivity for each sample increased with the increase in temperature (and crystallinity), obeying Case 1 in
Section 1 (a few anomalies resulted from test errors).
Figure 4d,
Table S1, and
Figure S4 show that the σ and
Ea values are dependent on the synthesis temperature for seven representative samples. The
Ea values were 23.84/26.26 kJ mol
−1 for samples
I#−
II#, respectively. And the
Ea values ranged from 5.22 to 12.43 kJ mol
−1 for samples
III#−
VII#. The low
Ea values of SSEs facilitate Li-ion diffusion.
Samples
I# and
II# had matching nominal-realizable compositions (
m-Li
0.40TaO
0.40Cl
4.60) and were synthesized at 380 °C for 2 h and 460 °C for 10 h, respectively (
Figure 3f,g). But their σ values were as low as 1.21 and 0.82 mS cm
−1, respectively. This should be related to their large under-lithiated value (−|
x|) of −0.60 (
Figure 4a).
Other three-phase coexisting samples (
III#−
VII#) attained high σ values ranging from 5.20 to 7.35 mS cm
−1. The corresponding weight ratios were 40.8–80.6 wt.% for
m-LiTaO
2Cl
2 (major phase), 10.2–57.2 wt.% for
m-LiTaOCl
4 (2nd phase), and 2.0–17.9 wt.% for
o-Li
2Ta
2O
5Cl
2 (3rd phase), respectively. High conductivity of SSEs was determined by high contents of the
m-LiTaO
2Cl
2/
m-LiTaOCl
4 mixture, while the 3rd role of
o-Li
2Ta
2O
5Cl
2 was small. Sample
VI#, derived from series
B having an anoxic value (−|
y|) of −1.22 (
Figure 4b), attained the highest σ value with the highest content of
m-LiTaO
2Cl
2.
3.5. Initial Charge–Discharge Curves of ASSLIBs
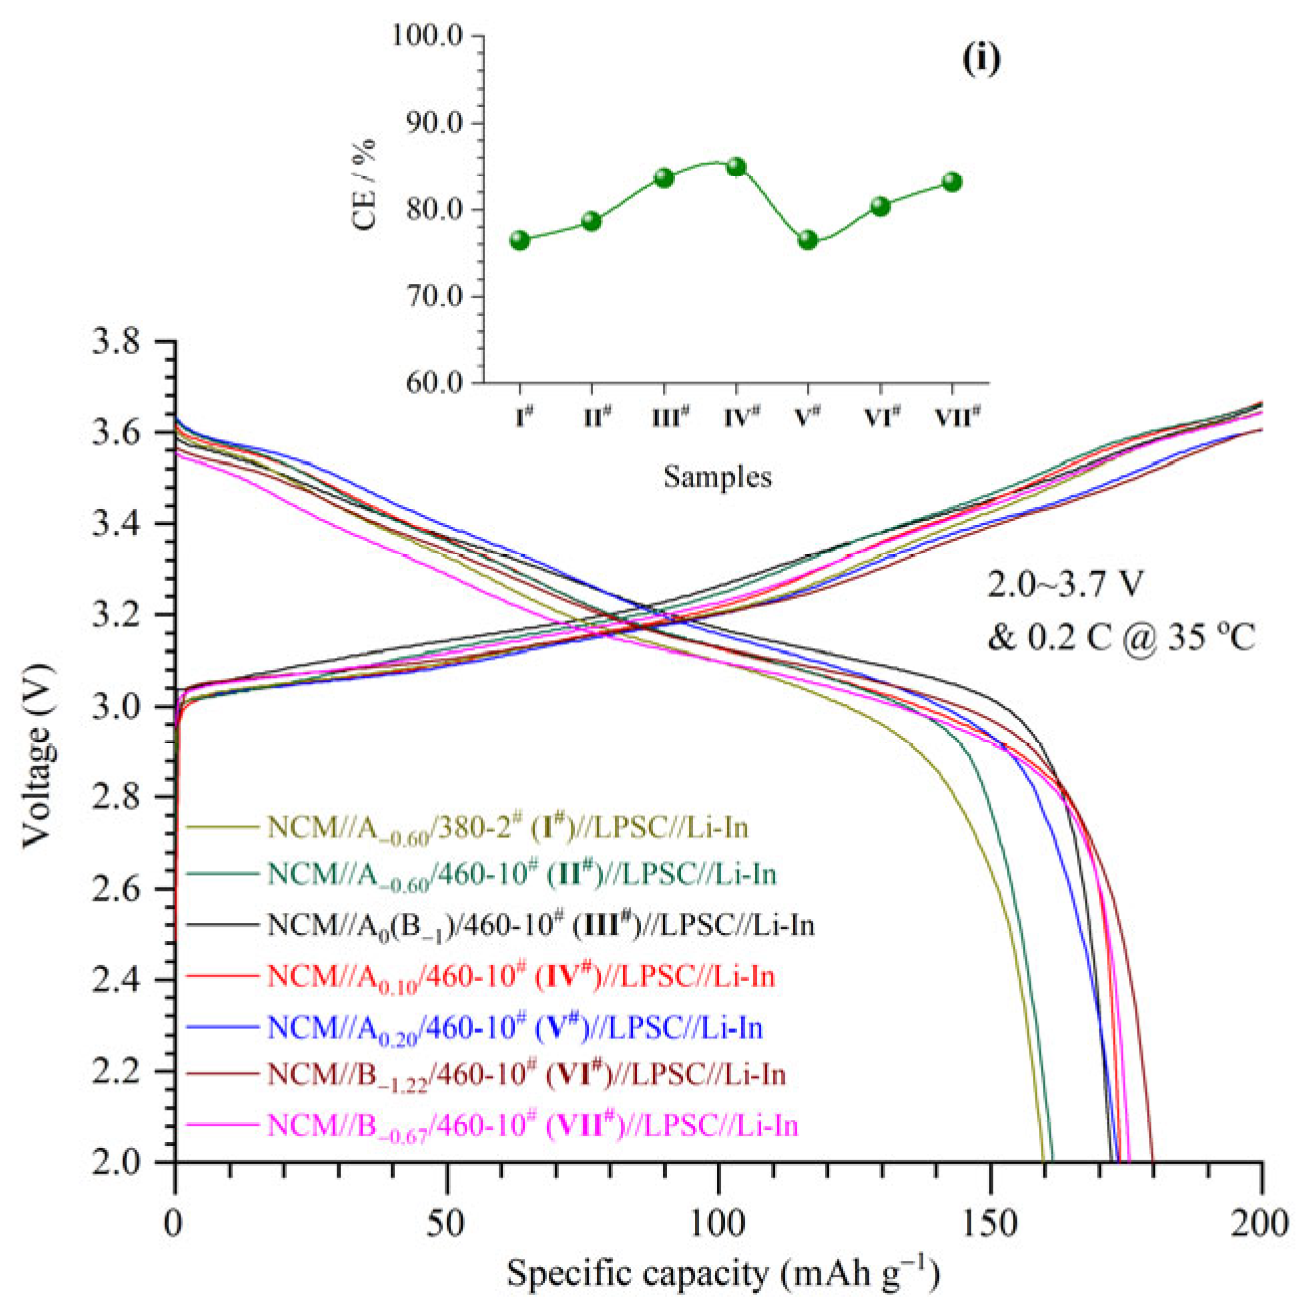
An ASSLIB (NCM//LTOC//LPSC//Li-In) was assembled with a dual-layer SSE in which the LTOC was taken from one of seven representative samples
I#−
VII#. The initial charge–discharge curves were obtained under cut-off voltages of 2.0–3.7 V at 0.2 C and 35 °C (
Figure 5). Results showed that all ASSLIBs (using different SSEs) delivered large battery capacities from 159.8 to 179.9 mAh g
−1, accompanying high initial Coulombic efficiencies (CEs) from 76.4% to 84.9% (inset i of
Figure 5). The two series of SSEs in this work have great application potential for next-generation ASSLIBs.
4. Conclusions
As the other pole of amorphous SSEs with high σ values working at lower temperatures, the developed crystalline Li-Ta-oxychlorides (LTOCs) with high σ values are promising candidates to work at higher temperatures, particularly for high-power and fast charging applications in ASSLIBs.
In this work, crystalline SSEs of series A (Li1+xTaO1+xCl4−x, −0.70 ≤ x ≤ 0.50) and B (LiTaO2+yCl2−2y, −1.22 ≤ y ≤ 0) were prepared for applications well over ambient temperatures.
Larger x, higher temperature, and longer time, ranging from 260 °C/2 h to 460 °C/10 h, attained higher crystallinity and larger σ values for SSEs in series A when the lithiated value (x) varied between −0.70 and 0.10. Lower y, higher temperature, and longer time, ranging from 380 °C/2 h to 460 °C/10 h, attained higher crystallinity and larger σ values for SSEs in series B when the anoxic value (y) varied between −1.22 and −0.67.
The optimized crystalline SSEs of LTOCs had lithium superionic conduction up to 7.35 mS cm−1. High conductivity of SSEs was determined by high contents of the m-LiTaO2Cl2/m-LiTaOCl4 mixture, while the 3rd role of o-Li2Ta2O5Cl2 was small. The synergistic effect facilitates a low activation energy for Li-ion diffusion and high ionic conductivity.


