Article

Impact of Calcination Temperature on the Properties and Photocatalytic Efficiency of Cd0.6Mg0.2Cu0.2Fe2O4 Spinel Ferrites Synthesized via the Sol–Gel Method

1
Laboratory of Condensed Matter and Nanosciences, University of Monastir, Monastir 5000, Tunisia
2
Laboratory of Advanced Materials and Interfaces (LIMA), Faculty of Sciences of Monastir, University of Monastir, Avenue of Environment, Monastir 5000, Tunisia
3
Department of Physics, Faculty of Science, King Khalid University, P.O. Box 9004, Abha 61413, Saudi Arabia
4
Laboratory of Physics of Condensed Matter (LPMC), University of Picardie Jules Verne, Scientific, Pole, 33 Rue Saint-Leu, 80039 Amiens Cedex 1, France
5
Laboratory of Advanced Multifunctional Materials and Technological Applications, Faculty of Science and Technology of Sidi Bouzid, University of Kairouan, Sidi Bouzid 9100, Tunisia
6
Plateforme de Recherche en Sciences et Technologies, Monastir University, Monastir 5000, Tunisia
*
Author to whom correspondence should be addressed.
Crystals 2025, 15(5), 457; https://doi.org/10.3390/cryst15050457
Submission received: 20 January 2025 / Revised: 21 February 2025 / Accepted: 8 May 2025 / Published: 13 May 2025
(This article belongs to the Section Inorganic Crystalline Materials)

Abstract

:
This study investigates the influence of calcination temperature on the structural, morphological, and optical properties of Cd0.6Mg0.2Cu0.2Fe2O4 spinel ferrites synthesized via the sol–gel method. By varying the calcination temperatures (950 °C and 1050 °C), we analyze changes in crystallinity, cation distribution, and energy band gap using X-ray diffraction (XRD), scanning electron microscopy (SEM), X-ray photoelectron spectroscopy (XPS), and UV–visible spectroscopy. The results indicate that increasing calcination temperature enhances crystallinity and increases particle size while reducing the optical band gap energy. XPS analysis confirms shifts in cation site occupancy and an increase in oxygen vacancies at higher temperatures, which are crucial for charge carrier dynamics. Photocatalytic performance, evaluated through methylene blue degradation under UV light, improves with increasing calcination temperature due to enhanced charge separation and reduced recombination. These findings underscore the critical role of calcination temperature in optimizing spinel ferrites for environmental applications, particularly in wastewater treatment.

1. Introduction

Spinel ferrites, represented by the general formula M-Fe2O4, where M denotes a divalent metal cation, have emerged as a focal point in both fundamental and applied research due to their multifunctional capabilities [1,2]. These materials exhibit distinctive structural, optical, and magnetic properties that render them sui for a myriad of applications, including magnetic devices, electronic components, and photocatalysis. The broad interest in spinel ferrites arises from their compositional versatility, which permits various substitutions at the metal cation sites, thus enabling fine-tuning of their functional properties to meet specific application requirements [1,2,3,4,5,6,7,8,9,10]. Notably, the integration of diverse metal cations allows for significant modulation of the physical and chemical properties of the ferrites, consequently enhancing their performance across a range of practical applications.
The structural attributes of spinel ferrites are intricately linked to their synthesis methods and the conditions employed during processing, with calcination temperature playing a crucial role [11]. The calcination process is vital for determining the crystallinity, phase purity, and grain size of the resulting materials. Increasing the calcination temperature has been shown to induce substantial alterations in the crystallite size and morphology of spinel ferrites. A well-defined crystalline structure is instrumental in contributing to the material’s optical and magnetic functionalities [11,12,13,14,15,16,17]. Furthermore, the optical properties, such as the energy band gap of ferrites, are significantly modulated by the calcination conditions. The energy band gap serves as a pivotal parameter that governs electronic transitions within the material, profoundly influencing its photocatalytic activity [11,12,13,14,15,16,17]. Previous investigations have demonstrated a pronounced correlation between calcination temperature and alterations in the optical energy band gap. These modifications in optical properties can subsequently enhance the photocatalytic efficiency of the ferrites, positioning them as effective candidates for applications such as dye degradation.
The photocatalytic degradation of organic dyes constitutes a critical component of environmental remediation, particularly in addressing hazardous waste generated from industrial processes [18,19,20,21]. Methylene blue, a widely utilized synthetic dye, presents considerable ecological hazards owing to its toxicological properties and persistence in the ecosystem [22,23,24,25]. Researchers are actively pursuing efficient photocatalysts for the degradation of such dyes under UV and visible light irradiation, with spinel ferrites exhibiting promising capabilities in this regard [26]. The photocatalytic activities of spinel ferrites are influenced significantly by their structural features, including porosity and surface area, which are instrumental in determining their reactivity. Through strategic manipulation of metal compositions and synthesis parameters, such as calcination temperature, researchers have the ability to engineer ferrites with optimized photocatalytic performance [27,28,29]. The mechanisms facilitating photocatalysis in ferrites involve the generation of electron–hole pairs upon light irradiation, which subsequently leads to the formation of reactive species responsible for the degradation of organic pollutants.
The CdMgCuFe2O4 spinel ferrite has garnered significant attention due to its exceptional combination of magnetic and photocatalytic properties. For the synthesized ferrite Cd0.6Mg0.2Cu0.2Fe2O4, the ratios of cadmium (Cd), magnesium (Mg), and copper (Cu), 0.6, 0.2, and 0.2, respectively, were selected based on prior work conducted by our research team in the field [30,31,32]. For instance, earlier studies suggest that higher concentrations of cadmium enhance crystallinity, which is closely associated with improved charge carrier separation and a reduced band gap energy [33]. The inclusion of cadmium not only facilitates effective charge carrier separation [34,35], but the incorporation of magnesium and copper ions also enhances both the magnetic behavior and the photocatalytic activity of the material [36,37]. They influence the magnetic properties indirectly through their effects on structural modifications, cation distribution, and super-exchange interactions [38,39]. By integrating this knowledge, the specific ratios were carefully chosen to optimize the ferrite’s properties, aiming to improve its performance in environmental applications. Consequently, understanding the implications of calcination temperature on the properties of Cd0.6Mg0.2Cu0.2Fe2O4 is of paramount importance for optimizing its performance in photocatalytic applications.
Experimental findings have illustrated that variations in crystallite size and morphology significantly impact the photocatalytic activity of ferrites, correlating directly with changes in calcination temperature [40,41]. In light of these considerations, this study aims to investigate the specific effects of calcination temperature on the structural, morphological, and optical properties of Cd0.6Mg0.2Cu0.2Fe2O4 spinel ferrites synthesized via the sol–gel method. Calcination temperatures of 950 °C (S1) and 1050 °C (S2) will be meticulously analyzed and contrasted to elucidate their effects on crystallinity, microstructure, and energy band gap. Subsequently, the photocatalytic activity of the synthesized ferrites will be assessed through the degradation of methylene blue as a representative pollutant. This research endeavors to provide comprehensive insights into the intricate relationships among synthesis conditions, material properties, and photocatalytic performance, thereby paving the way for future advancements in the utilization of spinel ferrites for environmental applications.

2. Experimental Section
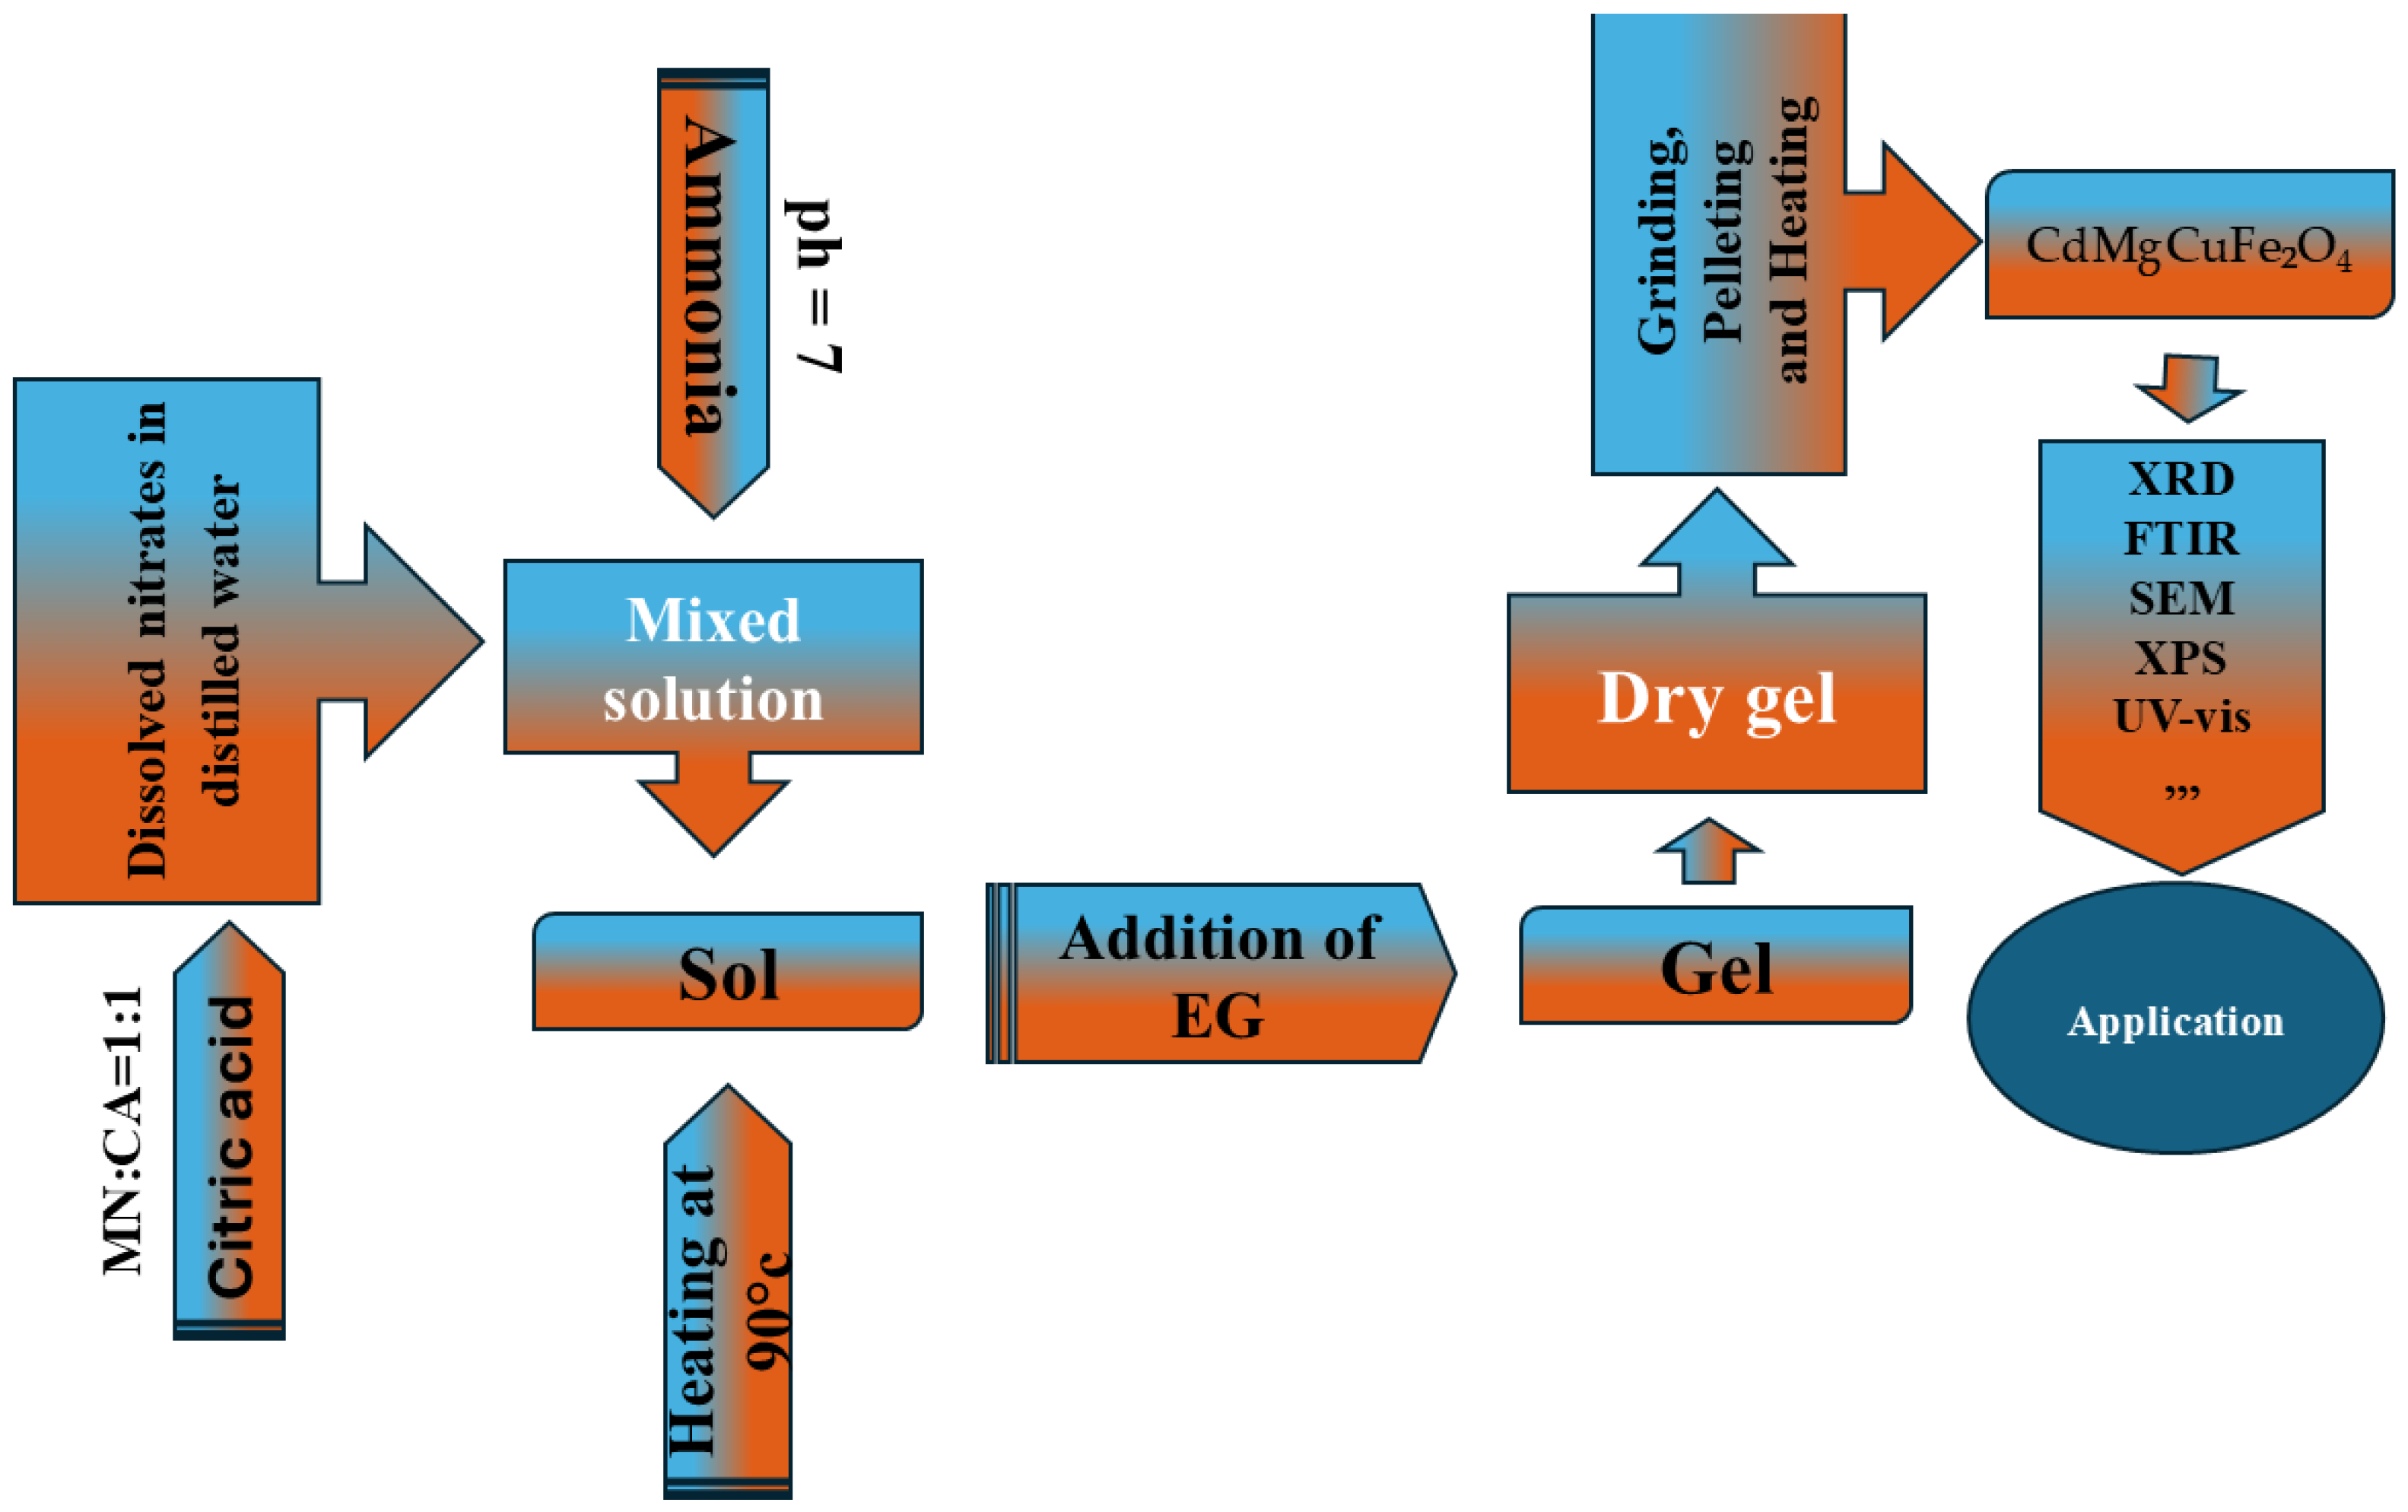
2.1. Synthesis

The synthesis of Cd0.6Mg0.2Cu0.2Fe2O4 was carried out using the sol–gel method, known for its ability to precisely control chemical composition and produce materials with high purity and homogeneity. The precursors used in this study included iron (III) nitrate nonahydrate (Fe(NO3)3·9H2O) (≥99%), magnesium nitrate hexahydrate (Mg(NO3)2·6H2O) (≥98%), cadmium nitrate tetrahydrate (Cd(NO3)2·4H2O) (≥99%), and copper(II) acetate monohydrate (C4H6CuO4·H2O) (≥97%). All chemicals were bought from Sigma Aldrich.
Figure 1 exhibits the steps of the sol–gel process. In the first step, these precursors were dissolved in water under thermal stirring at 90 °C to obtain a homogeneous solution. Citric acid monohydrate (C6H8O7·H2O) was then added, maintaining a molar ratio of 1:1 with the nitrates to act as a complexing agent, promoting homogeneous dispersion of the metal cations in the solution. After the complete dissolution of citric acid, ethylene glycol (HO(CH2)2OH) was introduced as a cross-linking agent. The solution was heated and stirred until a stable gel formed, which took approximately 4 h.
The gel was then dried at 250 °C for 12 h, producing a dry foam, which was subsequently ground in an agate mortar. This powder underwent a series of calcinations to promote the development of the desired crystalline structure: 400 °C for 24 h, 600 °C for 24 h, 800 °C for 12 h, and finally, two specific treatments for samples S1 and S2 at 950 °C and 1050 °C for 6 h, respectively. After each calcination step, the powder was ground to ensure maximum homogeneity of the final product.

2.2. Photocatalytic Test

The photocatalytic performance of our ferrite catalysts was evaluated by decomposing methylene blue (MB) dye under UV light irradiation at room temperature. A 5 W Puicense UV lamp was used as the light source, which predominantly emits in the UV range with a peak emission around 365 nm. No band pass filter was applied, ensuring direct exposure to the full UV spectrum of the lamp. The photocatalytic reaction was conducted using 5, 10, 20, and 40 mg of each compound in a 20 mg/L aqueous MB dye solution (pH = 6). Prior to irradiation, the suspension mixtures were stirred in the dark for 30 min to achieve adsorption–desorption equilibrium of the dye molecules on the catalyst surface. After irradiation, the catalyst particles were removed by filtration, and the concentration of MB dye was monitored by recording the absorbance changes in the supernatant at 664 nm using a spectrophotometer.

2.3. Characterization

Utilizing a DMAX-3A apparatus equipped with Cu Kα radiation at a wavelength of 1.5406 Å, X-ray diffraction (XRD) was utilized to examine the structural and phase analysis of the Cd0.6Mg0.2Cu0.2Fe2O4 ferrites. With a step size of 0.05°, the XRD spectra were scanned within a 2θ range of 10–80°. Using a scanning electron microscope, the surface structure of the materials was examined (SEM, CRL-ZESISEVO-MAI5). Thermo-Fisher apparatus with Al K source with energy of 1486.6 eV was used to perform X-ray photoelectron spectroscopy (XPS) to investigate the chemical states of the elements in the sample. The Advantage program (Version 5.9931) was used to fit the high-resolution spectra. The curve-fitting method was applied to the Shirley-type background with a Gaussian–Lorentzian spectral line shape (30% Lorentzian component). The C–C and C–H, components of the “neutral” C peak binding energy, was utilized to calibrate XPS spectra at 284.8eV. With a time difference of 30 min, the photocatalytic activity of the Cd0.6Mg0.2Cu0.2Fe2O4 catalyst against MB dye was assessed using a UV–vis spectrometer at various intervals from 30 to 180 min.

3. Results and Discussion

3.1. Structural and Morphological Analyses

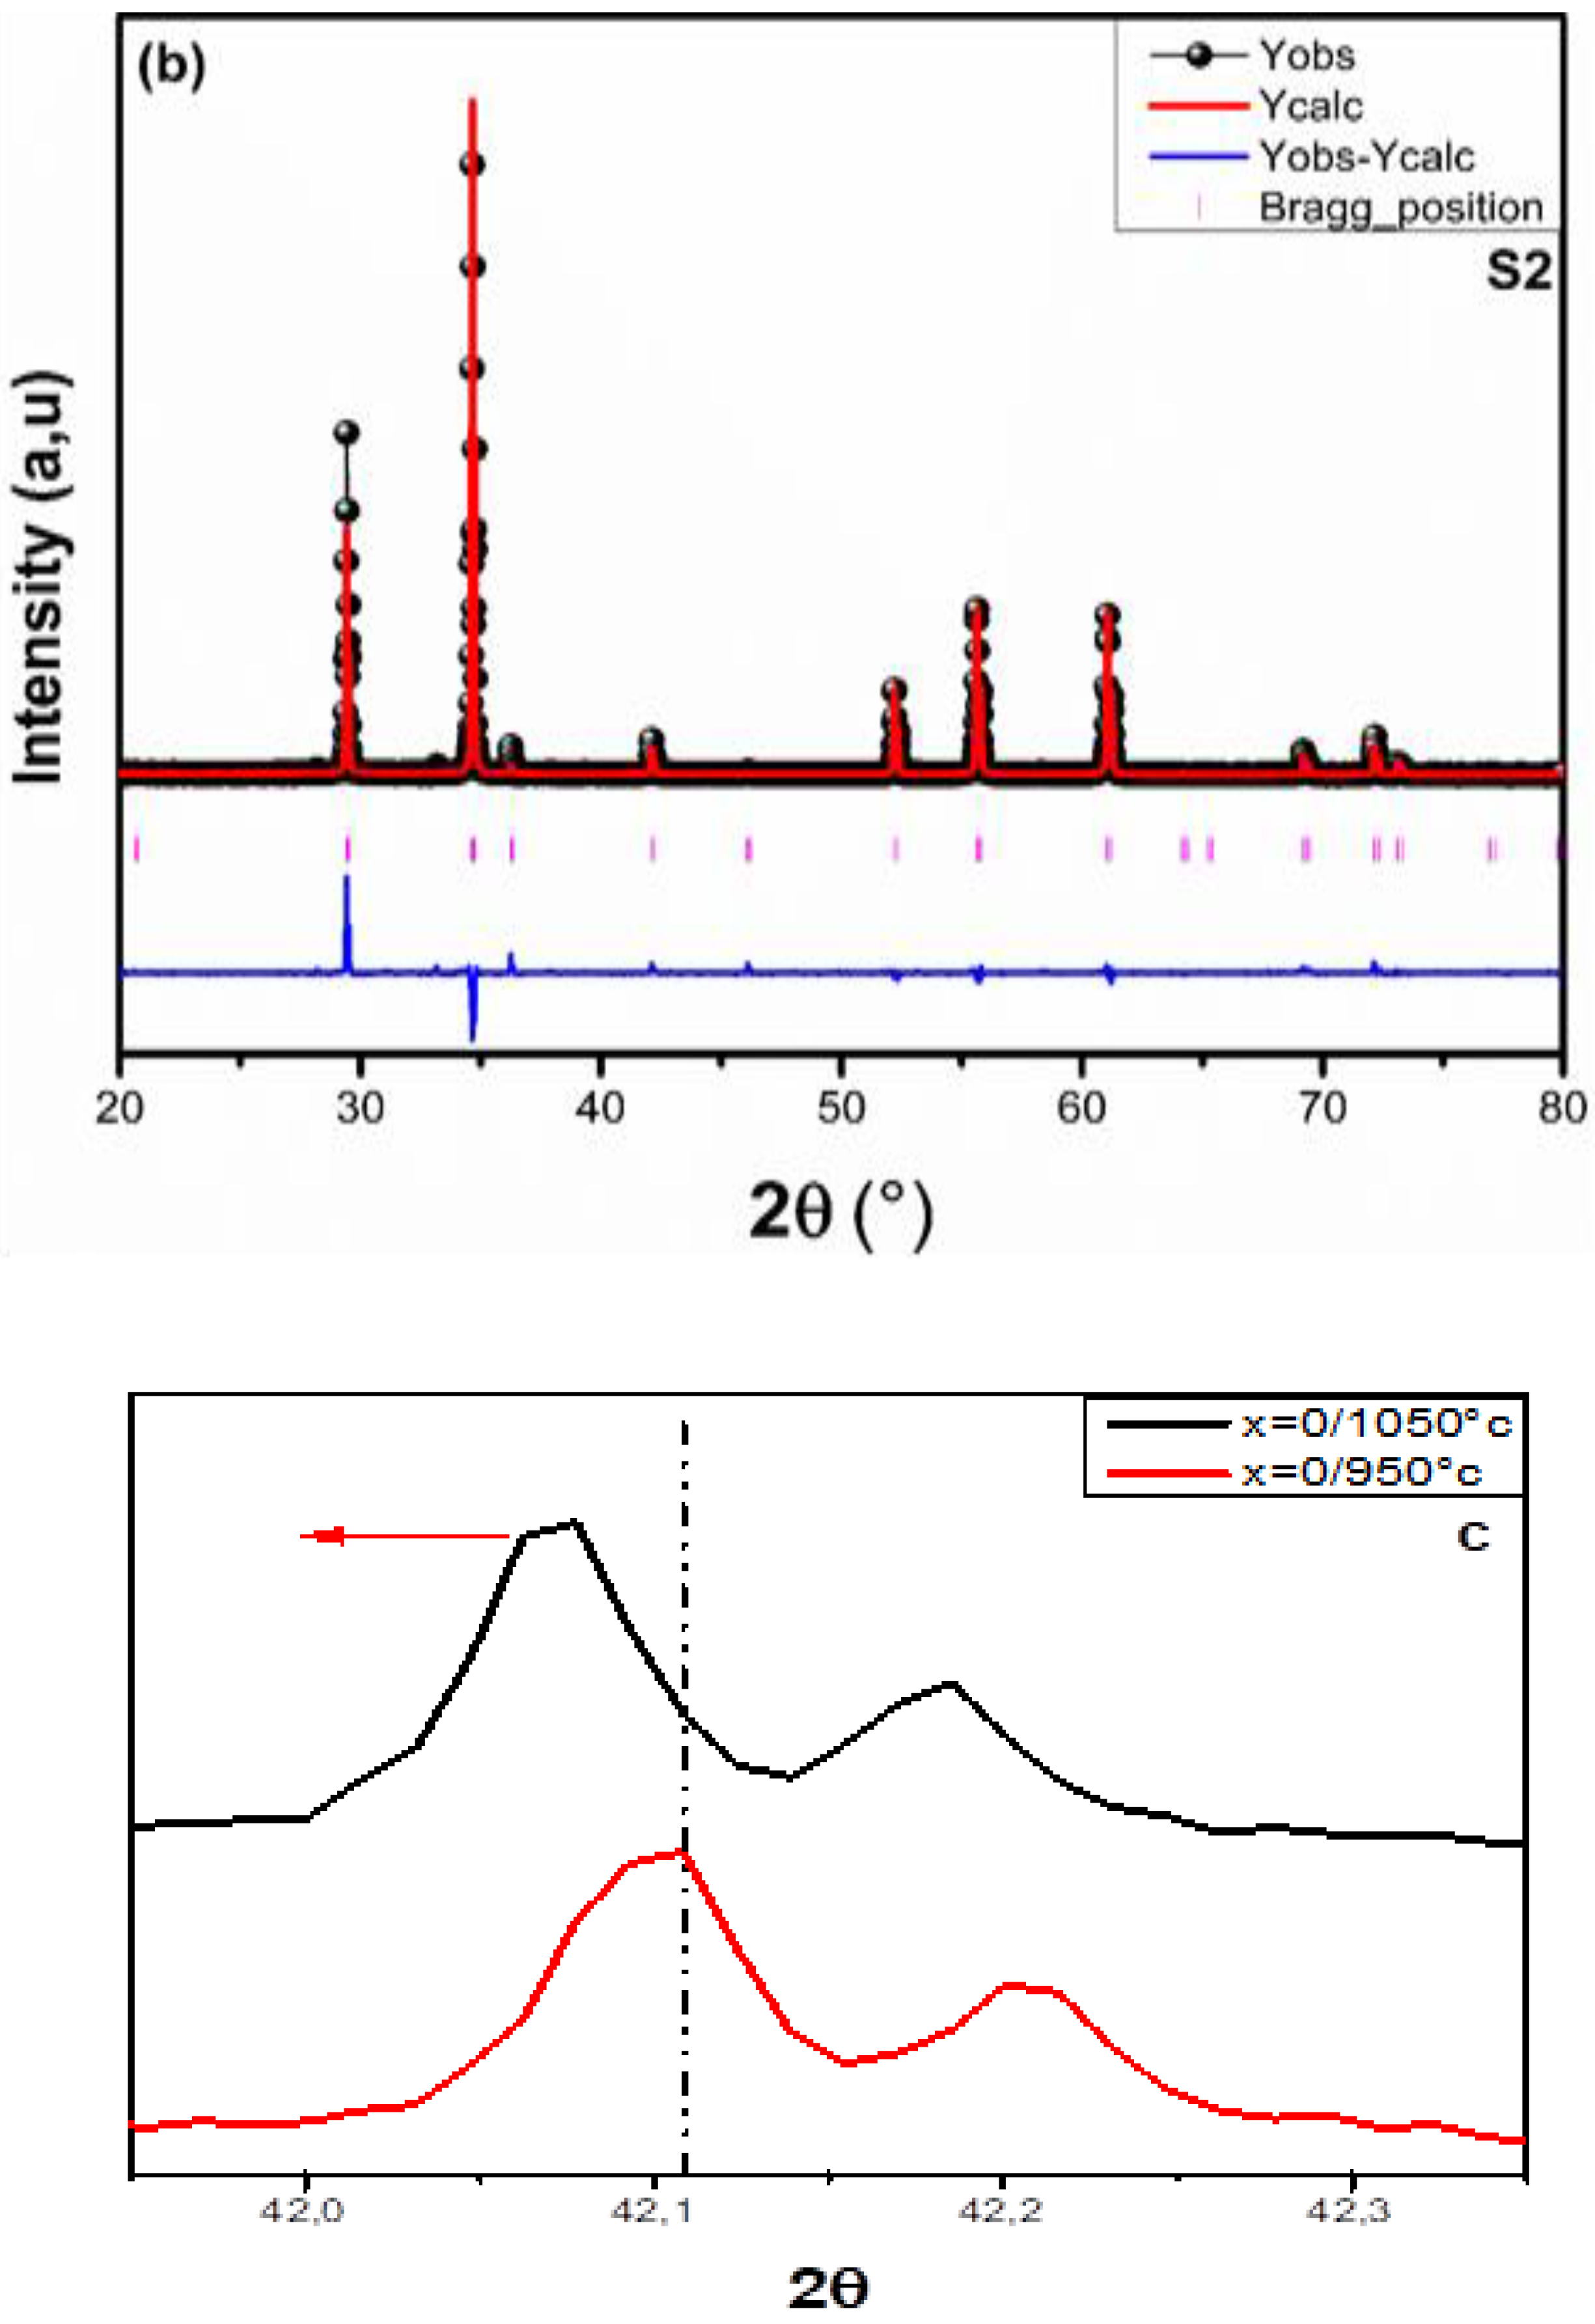
3.1.1. X-Ray Diffraction (XRD)

The X-ray diffraction (XRD) patterns for Cd0.6Mg0.2Cu0.2Fe2O4 ferrites frit at two different temperatures (950 °C and 1050 °C) are illustrated in Figure 2a,b. We observed the absence of additional impurity-related peaks signifies the high purity of our synthesized samples. As the calcination temperature increases, the peaks in the XRD patterns demonstrate an increase in intensity and sharpening, indicative of improved crystallinity and enlargement of the nanoparticles. This phenomenon is reflected in the observed decrease in peak width alongside an increase in peak intensity, which suggests a thermally activated enhancement of the crystalline structure at higher temperatures. Furthermore, the lattice parameters and cell volume exhibit an upward trend with elevated sintering temperatures, pointing to lattice relaxation processes occurring at these temperatures [42,43,44,45]. The peak positions in the XRD patterns exhibit slight shifts toward lower diffraction angles as shown in Figure 2c, leading to an increase in lattice constant (a) according to the following relation [43]:
a = λ h 2 + k 2 + l 2 2 sin θ
where λ = 1.5406, Å is the X-ray wavelength, a is the lattice constant, θ is the diffraction angle, and (hkl) are the Miller indices. The Rietveld refinement of the XRD patterns for the Cd0.6Mg0.2Cu0.2Fe2O4 samples is presented in Figure 2a,b and the goodness of fit (χ2) reveals a high level of agreement between the observed and estimated patterns based on the JCPDS file (no: 79-1155), as indicated by the low residual values. This is indicating the good quality of the refinement. The data in Table 1 reveal that as the calcination temperatures rise, both the lattice constant (a) and the volume (V = a3) increase, which aligns with findings from earlier studies [45,46]. This rise in cell parameters can be attributed to several factors. Elevated calcination temperatures provide enhanced thermal energy that facilitates metal ion migration and rearrangement within the crystal lattice, culminating in lattice expansion. Additionally, these higher temperatures promote the formation of larger, well-defined crystalline structures, thereby enhancing lattice ordering and increasing lattice parameters. As illustrated in Table 1, the compound calcined at 1050 °C exhibits a lower density (dx) compared to the one calcined at 950 °C. This discrepancy can be explained by the increase in the lattice constant a [47]. Moreover, at higher calcination temperatures, processes such as recrystallization and cell volume expansion contribute to crystallite growth. As evidenced by our XRD analysis, the average crystallite size increases from 12.14 at 950 °C to 13.05 nm at 1050 °C. Although the absolute difference is modest, it exceeds the experimental uncertainty, thereby confirming that the elevated calcination temperature has a statistically significant impact on crystallite development [48]. The augmented crystallinity of the samples at elevated temperatures is reflected in increased diffraction peak intensities and reduced peak widths [49,50]. This increase in atomic mobility, which diminishes surface energy, plays a crucial role in facilitating enhanced particle crystallization [51].

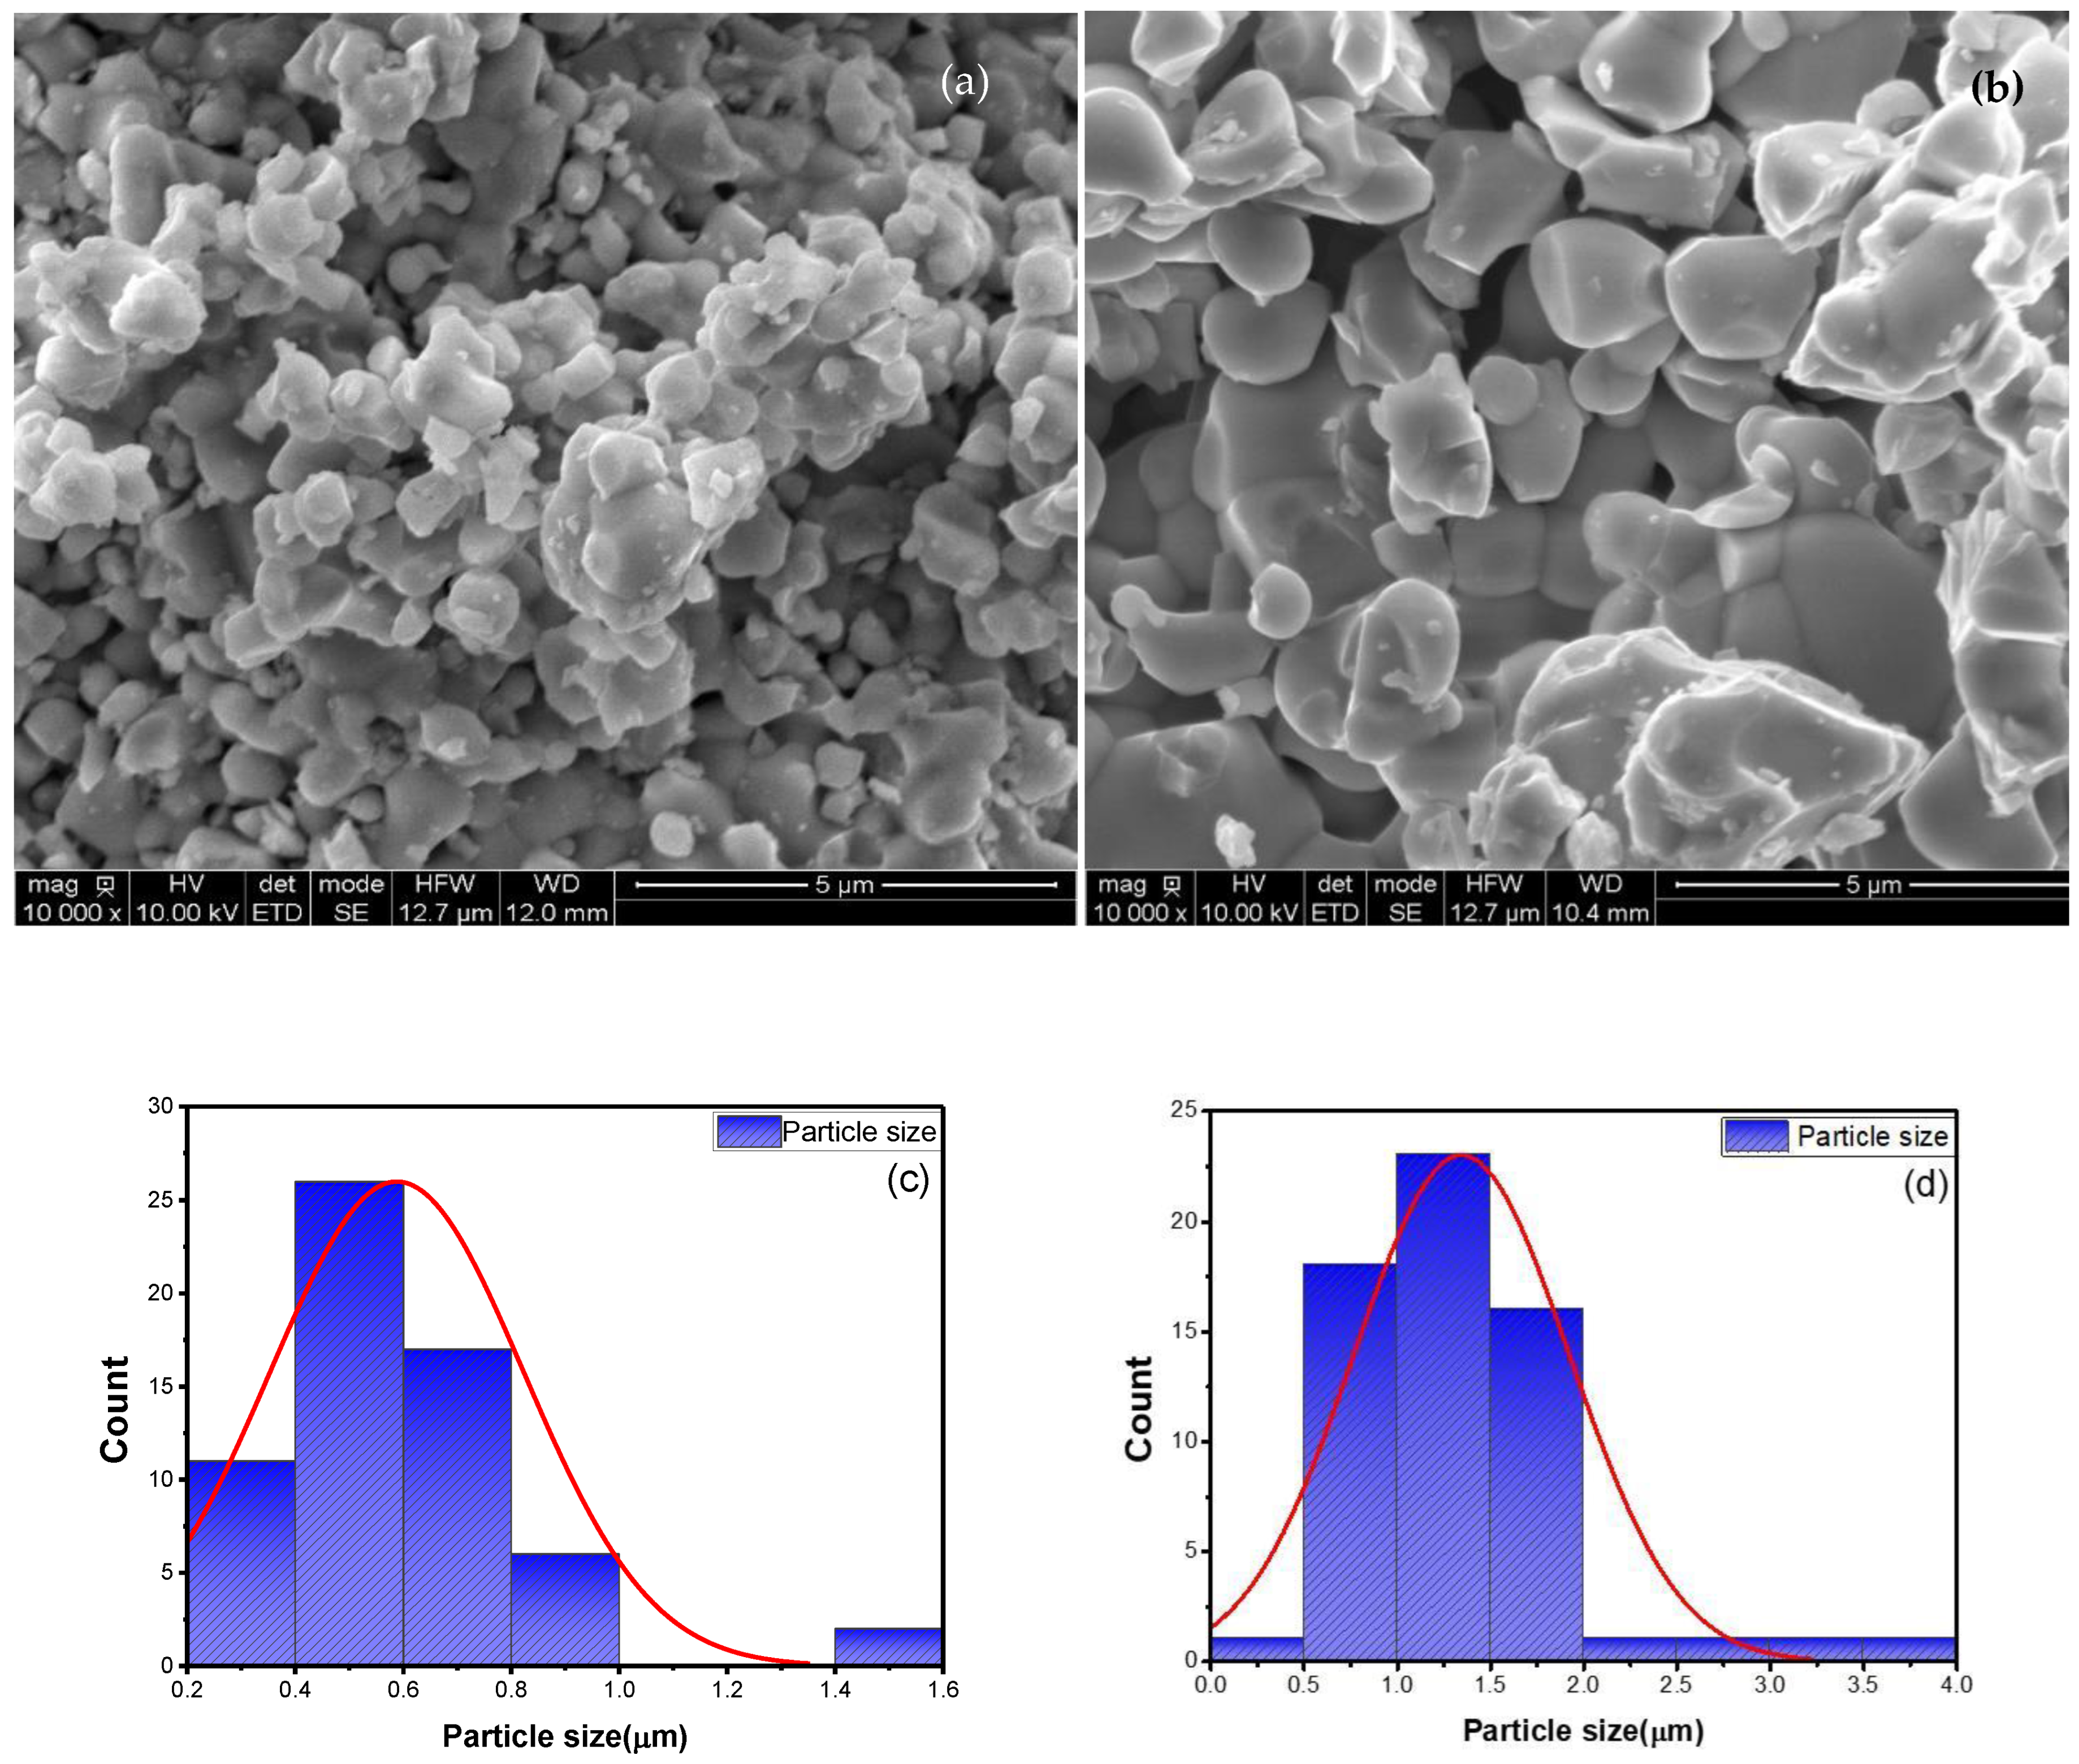
3.1.2. Morphology Study (SEM)

The SEM images presented in Figure 3a,b for Cd0.6Mg0.2Cu0.2Fe2O4 compounds demonstrate a uniform distribution of grain shapes across both samples. The calcination temperature plays a crucial role in influencing the size, arrangement, and morphology of the grains. In this study, Cd0.6Mg0.2Cu0.2Fe2O4 compounds were synthesized at elevated calcination temperatures of 950 °C and 1050 °C. These higher temperatures were employed to enhance the crystallinity of the compounds and achieve a homogeneous microstructure. The particle size distributions were meticulously evaluated using ImageJ software, as illustrated in Figure 3c,d. It was observed that increasing the calcination temperature leads to a significant enlargement of particle size. Specifically, the particle sizes were approximately 0.60 µm at a calcination temperature of 950 °C and increased to around 1.35 µm when the temperature was raised to 1050 °C. This enlargement can be attributed to the enhanced atomic mobility and grain growth facilitated by the higher calcination temperatures, ultimately contributing to improved material properties.

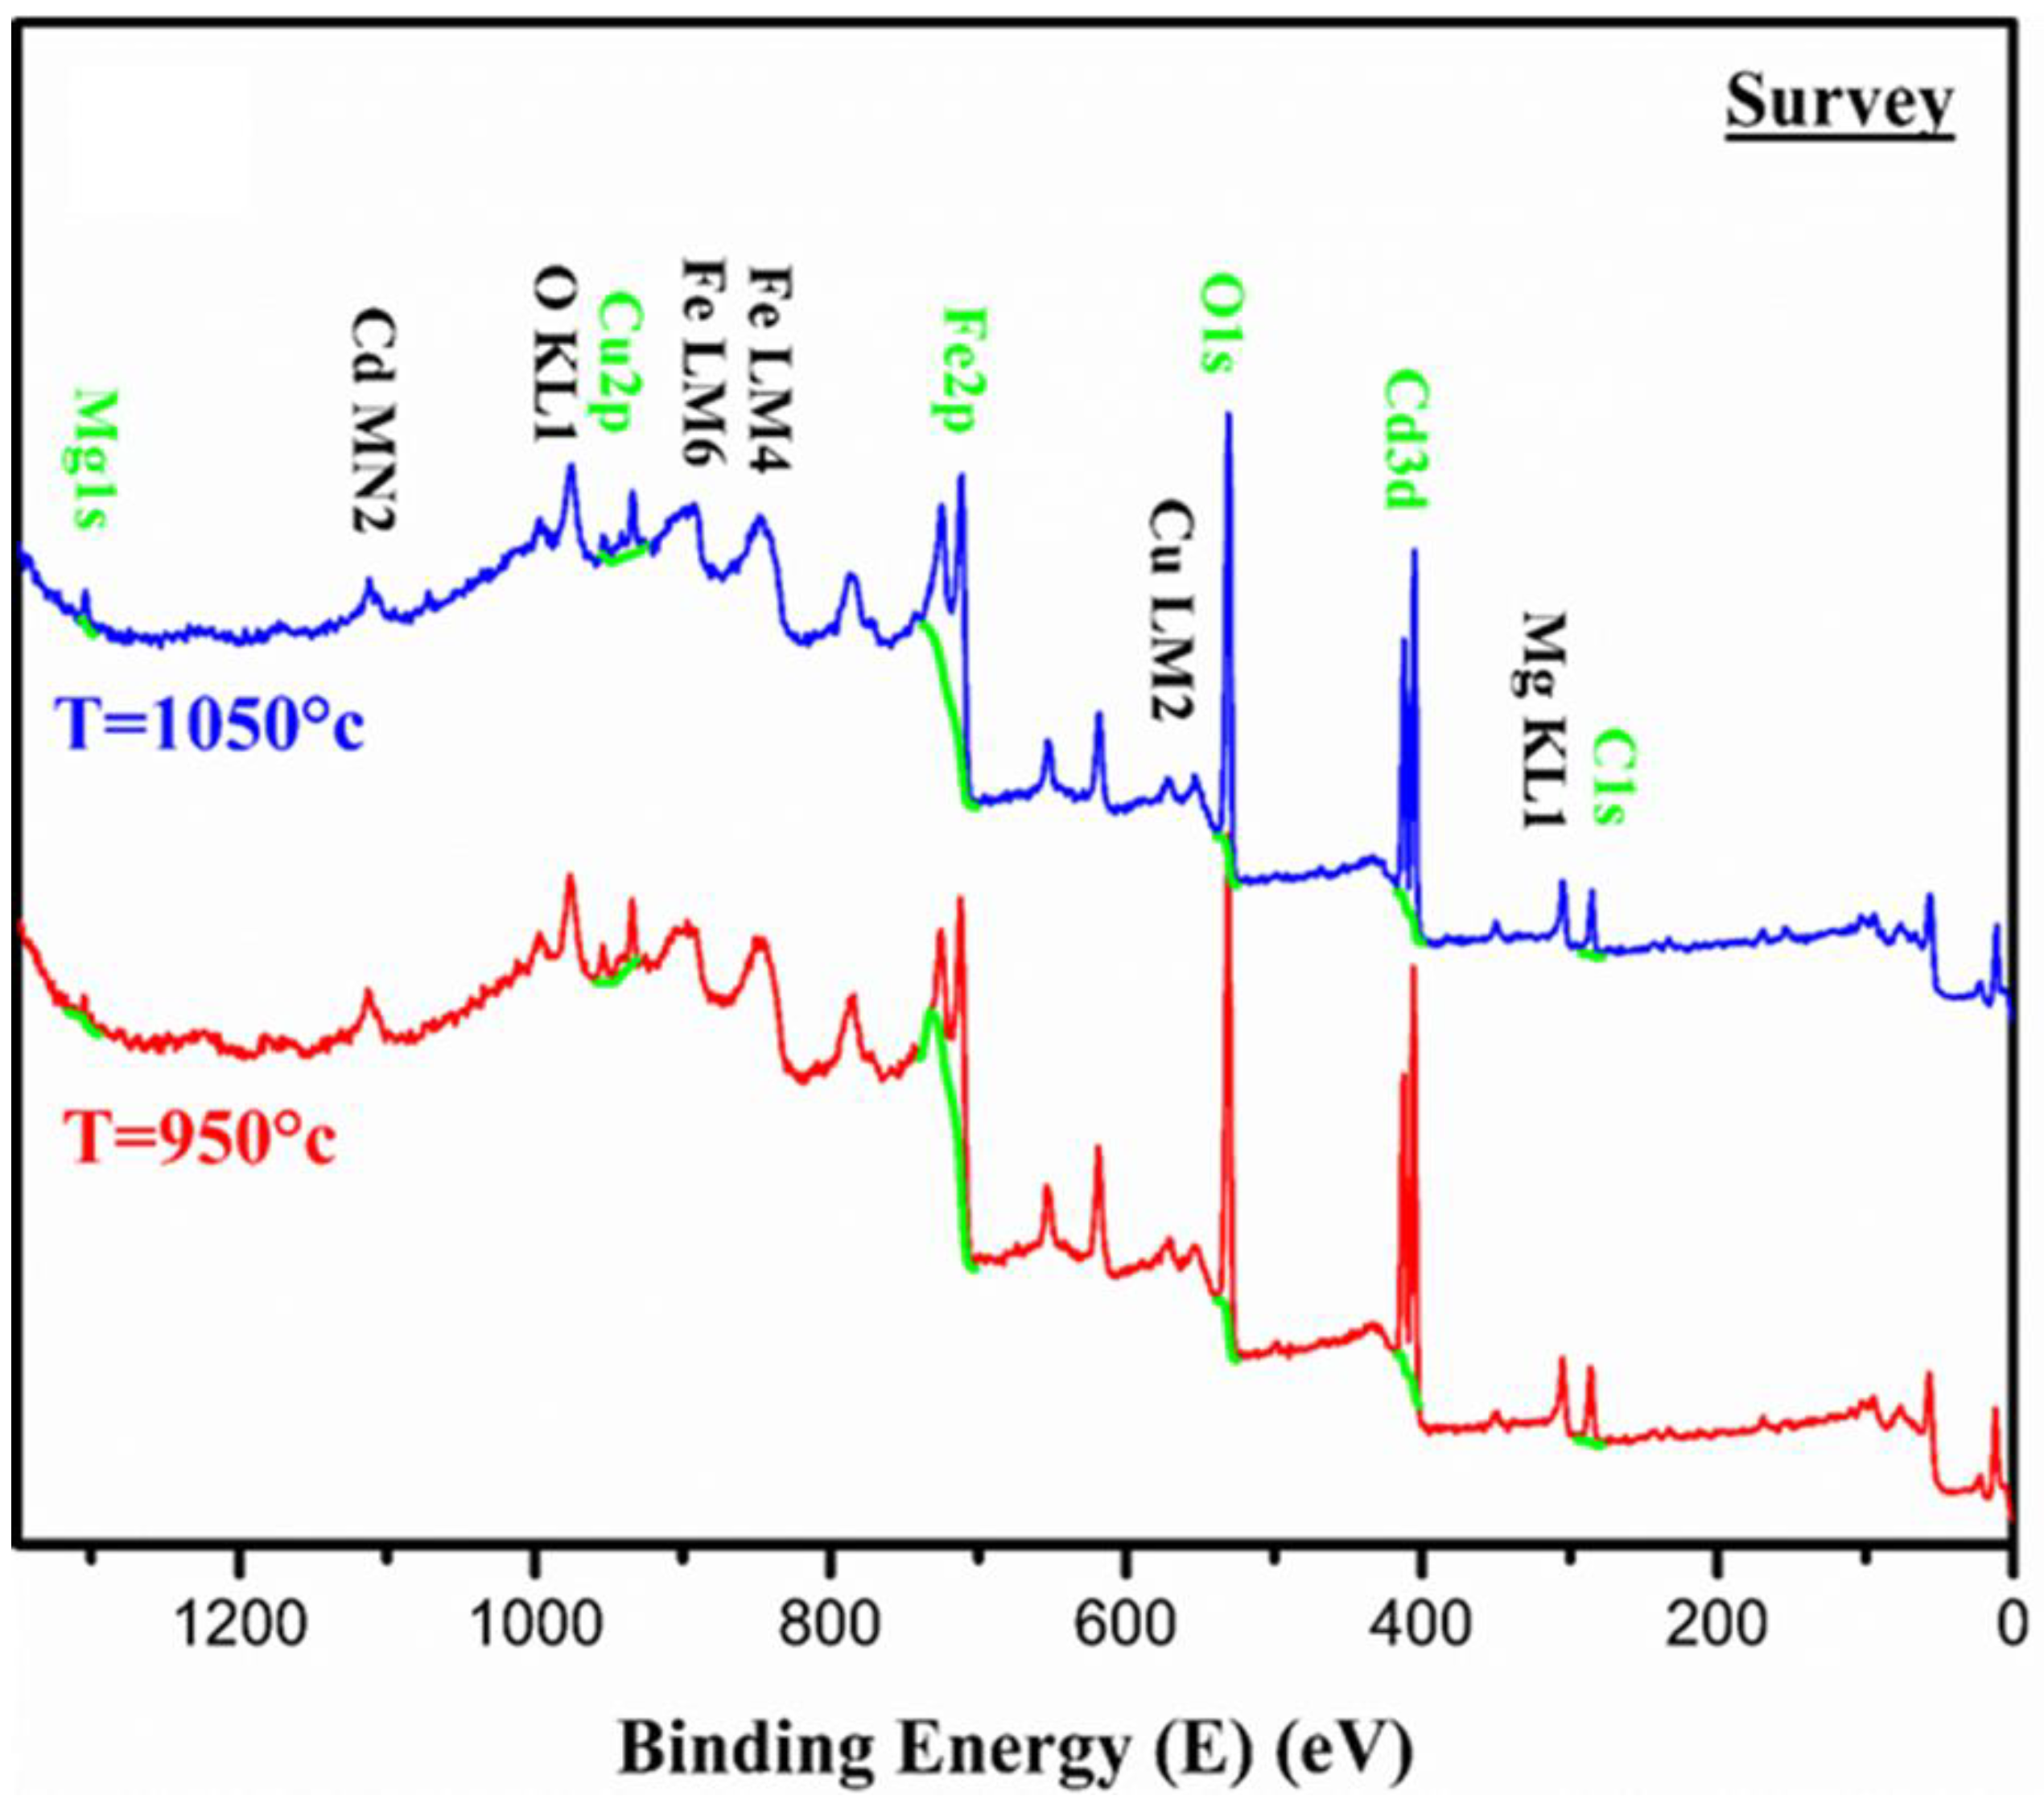
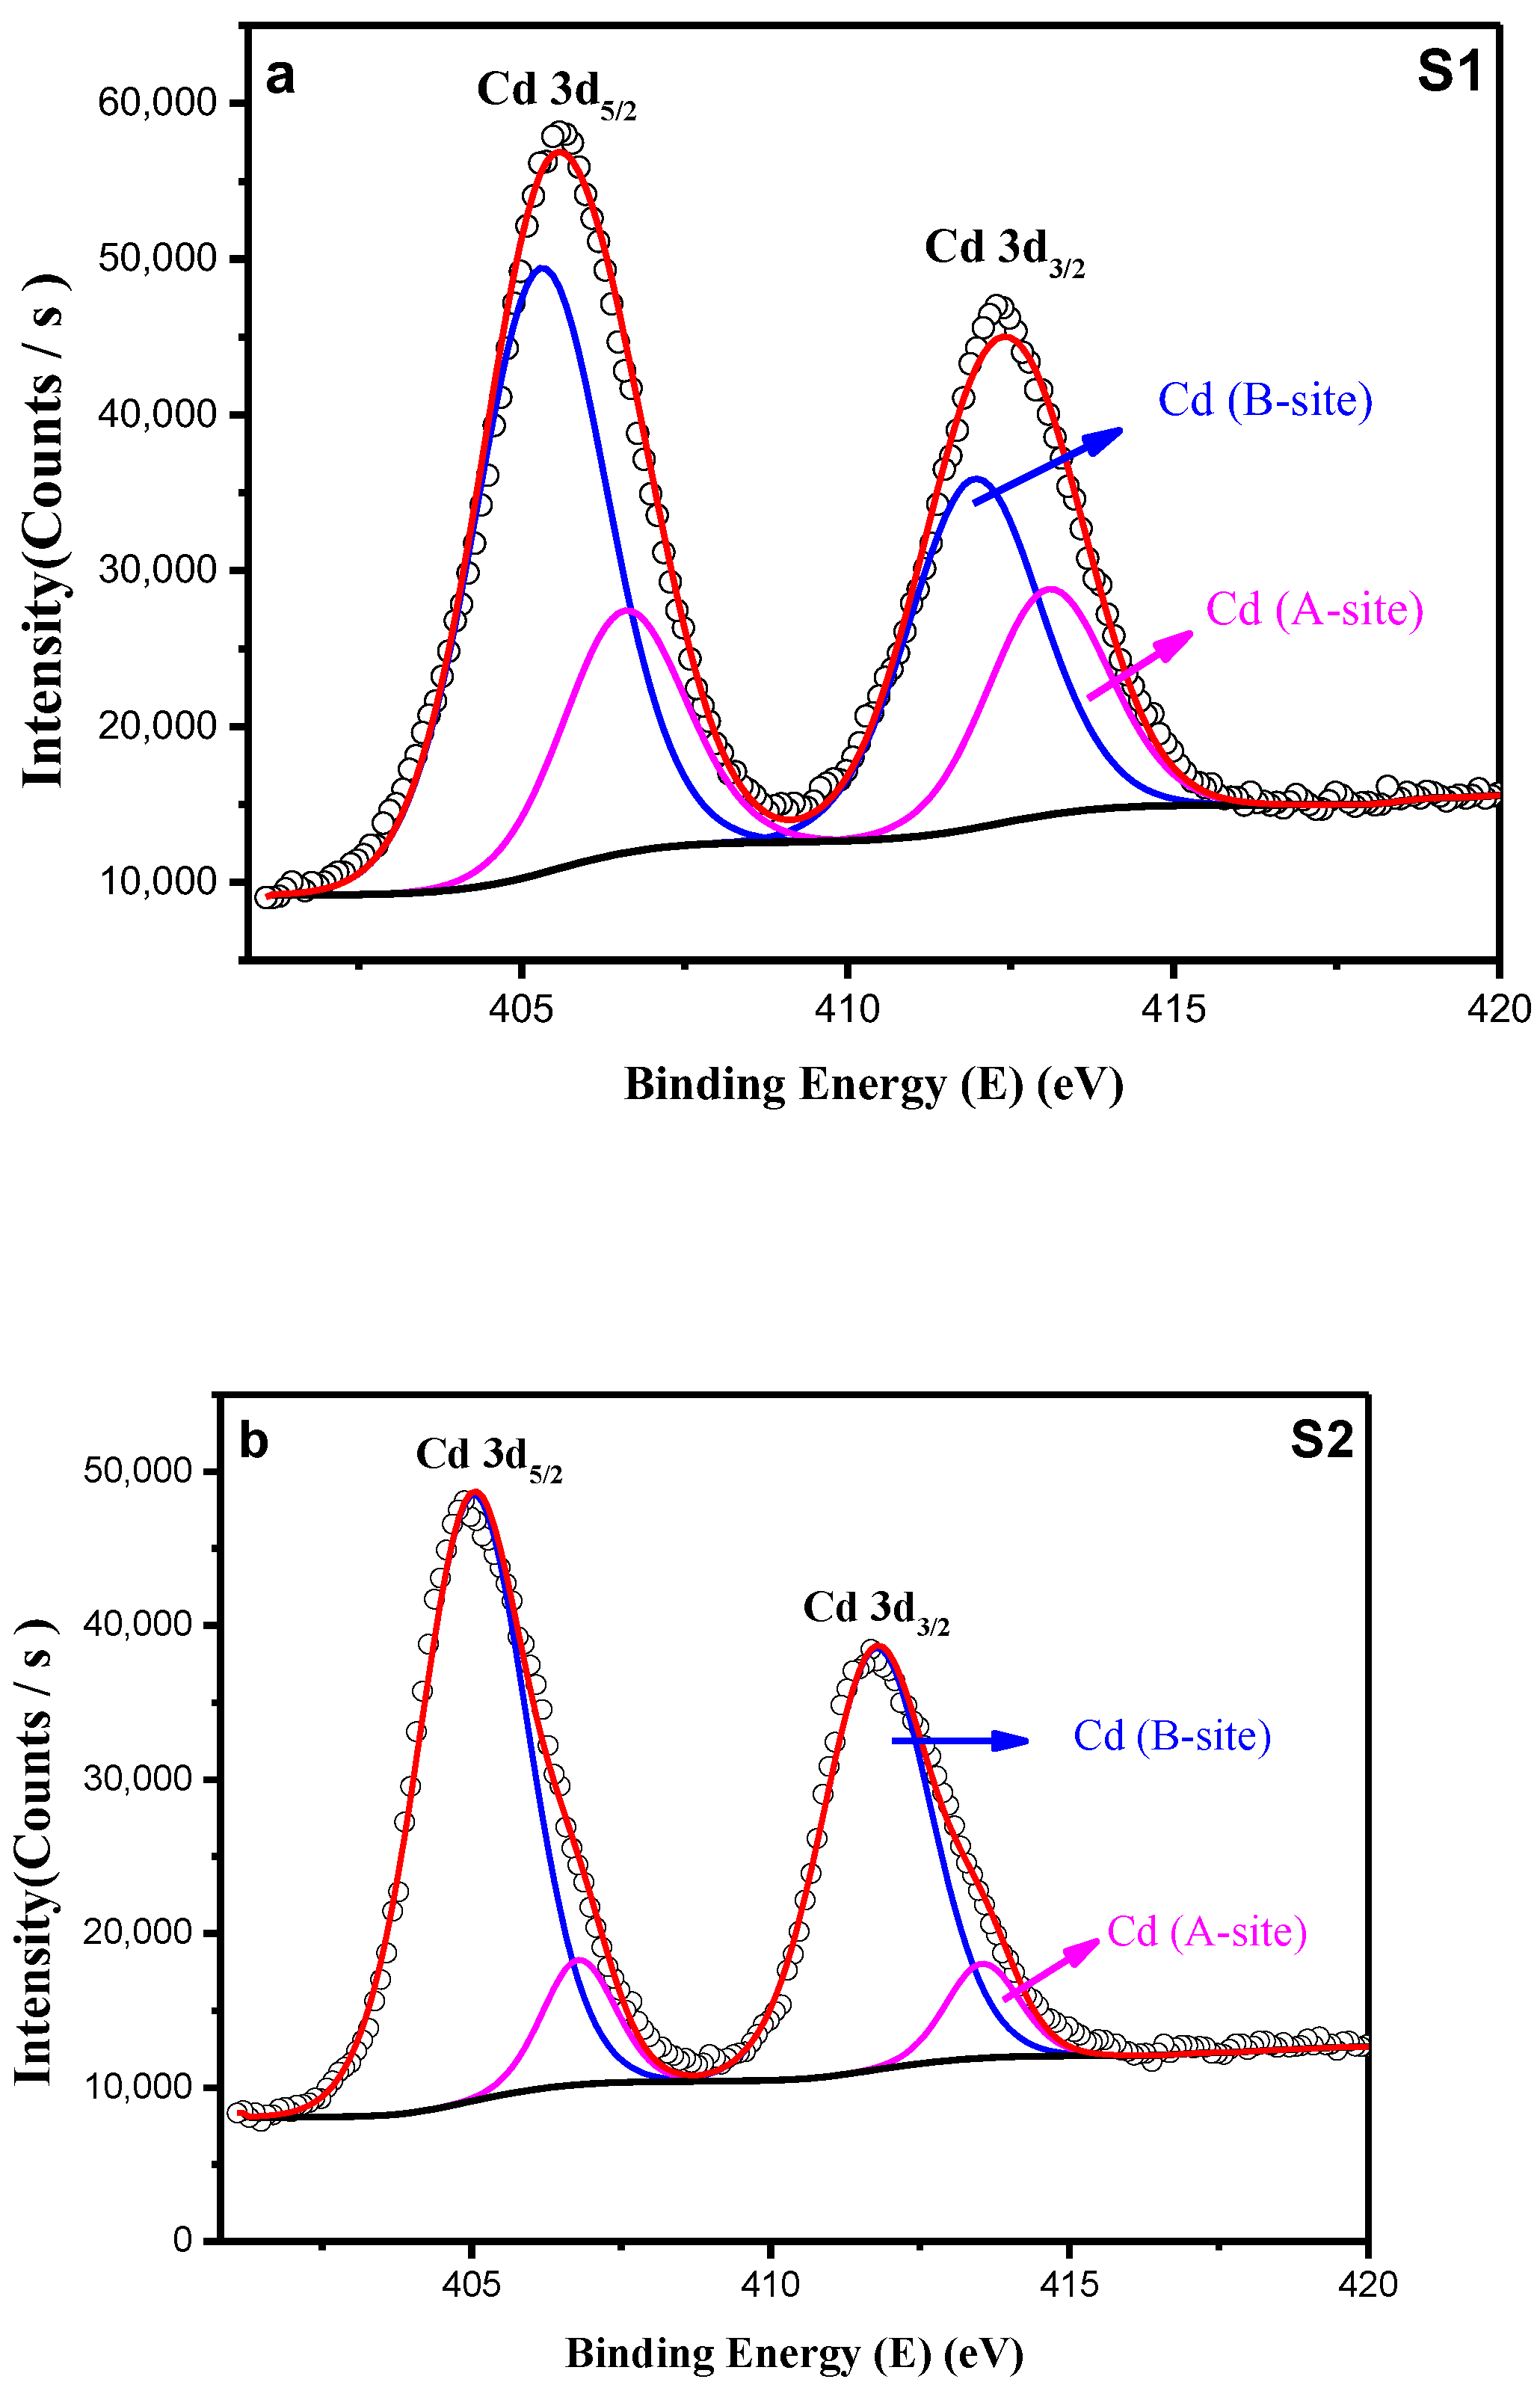
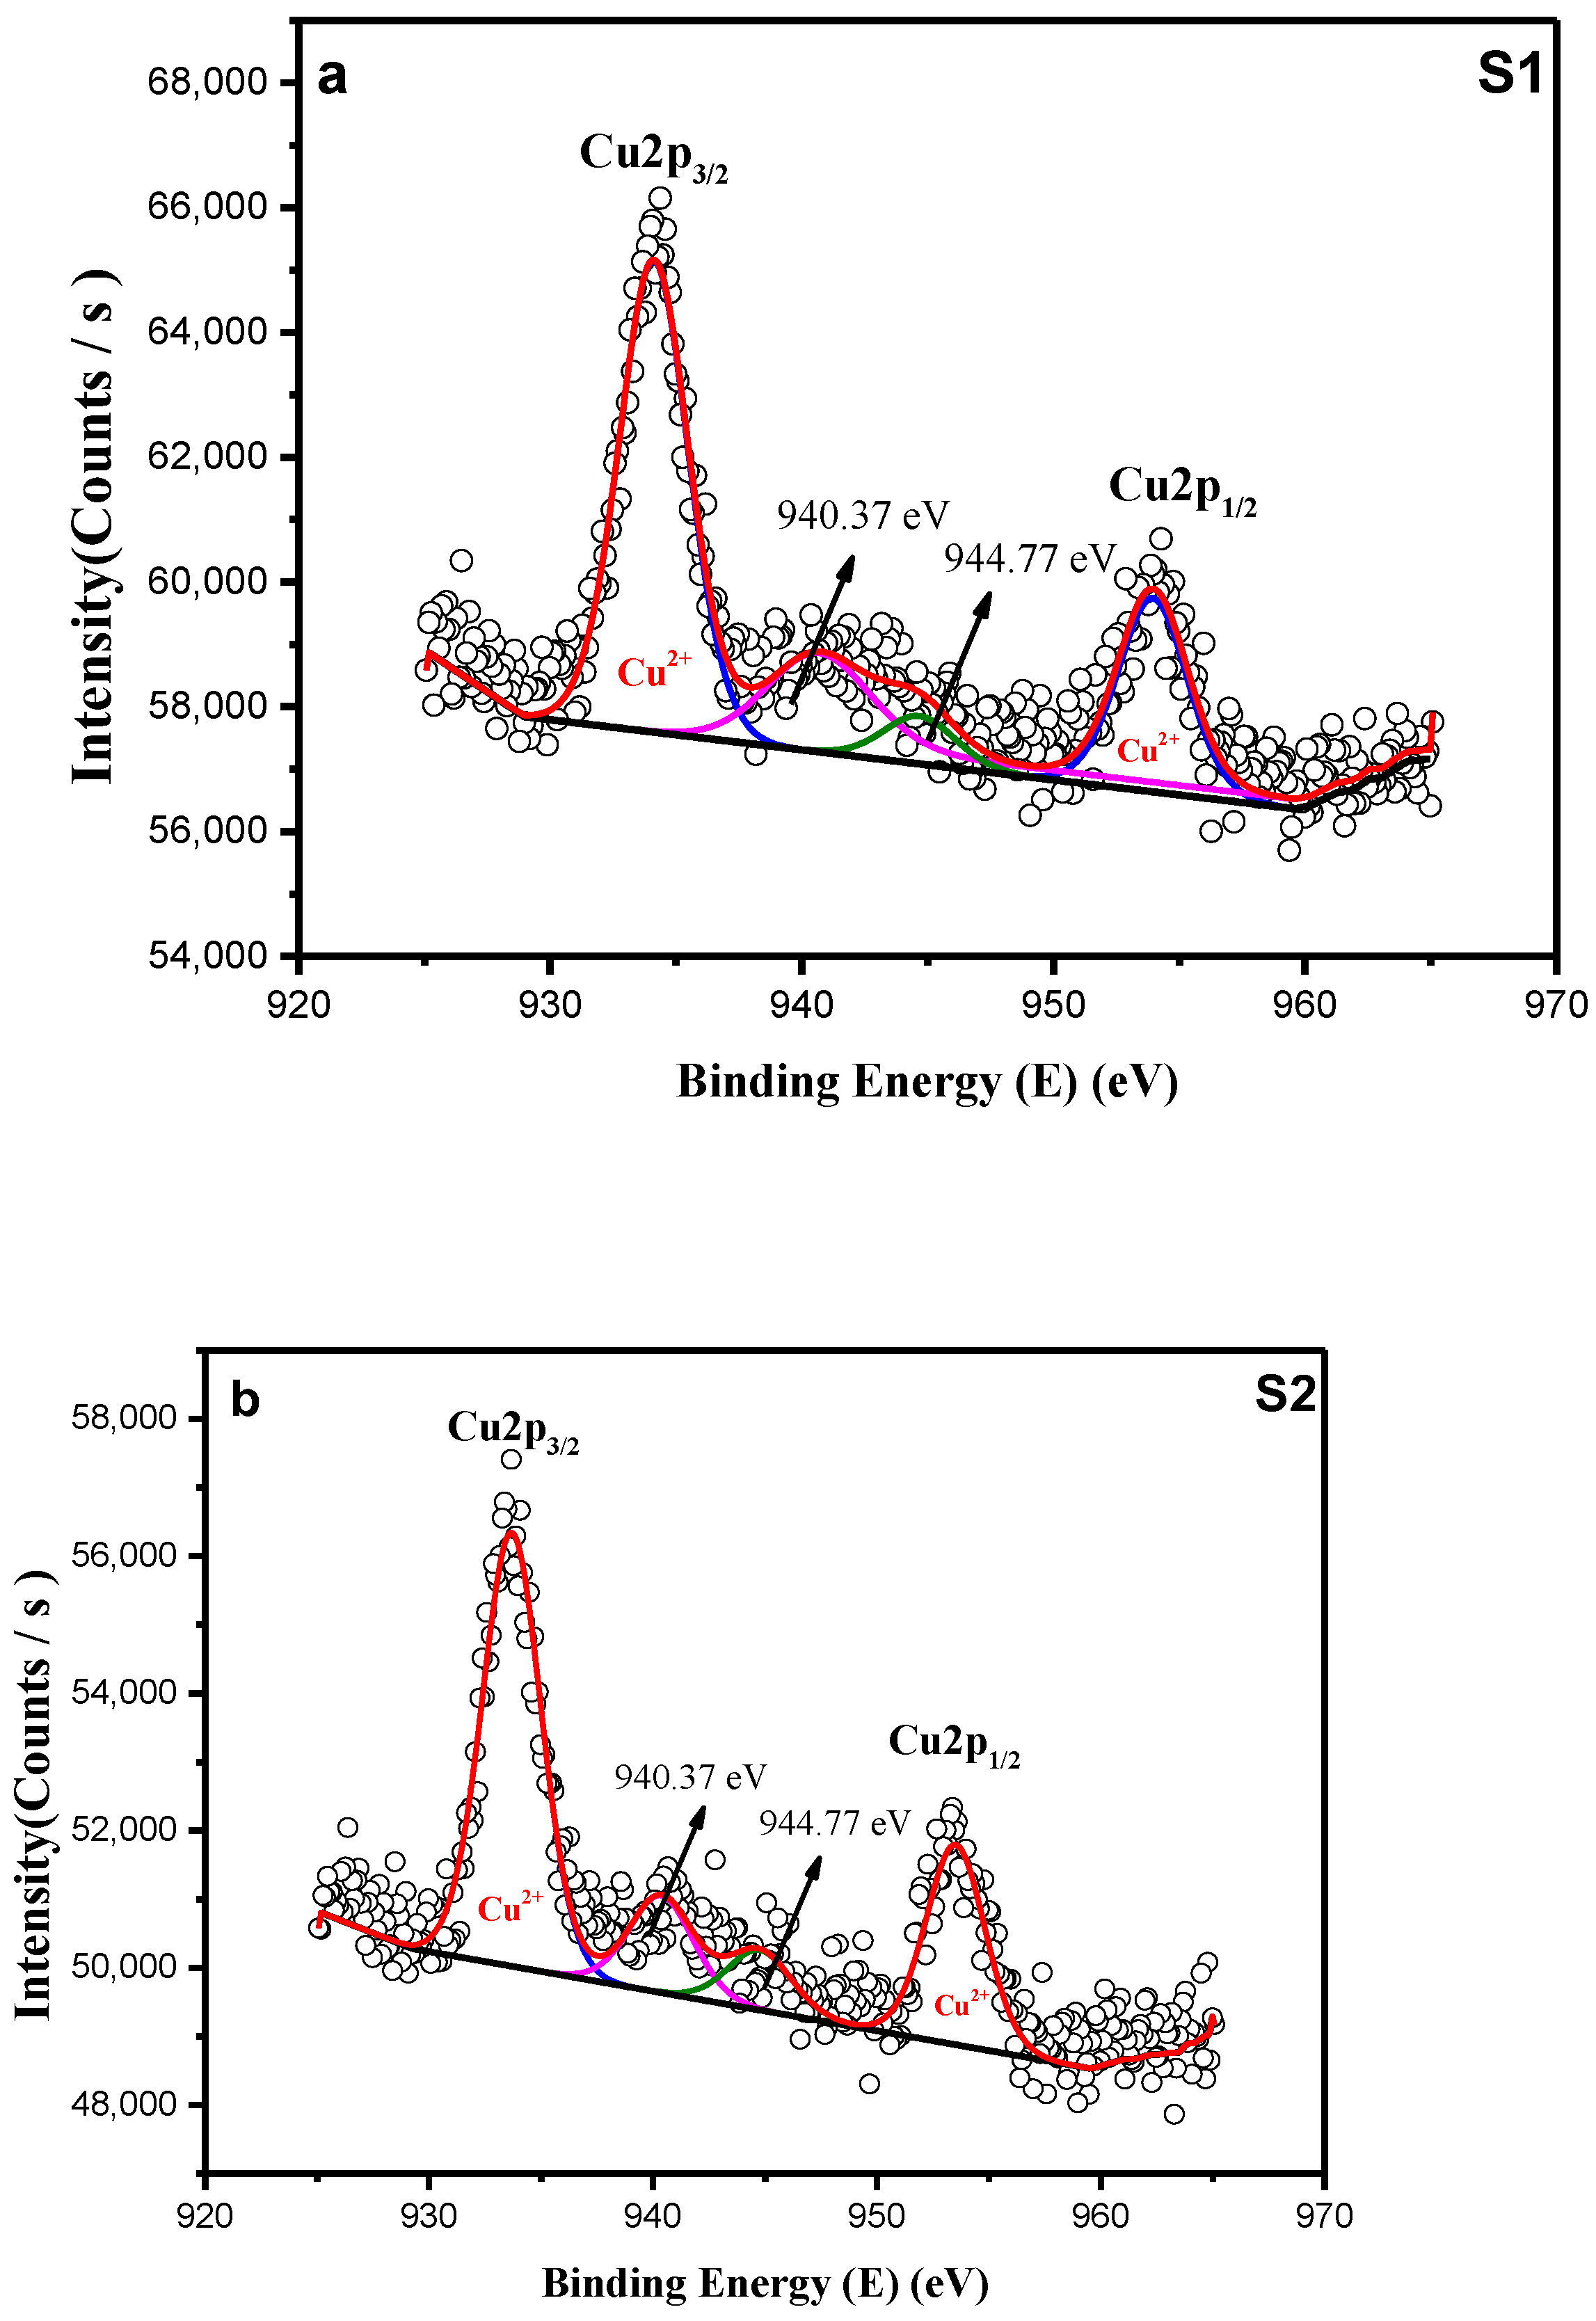
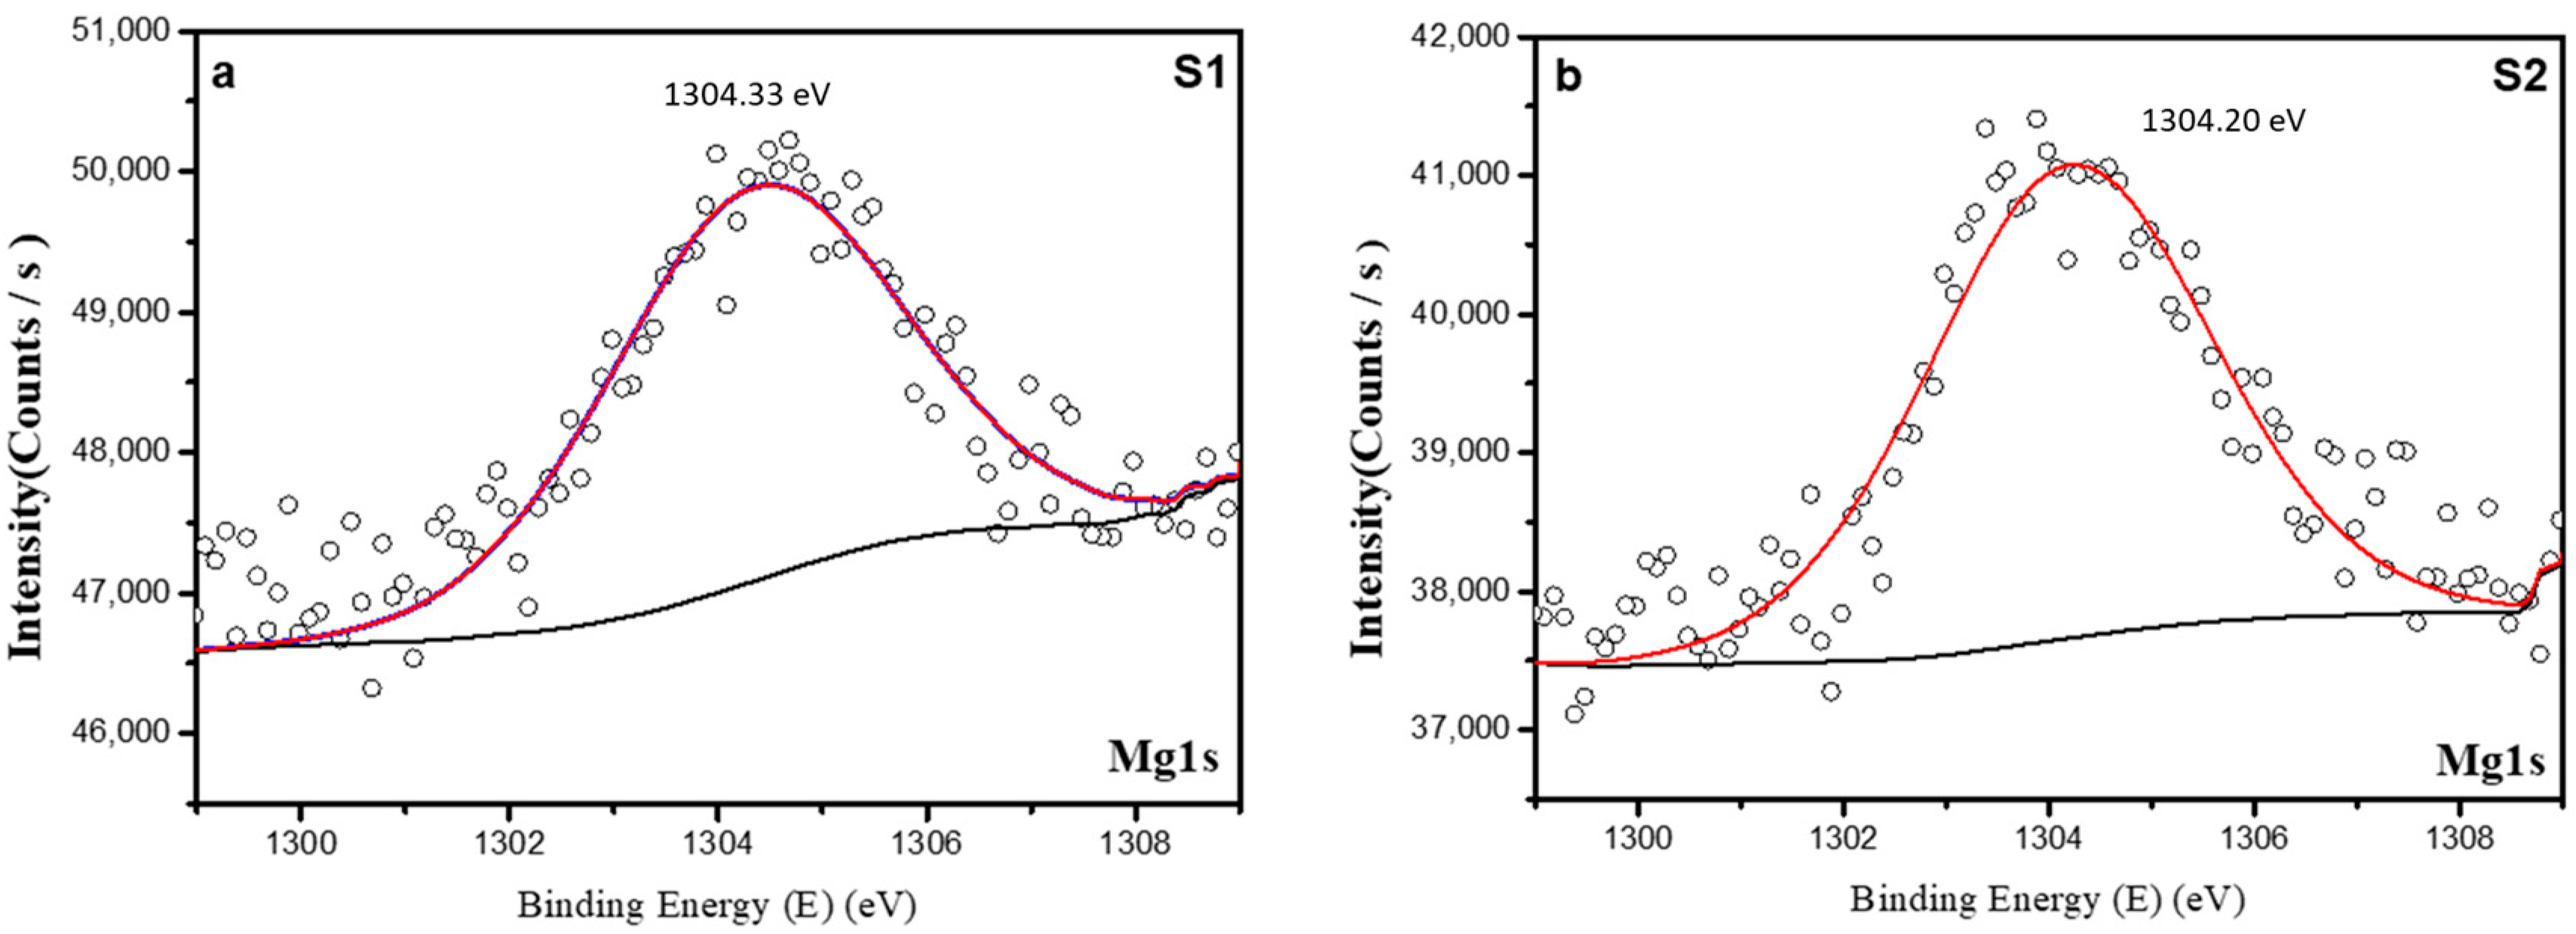
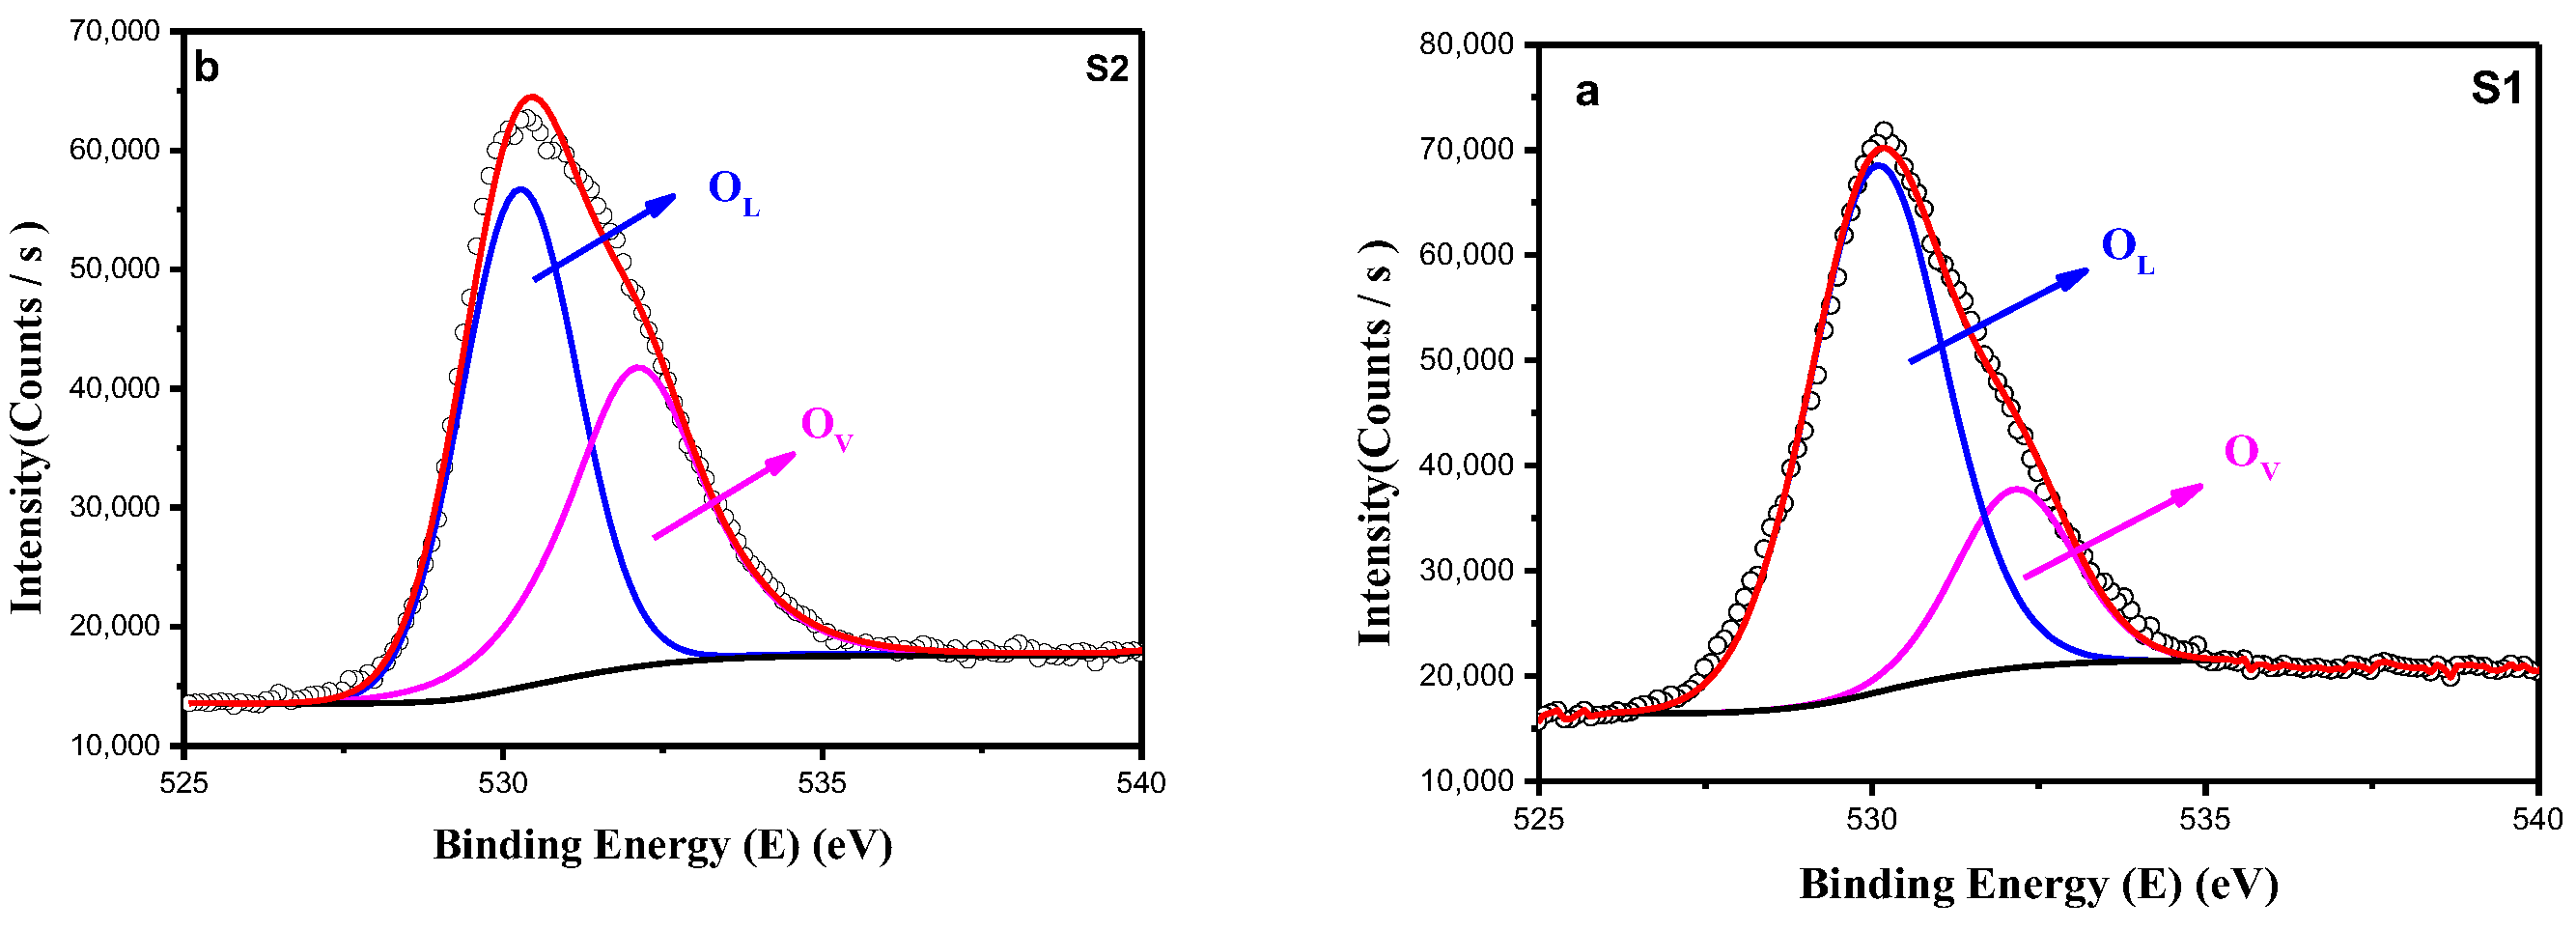
3.1.3. X-Ray Photoelectron Spectroscopy (XPS)

The XPS technique was employed to investigate the surface properties of the materials. The chemical environment and oxidation states of the elements influence the binding energy of the peaks, providing insights into the cation distribution and defect states in the spinel structure. The survey spectra of samples S1 and S2, shown in Figure 4, along with the XPS composition data in Table 2, confirm the presence of all expected elements (Cd, Mg, Cu, Fe, and O), as well as adventitious carbon, indicating the high purity of the synthesized material.
High-resolution XPS spectra were analyzed to determine the electronic states and oxidation degrees of the sample’s constituent elements. Figure 5a,b present the Fe 2p XPS spectra of the samples calcined at different temperatures. The spectra exhibit a sharp peak at 711.60 eV, paired with a satellite peak around 719.5 eV, confirming the presence of Fe3+ as the dominant iron valence state [52,53]. Additionally, the Fe 2p3/2 peak can be deconvoluted into two components: a stronger peak at approximately 709–711 eV (tetrahedral sites) and a weaker one at 712–715 eV (octahedral sites), suggesting that iron exists in multiple chemical states. These states are attributed to the different coordination environments of Fe3+ ions in the spinel structure, specifically the tetrahedral (A-sites) and octahedral (B-sites) positions [54,55]. The higher binding energy of Fe3+ in octahedral sites compared to tetrahedral sites indicates a partial inversion of the spinel structure, which is influenced by the calcination temperature. Table 3 summarizes the binding energies for Fe 2p and its satellite peaks, showing that the proportion of Fe3+ in tetrahedral sites decreases with increasing calcination temperature, while Fe3+ in octahedral sites becomes more dominant.
A detailed analysis of the Cd 3d spectrum, shown in Figure 6a,b, reveals that the Cd 3d5/2 and Cd 3d3/2 lines can be fitted to two distinct peaks. The higher binding energy peaks (406.58 eV for S1 and 406.79 eV for S2) correspond to Cd2+ ions on octahedral sites, while the lower energy peaks (405.29 eV for S1 and 405.02 eV for S2) correspond to Cd2+ ions on tetrahedral sites. The Cd2+ (octahedral)/Cd2+ (tetrahedral) ratio increases with rising calcination temperature, as indicated in Table 3. This shift in cation distribution is consistent with the lattice expansion observed in XRD results (Table 1).
For the Cu 2p region (Figure 7a,b), the Cu 2p spectrum shows two main peaks due to spin-orbit coupling in the p shell, with binding energies around 933–934 eV for Cu 2p3/2 and 953–954 eV for Cu 2p1/2 [56,57]. The satellite peaks at 940 eV and 944 eV are consistent with Cu(II) oxide species confirming the presence of Cu2+ in the spinel structure. The Mg 1s spectra (Figure 8a,b) show peaks at 1304.29 eV for the sample calcined at 950 °C and at 1303.98 eV for the sample calcined at 1050 °C, indicating that magnesium maintains a consistent oxidation state (Mg2+) in both samples [58,59]. These minor shifts in binding energy suggest that the electronic structure of copper and magnesium remains stable across the two calcination conditions.
The O 1s spectra, commonly more informative about oxide ferrite structures than the cation spectra, exhibit slightly asymmetric shapes that can be fitted by two Gaussian curves: O1 and Ov peaks (Figure 9a,b). The O1 peak, located near 530 eV, corresponds to oxygen atoms in the lattice [60], while the Ov peak (532.05 eV for S1 and 532.10 eV for S2) is attributed to hydroxyl groups, chemisorbed oxygen, and organic oxygen on the sample surface [61]. Naeem et al. report that the Ov peak is associated with an increase in oxygen vacancies [62]. Table 4 lists the relative abundance of these oxygen species, revealing that surface oxygen vacancies increase with higher calcination temperatures. These vacancies are crucial for catalytic activity, as they provide the active oxygen species necessary for redox reactions [63].

3.2. Optical Band Gap Study

Figure 10a illustrates the absorbance (A) as a function of wavelength (λ) of Cd0.6Mg0.2Cu0.2Fe2O4 spinel ferrites across the ultraviolet (UV) and visible (VIS) radiation domains. The spectra exhibit a prominent absorption band within the UV range, specifically between 200 nm and 400 nm. This finding indicates that these ferrites effectively absorb UV light. Consequently, they present significant potential for applications in UV light absorption and photocatalysis [64,65]. As the calcination temperature increased, the peak absorption wavelength shifted from λ = 281 nm at 950 °C to λ = 261 nm at 1050 °C. Furthermore, a noticeable blue shift in the peak absorption was observed with an increase in particle size. To estimate the band gap energies, Tauc’s law [66] was employed to provide a systematic approach for determining the optical band gap based on the relationship between the absorbed energy and the absorption coefficient.
α h v = β h v E g n
where denotes the photon energy, and β is a parameter that characterizes the degree of disorder within the material. The band gap energy is represented by Eg. Notably, the nature of optical transition is determined by the exponent n; specifically, direct optical transitions are indicated by n = 1/2, whereas indirect optical transitions correspond to n = 2. This classification is crucial for understanding the electronic structure of materials, as it gives an insight into the mechanisms of light absorption and emission, which can significantly influence their potential applications in optoelectronics and photonics. For each sample, the optical absorption coefficient (α) is computed using Equation (3). Furthermore, the Tauc law, described in Equation (4) [67], has been used to determine the values of the band gap energy (Eg) for Cd0.6Mg0.2Cu0.2Fe2O4 ferrites. Additionally, Equation (5) is employed to validate the optical transition in the samples:
α = 2.303 × A d
α h v 1 n = β h v E g
l n α h v = l n β + n l n h v E g
where A is the absorbance, d is the thickness of each sample, and hv is the photon energy. The values of the band gap energy (Eg) were determined from the curves of (αhv)2 versus hv presented in Figure 10b. Specifically, the band gap energy was found to be 3.9 ± 0.062 eV at a calcination temperature of 950 °C and 3.7 ± 0.058 eV at 1050 °C. Additionally, the curves depicting ln(αhυ) versus ln(Eg) in Figure 10c,d indicate that the exponent values n are approximately equal to 0.5 for both samples. This value of n suggests that the optical transitions occurring in these materials are predominantly direct transitions, reinforcing the findings related to their band gap properties. Consequently, Cd0.6Mg0.2Cu0.2Fe2O4 ferrites exhibit direct optical transitions. The presence of a direct band gap, as evidenced by these transitions, enables electrons to migrate directly from the valence band to the conduction band without the necessity for intermediate energy states. This characteristic is particularly advantageous, as it enhances the materials’ light-absorbing and light-emitting capabilities. As a result, Cd0.6Mg0.2Cu0.2Fe2O4 ferrites are considered ideal candidates for applications in lasers and various optoelectronic devices. Their efficient energy transitions can lead to improved performance in these technologies, furthering their potential usability in future innovations for ferrites of Cd0.6Mg0.2Cu0.2Fe2O4 that were calcined at different temperatures. Band gap energy is usually influenced by a number of elements, including impurities, structural characteristics, and grain size; grain size tends to increase with increasing calcination temperature [68,69]. As grain size increases due to the increase in calcination temperature, the number of grain boundaries decreases. Charge carriers scatter less at these interfaces because there are fewer grain boundaries, which reduces the effects of carrier scattering and thus lowers the band gap energy. The expansion of grain size can minimize quantum confinement effects and further reduce the band gap energy.

3.3. Photocatalytic Degradation of Methyl Blue (MB) Dye

Methyl blue (MB) is a widely used synthetic dye with extensive industrial applications, making it a significant environmental pollutant. This cationic dye is non-biodegradable, toxic, and carcinogenic, posing serious threats to aquatic ecosystems and human health. In its neutral aqueous solution, the UV–vis spectrum of MB shows absorption peaks at 614 nm and 664 nm, with the latter being more pronounced. Due to its potential carcinogenicity and environmental risks, particularly when released into soil or water, effective degradation methods for this water-soluble dye are essential. The general properties of MB are summarized in Table 5.
In order to investigate the photodegradation process of aqueous MB dye when exposed to UV light in the presence of our compounds: Cd0.6Mg0.2Cu0.2Fe2O4 ferrites and UV–vis absorption spectra were measured continuously for duration of 180 min. Figure 11 shows the UV–visible absorption profile during the photodegradation of methylene blue without any catalysts under UV light.

3.3.1. Photodegradation Mechanism

Figure 12a–d and Figure 13a–d illustrate the UV–visible-induced profile for the photodegradation of methylene blue using different contents of Cd0.6Mg0.2Cu0.2Fe2O4 catalyst (5, 10, 20, and 40 mg), with samples calcined at two different temperatures. When the concentration of catalyst was raised from 5 to 40 mg, it was found that the degradation rate started out slowly at 5 mg and grew steadily. This may be explained by the limited rate of electron–hole pair formation at low catalyst concentrations, which leaves the photodegradation process with fewer radically active sites. However, as the concentrations of the catalyst increased, so did the photo-generated electron–hole pairs, which in turn led to an increase in the number of local active sites and hydroxyl groups on the photocatalyst’s surface, favoring the photodegradation process [70,71]. At a catalyst concentration of 40 mg, the degradation rate reached its maximum, underscoring the catalyst’s significant role in promoting the efficient breakdown of dye molecules. Although the degradation profile did not exhibit a plateau, the results clearly indicate that this concentration is optimal for enhancing the degradation kinetic. As seen in Figure 11, the greater availability of active sites and more efficient production of reactive species at higher catalyst loadings are responsible for the increased photocatalytic activity [72,73].

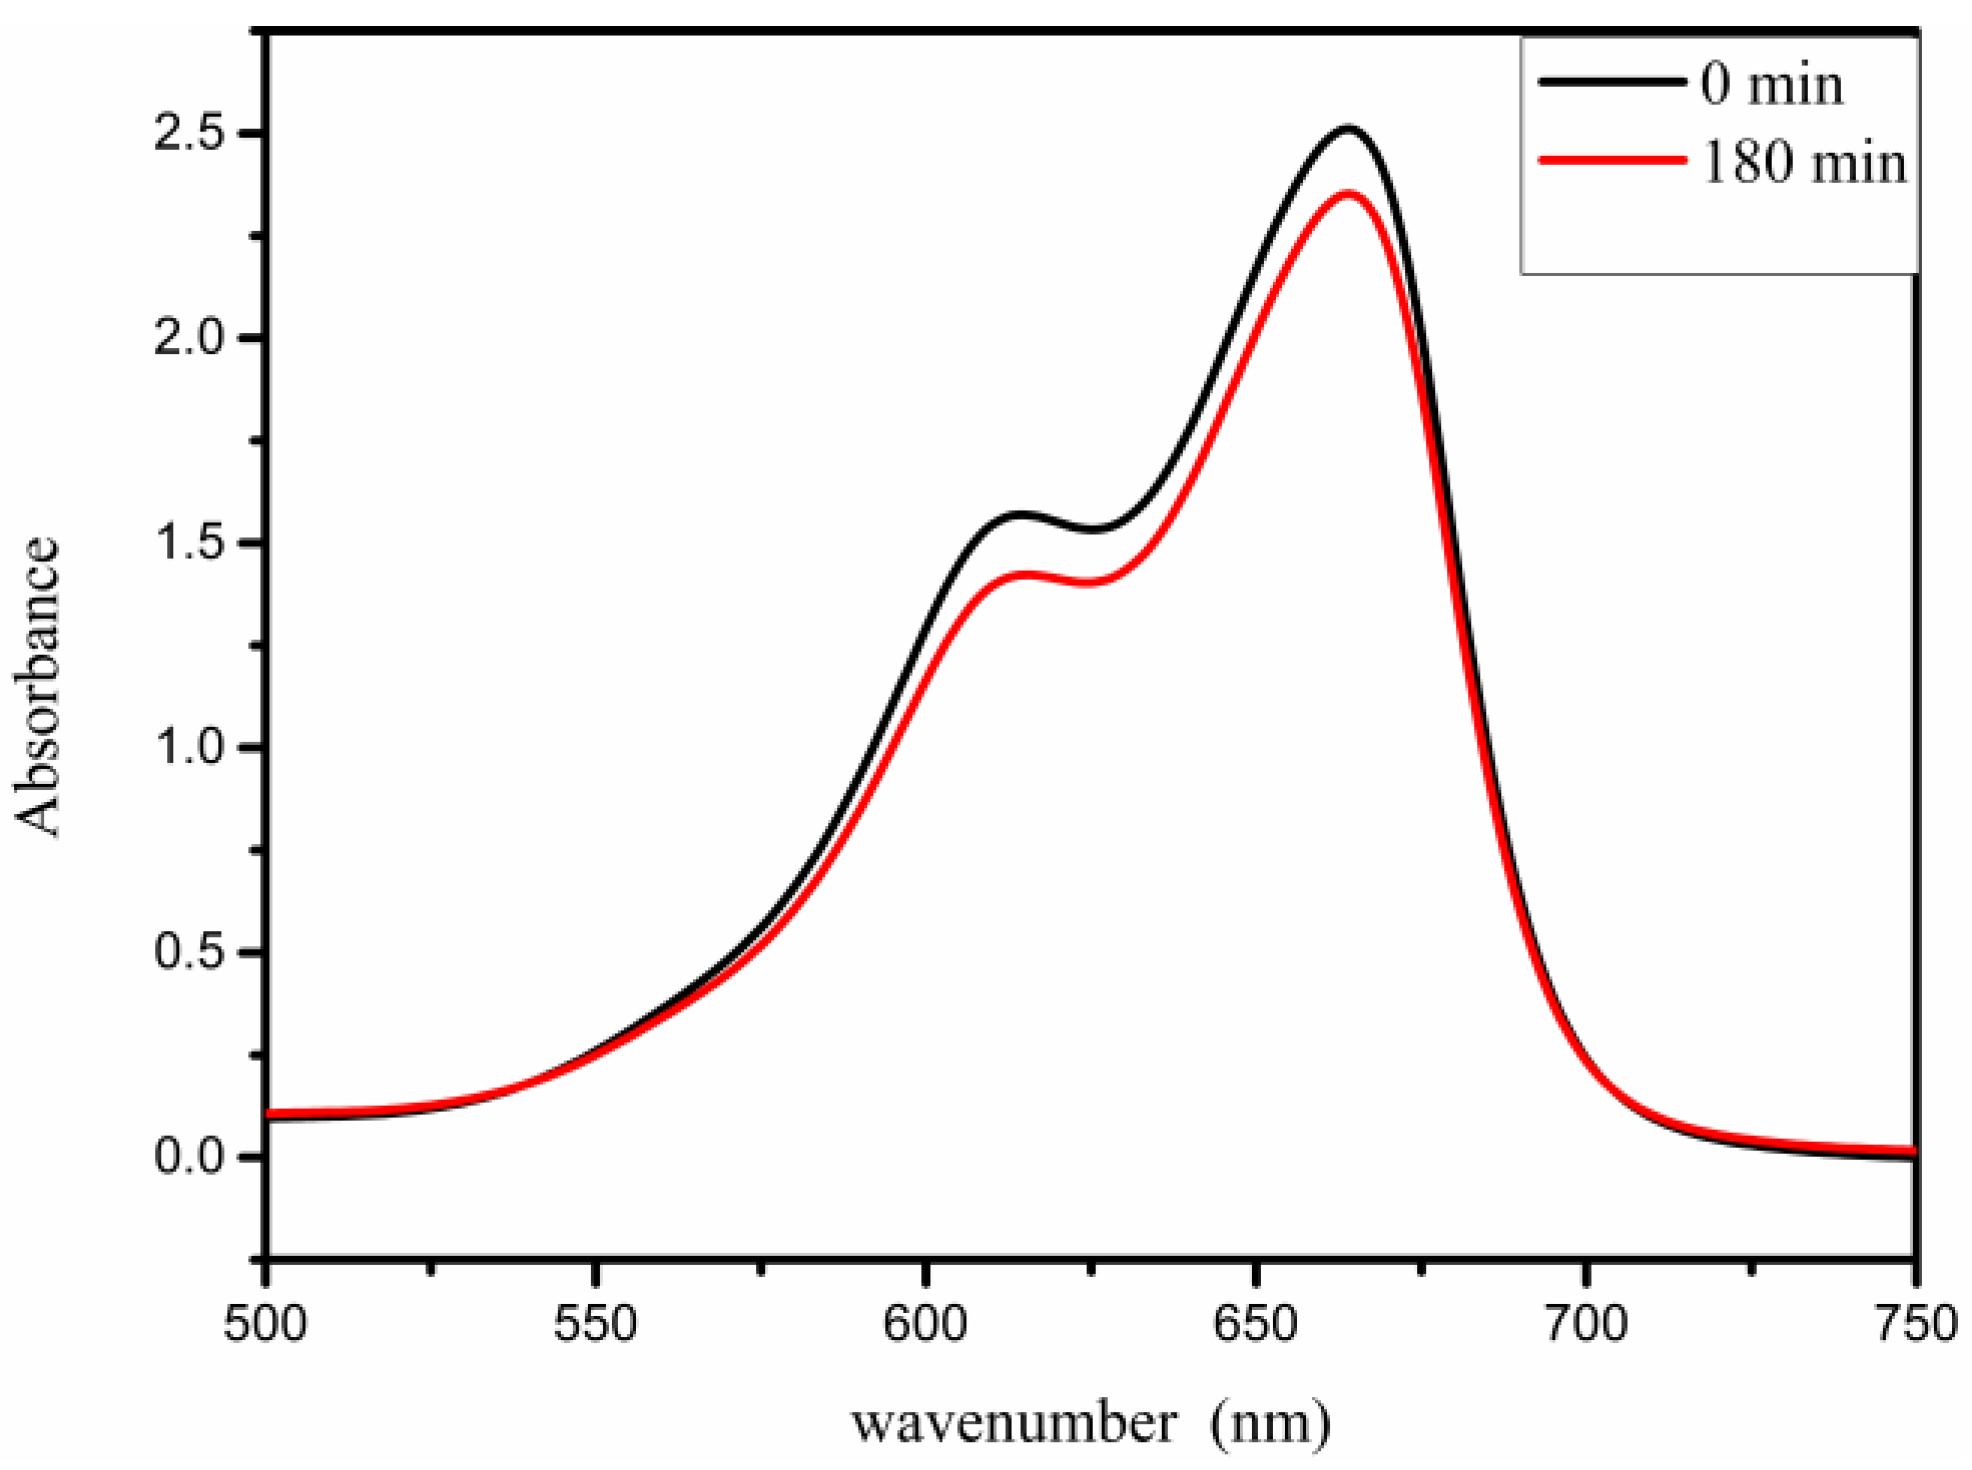
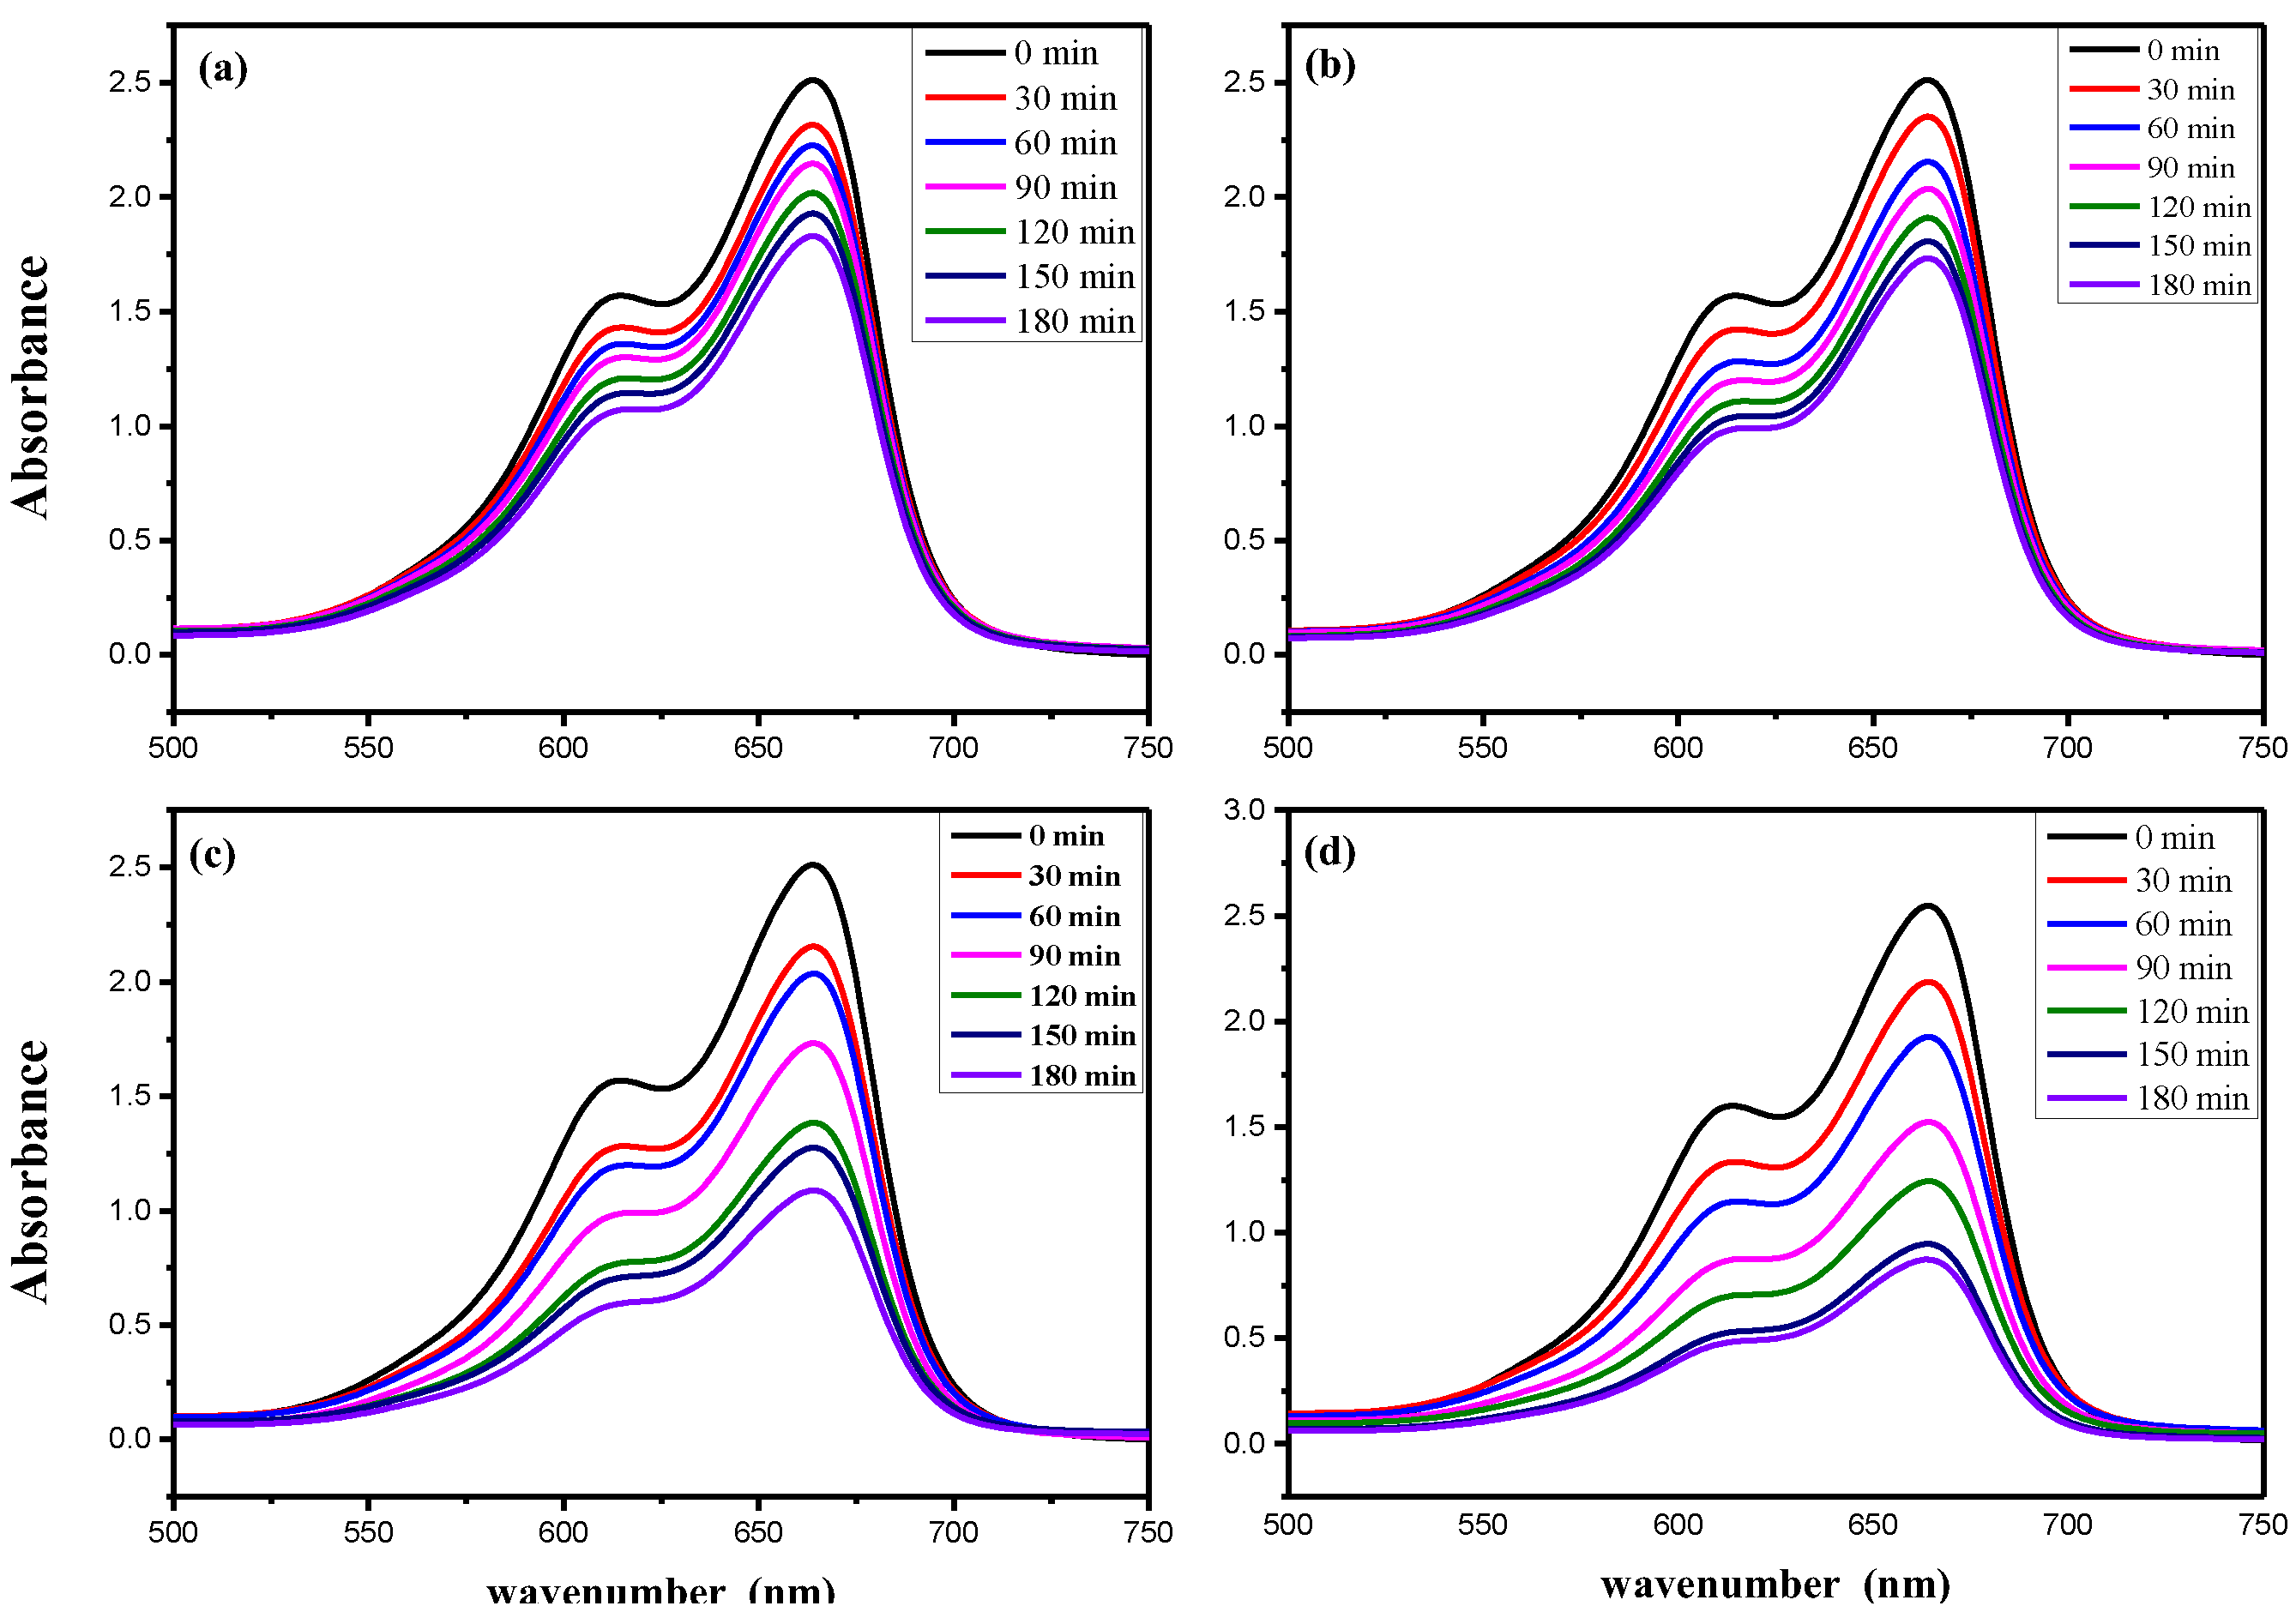
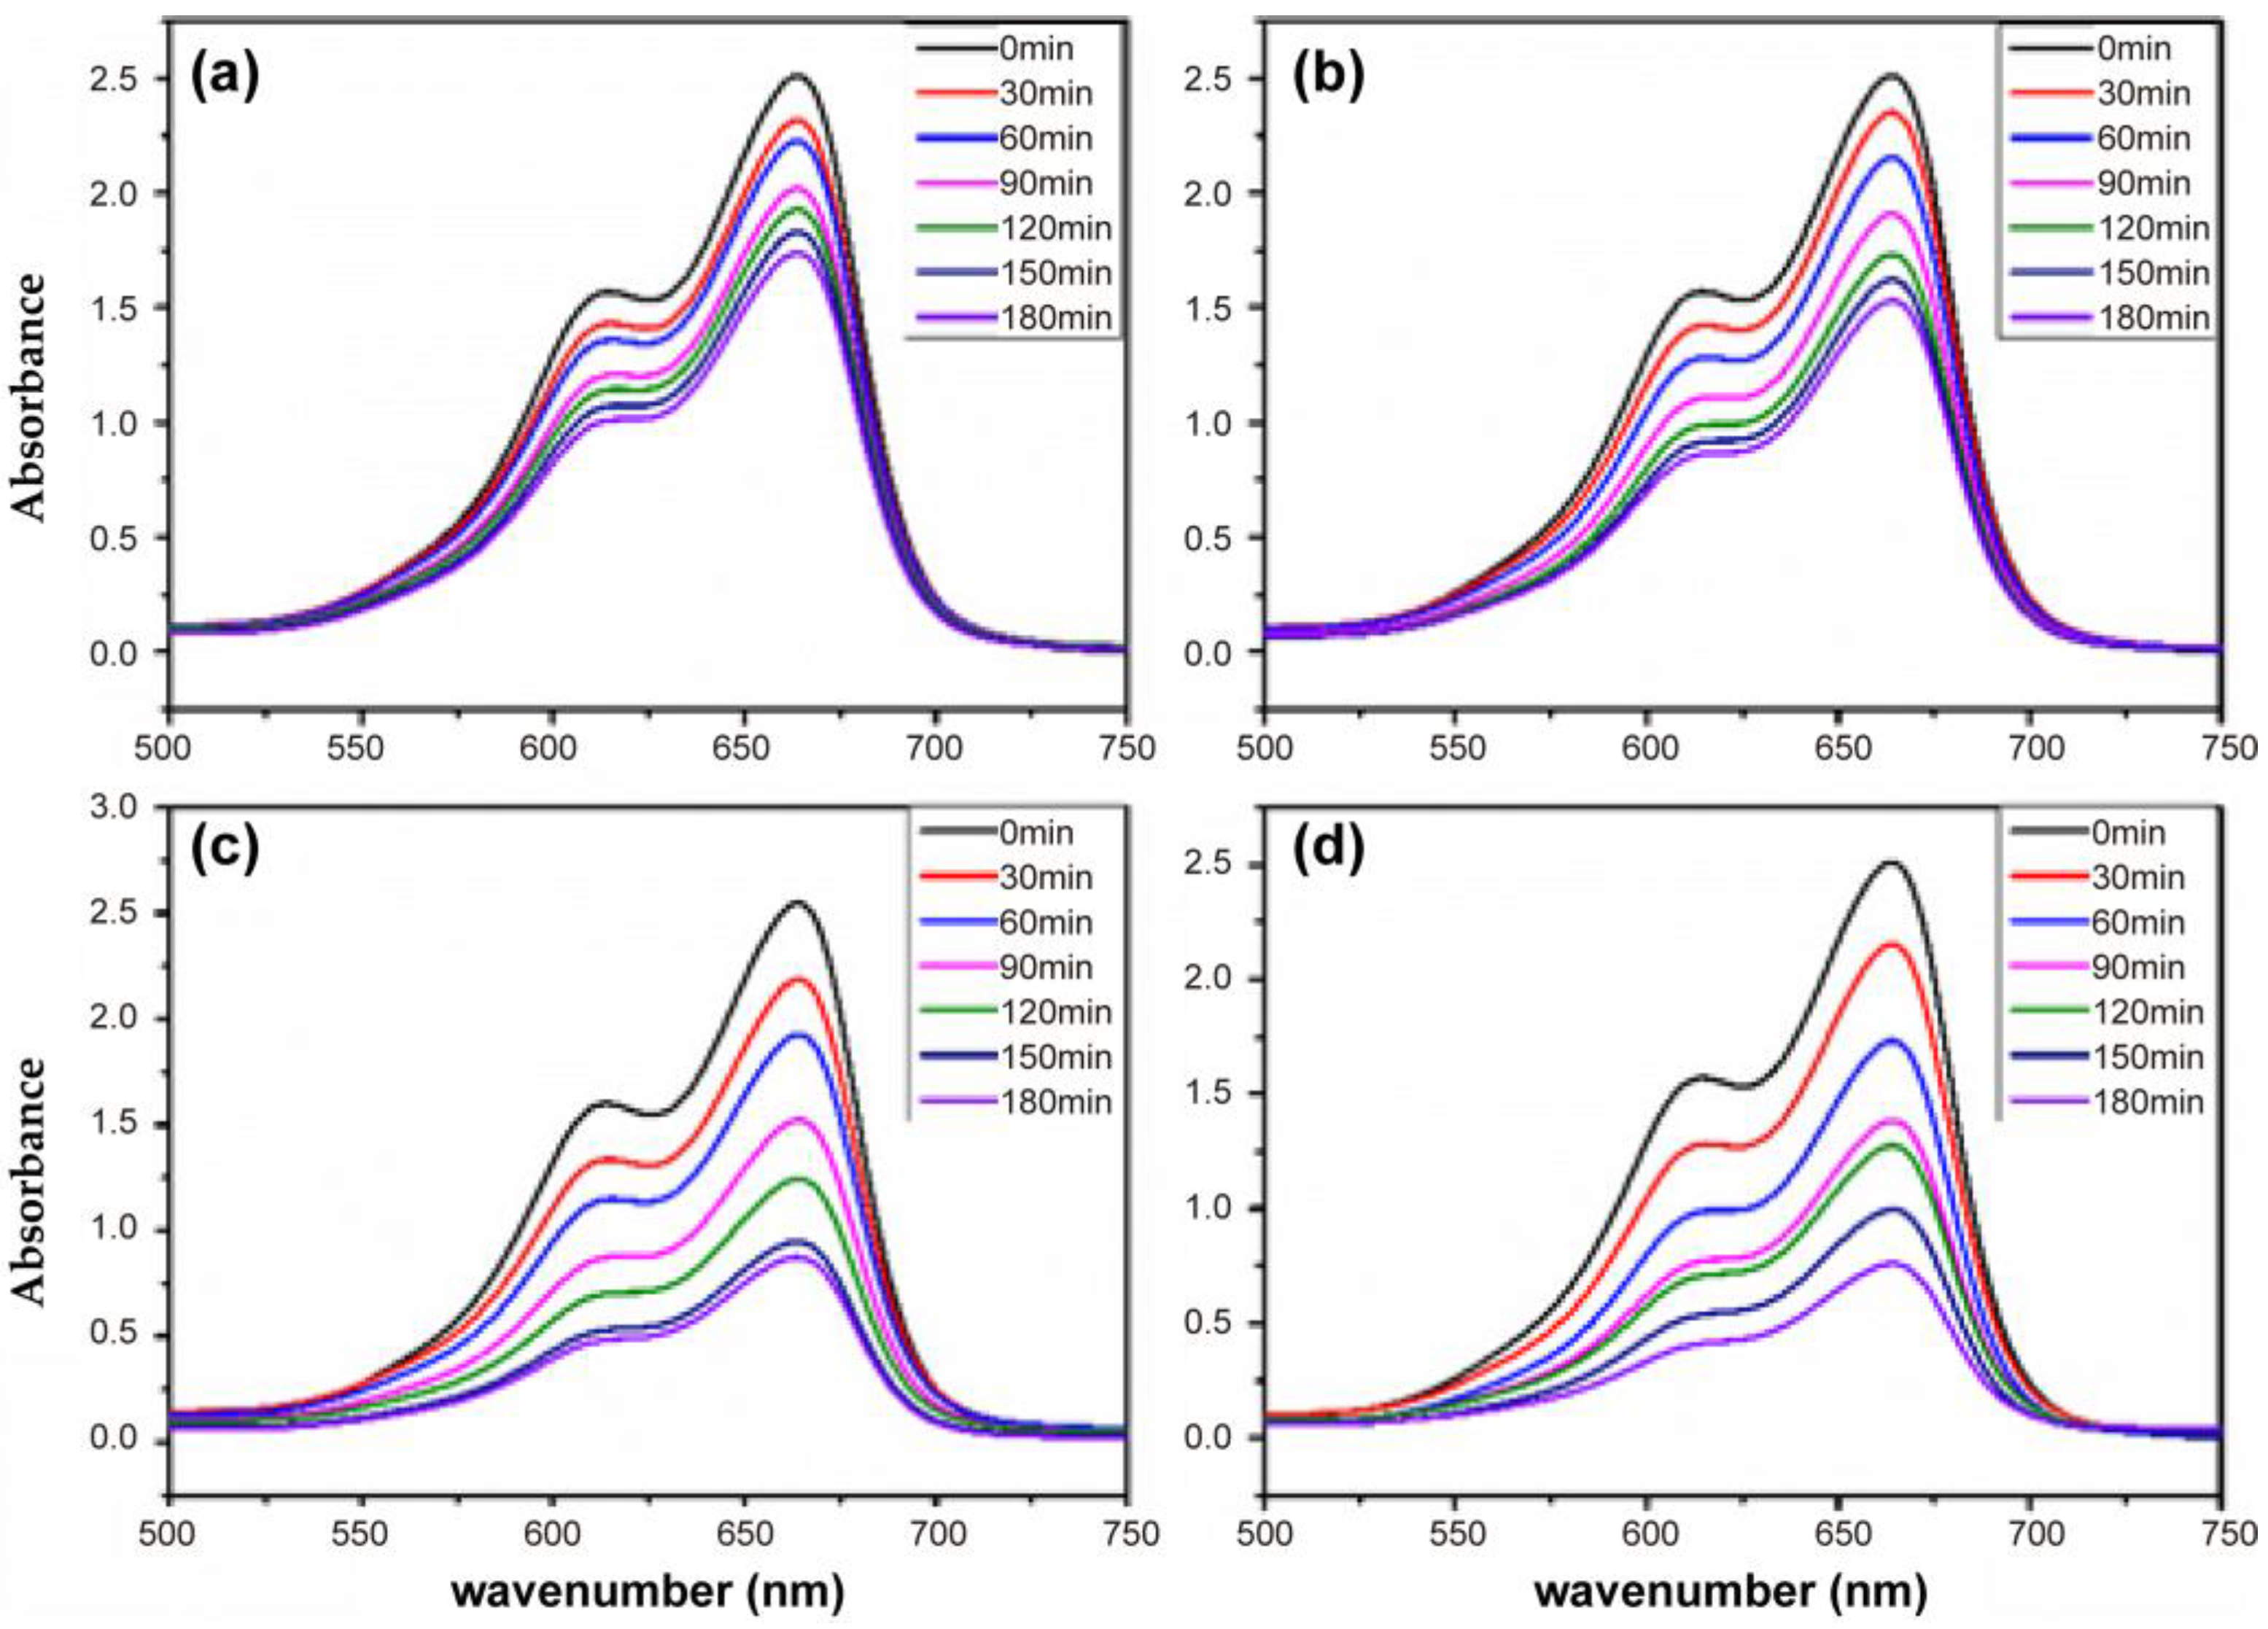
3.3.2. Effect of Irradiation Time

Irradiation time significantly affects the degradation efficiency of the Cd0.6Mg0.2Cu0.2Fe2O4 photocatalyst. The degradation efficacy of methylene blue dye by using this photocatalyst was calculated using the formula:
H = (1 − At/A0)
where η represents the degradation efficiency, A0 is the initial dye concentration, and At is the dye concentration at a specific time interval. The efficacy of different catalyst contents (5, 10, 20, and 40 mg) on the photodegradation of the dye is shown in Figure 14a,b. It is generally observed that the photodegradation efficiency increases with irradiation time. For the samples calcined at 950 °C, the degradation efficiency ranged from 5.44 to 27.07, 6.30 to 31.09, 13.99 to 56.57, and 14.32 to 66.23% for x = 5, 10, 20, and 40 mg, respectively, over irradiation times from 30 to 180 min. In contrast, the samples calcined at 1050 °C showed efficiencies ranging from 7.67 to 30.91, 6.53 to 38.99, 14.11 to 65.69, and 14.49 to 69.84% for x = 5, 10, 20, and 40 mg, respectively, indicating enhanced photocatalytic performance at higher calcination temperatures (Figure 14b). The most significant decolorization of methylene blue was observed with a catalyst concentration of 40 mg and an irradiation time of 180 min. This may be due to the increased generation of photo-generated electron–hole pairs over time, leading to more hydroxyl groups and active sites that assist in greater adsorption of reactants on the photocatalyst surface, ultimately resulting in the degradation of organic dye pollutants [74,75,76]. A comparative table of degradation efficiencies of ferrites reported in the literature has been prepared (Table 6) to contextualize the performance of the synthesized material and highlight its specific advantages.
The enhanced performance of the S2 sample could be due to improved crystallinity and a more effective separation of charge carriers, leading to higher photocatalytic activity. These findings highlight the importance of optimizing both catalyst concentration and calcination temperature to achieve superior photocatalytic performance for the degradation of organic pollutants.

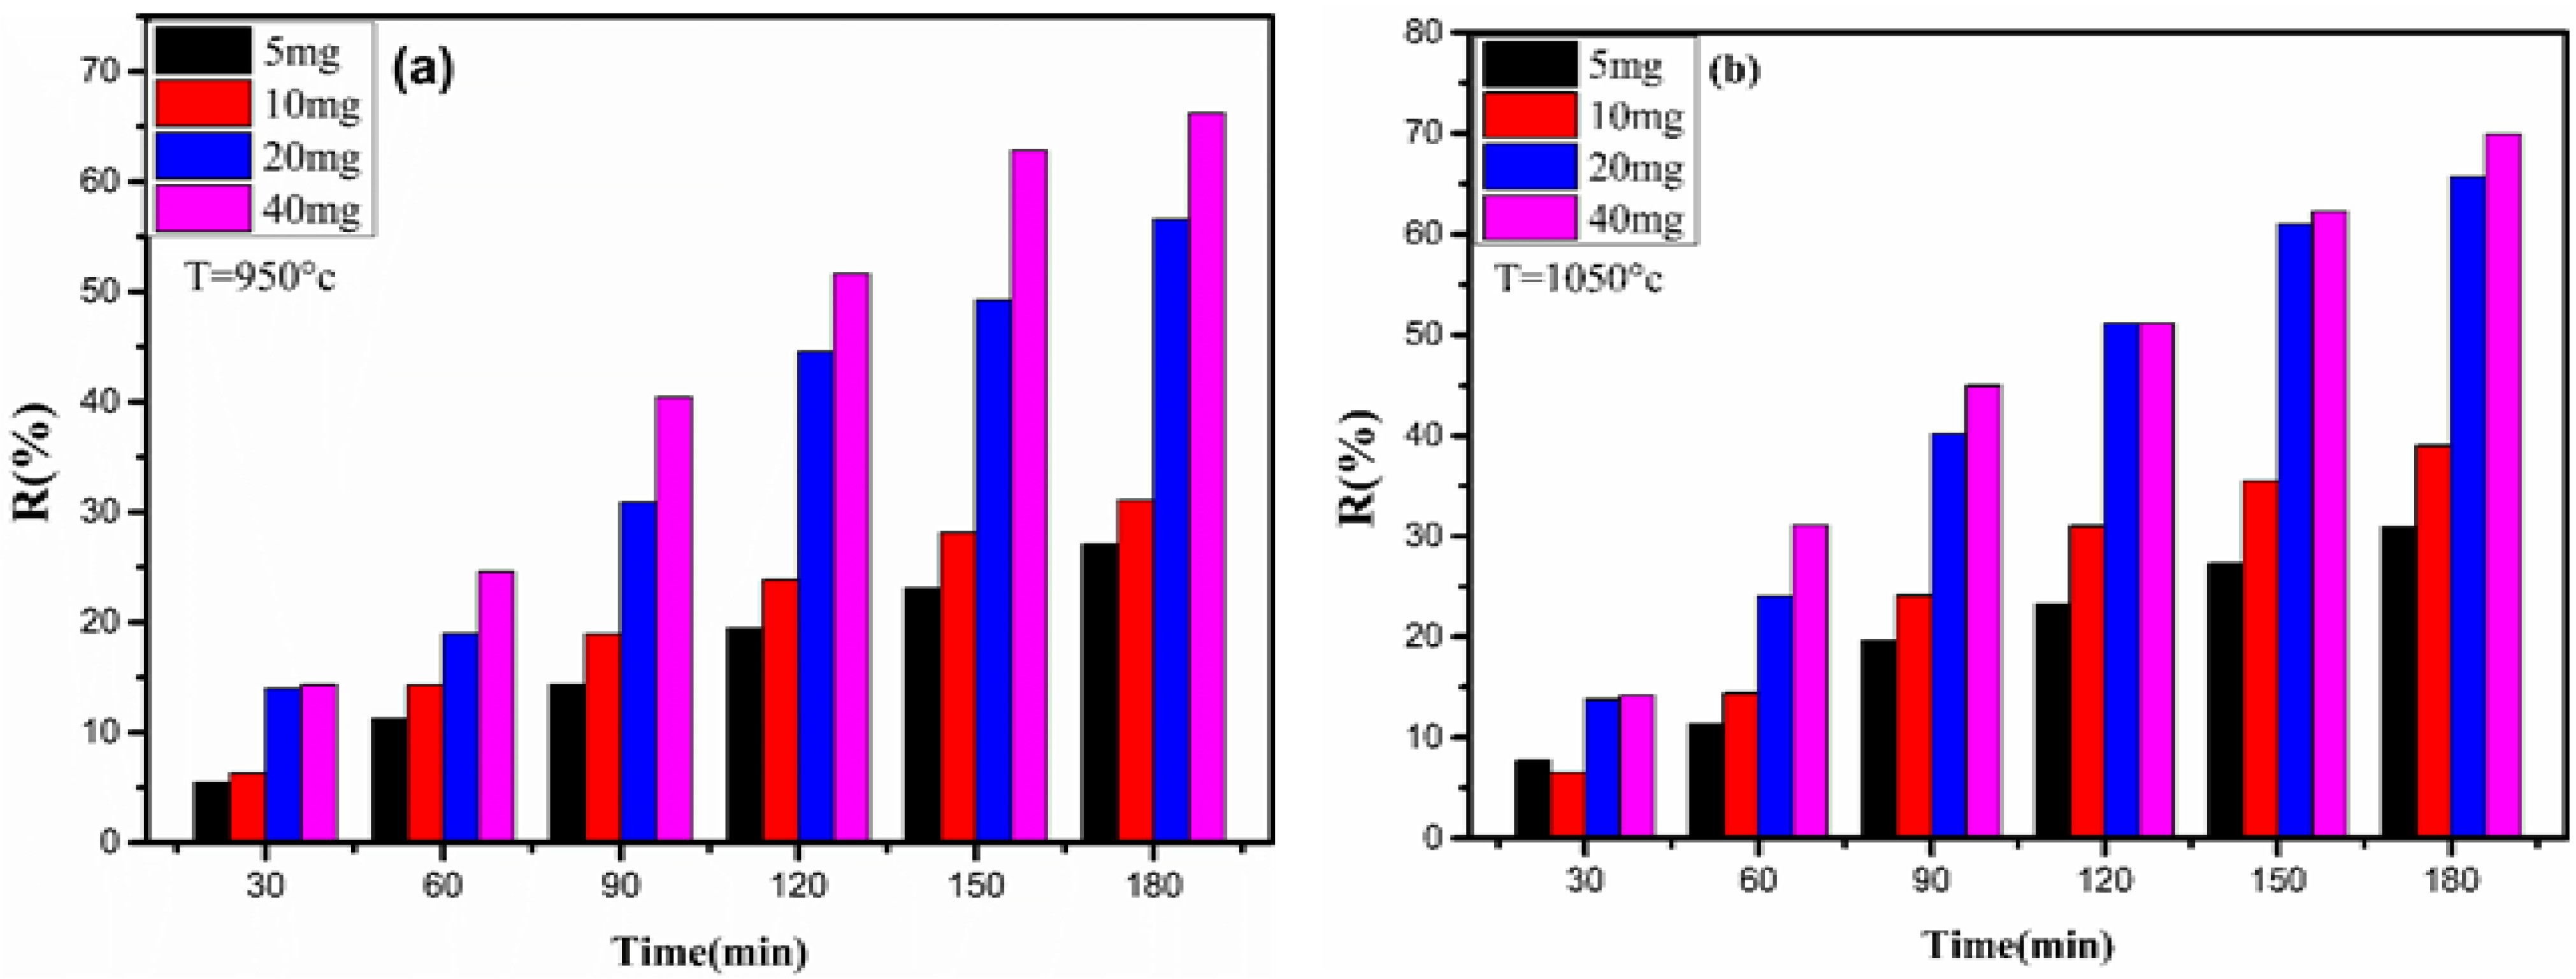
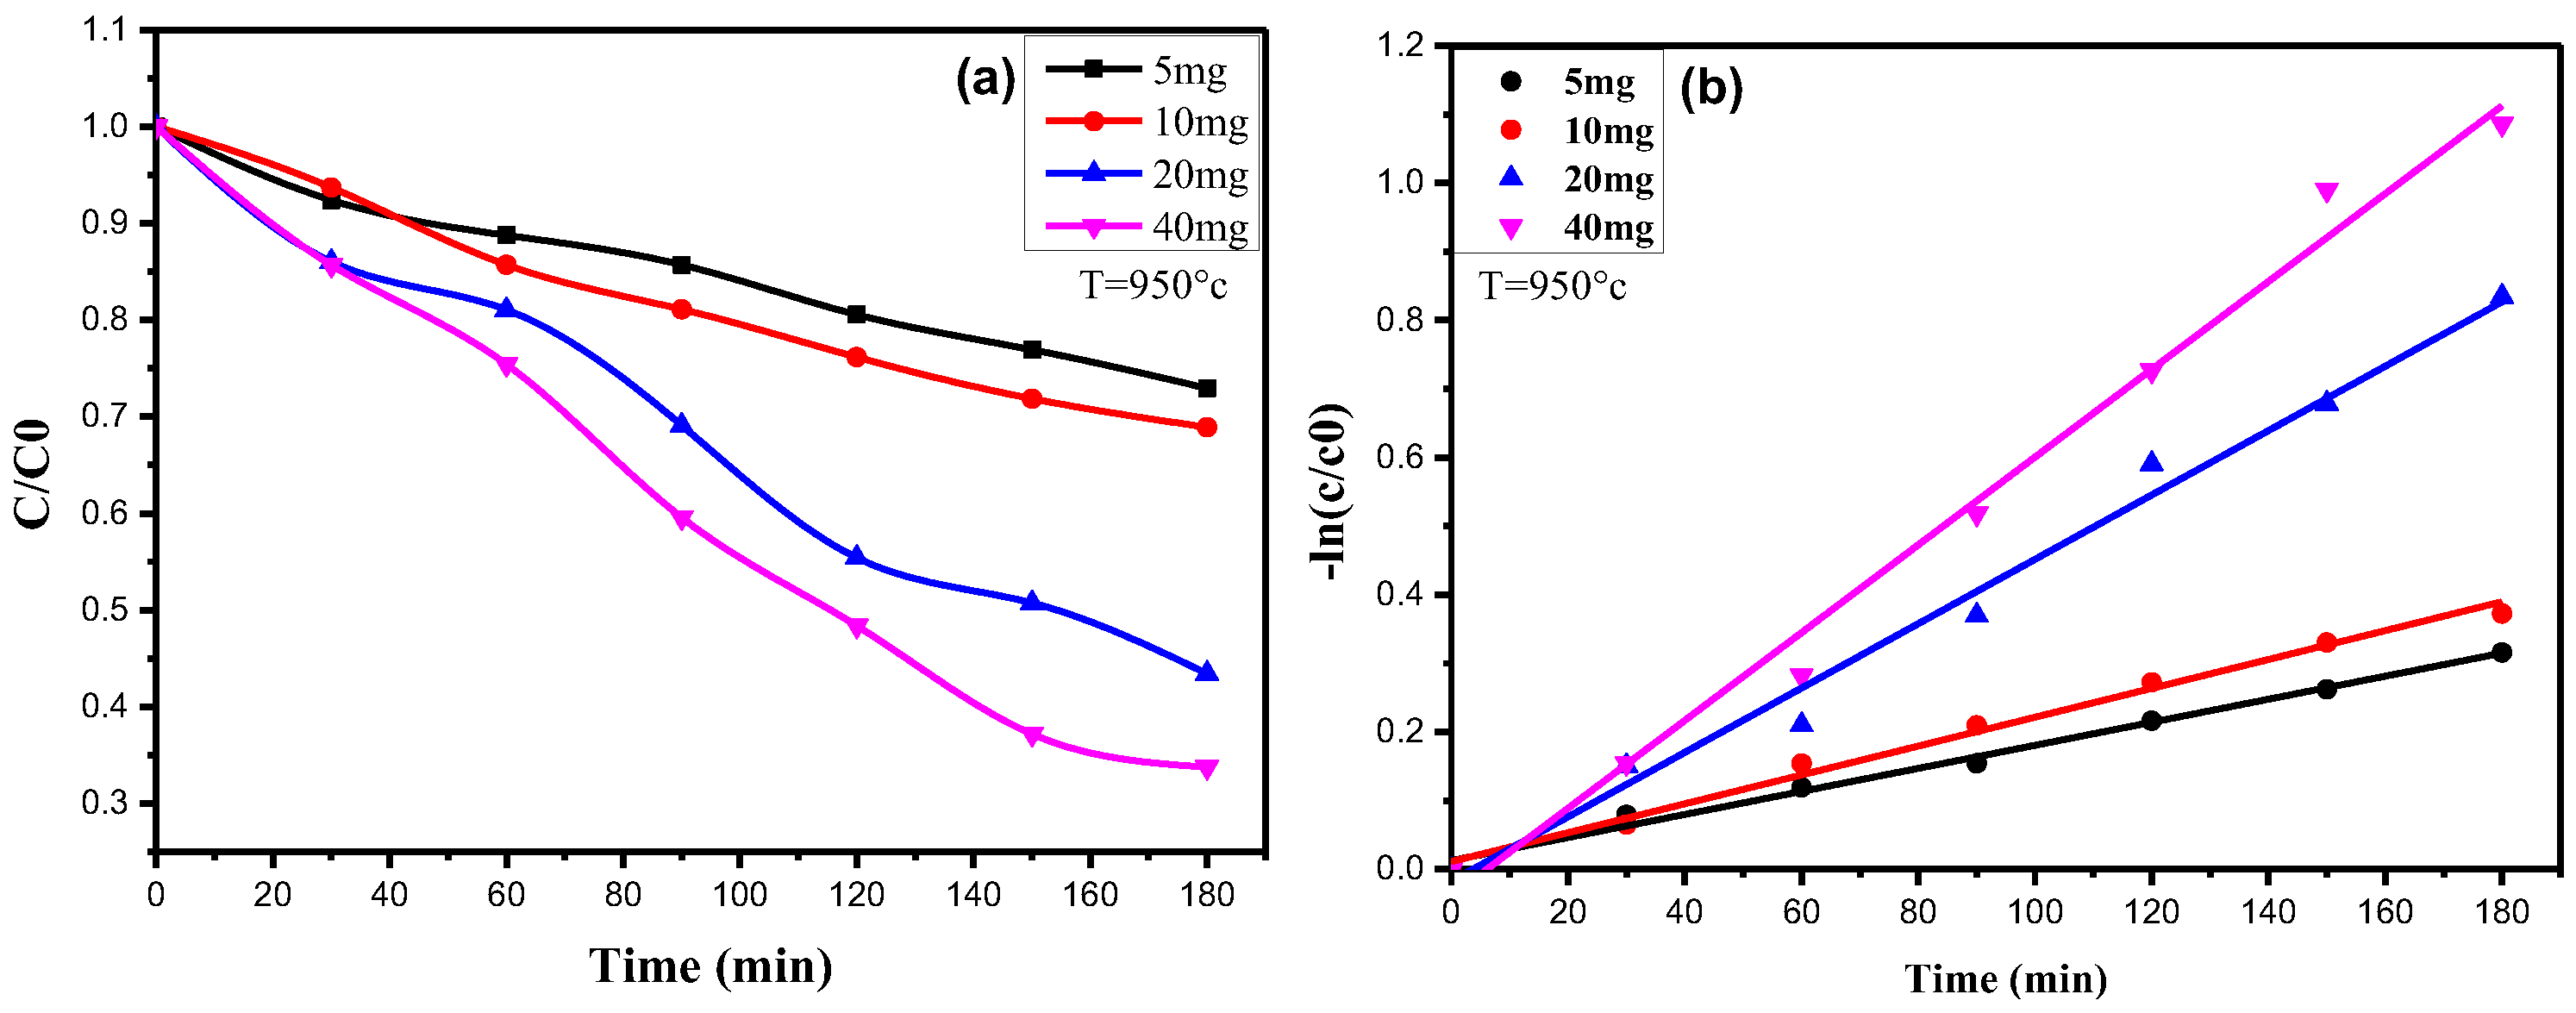
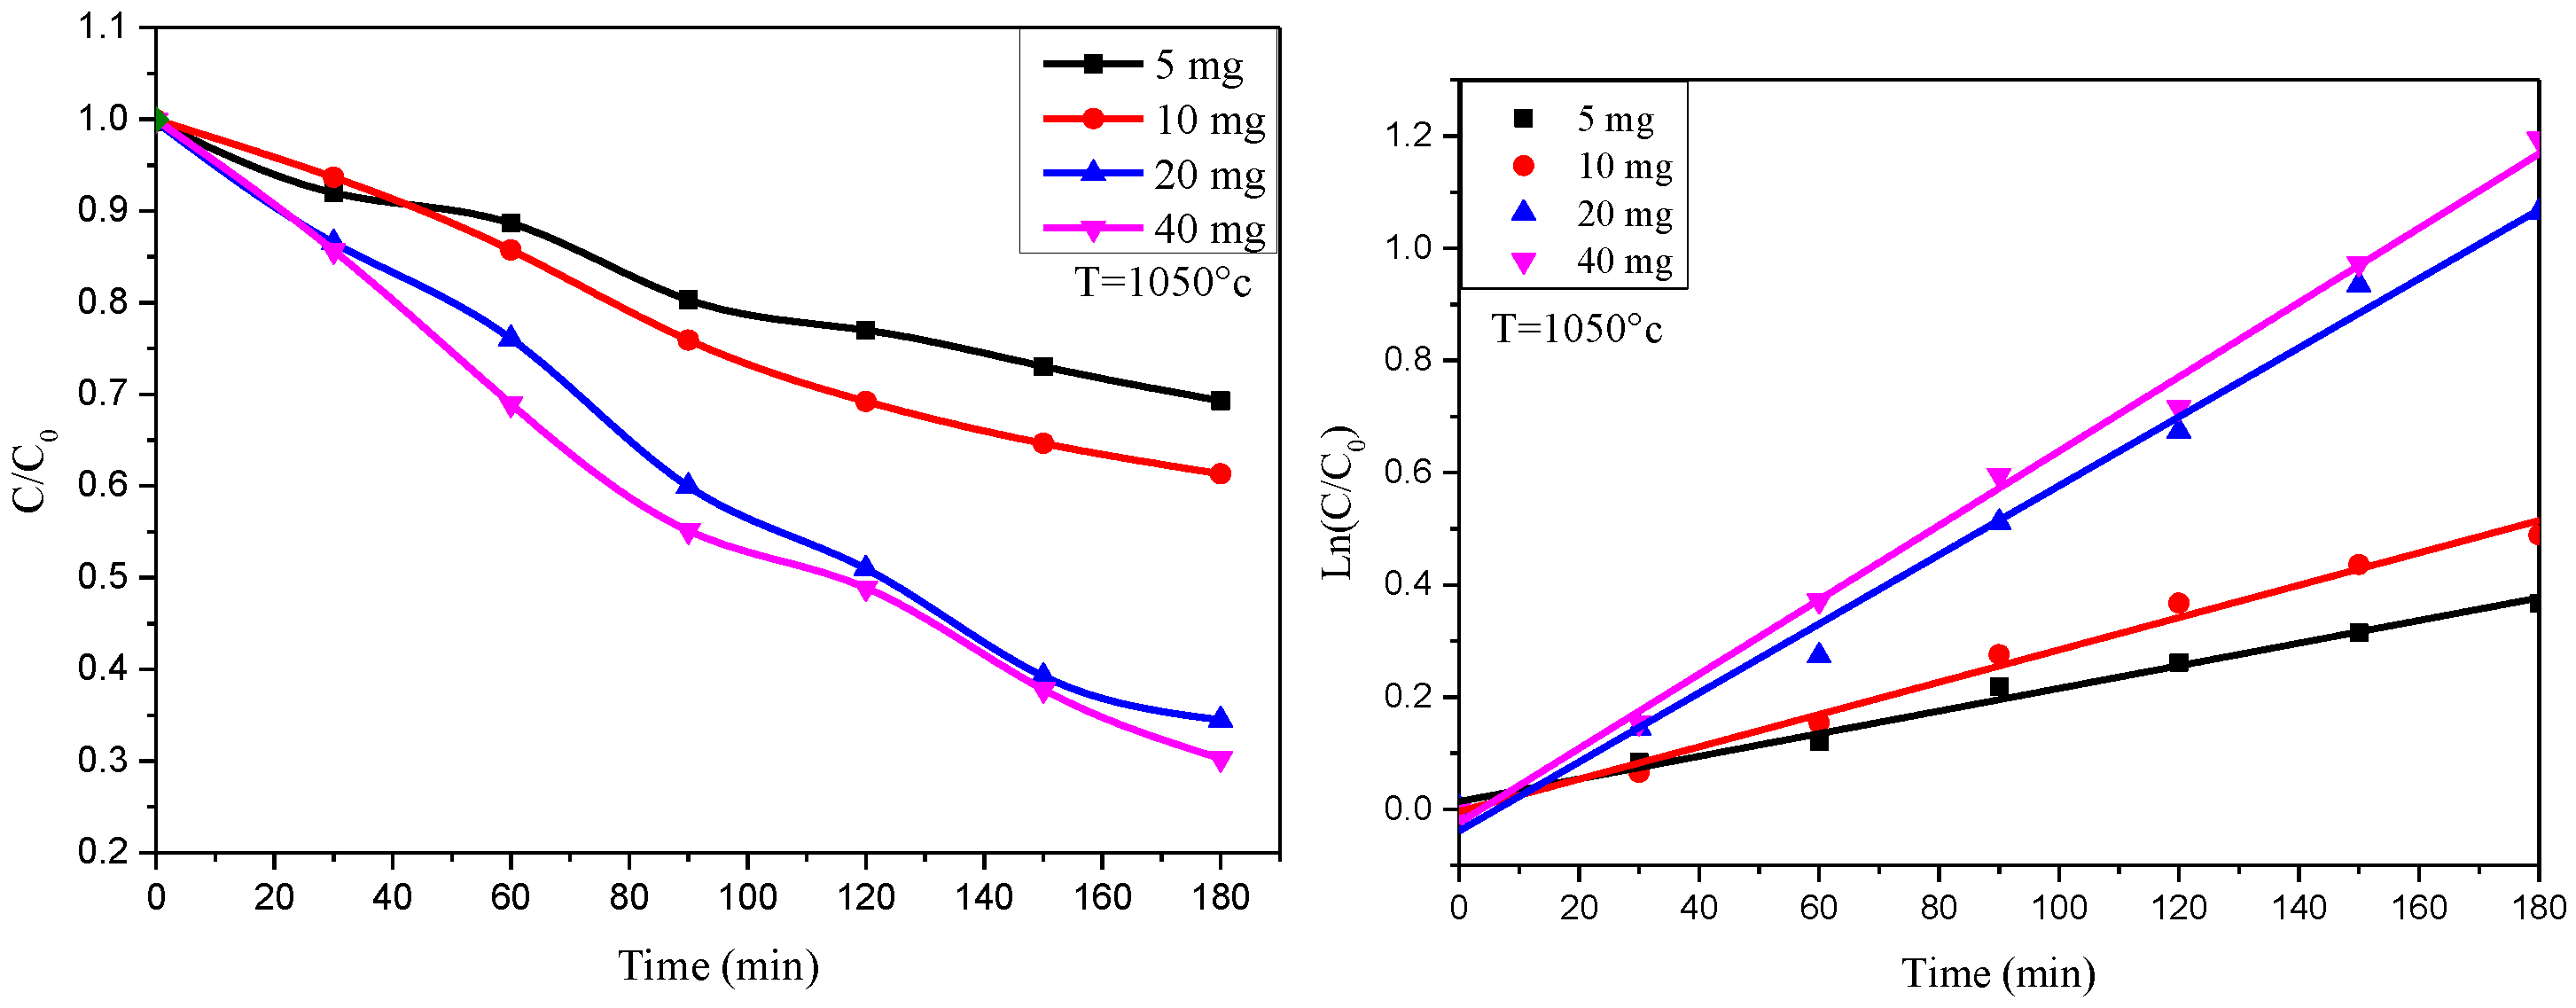
3.3.3. Effect of Catalyst Content

The amount of catalyst plays a significant role in the photodegradation rate. In the present study, the decolorization efficiency of Cd0.6Mg0.2Cu0.2Fe2O4 on the photodegradation of methylene blue was evaluated for different catalyst concentrations ranging from 5 to 40 mg, as shown in Figure 14a,b. It can be seen from the figures that increasing the catalyst concentration from 5 to 40 mg enhanced the degradation rate to an optimal level. This enhancement can be attributed to the improved light absorption and more efficient generation of electron–hole pairs, which are crucial for initiating photocatalytic reactions.
Moreover, for the S1 sample, the degradation efficiency ranged from 27.07% to 66.28% for catalyst concentrations from 5 to 40 mg over an irradiation time of 180 min. For the S2 sample, the degradation efficiency was even better, ranging from 30.91% to 69.84%, demonstrating improved photocatalytic performance at the higher calcination temperature. The highest catalyst concentration of 40 mg resulted in the maximum degradation efficiency, indicating that increased catalyst content consistently enhances the photodegradation process.
The continuous increase in degradation efficiency with higher catalyst concentrations can be attributed to the reduction of the optical band gap at higher calcination temperatures. This reduction facilitates the absorption of a broader spectrum of light, thereby enhancing the generation of reactive species essential for the degradation of methylene blue. Consequently, the optimal concentration of Cd0.6Mg0.2Cu0.2Fe2O4 in the present study was found to be 40 mg.

3.3.4. Kinetic Analysis of Methylene Blue Degradation

The study of the reaction kinetics for methylene blue (MB) dye degradation indicates that the reaction follows a pseudo-first-order kinetic model [87]. The rate constant k was determined using the Langmuir–Hinshelwood equation:
−ln(Ct/C0) = k·t
where Ct represents the concentration of MB at time t, C0 is the initial concentration of the dye, and k is the reaction rate constant. Figure 15a,b and Figure 16a,b show the graphs of Ct/C0 and −ln(Ct/C0) as functions of time for catalysts S1 and S2, respectively. The rate constant k was determined from the slope of the linear fit to these data lists in Table 7 where R2 denotes the coefficient of determination, which indicates how well the kinetic model fits the experimental data. These results demonstrate that increasing the catalyst concentration leads to a higher reaction rate, indicating improved degradation efficiency. Additionally, higher calcination temperatures (1050 °C) further enhance photocatalytic performance. This enhancement is likely due to the reduction of the optical band gap, which facilitates greater absorption of light and more efficient generation of electron–hole pairs, thereby accelerating the degradation process.

4. Conclusions

This study highlights the significant impact of calcination temperature on the structural, morphological, and photocatalytic properties of Cd0.6Mg0.2Cu0.2Fe2O4 spinel ferrites. Increasing the calcination temperature improves crystallinity, enhances grain growth, and leads to a reduction in optical band gap energy, which facilitates more efficient charge carrier generation and separation. XPS analysis reveals that higher temperatures promote cation redistribution and increase the concentration of oxygen vacancies, contributing to improved photocatalytic activity. The enhanced degradation of methylene blue at higher calcination temperatures demonstrates the potential of these spinel ferrites for environmental remediation. Future studies could further explore the role of Raman-active vibrational modes, additional dopants, and reaction conditions to optimize the photocatalytic efficiency of these materials.

Author Contributions

Conceptualization, A.R.J. and M.A.; methodology, A.S. and S.H.; software, M.G.; validation, W.N., M.G. and A.S.; formal analysis, M.A.; investigation, N.D.; resources, M.G.; data curation, A.R.J.; writing—original draft preparation, M.G.; writing—review and editing, M.G.; visualization, A.S.; supervision, M.G.; project administration, N.D.; funding acquisition. All authors have read and agreed to the published version of the manuscript.

Funding

The authors extend their appreciation to the Deanship of Research and Graduate Studies at King Khalid University for funding this work through Large Research Project under grant number RGP.2/197/45.

Data Availability Statement

Upon a reasonable request, the corresponding author is able to furnish the data.

Conflicts of Interest

The authors state that there are no known financial interests or personal relationships that could have potentially influenced the work presented in this paper.

References

  1. Naresh, U.; Kumar, R.J.; Naidu, K.C.B. Optical, magnetic and ferroelectric properties of Ba0.2Cu0.8−xLaxFe2O4 (x = 0.2–0.6) nanoparticles. Ceram. Int. 2019, 45, 7515–7523. [Google Scholar] [CrossRef]
  2. Naresh, U.; Kumar, R.J.; Naidu, K.C.B. Hydrothermal synthesis of barium copper ferrite nanoparticles: Nanofiber formation, optical, and magnetic properties. Mater. Chem. Phys. 2019, 236, 121807. [Google Scholar] [CrossRef]
  3. Akbari, S.; Masoudpanah, S.; Mirkazemi, S.; Aliyan, N. PVA assisted coprecipitation synthesis and characterization of MgFe2O4 nanoparticles. Ceram. Int. 2017, 43, 6263–6267. [Google Scholar] [CrossRef]
  4. Ram, N.R.; Prakash, M.; Naresh, U.; Kumar, N.S.; Sarmash, T.S.; Subbarao, T.; Kumar, R.J.; Kumar, G.R.; Naidu, K.C.B. Review on magnetocaloric effect and materials. J. Supercond. Nov. Magn. 2018, 31, 1971–1979. [Google Scholar] [CrossRef]
  5. Kurian, J.; Mathew, M.J. Structural, optical and magnetic studies of CuFe2O4, MgFe2O4 and ZnFe2O4 nanoparticles prepared by hydrothermal/solvothermal method. J. Magn. Magn. Mater. 2018, 451, 121–130. [Google Scholar] [CrossRef]
  6. Lüders, U.; Barthelemy, A.; Bibes, M.; Bouzehouane, K.; Fusil, S.; Jacquet, E.; Contour, J.-P.; Bobo, J.-F.; Fontcuberta, J.; Fert, A. NiFe2O4: A versatile spinel material brings new opportunities for spintronics. Adv. Mater. 2006, 18, 1733–1736. [Google Scholar] [CrossRef]
  7. Nonkumwong, J.; Ananta, S.; Jantaratana, P.; Phumying, S.; Maensiri, S.; Srisombat, L. Phase formation, morphology and magnetic properties of MgFe2O4 nanoparticles synthesized by hydrothermal technique. J. Magn. Magn. Mater. 2015, 381, 226–234. [Google Scholar] [CrossRef]
  8. Pan, Y.; Zhang, Y.; Wei, X.; Yuan, C.; Yin, J.; Cao, D.; Wang, G. MgFe2O4 nanoparticles as anode materials for lithium-ion batteries. Electrochim. Acta 2013, 109, 89–94. [Google Scholar] [CrossRef]
  9. Bini, M.; Tondo, C.; Capsoni, D.; Mozzati, M.C.; Albini, B.; Galinetto, P. Superparamagnetic ZnFe2O4 nanoparticles: The effect of Ca and Gd doping. Mater. Chem. Phys. 2018, 204, 72–82. [Google Scholar] [CrossRef]
  10. Popkov, V.I.; Tolstoy, V.P.; Semenov, V.G. Synthesis of phase-pure superparamagnetic nanoparticles of ZnFe2O4 via thermal decomposition of zinc-iron layered double hydroxysulphate. J. Alloys Compd. 2020, 813, 152179. [Google Scholar] [CrossRef]
  11. Ge, Y.-C.; Wang, Z.-L.; Yi, M.-Z.; Ran, L.-P. Fabrication and magnetic transformation from paramagnetic to ferrimagnetic of ZnFe2O4 hollow spheres. Trans. Nonferrous Met. Soc. China 2019, 29, 1503–1509. [Google Scholar] [CrossRef]
  12. El-Ghazzawy, E.H. Effect of heat treatment on structural, magnetic, elastic and optical properties of the co-precipitated Co0.4Sr0.6Fe2O4. J. Magn. Magn. Mater. 2020, 497, 166017. [Google Scholar] [CrossRef]
  13. Rahman, S.; Nadeem, K.; Anis-ur-Rehman, M.; Mumtaz, M.; Naeem, S.; Letofsky-Papst, I.J.C.I. Structural and magnetic properties of ZnMg-ferrite nanoparticles prepared using the co-precipitation method. Ceram. Int. 2013, 39, 5235–5239. [Google Scholar] [CrossRef]
  14. Liu, J.; Qin, F.; Chen, D.; Shen, H.; Wang, H.; Xing, D.; Phan, M.-H.; Sun, J. Combined current-modulation annealing induced enhancement of giant magnetoimpedance effect of Co-rich amorphous microwires. J. Appl. Phys. 2014, 115, 17A326. [Google Scholar] [CrossRef]
  15. Mazarío, E.; Herrasti, P.; Morales, M.P.; Menéndez, N. Synthesis and characterization of CoFe2O4 ferrite nanoparticles obtained by an electrochemical method. Nanotechnology 2012, 23, 355708. [Google Scholar] [CrossRef]
  16. Singh, C.; Jauhar, S.; Kumar, V.; Singh, J.; Singhal, S. Synthesis of zinc substituted cobalt ferrites via reverse micelle technique involving in situ template formation: A study on their structural, magnetic, optical and catalytic properties. Mater. Chem. Phys. 2015, 156, 188–197. [Google Scholar] [CrossRef]
  17. Raghavender, A.T.; Jadhav, K.M. Dielectric properties of Al-substituted Co ferrite nanoparticles. Bull. Mater. Sci. 2009, 32, 575–578. [Google Scholar]
  18. Harrabi, D.; Hcini, S.; Dhahri, J.; Hamdaoui, N.; Charguia, R.; Bouazizi, M.L.; Mansouri, S. Structural, Magnetic, and Dielectric Properties for Mg0.6Co0.2Cu0.2FeCrO4 Spinel Ferrites Prepared Under Different Calcination Temperatures. J. Supercond. Nov. Magn. 2023, 36, 1549–1569. [Google Scholar] [CrossRef]
  19. Rathi, B.S.; Kumar, P.S.; Vo, D.V.N. Critical review on hazardous pollutants in water environment: Occurrence, monitoring, fate, removal technologies and risk assessment. Sci. Total Environ. 2021, 797, 149134. [Google Scholar] [CrossRef]
  20. Tkaczyk, A.; Mitrowska, K.; Posyniak, A. Synthetic organic dyes as contaminants of the aquatic environment and their implications for ecosystems: A review. Sci. Total Environ. 2020, 717, 137222. [Google Scholar] [CrossRef]
  21. Kumar, S.; Karthikeyan, S.; Lee, A.F. g-C3N4-based nanomaterials for visible light-driven photocatalysis. Catalysts 2018, 8, 74. [Google Scholar] [CrossRef]
  22. Boettcher, S.W.; Mallouk, T.E.; Osterloh, F.E. Themed issue on water splitting and photocatalysis. J. Mater. Chem. A 2016, 4, 2764–2765. [Google Scholar] [CrossRef]
  23. Fardood, S.T.; Moradnia, F.; Forootan, R.; Abbassi, R.; Jalalifar, S.; Ramazani, A.; Sillanpää, M. Facile green synthesis, characterization and visible light photocatalytic activity of MgFe2O4@ CoCr2O4 magnetic nanocomposite. J. Photochem. Photobiol. A Chem. 2022, 423, 113621. [Google Scholar]
  24. Moradnia, F.; Fardood, S.T.; Ramazani, A.; Min, B.-K.; Joo, S.W.; Varma, R.S. Magnetic Mg0.5Zn0.5FeMnO4 nanoparticles: Green sol-gel synthesis, characterization, and photocatalytic applications. J. Clean. Prod. 2021, 288, 125632. [Google Scholar] [CrossRef]
  25. Oller, I.; Malato, S.; Sánchez Pérez, J.A. Combination of advanced oxidation processes and biological treatments for wastewater decontamination—A review. Sci. Total Environ. 2011, 409, 4141–4166. [Google Scholar] [CrossRef]
  26. Abbas, A.A.; Jingsong, G.; Ping, L.Z.; Ya, P.Y.; Al-Rekabi, W.S. Review on LandWll leachate treatments. J. Appl. Sci. Res. 2009, 5, 534–545. [Google Scholar]
  27. Chan, S.H.S.; Wu, T.Y.; Juan, J.C.; Teh, C.Y. Recent developments of metal oxide semiconductors as photocatalysts in advanced oxidation processes (AOPs) for treatment of dye waste-water. J. Chem. Technol. Biotechnol. 2011, 86, 1130–1158. [Google Scholar] [CrossRef]
  28. Taghavi Fardood, S.; Moradnia, F.; Heidarzadeh, S.; Naghipour, A. Green synthesis, characterization, photocatalytic and antibacterial activities of copper oxide nanoparticles of copper oxide nanoparticles. Nanochem. Res. 2023, 8, 134–140. [Google Scholar]
  29. Zhu, Y.; Zheng, G.; Dai, Z.; Zhang, L.; Ma, Y. Photocatalytic and luminescent properties of SrMoO4 phosphors prepared via hydrothermal method with different stirring speeds. J. Mater. Sci. Technol. 2017, 33, 23–29. [Google Scholar] [CrossRef]
  30. Ghoreishi, S.M. Facile synthesis and characterization of CaWO4 nanoparticles using a new Schiff base as capping agent: Enhanced photocatalytic degradation of methyl orange. J. Mater. Sci. Mater. Electron. 2017, 28, 14833–14838. [Google Scholar] [CrossRef]
  31. Ben Makhlouf, C.; Bouzidi, S.; Gassoumi, A.; Selmi, A.; Hcini, F.; Hcini, S.; Gassoumi, M. Experimental study of electrical and dielectric properties of Cu0.6Mg0.2Co0.2FeCrO4 spinel ferrite. J. Sol-Gel Sci. Technol. 2024, 110, 859–874. [Google Scholar] [CrossRef]
  32. Kouki, N.; Hcini, S.; Aldawas, R.; Boudard, M. Structural, Infrared, Magnetic, and Electrical Properties of Ni0.6Cd0.2Cu0.2Fe2O4 Ferrites Synthesized Using Sol-Gel Method Under Different Sintering Temperatures. J. Supercond. Nov. Magn. 2019, 32, 2209–2218. [Google Scholar] [CrossRef]
  33. ben Makhlouf, C.; Bouazizi, M.L.; Hcini, S.; ben Bacha, H.; HajTaieb, L.; Gassoumi, M. Detailed Structural Study, Optical, and Dielectric Properties of Co0.4Ni0.3Zn0.3Fe2O4 Ferrite and Its Potential Applications for Optoelectronic and Electronic Devices. J. Sol-Gel Sci. Technol. 2025, 1–24. [Google Scholar] [CrossRef]
  34. Dong, L.; Liu, Y.; Zhuo, Y.; Chu, Y. General Route to the Fabrication of ZnS and M-Doped (M = Cd2+, Mn2+, Co2+, Ni2+, and Eu3+) ZnS Nanoclews and a Study of Their Properties. Eur. J. Inorg. Chem. 2010, 2010, 2504–2513. [Google Scholar] [CrossRef]
  35. Shakil, M.; Inayat, U.; Khalid, N.R.; Tanveer, M.; Gillani SS, A.; Tariq, N.H.; Shah, A.; Mahmood, A.; Dahshan, A. Enhanced structural, optical, and photocatalytic activities of Cd–Co doped Zn ferrites for degrading methyl orange dye under irradiation by visible light. J. Phys. Chem. Solids 2022, 161, 110419. [Google Scholar] [CrossRef]
  36. Tanveer, M.; Nisa, I.; Nabi, G.; Shakil, M.; Khalid, S.; Qadeer, M. Enhanced structural, optical, and photocatalytic activity of novel Cd–Zn co-doped Mg0.25 Fe1.75O4 for degradation of RhB dye under visible light irradiation. Ceram. Int. 2022, 48, 15451–15461. [Google Scholar] [CrossRef]
  37. Gupta, N.K.; Ghaffari, Y.; Kim, S.; Bae, J.; Kim, K.S.; Saifuddin, M. Photocatalytic degradation of organic pollutants over MFe2O4 (M = Co, Ni, Cu, Zn) nanoparticles at neutral pH. Sci. Rep. 2020, 10, 4942. [Google Scholar] [CrossRef]
  38. Sankaramahalingam, A.; Lawrence, J.B. Structural, optical, and magnetic properties of MgFe2O4 synthesized with addition of copper. Synth. React. Inorg. Met.-Org. Nano-Met. Chem. 2012, 42, 121–127. [Google Scholar] [CrossRef]
  39. Hammad, T.M.; Kuhn, S.; Amsha, A.A.; Hejazy, N.K.; Hempelmann, R. Comprehensive study of the impact of Mg2+ doping on optical, structural, and magnetic properties of copper nanoferrites. J. Supercond. Nov. Magn. 2020, 33, 3065–3075. [Google Scholar] [CrossRef]
  40. Balamurugan, A.; Priya, R.S.; Chaudhary, P.; Kumar, E.R.; Indumathi, T.; Srinivas, C.; Yadav, B.C.; Sastry, D.L. Natural fuel assisted synthesis of Mg–Cu ferrite nanoparticles: Evaluation of structural, dielectric, magnetic and humidity sensing properties. Ceram. Int. 2022, 48, 4874–4885. [Google Scholar] [CrossRef]
  41. Jdidi, A.R.; Rhimi, N.; Hcini, F.; Hcini, S.; Bouzidi, S.; Khirouni, K.; Gassoumi, M. Enhancing dielectric properties of CuFe2O4 spinel ferrites through Mg, Co, and Cr doping: A sol-gel synthesis approach. J. Sol-Gel Sci. Technol. 2024, 034103. [Google Scholar] [CrossRef]
  42. Zhang, S.; Wu, J.; Li, F.; Li, L. Enhanced photocatalytic performance of spinel ferrite (MFe2O4, M = Zn, Mn, Co, Fe, Ni) catalysts: The correlation between morphology–microstructure and photogenerated charge efficiency. J. Environ. Chem. Eng. 2022, 10, 107702. [Google Scholar] [CrossRef]
  43. Samson, V.A.F.; Bernadsha, S.B.; Mahendiran, M.; Lawrence, K.L.; Madhavan, J.; Raj MV, A.; Prathap, S. Impact of calcination temperature on structural, optical, and magnetic properties of spinel CuFe2O4 for enhancing photocatalytic activity. J. Mater. Sci. Mater. Electron. 2020, 31, 6574–6585. [Google Scholar] [CrossRef]
  44. Bhowmik, R.N.; Vijayasri, G. Study of microstructure and semiconductor to metallic conductivity transition in solid state sintered Li0.5Mn0.5Fe2O4−δ spinel ferrite. J. Appl. Phys. 2013, 114, 223701. [Google Scholar] [CrossRef]
  45. Patil, S.B.; Bhojya Naik, H.S.; Nagaraju, G.; Shiralgi, Y. Sugarcane juice facilitated eco-friendly synthesis of solar light active CdFe2O4 nanoparticles and its photocatalytic application. Eur. Phys. J. Plus 2018, 133, 229. [Google Scholar] [CrossRef]
  46. Rahimi, M.; Kameli, P.; Ranjbar, M.; Salamati, H. The effect of sintering temperature on evolution of structural and magnetic properties of nanostructured Ni0.3Zn0.7Fe2O4 ferrite. J. Nanoparticle Res. 2013, 15, 1865. [Google Scholar] [CrossRef]
  47. Patil, R.; Hankare, P.; Garadkar, K.; Sasikala, R. Effect of sintering temperature on structural, magnetic properties of lithium chromium ferrite. J. Alloys Compd. 2012, 523, 66–71. [Google Scholar] [CrossRef]
  48. Gherca, D.; Pui, A.; Cornei, N.; Cojocariu, A.; Nica, V.; Caltun, O. Synthesis, characterization and magnetic properties of MFe2O4 (M = Co, Mg, Mn, Ni) nanoparticles using ricin oil as capping agent. J. Magn. Magn. Mater. 2012, 324, 3906–3911. [Google Scholar] [CrossRef]
  49. Ahmed, M.; Afify, H.; El Zawawia, I.; Azab, A. Novel structural and magnetic properties of Mg doped copper nanoferrites prepared by conventional and wet methods. J. Magn. Magn. Mater. 2012, 324, 2199–2204. [Google Scholar] [CrossRef]
  50. Gholizadeh, A.; Jafari, E. Effects of sintering atmosphere and temperature on structural and magnetic properties of Ni-Cu-Zn ferrite nano-particles: Magnetic enhancement by a reducing atmosphere. J. Magn. Magn. Mater. 2017, 422, 328–336. [Google Scholar] [CrossRef]
  51. Basak, M.; Rahman, M.L.; Ahmed, M.F.; Biswas, B.; Sharmin, N. Calcination effect on structural, morphological and magnetic properties of nano-sized CoFe2O4 developed by a simple co-precipitation technique. Mater. Chem. Phys. 2021, 264, 124442. [Google Scholar] [CrossRef]
  52. Dippong, T.; Cadar, O.; Levei, E.A.; Deac, I.G.; Goga, F.; Borodi, G.; Barbu-Tudoran, L. Influence of polyol structure and molecular weight on the shape and properties of Ni0.5Co0.5Fe2O4 nanoparticles obtained by sol-gel synthesis. Ceram. Int. 2019, 45, 7458–7467. [Google Scholar] [CrossRef]
  53. Dippong, T.; Cadar, O.; Levei, E.A.; Deac, I.G. Microstructure, porosity and magnetic properties of Zn0.5Co0.5Fe2O4/SiO2 nanocomposites prepared by sol-gel method using different polyols. J. Magn. Magn. Mater. 2020, 498, 166168. [Google Scholar] [CrossRef]
  54. Allen, G.C.; Harris, S.J.; Jutson, J.A.; Dyke, J.M. A study of a number of mixed transition metal oxide spinels using X-ray photoelectron spectroscopy. Appl. Surf. Sci. 1989, 37, 111. [Google Scholar] [CrossRef]
  55. Allen, G.C.; Hallam, K.R. Characterisation of the spinels MxCo1−xFe2O4 (M = Mn, Fe or Ni) using X-ray photoelectron spectroscopy. Appl. Surf. Sci. 1996, 93, 25. [Google Scholar] [CrossRef]
  56. Zhang, Z.; Wang, Z.; Tan, J.; Zhou, K.; Garcia-Meza, J.V.; Song, S.; Xia, L. Yeast-derived biochar to load CoFe2O4: Degradation of tetracycline hydrochloride by heterogeneous activation of peroxymonosulfate. J. Environ. Chem. Eng. 2023, 11, 110020. [Google Scholar] [CrossRef]
  57. Bian, W.; Yang, Z.; Strasser, P.; Yang, R. A CoFe2O4/graphene nanohybrid as an efficient bi-functional electrocatalyst for oxygen reduction and oxygen evolution. J. Power Sources 2014, 250, 196–203. [Google Scholar] [CrossRef]
  58. Pauly, N.; Tougaard, S.; Yubero, F. Determination of the Cu 2p primary excitation spectra for Cu, Cu2O and CuO. Surf. Sci. 2014, 620, 17–22. [Google Scholar] [CrossRef]
  59. Thuler, M.R.; Benbow, R.L.; Hurych, Z. Resonant photo-and Auger emission at the 3p threshold of Cu, Cu2O, and CuO. Phys. Rev. B 1982, 26, 669. [Google Scholar] [CrossRef]
  60. Srinivasan, S.S.G.; Govardhanan, B.; Aabel, P.; Ashok, M.; Kumar, M.S. Effect of oxygen partial pressure on the tuning of copper oxide thin films by reactive sputtering for solar light driven photocatalysis. Sol. Energy 2019, 187, 368–378. [Google Scholar] [CrossRef]
  61. AlKhoori, A.A.; Polychronopoulou, K.; Belabbes, A.; Abi Jaoude, M.; Vega, L.F.; Sebastian, V.; Hinder, S.; Baker, M.A.; Zedan, A.F. Cu, Sm co-doping effect on the CO oxidation activity of CeO2. A combined experimental and density functional study. Appl. Surf. Sci. 2020, 521, 146305. [Google Scholar] [CrossRef]
  62. Deng, Y.; Handoko, A.D.; Du, Y.; Xi, S.; Yeo, B.S. In Situ Raman Spectroscopy of Copper and Copper Oxide Surfaces during Electrochemical Oxygen Evolution Reaction: Identification of CuIII Oxides as Catalytically Active Species. ACS Catal. 2016, 64, 2473–2481. [Google Scholar] [CrossRef]
  63. Alajlani, Y.; Placido, F.; Barlow, A.; Chu, H.O.; Song, S.; Rahman, S.U.; De Bold, R.; Gibson, D. Characterisation of Cu2O, Cu4O3, and CuO mixed phase thin films produced by microwave-activated reactive sputtering. Vacuum 2017, 144, 217–228. [Google Scholar] [CrossRef]
  64. Kallel, W.; Bouattour, S.; Ferreira, L.V.; do Rego, A.B. Synthesis, XPS and luminescence (investigations) of Li+ and/or Y3+ doped nanosized titanium oxide. Mater. Chem. Phys. 2009, 114, 304. [Google Scholar] [CrossRef]
  65. Bessergenev, V.G.; Pereira RJ, F.; Mateus, M.C.; Khmelinskii, I.V.; Vasconcelos, D.A. 379 R. Nicula, E. Burkela, AM Botelho do Rego, AI Saprykin. Thin Solid Films 2006, 503, 1. [Google Scholar]
  66. Naeem, M.; Hasanain, S.K.; Kobayashi, M.; Ishida, Y.; Fujimori, A.; Buzby, S.; Shah, S.I. Effect of reducing atmosphere on the magnetism of Zn1−xCoxO (0 ≤ x ≤ 0.10) nanoparticles. Nanotechnology 2006, 17, 2675. [Google Scholar] [CrossRef]
  67. Mitran, G.; Chen, S.; Seo, D.K. Role of oxygen vacancies and Mn4+/Mn3+ ratio in oxidation and dry reforming over cobalt-manganese spinel oxides. Mol. Catal. 2020, 483, 110704. [Google Scholar] [CrossRef]
  68. Souifi, K.; Rejaiba, O.; Amorri, O.; Nasri, M.; Alzahrani, B.; Bouazizi, M.L.; Khirouni, K.; Khelifi, J. Detailed Investigation of Structural, Morphology, Magnetic, Electical and Optical Properties of the Half-Doped Perovsikte Nd0.5Ba0.5FeO3. J. Inorg. Organomet. Polym. Mater. 2022, 32, 4515–4531. [Google Scholar] [CrossRef]
  69. Raddaoui, G.; Rejaiba, O.; Nasri, M.; Khirouni, K.; Alzahrani, B.; Bouazizi, M.L.; Khelifi, J. Investigation studies of structural, electrical, dielectric, and optical of DyTi0.5Mn0.5O3 multiferroic for optoelectronics applications. J. Mater. Sci. Mater. Electron. 2022, 33, 21890–21912. [Google Scholar] [CrossRef]
  70. Gagandeep Singh, K.; Lark, B.S.; Sahota, H.S. Attenuation measurements in solutions of some carbohydrates. Nucl. Sci. Eng. 2000, 134, 208–217. [Google Scholar] [CrossRef]
  71. Qaid, S.M.H.; Al-Asbahi, B.A.; Ghaithan, H.M.; AlSalhi, M.S.; Al Dwayyan, A.S. Optical and structural properties of CsPbBr3 perovskite quantum dots/PFO polymer composite thin films. J. Colloid Interface Sci. 2020, 563, 426–434. [Google Scholar] [CrossRef]
  72. Azab, A.A.; Mansour, A.M.; Turky, G.M. Structural, Magnetic, and Dielectric properties of Sr4Fe6O13 ferrite prepared of small crystallites. Sci. Rep. 2020, 10, 4955. [Google Scholar] [CrossRef] [PubMed]
  73. Thakur, P.; Sharma, R.; Sharma, V.; Sharma, P. Structural and optical properties of Mn0.5Zn0.5Fe2O4 nano ferrites: Effect of sintering temperature. Mater. Chem. Phys. 2017, 193, 285–289. [Google Scholar] [CrossRef]
  74. Abou Hammad, A.B.; Mansour, A.M.; Elhelali, T.M.; El Nahrawy, A.M. Sol-Gel/Gel Casting Nanoarchitectonics of Hybrid Fe2O3–ZnO/PS-PEG Nanocomposites and Their Optomagnetic Properties. J. Inorg. Organomet. Polym. 2023, 33, 544–554. [Google Scholar] [CrossRef]
  75. Abu Bakar, S.; Soltani, N.; Yunus, W.M.M.; Saion, E.; Bahrami, A. Structural and paramagnetic behavior of spinel NiCr2O4 nanoparticles synthesized by thermal treatment method: Effect of calcination temperature. Solid State Commun. 2014, 192, 15–19. [Google Scholar] [CrossRef]
  76. Suman; Chahal, S.; Kumar, A.; Kumar, P. Zn Doped α-Fe2O3: An Efficient Material for UV Driven Photocatalysis and Electrical Conductivity. Crystal 2020, 10, 273. [Google Scholar] [CrossRef]
  77. Jian, S.; Tian, Z.; Hu, J.; Zhang, K.; Zhang, L.; Duan, G.; Yang, W.; Jiang, S. Enhanced visible light photocatalytic efficiency of La-doped ZnO nanofibers via electrospinning-calcination technology. Adv. Powder Mater. 2022, 1, 100004. [Google Scholar] [CrossRef]
  78. Mahmood, H.; Khan, M.; Mohuddin, B.; Iqbal, T. Solution-phase growth of tin oxide (SnO2) nanostructures: Structural, optical and photocatalytic properties. Mater. Sci. Eng. B 2020, 258, 114568. [Google Scholar] [CrossRef]
  79. Iqbal, M.; Bhatti, H.N.; Younis, S.; Rehmat, S.; Alwadai, N.; Almuqrin, A.H.; Iqbal, M. Graphene oxide nanocomposite with CuSe and photocatalytic removal of methyl green dye under visible light irradiation. Diam. Relat. Mater. 2021, 113, 108254. [Google Scholar] [CrossRef]
  80. Friedmann, D.; Mendive, C.; Bahnemann, D. TiO2 for water treatment: Parameters affecting the kinetics and mechanisms of photocatalysis. Appl. Catal. B Environ. 2010, 99, 398–406. [Google Scholar] [CrossRef]
  81. Chahar, D.; Taneja, S.; Bisht, S.; Kesarwani, S.; Thakur, P.; Thakur, A.; Sharma, P.B. Photocatalytic activity of cobalt substituted zinc ferrite for the degradation of methylene blue dye under visible light irradiation. J. Alloys Compd. 2021, 851, 156878. [Google Scholar] [CrossRef]
  82. Ciocarlan, R.-G.; Seftel, E.M.; Mertens, M.; Pui, A.; Mazaj, M.; Tusar, N.N.; Cool, P. Novel magnetic nanocomposites containing quaternary ferrites systems Co0.5Zn0.25M0.25Fe2O4(M = Ni, Cu, Mn, Mg) and TiO2-anatase phase as photocatalysts for wastewater remediation under solar light irradiation, Mater. Sci. Eng. B Solid-State Mater. Adv. Technol. 2018, 230, 1–7. [Google Scholar] [CrossRef]
  83. Zhang, D.; Pu, X.; Du, K.; Yu, Y.M.; Shim, J.J.; Cai, P.; Kim, S.I.; Seo, H.J. Combustion synthesis of magnetic Ag/NiFe2O4 composites with enhanced visible-light photocatalytic properties. Sep. Purif. Technol. 2014, 137, 82–85. [Google Scholar] [CrossRef]
  84. Arifin, N.; Karim, K.M.R.; Abdullah, H.; Khan, M.R. Synthesis of titania doped copper ferrite photocatalyst and its photoactivity towards methylene blue degradation under visible light irradiation. Bull. Chem. React. Eng. Catal. 2019, 14, 219–227. [Google Scholar] [CrossRef]
  85. Padmapriya, G.; Manikandan, A.; Krishnasamy, V.; Jaganathan, S.K.; Antony, S.A. Spinel NixZn1−xFe2O4 (0.0 ≤ x ≤ 1.0) nano-photocatalysts: Synthesis, characterization and photocatalytic degradation of methylene blue dye. J. Mol. Struct. 2016, 1119, 39–47. [Google Scholar] [CrossRef]
  86. Mathubala, G.; Manikandan, A.; Antony, S.A.; Ramar, P. Photocatalytic degradation of methylene blue dye and magneto-optical studies of magnetically recyclable spinel NixMn1−xFe2O4 (x = 0.0–1.0) nanoparticles. J. Mol. Struct. 2016, 1113, 79–87. [Google Scholar] [CrossRef]
  87. El Nahrawy, A.M.; Abou Hammad, A.B.; Bakr, A.M.; Shaheen, T.I.; Mansour, A.M. Sol–gel synthesis and physical characterization of high impact polystyrene nanocomposites based on Fe2O3 doped with ZnO. Appl. Phys. A 2020, 126, 654. [Google Scholar] [CrossRef]
Figure 1. Sol–gel synthesis steps for Cd0.6Mg0.2Cu0.2Fe2O4 ferrites.
Crystals 15 00457 g001
Figure 2. (a) Rietveld refinement of the XRD patterns for S1. (b) Rietveld refinement of the XRD patterns for S2. (c) DRX patterns shift.
Crystals 15 00457 g002aCrystals 15 00457 g002b
Figure 3. SEM micrographs and particle size distribution of Cd0.6Mg0.2Cu0.2Fe2O4 (a,c) S1 and (b,d) S2.
Crystals 15 00457 g003
Figure 4. SurveyXPS spectra of S1 and S2.
Crystals 15 00457 g004
Figure 5. Fe2p XPS spectra of S1 (a) and S2 (b).
Crystals 15 00457 g005
Figure 6. Cd3d XPS spectra of S1 (a) and S2 (b).
Crystals 15 00457 g006
Figure 7. Cu2p XPS spectra of S1 (a) and S2 (b).
Crystals 15 00457 g007
Figure 8. Mg1s XPS spectra of S1 (a) and S2 (b).
Crystals 15 00457 g008
Figure 9. O1s XPS spectra of S1 (a) and S2 (b).
Crystals 15 00457 g009
Figure 10. (a) UV–vis absorbance versus wavelength for S1 and S2. (b) Plot of(αhυ)2 versus . (c) Plots of ln(αhυ) versus ln(hυ − Eg) for S1 and (d) for S2.
Crystals 15 00457 g010
Figure 11. UV–visible absorption profile of methylene blue during photodegradation without additives or catalysts.
Crystals 15 00457 g011
Figure 12. Time-dependent absorption spectra of MB solution in UV light with different catalyst concentrations (S1): (a) 5 mg, (b) 10 mg, (c) 20 mg, and (d) 40 mg.
Crystals 15 00457 g012
Figure 13. Time-dependent absorption spectra of MB solution in UV light with different catalyst concentrations (S2): (a) 5 mg, (b) 10 mg, (c) 20 mg, and (d) 40 mg.
Crystals 15 00457 g013
Figure 14. Degradation efficacy profile of Mb under UV light irradiation with different catalyst concentrations: (a) S1, (b) S2.
Crystals 15 00457 g014
Figure 15. Changes in (Ct/C0) (a) and −ln(Ct/C0) (b)as functions of time for the photodegradation of MO dye in the presence of S1 sample with different catalyst concentrations.
Crystals 15 00457 g015
Figure 16. Changes in (Ct/C0) and −ln(Ct/C0) as functions of time for the photodegradation of MO dye in the presence of S2 sample with different catalyst concentrations.
Crystals 15 00457 g016
Table 1. Rietveld refinement results for Cd0.6Mg0.2Cu0.2Fe2O4 spinel ferrites S1 and S2.
SampleCd0.6 Mg0.2 Cu0.2Fe2O4
T = 950 °C (S1)
Cd0.6 Mg0.2 Cu0.2Fe2O4
T = 1050 °C (S2)
Crystal systemCubicCubic
Space groupF d-3 m F d-3 m
Lattice parameters
a (Å)8.5776 (±0.000098)8.5849 (±0.000096)
Cell volume V (Å3)
dx (g cm−3)5.48825.4749
DXRD (nm)12.1413.05
R-factors
Rp (%)13.513.0
Rwp (%)17.416.9
Rexp (%)15.9810.49
Bragg R-factor13.013.0
Rf-factor9.589.84
Χ22.712.58
DSchnmnm
Table 2. XPS composition data of S1 and S2.
S1S2
ElementsBE (eV)Atomic %BE (eV)Atomic %
O1s531.1165.59530.9660.55
Fe2p711.7321.00711.4927.76
Cd3d405.768.06405.246.19
Cu2p934.212.89933.842.77
Mg1s1304.452.461303.962.73
Table 3. XPS characteristics of Fe2p and Cd3d regions for the calcined samples.
Fe2pS1S2
BE (eV)Atomic%BE (eV)Atomic%
Fe3+ (B-site)711.3670.30711.3981.67
Fe3+ (A-site)714.8929.70715.0418.33
satellite719.83--719.11--
Cd3dS1S2
Cd2+ (B-site)406.5826.88406.7912.14
Cd2+ (A-site)405.2973.12405.0287.86
Table 4. XPS characteristics of O1s regions for the calcined samples.
O1sS1S2
BE (eV)Atomic %BE (eV)Atomic%
Ol529.9777.01530.2557.09
Ov532.0522.99532.1042.91
Table 5. General information on methylene blue.
Chemical NameMethylene Blue (Methylthioninium Chloride)
Chemical formulaC16H18ClN3S
Molar mass319.85 g/mol
AppearanceBlue crystalline powder
Water solubilitySoluble (35 g/L at 25 °C)
Melting point100–110 °C (decomposition)
Main applicationsDye, antiseptic agent, photosensitizer
Maximum absorption wavelength (λmax)664 nm (in water)
pKa3.8
ToxicityModerately toxic if ingested or inhaled
Table 6. Degradation efficiency comparison between synthesized ferrite and reported ferrite materials.
M-Fe2O4Pollutant/sContact Time (min)Light SourceRemoval
Capacity
%
Ref.
ZnFe2O4MB60Vis64[77,78]
Co0.5Zn0.5Fe2O4MB60Vis77[78]
Co0.5Zn0.25N0.25Fe2O4–TiO2MB80UV–vis12.66[79]
Ag/NiFe2O4MB120Vis80[80,81]
CuFe2O4@TiO2MB180Vis40[80]
S1MB180UV56.57This work
S2MB180UV69.84This work
Ni0.6Zn0.4Fe2OMB200UV60[81,82,83]
MnFe2O4MB300UV 84[82,83,84,85,86]
NiFe2O4MB300UV94[82]
Table 7. Rate constants for methylene blue degradation using S1 and S2.
m (mg)S1S2
K (min−1)R2K (min−1)R2
50.0010 (±6.623 × 10⁻⁵)0.98720.0021
(±6.2423 × 10⁻⁵)
0.9858
100.0021
(±8.7839 × 10⁻⁵)
0.99530.0029
(±5.0023 × 10⁻⁵)
0.9954
200.0047
(±2.4101 × 10⁻⁵)
0.96700.0061
(±1.6333 × 10⁻⁵)
0.9672
400.0064
(±2.9936 × 10⁻⁵)
0.93520.0066
(±5.6003 × 10⁻⁵)
0.9372
Disclaimer/Publisher’s Note: The statements, opinions and data contained in all publications are solely those of the individual author(s) and contributor(s) and not of MDPI and/or the editor(s). MDPI and/or the editor(s) disclaim responsibility for any injury to people or property resulting from any ideas, methods, instructions or products referred to in the content.

