1. Introduction
Dynamic recrystallization (DRX) [
1,
2], meta-dynamic recrystallization (MDRX) [
3,
4,
5], and static recrystallization (SRX) [
6,
7,
8] are the primary mechanisms of microstructural evolution in metals and alloys. Among them, DRX occurs during plastic deformation at elevated temperatures, where the formation of new, strain-free grains replaces the deformed microstructure. However, it is important to note that DRX does not occur in all materials; it is particularly prevalent in materials with low-to-medium stacking fault energies [
9]. This process is driven by the accumulation of dislocations and the resulting stored energy, which promotes the nucleation and growth of new grains. DRX is particularly significant in hot working processes, such as rolling, forging, and extrusion, as it helps to refine the grain structure, enhance mechanical properties, and reduce flow stress [
10]. Consequently, the elucidation of grain structure evolution during dynamic recrystallization (DRX) is paramount for the rational design of thermomechanical processing regimes, enabling the attainment of targeted microstructural morphologies and the subsequent modulation of alloy material properties. To this end, predictive models have been formulated to describe microstructural transformations and DRX kinetics. These include, but are not limited to, the Johnson–Mehl–Avrami–Kolmogrov (JMAK) phenomenological model [
9] and physically based models that employ internal state variables such as dislocation density and subgrain size to characterize DRX evolution [
11,
12]. The advancement of computational resources has enhanced the adoption of microstructure-based simulation methodologies. Peczak et al. [
13] and Rollett et al. [
14] utilized the Monte Carlo (MC) method to simulate various aspects of dynamic recrystallization (DRX) during thermomechanical deformation. Goetz et al. [
15] employed a cellular automaton (CA) approach to model DRX, noting its capacity for calibration to spatial and temporal scales, a feature distinct from the MC method. Ding et al. [
16] developed a cellular automaton (CA) model, integrating microstructural evolution with plastic flow behavior and establishing a correlation between microstructural properties and the Zener–Hollomon parameter. This model has demonstrated broad applicability across diverse materials and phenomena, including magnesium alloys [
17,
18,
19]. Phase-field (PF) models have emerged as a powerful tool for investigating microstructural evolution during recrystallization across diverse materials and deformation conditions. Notably, PF models offer an advantage over cellular automaton (CA) and Monte Carlo (MC) methods by inherently incorporating interfacial energy and curvature, enabling a more accurate representation of complex microstructural morphologies. These PF models, encompassing both static and dynamic recrystallization (SRX and DRX), have integrated various physical mechanisms and demonstrated broad applicability across a wide range of materials [
20,
21,
22,
23,
24,
25,
26]. Takaki et al. [
27,
28] developed a PF model of DRX and extended the model by replacing the flow-stress model with an elastic–plastic finite element model in polycrystalline copper [
28]. Similar models were developed by Zhao et al. [
29,
30] and Chen et al. [
31].
Dynamic recrystallization (DRX) also plays a critical role in influencing the mechanical behavior of materials during high-temperature deformation. It induces significant softening of the crystalline structure, which is manifested by a pronounced stress drop in stress–strain curves and a corresponding increase in creep rate observed in creep curves [
32].
The extent of this phenomenon is governed by the kinetics of DRX and the resulting microstructure, which determine the rate at which the recrystallized state is achieved. The increase in creep rate is particularly dependent on the interplay between the initial microstructure and the evolution of the recrystallized grains, as well as the rate at which new, strain-free grains form and grow under applied stress. Thus, the creep behavior is intrinsically linked to the dynamics of DRX, underscoring the importance of recrystallization kinetics in controlling the mechanical response of materials under high-temperature deformation conditions [
33,
34].
Creep and hot deformation are two high-temperature deformation processes that differ primarily in their loading conditions and experimental approaches. In creep, a constant external stress is applied to the material, and the resulting strain is measured as a function of time, reflecting the material’s time-dependent deformation behavior. In contrast, hot deformation involves imposing a constant strain rate on the material, and the corresponding stress response is observed. This distinction in loading conditions—constant stress in creep versus constant strain rate in hot deformation—leads to different macroscopic mechanical responses and testing methodologies. However, at the microscopic scale, both processes share fundamental similarities in terms of dislocation activity and plastic deformation mechanisms. Thus, while the macroscopic loading conditions differ, the underlying microscopic mechanisms of plastic deformation are essentially the same [
35].
Given the similarities in the underlying microscopic mechanisms of plastic deformation between creep and hot deformation, the models developed to predict discontinuous dynamic recrystallization (DDRX) in hot deformation can also be applied to the DDRX process occurring during creep. However, certain modifications are necessary to account for the specific loading conditions and time-dependent nature of creep. For instance, the strain rate in creep is not constant but evolves over time to a steady-state condition. Therefore, while the core principles of DDRX models remain valid, adjustments must be made to incorporate the unique aspects of creep. By adapting these models, it becomes possible to accurately predict DDRX behavior in creep, leveraging the established framework of hot deformation while addressing the distinct characteristics of creep deformation.
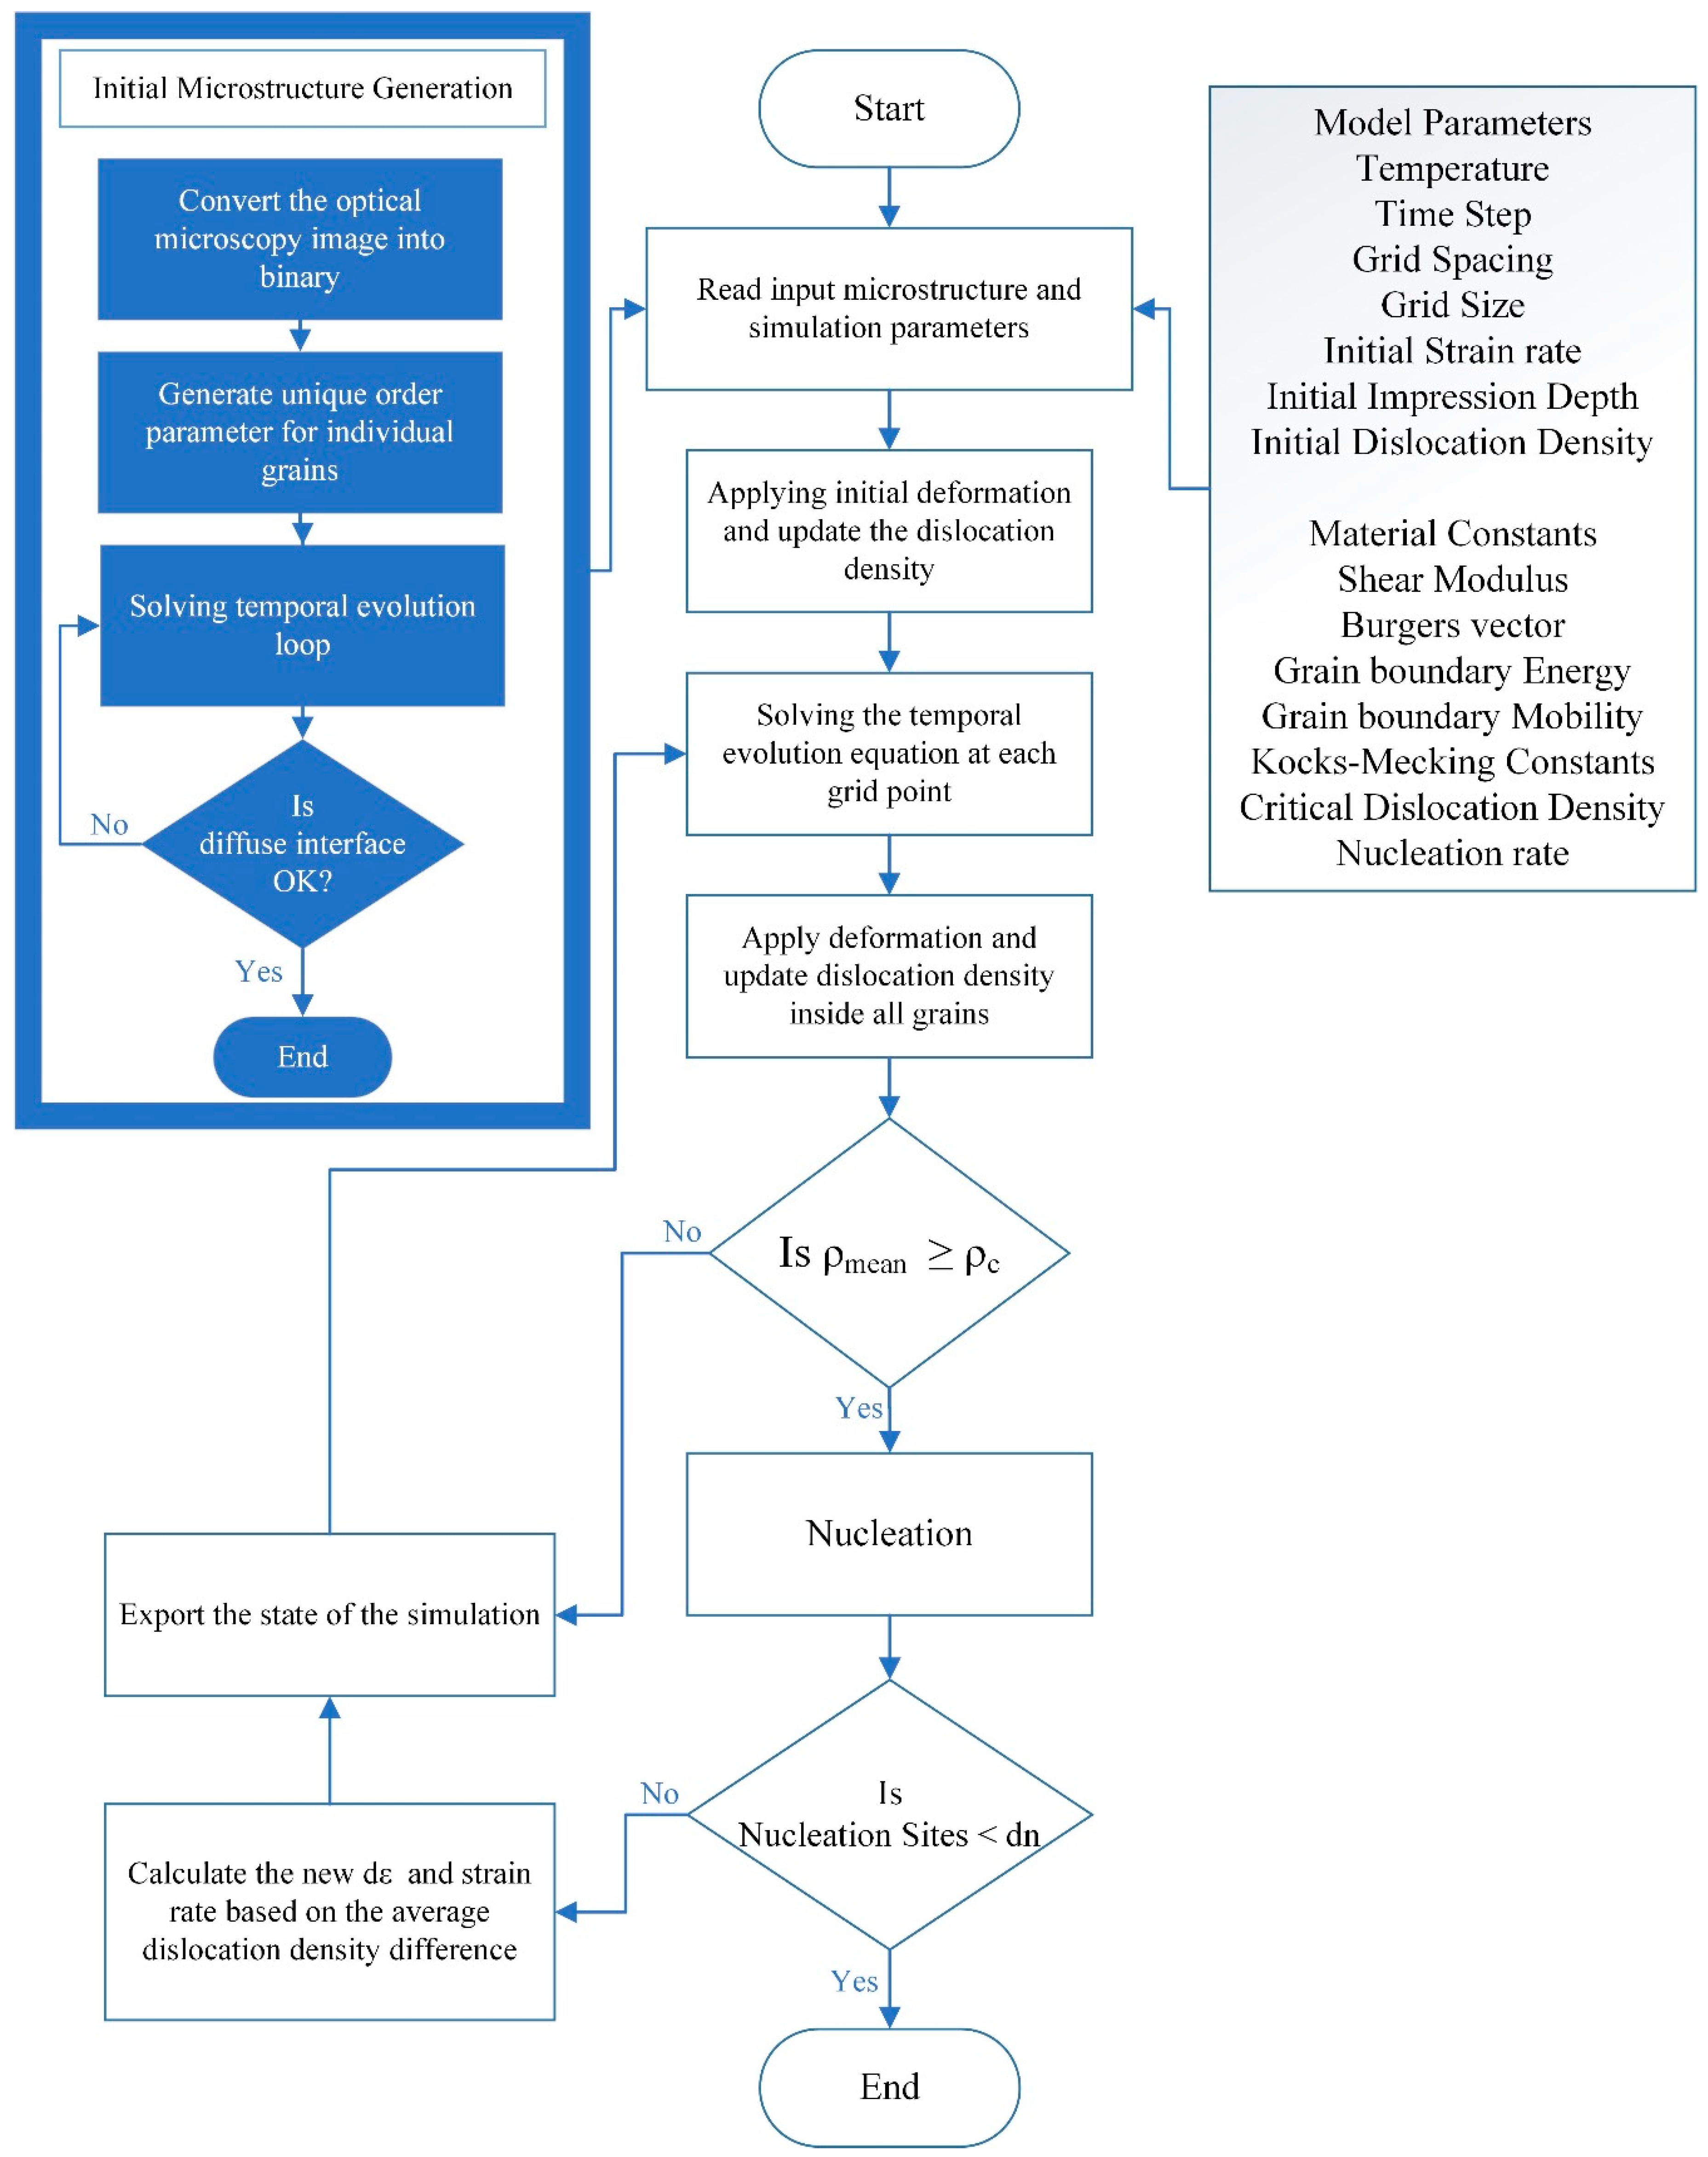
The primary objective of this investigation is to develop a two-dimensional phase-field model for the prediction of the steady-state creep rate in the AZ31 magnesium alloy, achieved through the simulation of microstructural evolution during discontinuous dynamic recrystallization (DDRX). To enhance the representativeness of the simulations, initial microstructures are generated from optical microscopy data, rather than relying on synthetic or limited-scale electron backscatter diffraction (EBSD) datasets. This approach facilitates larger-scale simulations, more closely approximating industrial processing conditions, while maintaining cost-effectiveness and accessibility. Furthermore, a novel and efficient nucleation methodology is implemented, eliminating the holding time required for nuclei order parameter adaptation within the system. Additionally, finite element analysis (FEA) is integrated to determine the initial instantaneous deformation. The phase-field model of discontinuous dynamic recrystallization (PF-DDRX) incorporates the Kocks–Mecking (KM) model [
36,
37] to describe the evolution of average dislocation density, accounting for work hardening and dynamic recovery (DRV) within the initial polycrystalline microstructure. Creep deformation is simulated by adjusting the finite difference grid size, maintaining a constant simulation area.
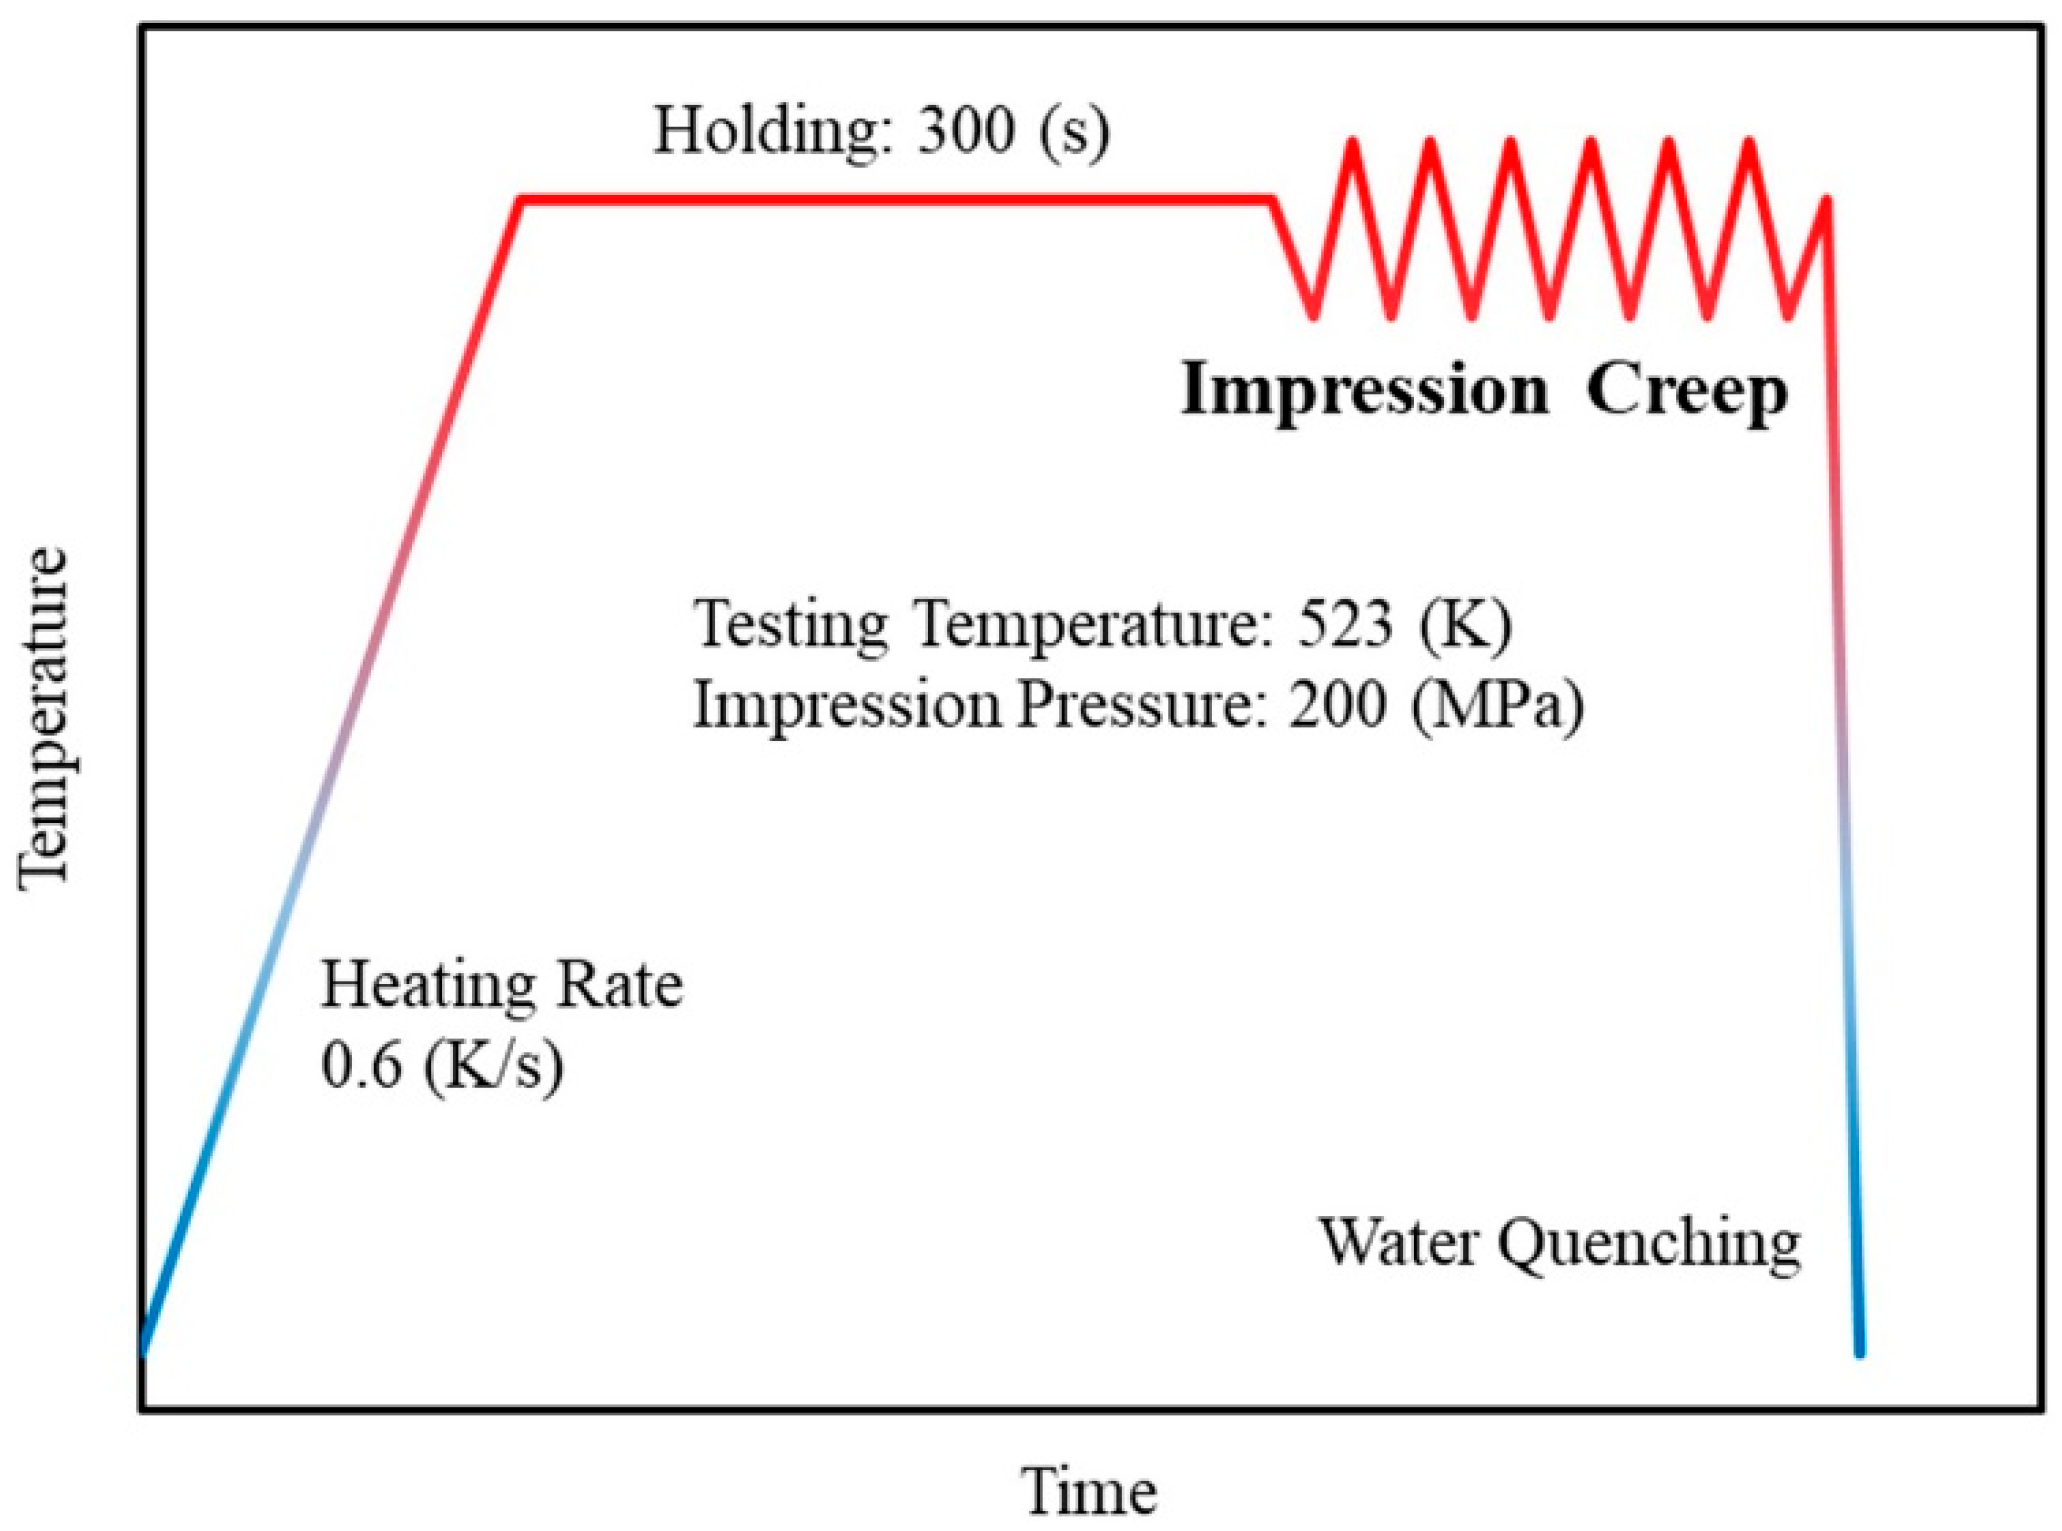
However, instead of the expensive conventional creep testing, the impression creep technique is used. Impression creep is a small specimen testing technique that has been employed for many years as an alternative to the costly and time-consuming conventional uniaxial tensile creep test. It is a modified indentation test wherein the conical or ball indenter is replaced by a cylindrical flat-bottomed one. This replacement provides constant stress and steady penetration velocity at a constant load [
38,
39].
Magnesium alloys, including AZ31, exhibit considerable potential for lightweighting applications in the automotive and aerospace sectors due to their superior specific strength and stiffness [
40]. However, a critical engineering bottleneck hindering their wider adoption, particularly in high-temperature environments such as automotive power-train components and certain aerospace structures, is their inherent limitation in creep resistance [
41,
42]. Overcoming this limitation necessitates accurate prediction of the steady-state creep rate, which is paramount for the design and long-term performance assessment of high-temperature structural components in numerous industrial applications, including power generation, aerospace, and chemical processing. In these environments, materials are subjected to sustained loads and elevated temperatures, leading to time-dependent deformation that can ultimately result in component failure. Precise creep rate prediction allows engineers to optimize material selection, establish safe operating limits, and predict component lifespan, thereby ensuring structural integrity, preventing catastrophic failures, and minimizing costly downtime. Reliable creep rate estimations are therefore essential for the development of robust and efficient high-temperature systems [
43].
To validate the predictive capabilities of the developed model, impression creep tests were conducted at varying impression depths, accompanied by microscopic characterization of the resulting microstructures. Comparative analysis of experimental and simulated results demonstrated a strong correlation, thereby substantiating the model’s robustness in accurately predicting recrystallization kinetics and microstructural evolution.
3. Multi-Phase-Field DDRX Model
To investigate grain structure evolution during discontinuous dynamic recrystallization (DDRX) under deformation, a phase-field model with multi-order parameters was utilized. The model’s total free energy, representing the inhomogeneous system, is a functional of the orientation field and its gradients. It includes contributions from bulk free energy (
), interfacial free energy (
) [
52], and stored energy field (
) due to plastic deformation from dislocation generation [
21,
23]. This total free energy is defined as follows:
where
is the volume of the system and
denotes the orientation field variables, also known as order parameters [
53], used to differentiate individual grains. Two distinct sets of order parameters are employed:
to describe the initial grains that deform during the simulation and
to represent the DRX nuclei.
denotes the total number of grains before discontinuous dynamic recrystallization, while
represents the number of DDRX nuclei, which increases as the nucleation process proceeds.
The bulk energy term establishes uniform potential wells within grain interiors, driving grain growth and the subsequent filling of the simulation domain. Conversely, the gradient energy density is localized to grain boundary regions [
54]. These energy contributions are mathematically represented as follows:
where
is the total number of order parameters,
is the energy density coefficient, and
is a positive constant set to 1.5 for symmetrical order parameter values across the grain boundaries. The gradient energy penalty,
, affects both the grain boundary energy and thickness [
55].
The driving force for DRX nuclei growth, arising from the high dislocation density in deformed grains, is provided by the stored plastic deformation energy density term. This term is approximated by the stress field of dislocations generated during plastic deformation, as follows [
56]:
where
is the magnitude of the burgers vector and
is the shear modulus. The dislocation density field,
, is determined at each point from the order parameters and their respective dislocation densities [
22] through the application of Moelans’ interpolation function [
57,
58]:
The dislocation density at each grid point, , is obtained from the dislocation evolution inside the microstructure during the plastic deformation process.
The microstructural evolution is governed by the time-dependent Ginzburg–Landau equation [
53], also referred to as the Allen–Cahn equation [
59], which is formulated using a non-conserved order parameter:
where
is the relaxation coefficient related to the interfacial mobility,
is time, and
is the spatial position of order parameters in the system. Utilizing the total free energy function, as defined in Equation (1), the evolution equation governing the system’s behavior is expressed as follows [
22]:
The spatiotemporal evolution of the dynamic microstructure is determined by numerically solving Equation (6), coupled with constitutive equations describing dislocation evolution and discontinuous dynamic recrystallization nucleation. A finite difference method is employed to obtain numerical solutions to this coupled system of kinetic equations. This method discretizes the continuous system onto a discrete lattice [
53]. The phase-field equations are similarly discretized, yielding a system of algebraic equations. The solution to these algebraic equations provides the phase-field variables at each lattice node. A common and computationally efficient approach utilizes a finite difference discretization with uniform lattice spacing, employing a central second-order spatial discretization and a forward Euler temporal discretization.
To reduce computational cost and resource consumption, active parameter tracking [
60,
61] is employed. The computational complexity arising from the numerous DRX nuclei within the system necessitates an efficient approach. To address this, a sparse data structure is implemented, exploiting the localized activity of phase-field variables. By restricting computations to the non-zero order parameters at each grid point, a significant reduction in computational effort is achieved. The determination of the active order parameters at each location is defined as follows:
where
is chosen to be a small positive threshold value, wherein only order parameters bigger than that are stored.
The following relations were derived for relating the simulation coefficients to the grain boundary energy,
, and grain boundary mobility,
, as follows [
54]:
where
is the grain boundary width, which is a model parameter.
The boundary mobility for high angle grain boundaries (HAGB),
, is defined as follows [
62]:
where
is the activation energy for the migration of a HAGB,
is the universal gas constant, and
is the pre-exponential factor. In view of the solute drag effect, the strain rate also has an effect on grain boundary mobility. Therefore, M can be improved as follows [
63].
The parameters used for the simulation are listed in
Table 2.
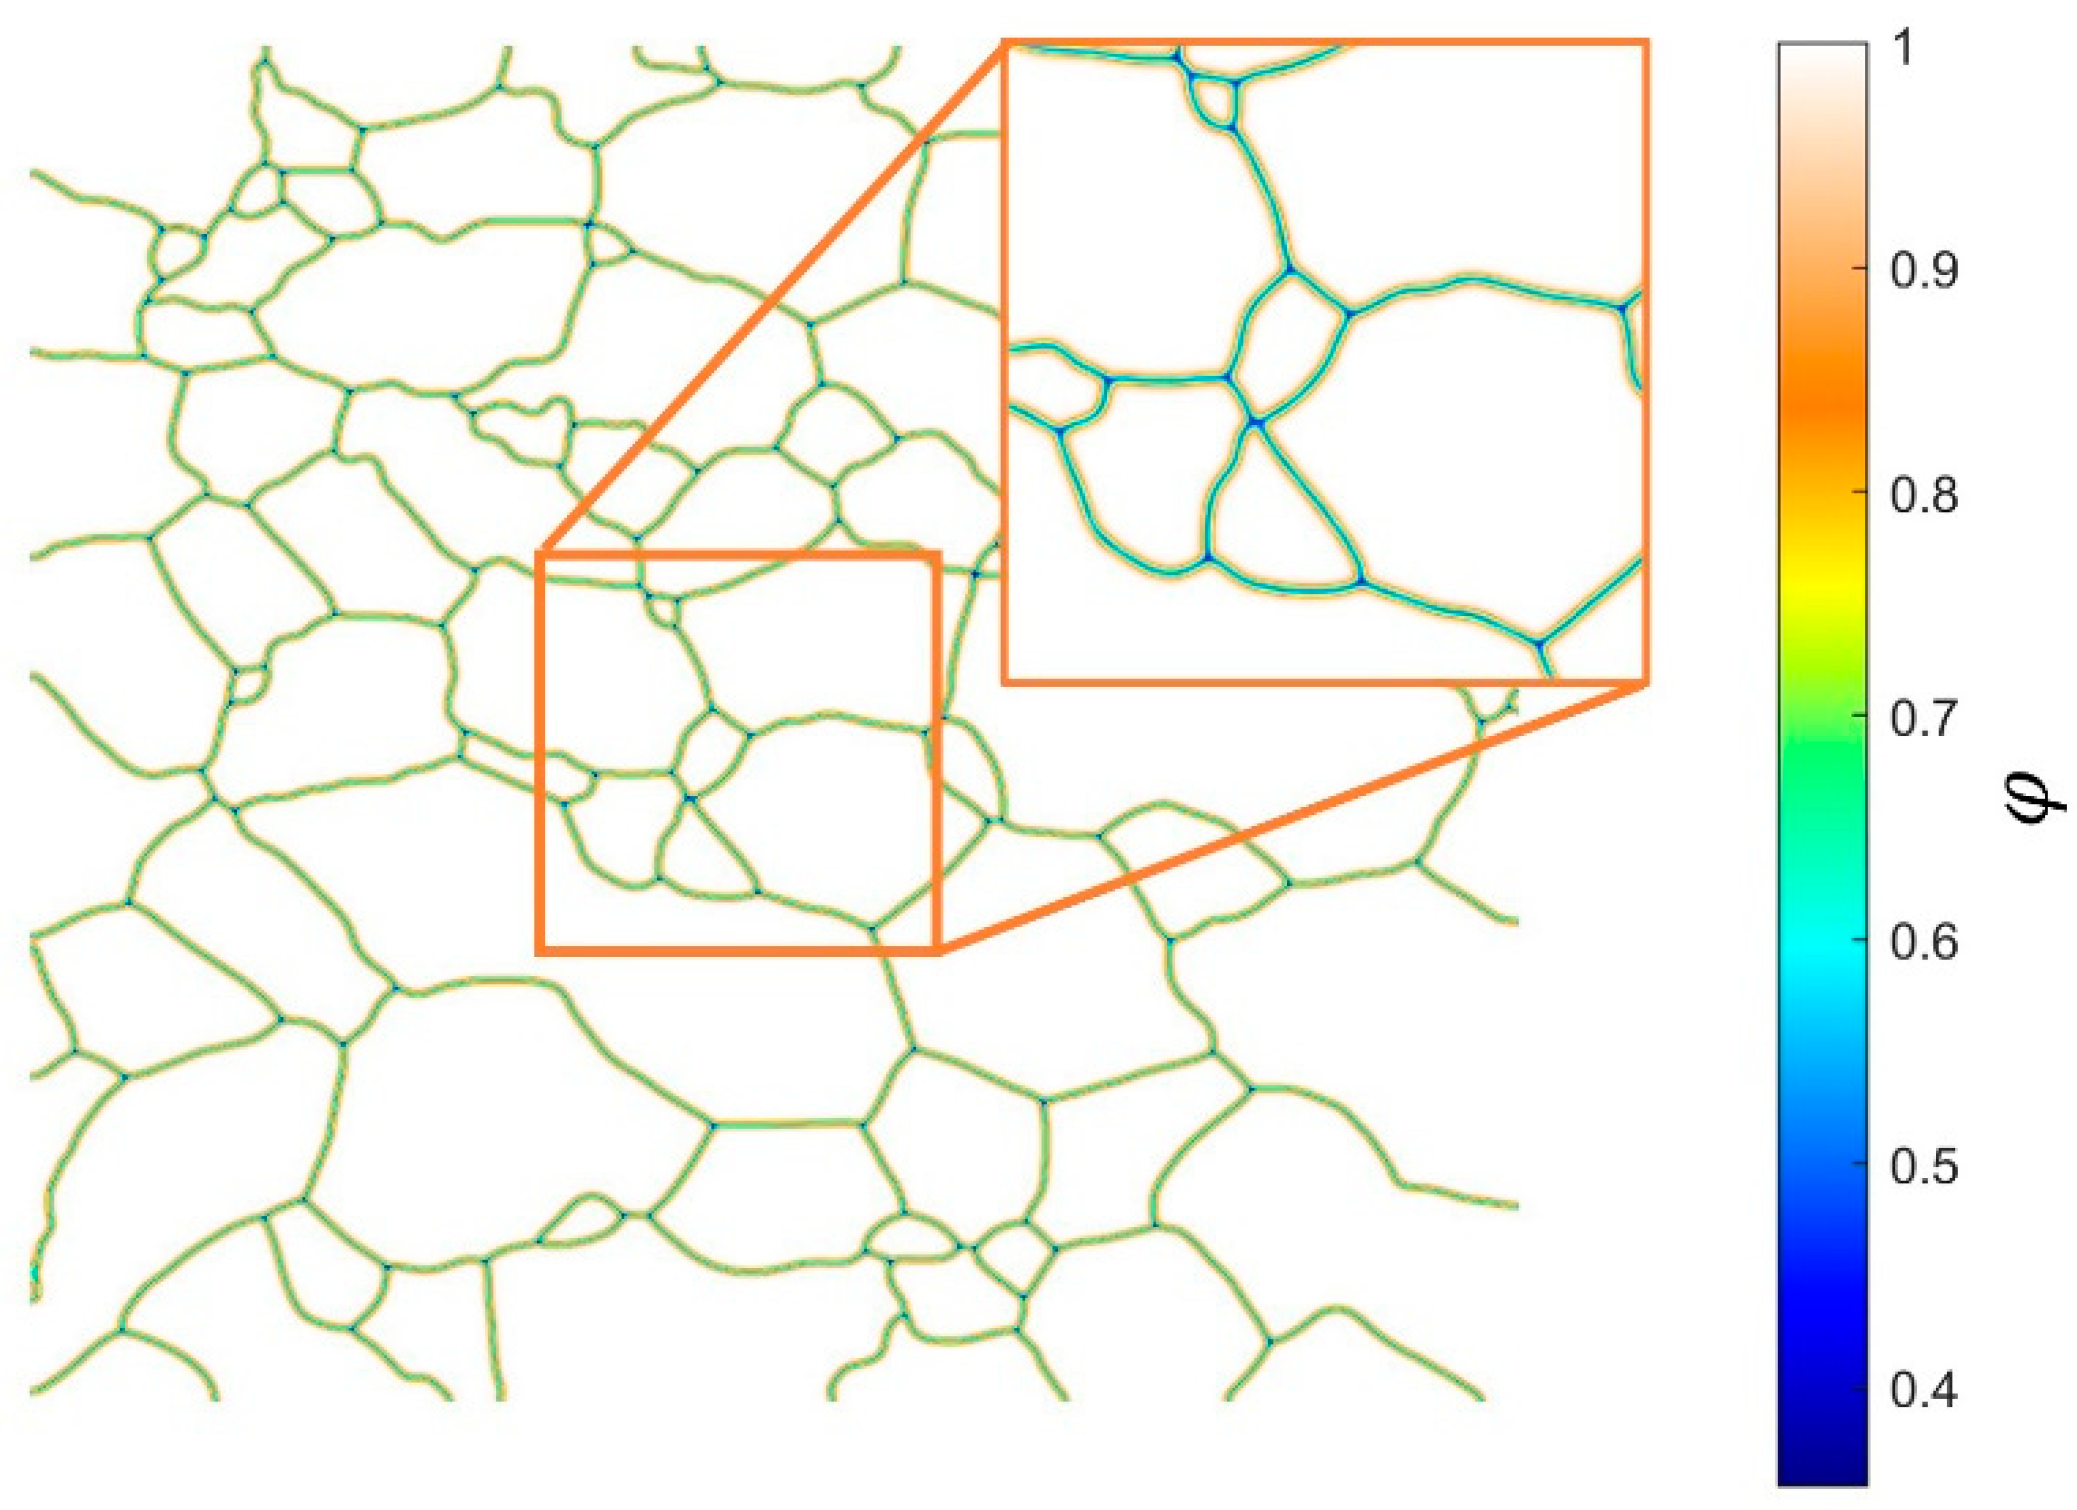
The phase-field method’s inherent diffuse interface necessitates the creation of a finite width at grain boundaries for initial microstructural representation in discontinuous dynamic recrystallization simulations. To prevent artificial changes in grain area during this process, which is especially critical for small grains, a fine grid resolution was implemented. This ensured that the diffuse interface’s characteristic length scale remained substantially smaller than the minimum grain size, thus avoiding numerical dissolution of small grains, which results from the interface width becoming comparable to or larger than grain dimensions. Consequently, to achieve this resolution, the grid size was set to 940 × 940, and the grid spacing, , considering the scale of the original microstructure and the phase-field grid, was set to 0.266 μm. To ensure sufficient numerical resolution across the diffuse interface, the grain boundary width, , was set to . The simulation time step, , was set to 5 × 10⁻² (s) to maintain numerical stability during simulation. The 2D microstructure evolution was computed at each grid point using finite difference, with an eighth-order scheme for spatial derivatives and the Euler forward method for time integration.
A unique order parameter field was generated for each grain, wherein regions occupied by grains were assigned a value of 1, and the remaining regions were assigned a value of 0. This binary field represented the initial sharp interface condition. To initiate diffuse interface formation, a brief temporal evolution of the order parameter field was performed according to Equation (6). This evolution was terminated upon the attainment of a symmetric diffuse interface profile, ensuring a consistent representation of grain boundaries throughout the microstructure.
Figure 4 illustrates the processed microstructure, visualized using order parameters and Equation (13) [
66]. As shown, the diffuse interfaces are accurately formed throughout the simulation domain.
3.1. Dislocation Density Evolution
During thermomechanical processing, the dislocation density evolves as a result of the dynamic interaction between work hardening (WH), dynamic recovery (DRV), and dynamic recrystallization (DRX) [
67,
68]. Initially, work hardening, driven by dislocation generation and entanglement, causes an increase in flow stress with strain. Subsequently, dynamic recovery, involving dislocation slip and climb [
69], counteracts the stress increase from work hardening. Finally, dynamic recrystallization commences when the dislocation density (
) reaches a critical value (
), determined by the following [
70]:
where
is the strain rate,
is the mean free path of the dislocation, and
is the linear energy of the dislocation. Dynamic recrystallization induces a substantial decrease in dislocation density within newly formed grains through dislocation annihilation, leading to flow stress softening [
71,
72]. Therefore, the observed flow stress behavior during hot deformation is a result of the competing mechanisms of work hardening (WH), DRV, and DRX. The Kocks–Mecking (KM) model provides a framework for describing the relationship between true strain (
) and local dislocation density (
) within a grain, incorporating dislocation accumulation from plastic deformation and dynamic recovery, as expressed by the following:
where
is the WH coefficient related to the accumulation of statistically stored dislocations (SSDs) [
73], and
is the dynamic recovery coefficient dependent on temperature (
) and strain rate [
16]. Within the framework of the proposed phase-field model, the local dislocation density (
) is treated as a spatially homogeneous variable within the confines of each individual grain constituting the microstructure. Consequently, the model does not incorporate any spatial heterogeneity or distribution of dislocation density within a single grain.
Due to the similarities in composition and processing conditions between the AZ31 Mg alloy used in this study and that investigated by Liu et al. [
51], all relevant material parameters, including the Kocks–Mecking coefficients, were adopted from their work. By utilizing the well-established parameters from Liu et al., the model benefits from validated data, thereby reducing uncertainties associated with material property estimation. This approach ensures that the mechanical responses of the AZ31 Mg alloy in the simulations align closely with experimentally observed behavior, enhancing the predictive accuracy of the study.
3.2. Nucleation Process
Experimental observations have shown that during uniform deformation, nucleation events preferentially initiate at triple junctions and grain boundaries, rather than within grain interiors [
56]. This preference is attributed to the energetically favorable nucleation sites provided by triple junctions, which possess a higher grain boundary area-to-volume ratio [
74,
75]. Therefore, these established assumptions are incorporated into the present investigation. Specifically, in this study, nuclei are placed exclusively at triple junctions and grain boundaries, with their spatial distribution randomized.
A circular nucleus, centered at the selected position, is introduced into the simulation domain. The initial order parameter within this nucleus is governed by the following function [
22]:
where
represents the radial distance from the center of the nucleus,
denotes the radius of the nucleus, and
is the grid spacing. Following the introduction of nuclei into the phase-field domain, an initial relaxation period is necessary to allow the microstructure to adjust to the newly formed recrystallized grains [
76,
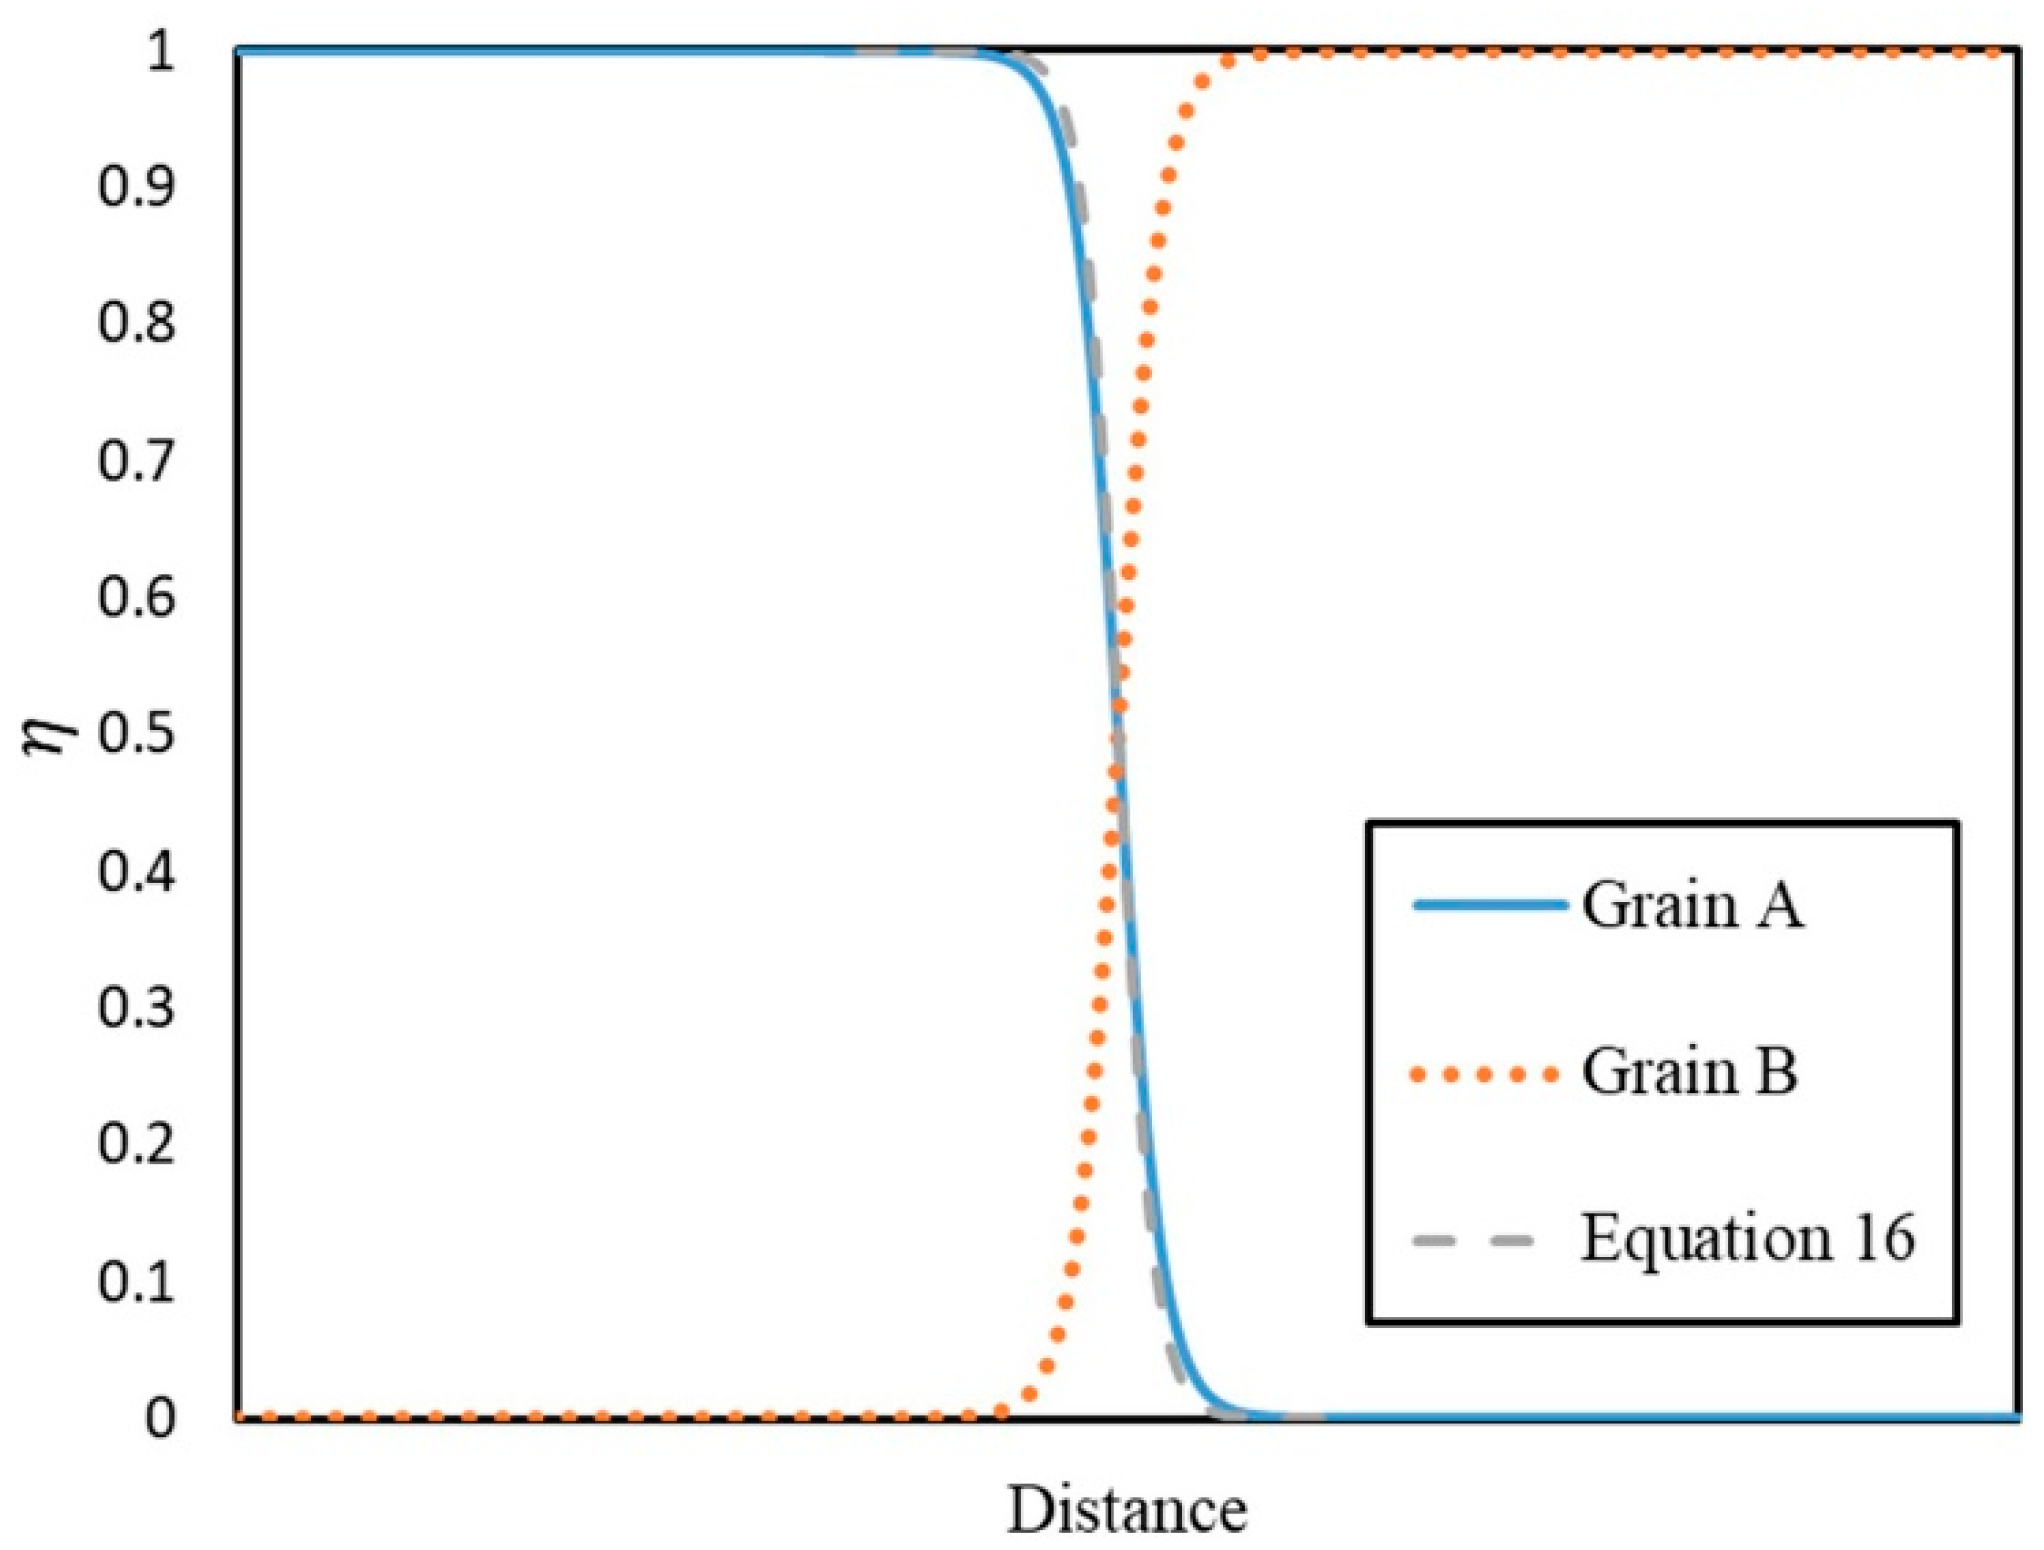
77]. This requirement addresses the potential for non-physical artifacts due to overlapping order parameters. It is noteworthy that this methodology is applicable to static recrystallization (SRX) simulations. In such simulations, the holding process, which precedes SRX, can be excluded from the computational domain, thereby not affecting the main microstructure evolution. However, in discontinuous dynamic recrystallization modeling, the coupled processes of deformation and nucleation necessitate a different approach. Incorporating a holding time for nuclei stabilization at each nucleation step is not only computationally inefficient but may also induce microstructural artifacts, such as anomalous grain growth. To circumvent this issue, a two-grain simulation was conducted utilizing identical material and model parameters as the primary simulation. The diffuse interface profile of the order parameters at the grain boundary was then extracted. Subsequently, a fitting procedure was performed on the
parameter to ensure the seed order parameter accurately replicated the simulated diffuse interface profile, as depicted in
Figure 5. Finally, during the primary simulation, upon insertion of each nucleus into the microstructure, the existing order parameters within the nucleus’s spatial domain were replaced with an exact copy (a replica, Grain B in
Figure 5) of the nucleus’s order parameter profile. This procedure effectively eliminated the requirement for a holding time to establish a symmetrical diffuse interface at grain boundaries.
Given the determination of nuclei position, size, and order parameter, the quantity of nuclei introduced per time increment into the dynamically evolving microstructure is directly proportional to the nucleation rate. Ding and Guo [
16] used the following equation for the nucleation rate:
where
is a material fitting coefficient. Nucleation is initiated at a discrete grid node when the local dislocation density (
) attains the critical value (
). Upon reaching this threshold, a stochastic nucleation event occurs, introducing a quantity of nuclei (
), as defined by Equation (18) [
78], into the microstructure at each discrete time step. The placement of these nuclei within the microstructure is randomized, simulating the inherent randomness of nucleation phenomena.
where
represents the nucleation number, and
representing the count of discrete grid points defining grain boundaries.
3.3. Grid Deformation Model
The deformation occurring during discontinuous dynamic recrystallization is approximated by altering the simulation grid dimensions. Takaki et al. [
27] employed the relationship between nominal strain and true strain to calculate the grid dimension in the y-direction and subsequently determined the grid dimension in the x-direction by maintaining a constant simulation area. While this method is suitable for simulating uniaxial compression straining, it is not directly applicable to modeling the impression creep process. To address this limitation, the results from an upper-bound analysis of the impression creep test [
44] are utilized. Specifically, the relationship between strain rate (
) and impression rate (
), derived assuming a constant friction factor of 0.35, is employed. Based on the value of this constant friction factor, the ratio of impression rate to strain rate (
) can be calculated and used to determine the impression depth,
, as follows.
The indenter displacement, representing the impression depth, is imposed on the simulation grid along the y-axis. To enforce volume conservation within the two-dimensional simulation domain during plastic deformation, the spatial discretization along the x-axis is dynamically scaled. This scaling factor is determined by the inverse ratio of the current y-dimension to the initial y-dimension, thereby ensuring that the total area of the computational domain remains invariant throughout the deformation process.
4. Dynamic Recrystallization During the Impression Creep Testing
Dynamic recrystallization is a critical phenomenon during high-temperature creep deformation, especially in materials with low stacking fault energy where recovery rates are slow, allowing sufficient stored energy to accumulate for new grain nucleation and growth. As evidenced in pure Pb, Ni, austenite [
79], and complex alloys like Nimonic 108 [
80,
81], DRX induces significant softening through dislocation annihilation within newly formed grains, leading to a rapid increase in creep rate [
82], often punctuated by oscillations [
34,
83]. This softening is manifested as a pronounced stress drop in stress–strain curves, reflecting the influence of DRX kinetics and the resulting microstructure on the rate at which recrystallization occurs. The process commences only when a critical strain, dependent on stress and temperature, is exceeded, with the critical strain generally decreasing with increasing stress and temperature. Impurities can also elevate the strain required for recrystallization [
82]. The interplay between the initial microstructure and the evolution of recrystallized grains, coupled with the formation and growth rate of strain-free grains under applied stress, dictates the creep behavior, highlighting the fundamental link between DRX dynamics and the macroscopic mechanical response of materials during high-temperature deformation.
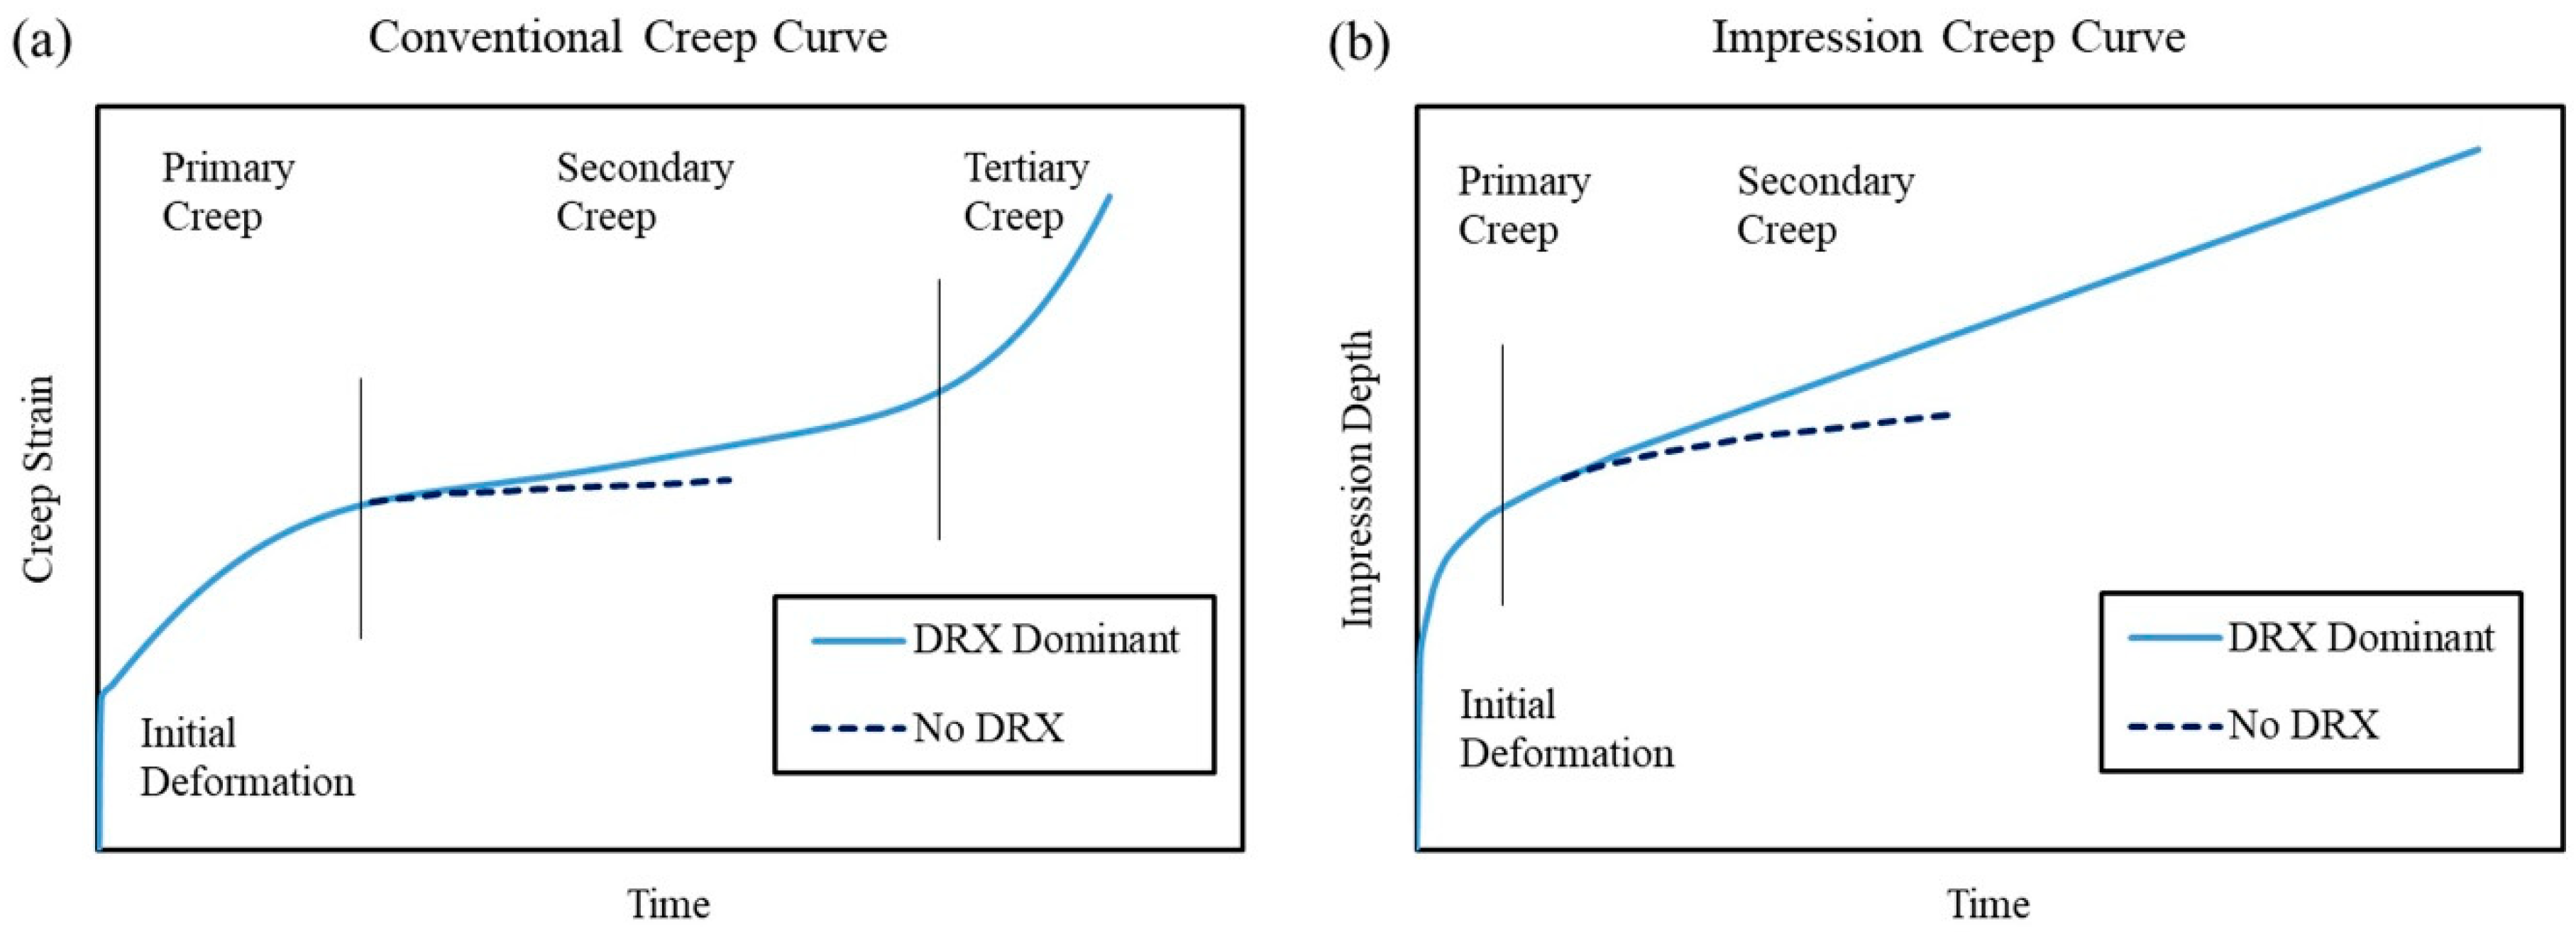
Figure 6a illustrates schematic creep curves depicting the influence of dynamic recrystallization during conventional tensile creep testing. In the absence of DRX, the expected stages of primary, secondary (steady-state), and tertiary creep are clearly observable. Conversely, the occurrence of DRX manifests as a discernible increase in creep rate immediately following the establishment of steady-state conditions [
82]. This behavior underscores the softening effect of DRX on the material’s creep resistance. Consistent with the observations in tensile creep, dynamic recrystallization is also seen in impression creep tests [
47,
84]. Analogously,
Figure 6b demonstrates a similar phenomenon in impression creep curves, where an elevated impression rate is observed post-DRX initiation. This increase in impression rate reflects the localized softening induced by DRX within the impression zone, mirroring the macroscopic creep rate enhancement observed in conventional creep testing.
Creep and hot deformation are distinct high-temperature deformation processes, primarily differentiated by their loading conditions and experimental methodologies. In creep, a constant external stress is applied, and the resulting strain is monitored as a function of time, characterizing the material’s time-dependent deformation behavior. Conversely, hot deformation involves imposing a constant strain rate, with the corresponding stress response being measured. This fundamental difference in loading protocols—constant stress in creep versus constant strain rate in hot deformation—manifests as divergent macroscopic mechanical responses and testing procedures. However, at the microscopic level, both processes exhibit fundamental similarities in dislocation activity and plastic deformation mechanisms. Thus, despite the macroscopic variations in loading, the underlying microscopic mechanisms of plastic deformation remain essentially consistent [
35]. Consequently, due to this shared microscopic basis, the Kocks–Mecking model, which effectively describes dislocation-mediated plastic deformation, can be applied to model both creep and hot deformation processes.
In conventional dynamic recrystallization modeling, such as for hot compression processes [
27], a constant strain rate is typically imposed. With a fixed time increment (
), the incremental strain (
) is calculated. Consequently, given the constancy of both strain rate and
,
remains constant throughout the simulation. Utilizing the Kocks–Mecking relationship (Equation (15)), the incremental dislocation density (
) is computed within the deformed grains at each time step. This iterative process continues until the dislocation density reaches the critical value (
), triggering the initiation of nucleation. The stress at each time step can then be determined using the following [
27]:
where
is a dislocation interaction coefficient of approximately 0.5. During nucleation, the dislocation density within the newly formed nuclei is substantially lower than that of the surrounding deformed grains, leading to a reduction in the average dislocation density (
) and consequently, a decrease in stress. However, in creep processes, stress is maintained constant, and the strain rate is an unknown variable, rendering the incremental strain (
) indeterminate. Nevertheless, during nucleation, the incremental dislocation density is determined by the difference between the average dislocation density of the microstructure prior to and following the nucleation event,
. By rearranging the Kocks–Mecking relationship, the incremental strain can be calculated as follows.
From the incremental strain data, the strain rate is calculated using the and . Subsequently, these derived parameters are transformed into impression depth and impression velocity via Equation (19), enabling the construction of the impression depth versus time curve. Nevertheless, the initial instantaneous deformation and strain rate prior to discontinuous dynamic recrystallization remain unknown.
The instantaneous deformation can be estimated using finite element analysis. In this study, the primary creep rate is neglected due to the limited extent of the primary creep region in impression creep processes [
39]. The initial steady-state creep rate (before DDRX) can be estimated based on existing literature, and the critical dislocation density for discontinuous dynamic recrystallization is assumed to be consistent with that used in hot compression simulations (Equation (14)). Utilizing this configuration, the dislocation density evolution can be predicted under a constant strain rate, employing a methodology analogous to compression deformation modeling, until the critical dislocation density is attained. Following the onset of nucleation, Equation (21) is used to calculate
and the strain rate. This process continues until complete microstructural recrystallization is achieved. Consequently, the steady-state creep rate in the impression creep process can be predicted.
6. Results and Discussion
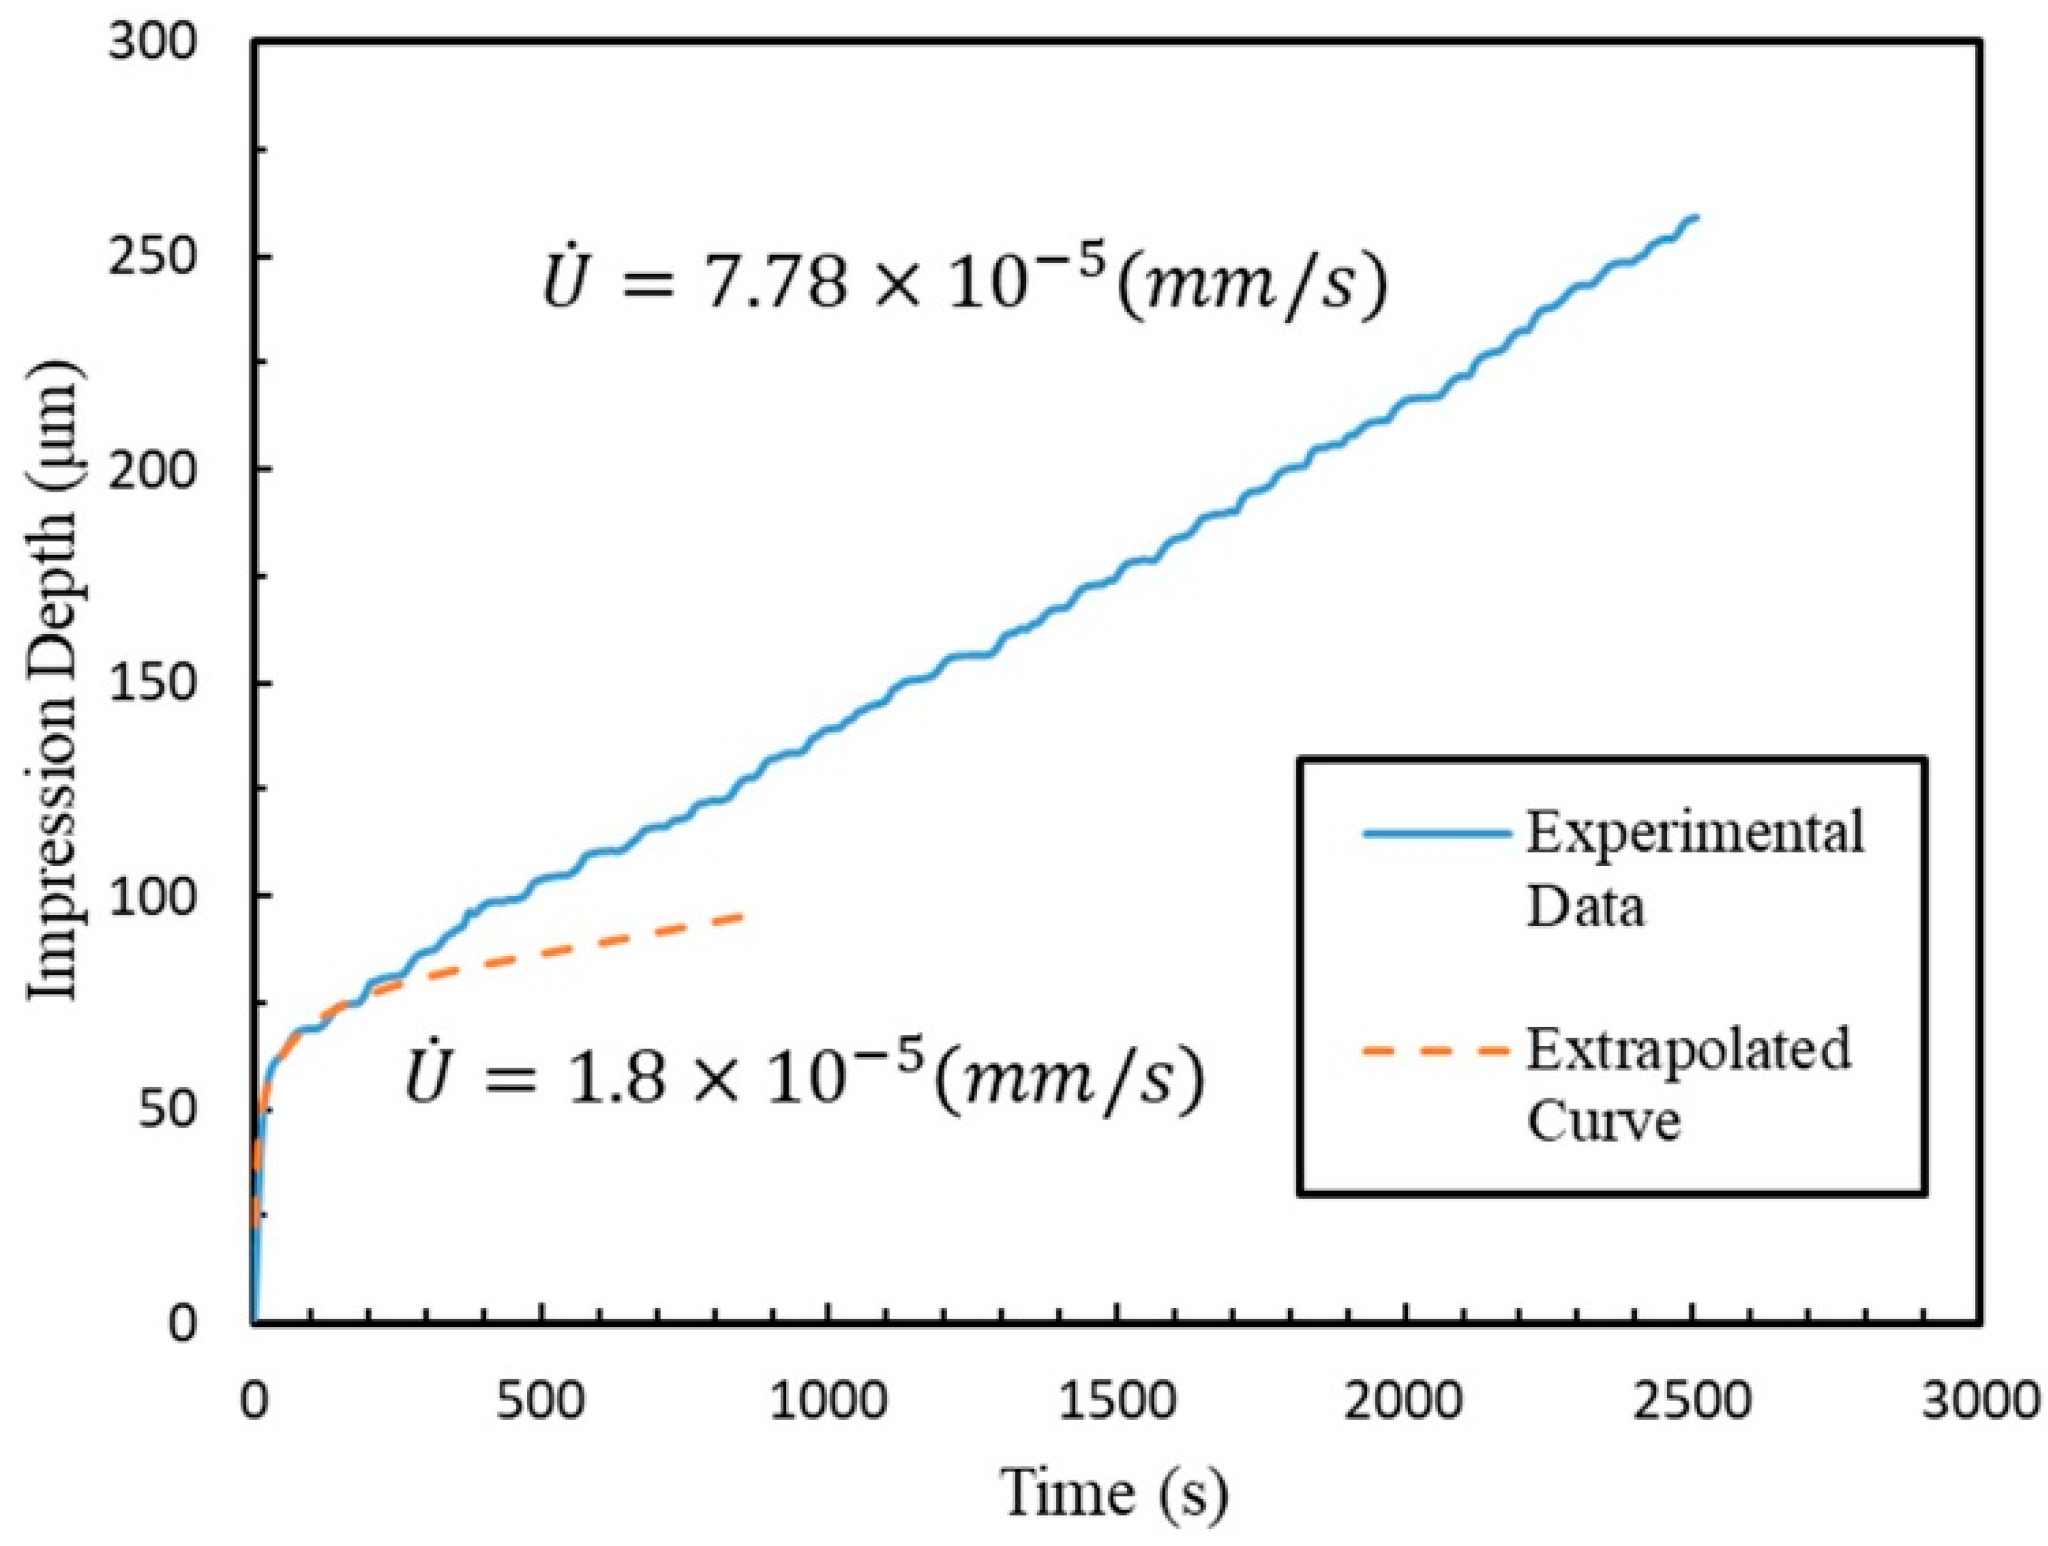
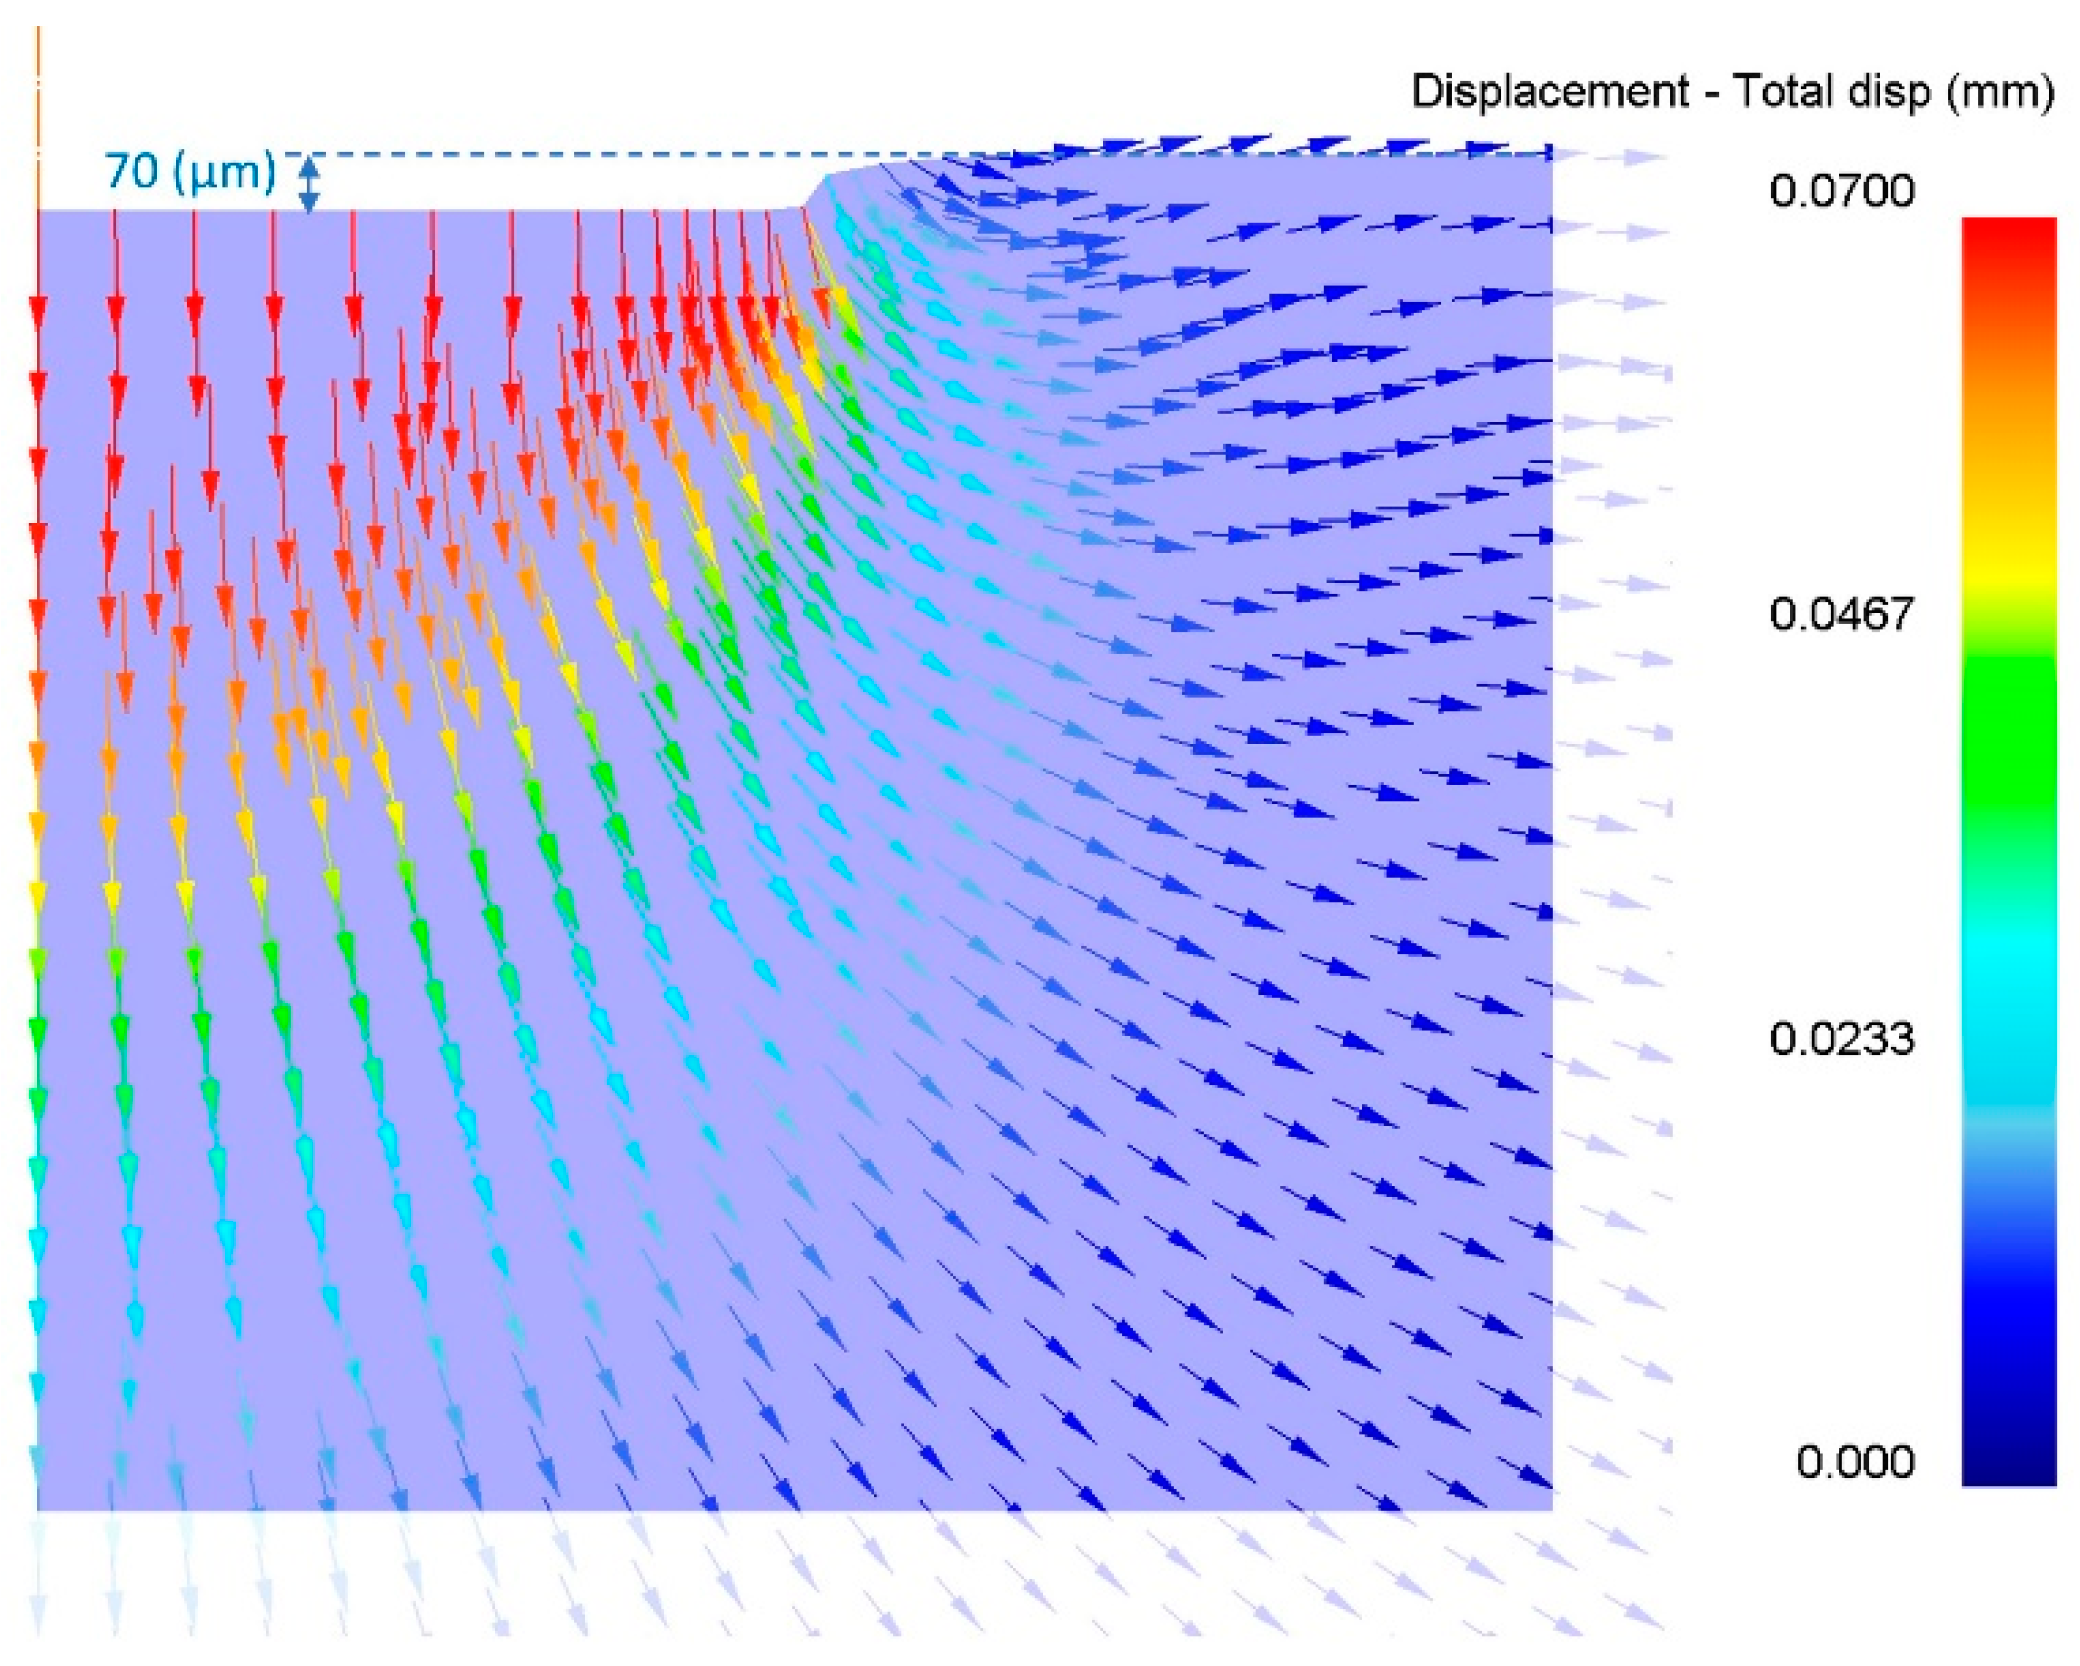
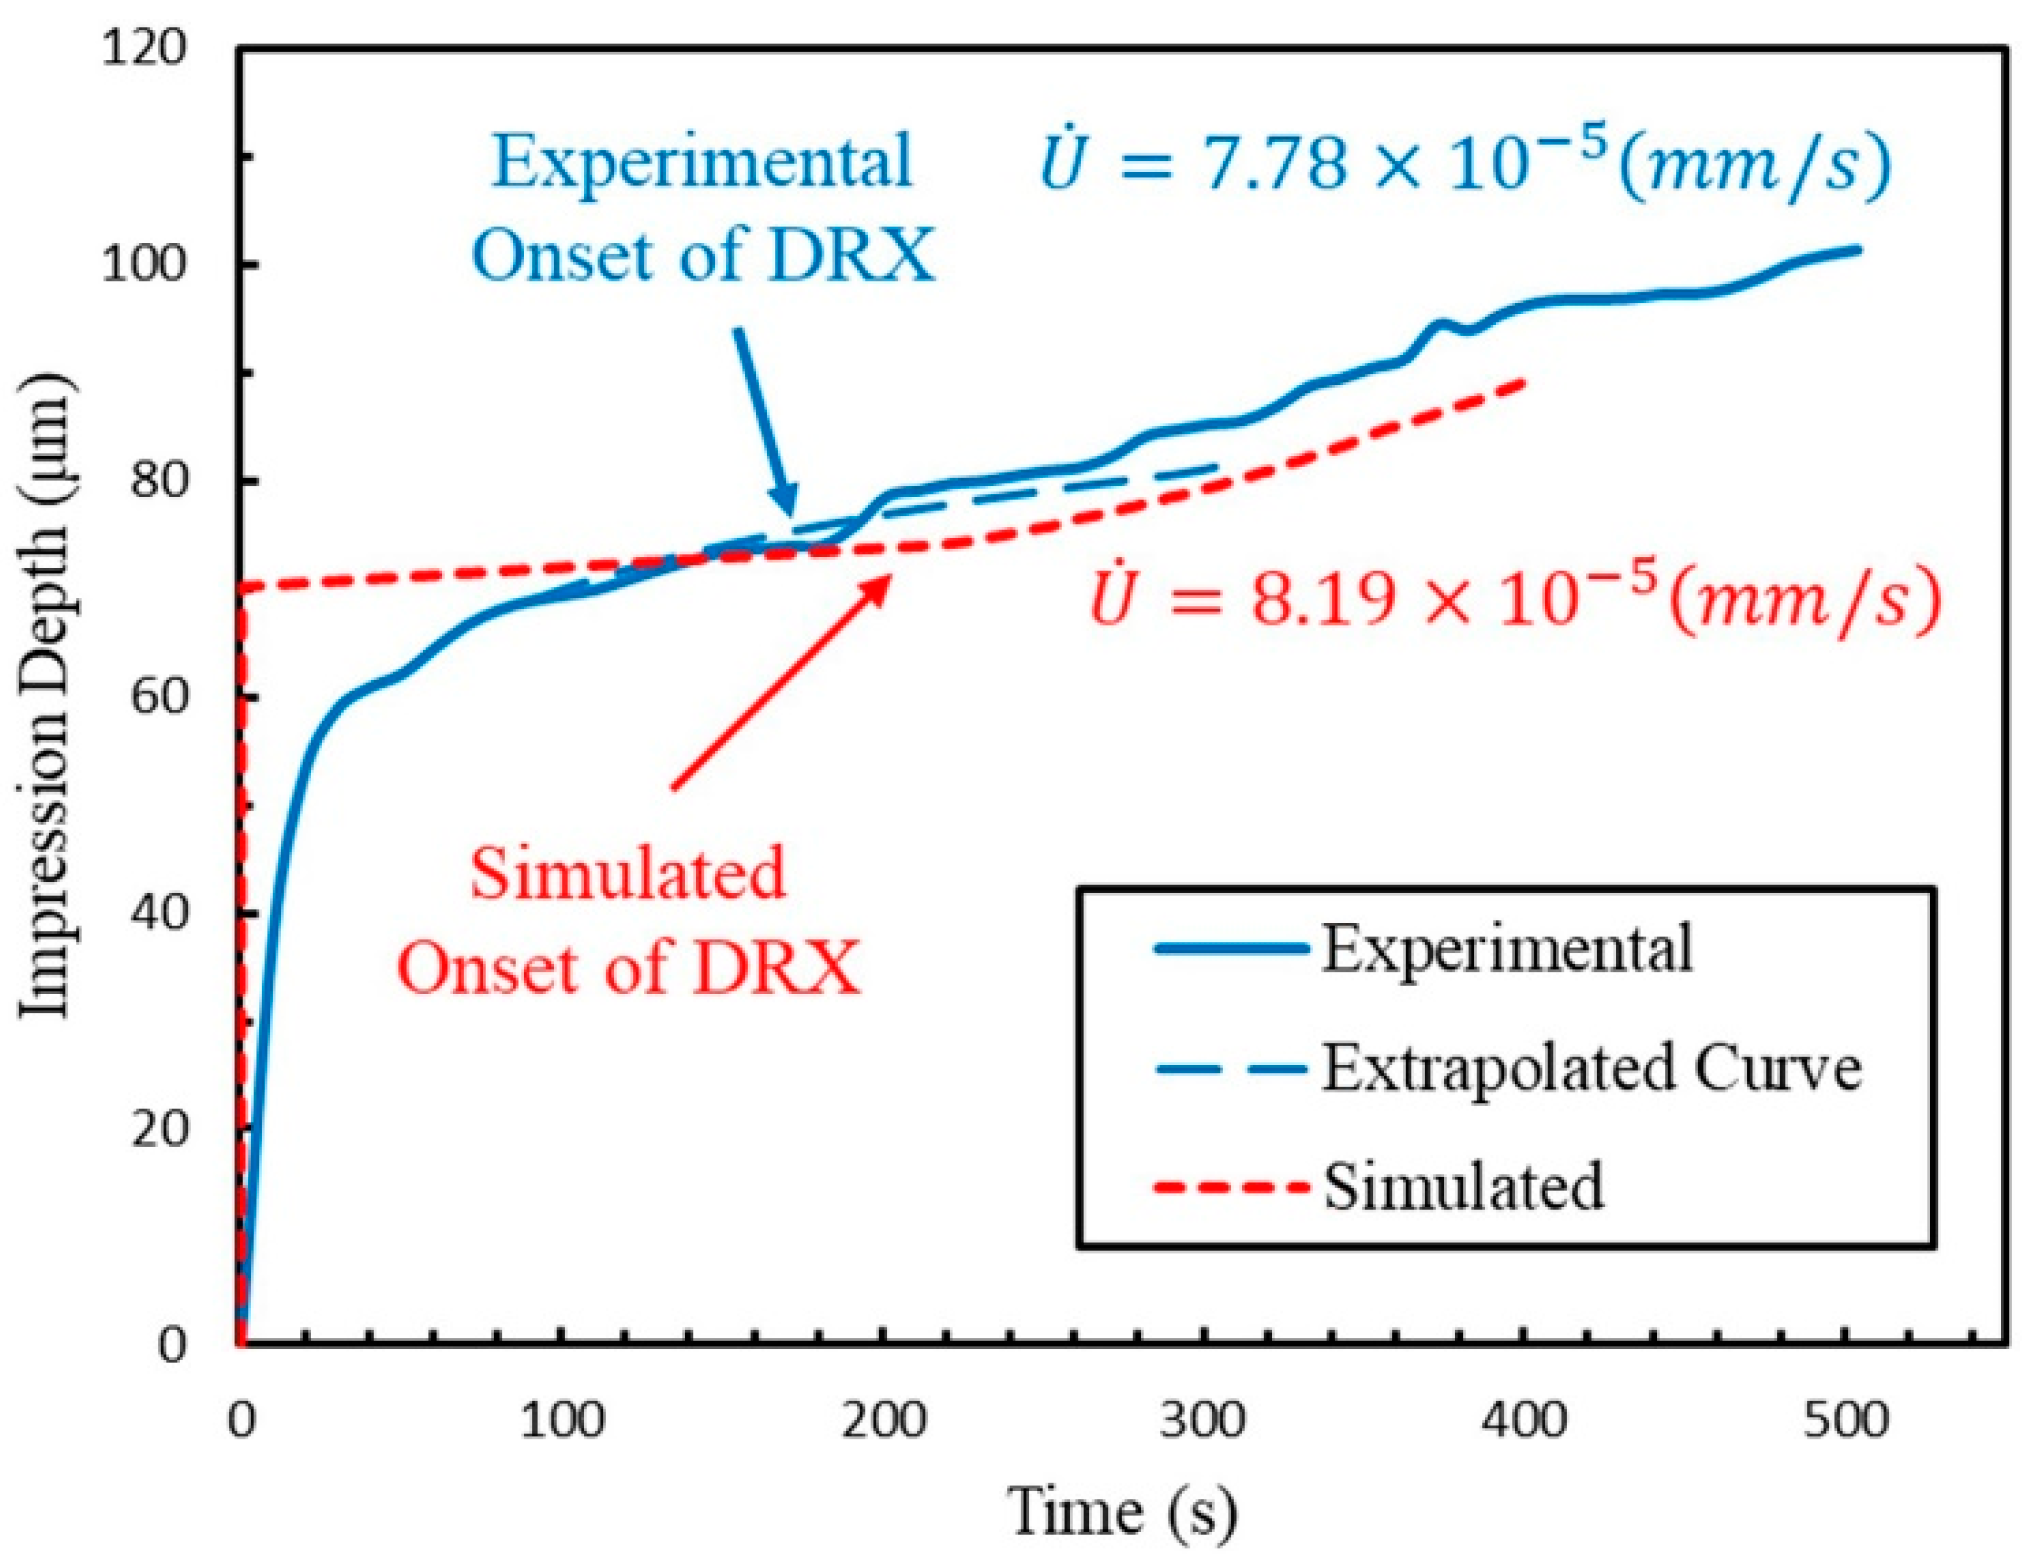
Figure 8 presents the experimental impression creep curve for the AZ31 magnesium alloy, revealing an instantaneous deformation depth of approximately 63 μm at the test’s onset. Finite element analysis (FEA), employing material properties and boundary conditions consistent with the experimental setup (250 °C and a constant impression pressure of 200 MPa), yielded an instantaneous impression depth of approximately 70 µm, as illustrated in
Figure 9. While precise measurement of the instantaneous deformation depth is challenging in experimental investigations due to factors such as thermal expansion and the micrometer-scale nature of the deformation, the FEA result demonstrates reasonable agreement with the experimental data. In accordance with
Section 3.3, the FEA-derived impression depth was first transformed into strain via Equation (19). Subsequently, this calculated strain, together with
, was applied to Equation (15) to compute the initial average dislocation density,
, within the grains. The instantaneous impression depth and the calculated average dislocation density were then applied as the initial conditions for the microstructure in the main temporal evolution loop of the phase-field simulation.
Figure 8 illustrates that extrapolating a fitted curve from the initial stage of the experimental data, where recrystallization is absent, to later times yields a slope (impression rate) lower than that observed in the steady-state region. This discrepancy in slope is attributed to softening induced by discontinuous dynamic recrystallization (DDRX). The fitted and experimental curves exhibit perfect overlap until approximately 190 s, marking the onset of DDRX.
Using the conversion factors from the upper-bound analysis of the deformation zone in the impression creep test [
44], the impression pressure and the impression rate can be converted to the equivalent tensile creep stress and strain rate, respectively, according to
where
and
are the correlation factors for the stress and strain rate, respectively. The stress conversion factor for the AZ31 alloy was calculated to be 0.26, and the strain rate conversion factor was calculated using a suitable velocity field to be 2.22 according to the instructions detailed in [
44]. The impression pressure was converted to stress using Equation (22). Subsequently, the steady-state creep strain rate was determined via the Friedel model [
41,
85], yielding a value of
. This strain rate was then converted to a value of
using Equation (23) and the declared correlation factor. This calculated strain rate is in close agreement with the fitted impression rate observed in
Figure 8. To better optimize the computation of grid size variations during creep deformation, the calculated strain rate value was rounded to
and adopted as the initial strain rate for the simulation.
Utilizing the established initial simulation configuration, the temporal evolution of deformation in the AZ31 magnesium alloy during impression creep was simulated.
Figure 10 presents a comparison between the impression depth versus time curves predicted by the PF-DDRX model and those obtained experimentally. The results indicate that the steady-state impression rate is accurately predicted by the phase-field model. Specifically, the predicted value (
) demonstrates close agreement (about 5% error) with the experimental steady-state impression rate (
). Furthermore, the predicted onset of DDRX at 223 s aligns reasonably with the experimental observation of 190 s. These findings confirm a strong correlation between the predicted initial impression depth derived from finite element modeling, the calculated initial impression rate, and empirical observations. Distinctly, the critical indentation depth for the initiation of discontinuous dynamic recrystallization can be identified as the point at which the average dislocation density within the microstructure attains the critical dislocation density, as determined by Equation (14), exhibiting good agreement with experimental observations (73 μm predicted vs. 75 μm measured). The observed deviation between the simulated and experimental creep curves during the initial transient period (t < 100 s) is attributed to the model’s inherent assumption of negligible primary creep, which is typically not critical in creep design. The simulation initiates with an idealized, pre-established deformation volume and an instantaneous attainment of a constant creep strain rate, contrasting with the gradual microstructural development characteristic of experimental primary creep. This simplification was implemented to specifically investigate the steady-state creep regime, which constitutes the primary objective of this study. Consequently, while the initial kinetics are not fully captured, this assumption is not anticipated to significantly compromise the accuracy of the predicted steady-state creep rate and the underlying microstructural evolution mechanisms.
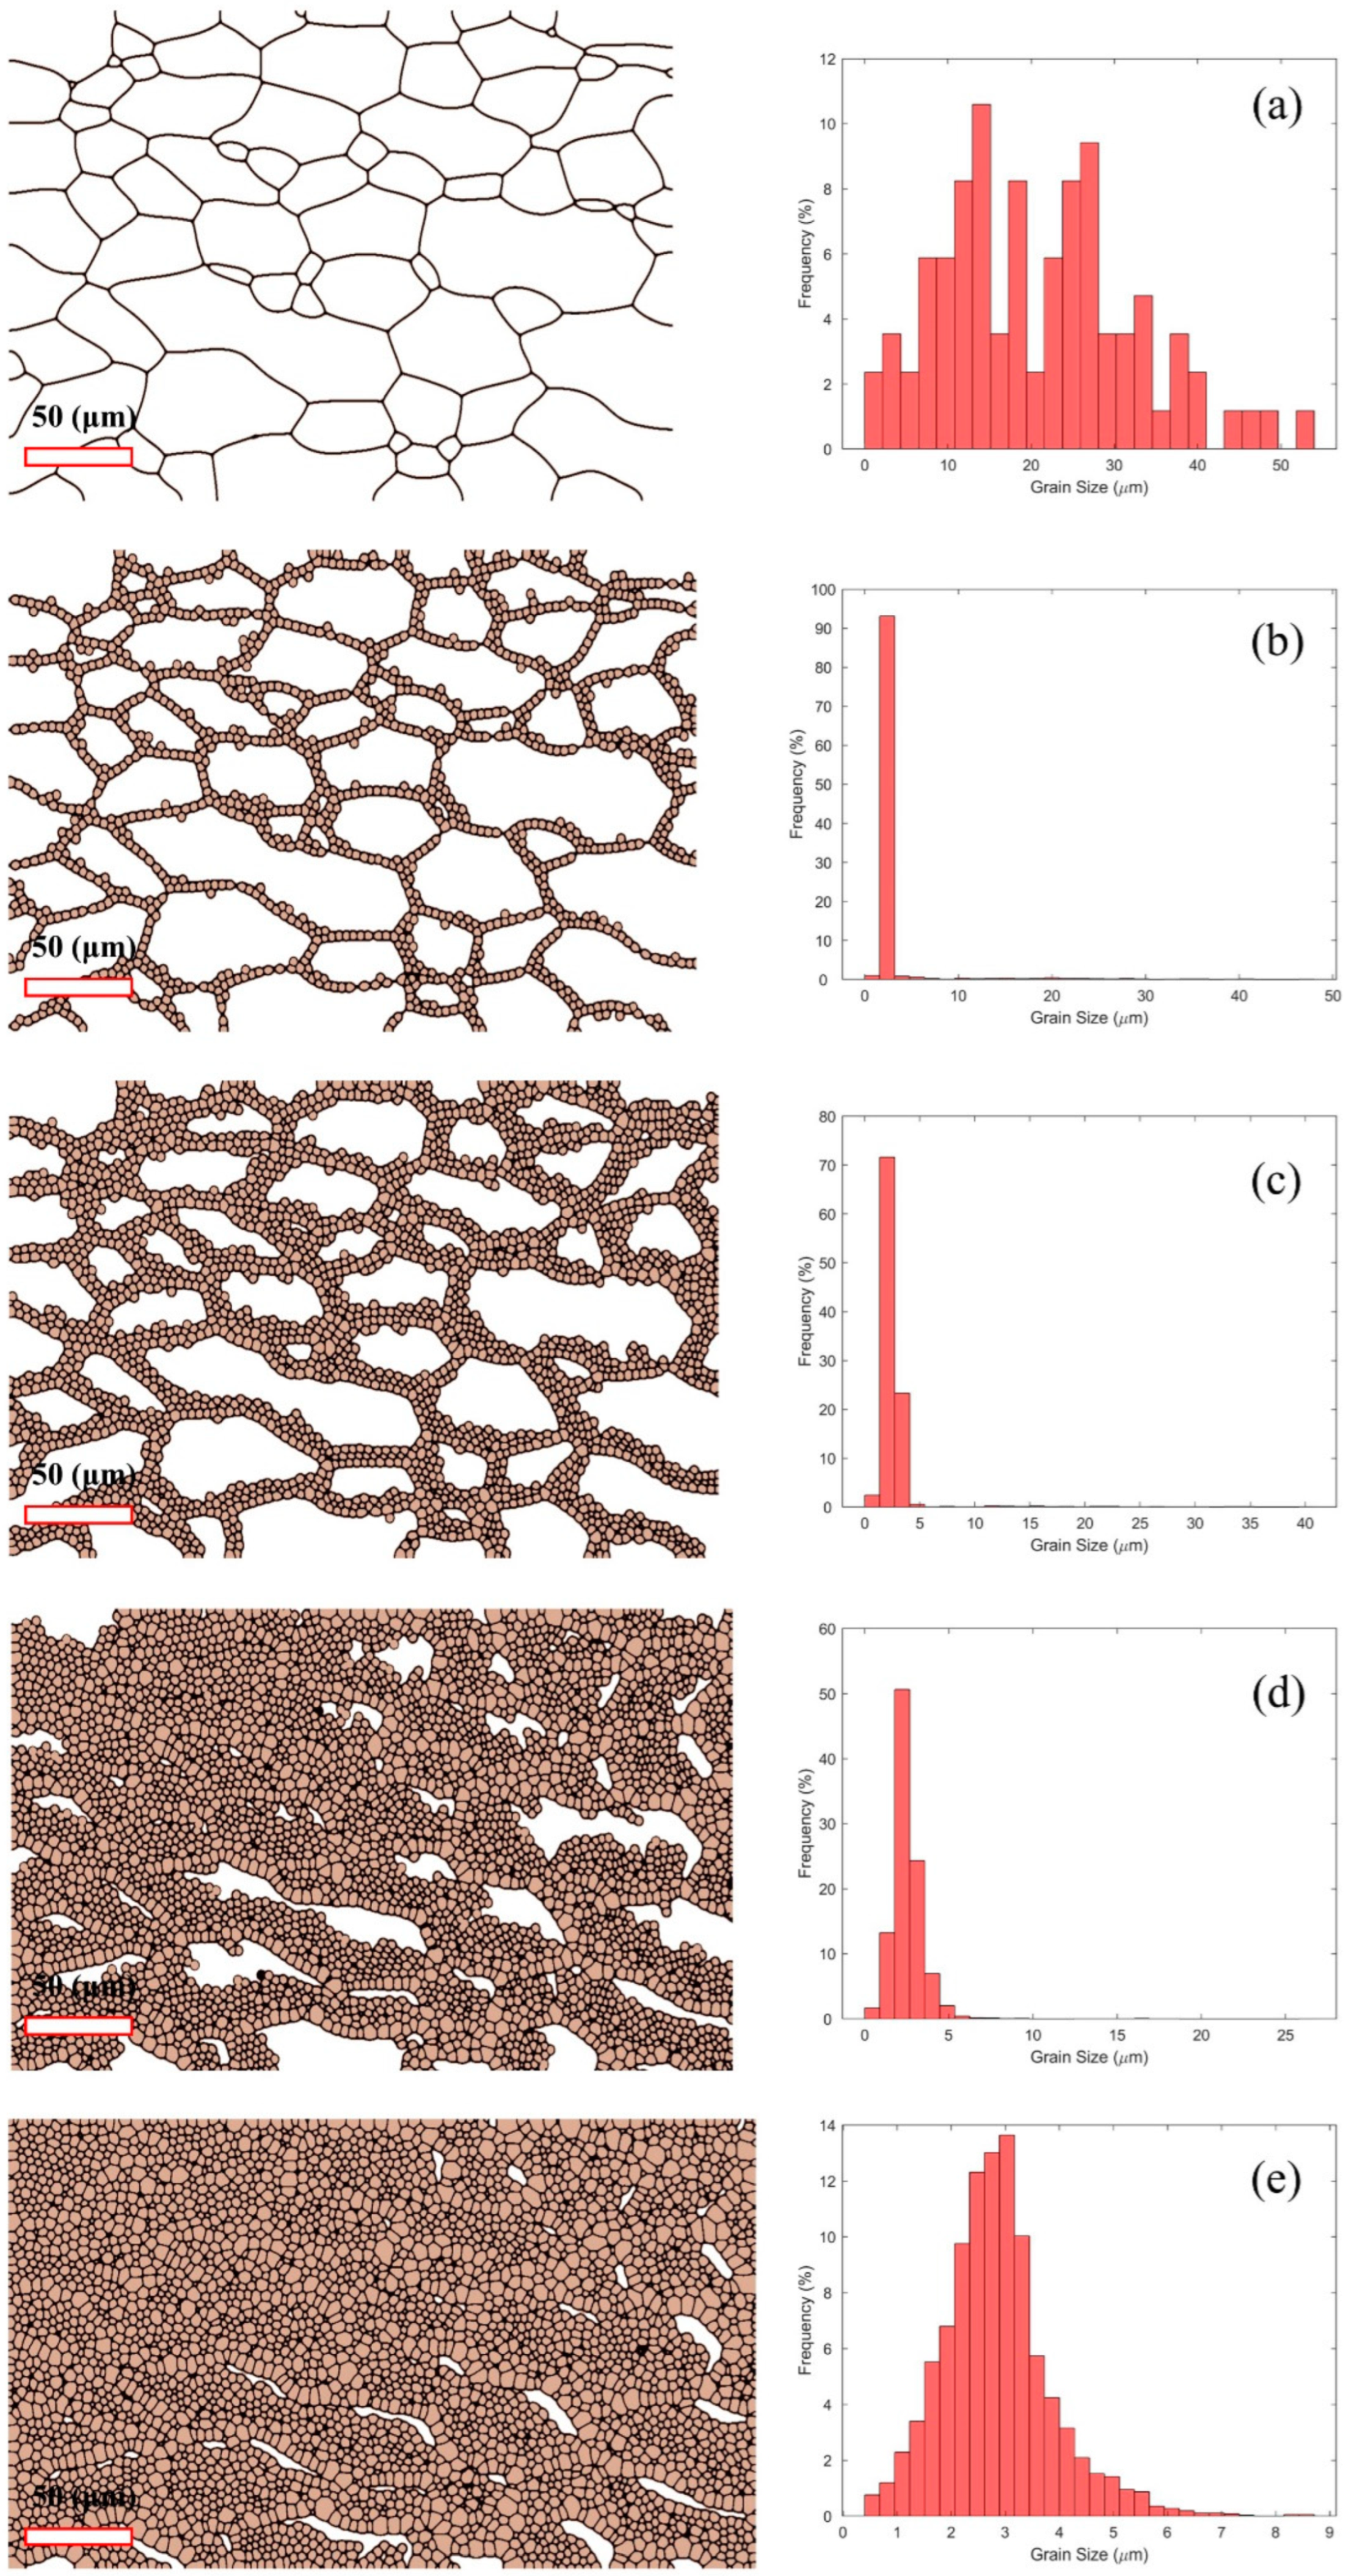
Figure 11 illustrates the microstructural evolution during impression creep at 250 °C and 200 MPa, demonstrating the progression of discontinuous dynamic recrystallization with increasing indentation depth. In this figure, white regions represent initial grains, colored regions represent recrystallized grains, and lines delineate grain boundaries.
Figure 11a depicts the initial microstructure prior to the onset of nucleation, where the dislocation density within the grains reaches the critical value.
Figure 11b–e present the simulated microstructural evolution of discontinuous dynamic recrystallization as it occurs within the impression creep process.
The left column of
Figure 11 showcases the evolution of the microstructure, while the right column presents the corresponding grain size distribution histograms. Initially, nuclei formation commences at the original grain boundaries (
Figure 11b). Subsequently, new grains nucleate at the boundaries of previously recrystallized grains, leading to the formation of necklace-like structures characteristic of DRX-induced grain refinement (
Figure 11c–e).
Analysis of the corresponding grain size distribution histograms (right column of
Figure 11) reveals a progressive shift towards smaller grain sizes as DRX progresses. Initially, the grain size distribution exhibits a relatively broad range with a peak in the larger grain size region (
Figure 11a). As DRX initiates and new grains form at the original grain boundaries (
Figure 11b), a slight shift towards smaller grain sizes is observed. With further strain accumulation and the nucleation of new grains at the boundaries of previously recrystallized grains (
Figure 11c–e), the grain size distribution becomes increasingly skewed towards smaller grain sizes, indicating significant grain refinement. This refinement is consistent with the observed necklace-like structures and the gradual expansion of DRX grains into the original grains, as depicted in the left column of
Figure 11. The observed refinement of the average grain size during impression creep is a direct consequence of the discontinuous dynamic recrystallization (DDRX) mechanism, wherein the continuous nucleation of fine, strain-free grains leads to a progressive decrease in the overall grain size of the microstructure. The microstructural evolution observed in the left column of
Figure 11, which illustrates the formation of the necklace-like structures of recrystallized grains and their subsequent encroachment upon the original, deformed grains, supports this as well.
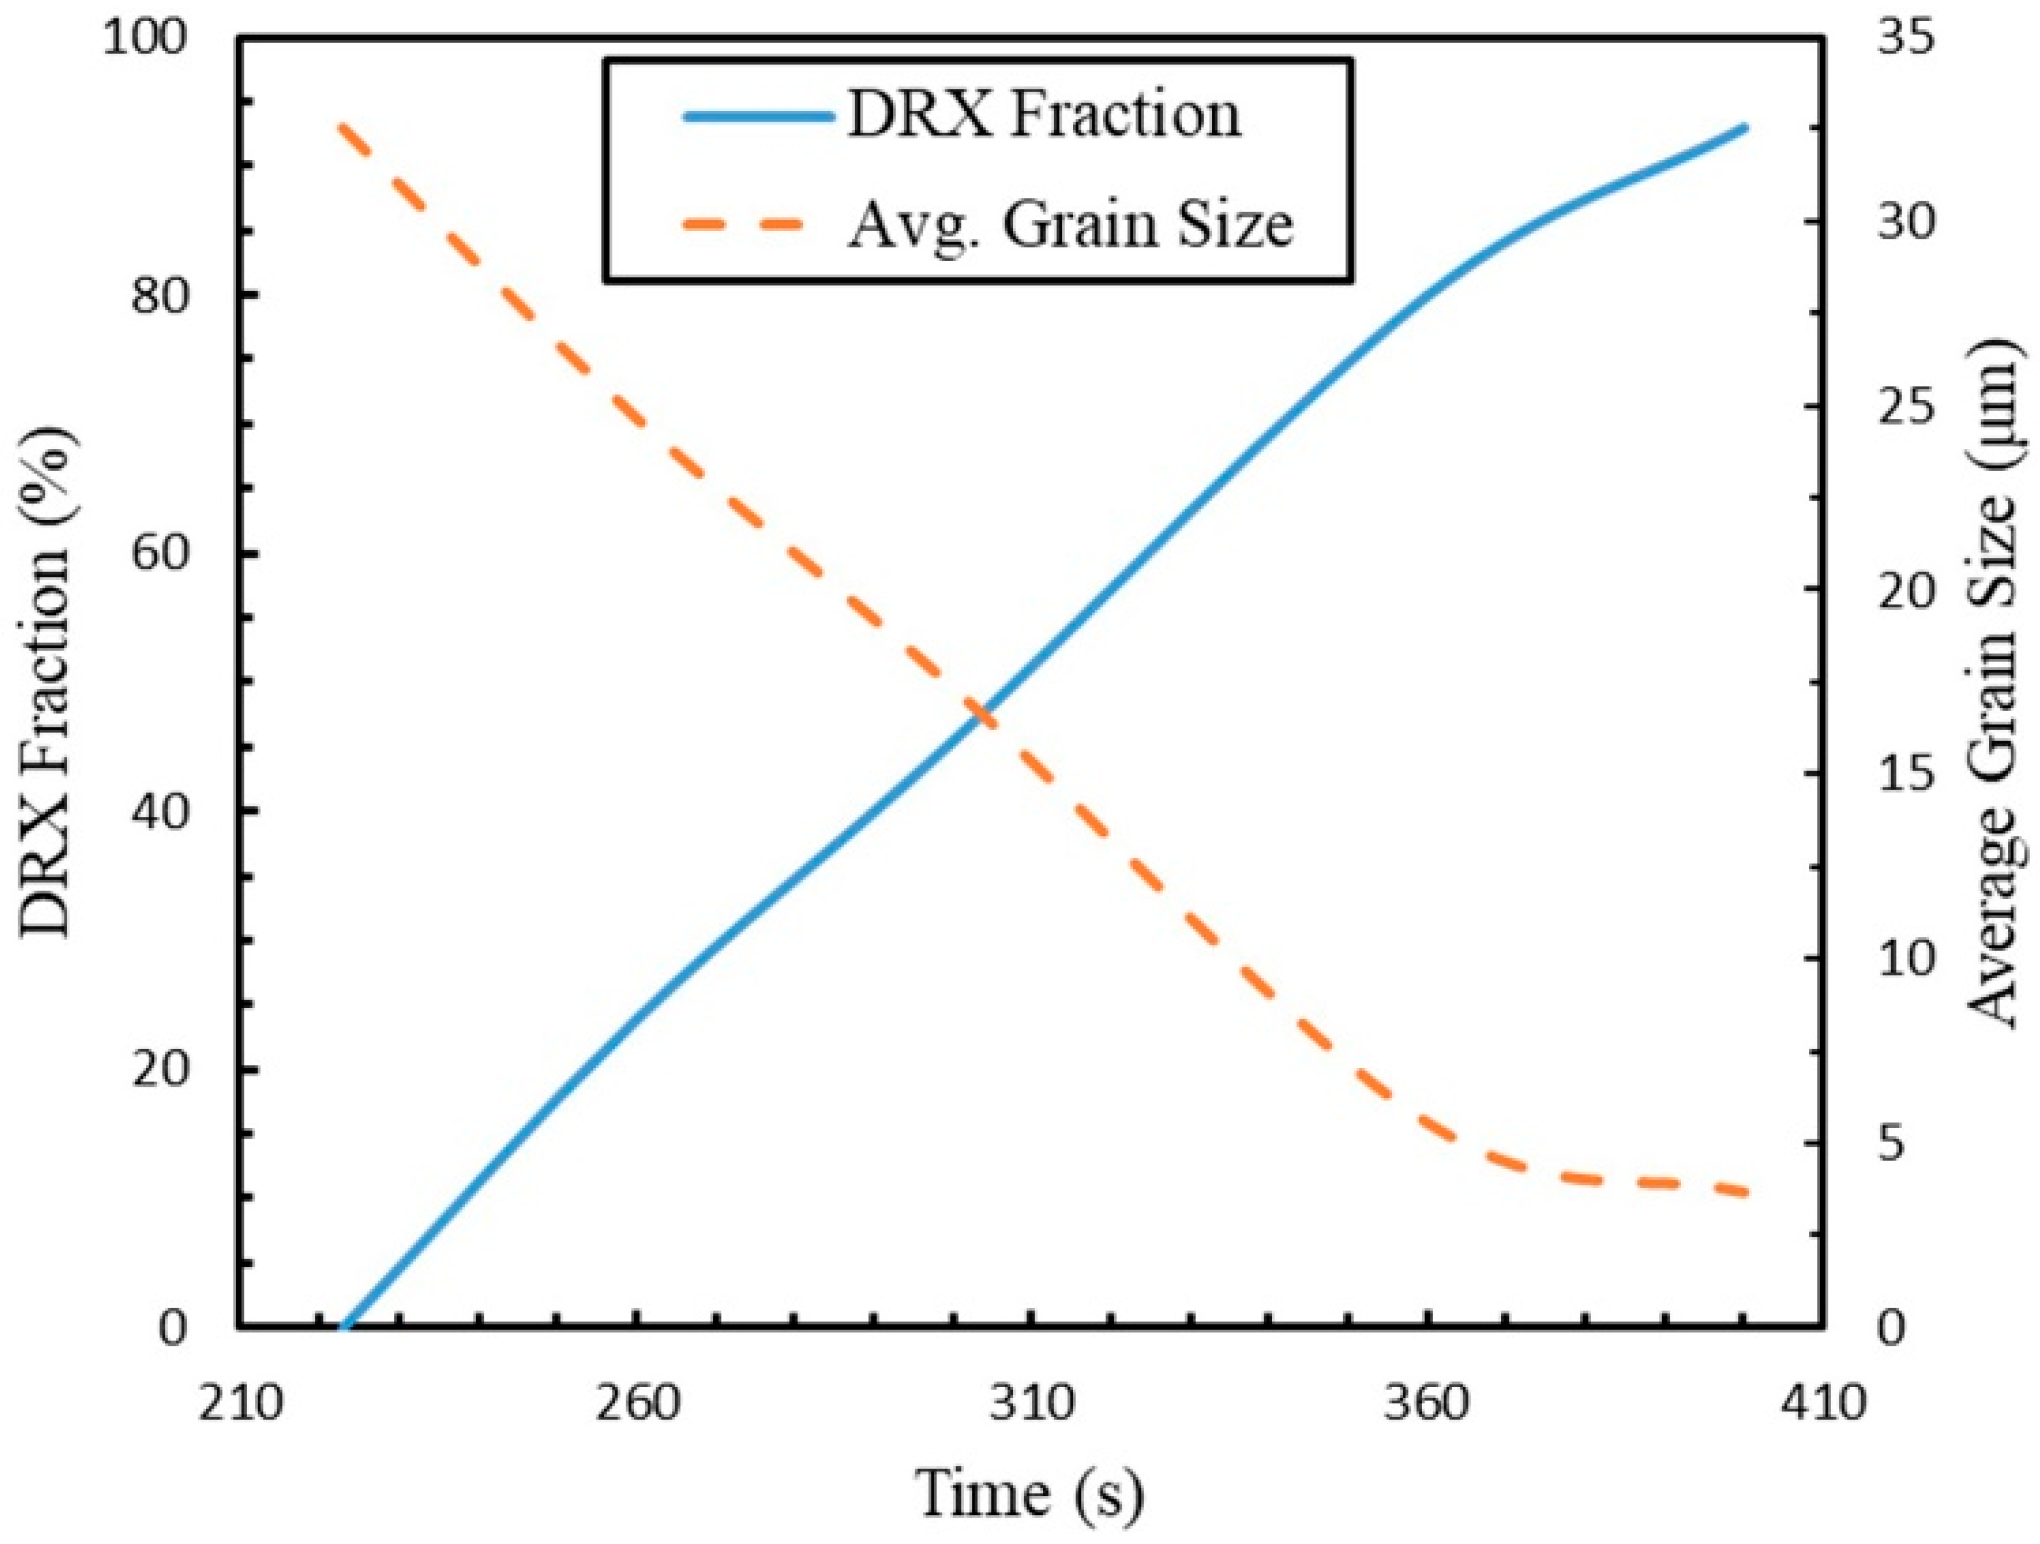
Figure 12 illustrates the predicted temporal evolution of the DDRX fraction and average grain size. Initially, the DDRX fraction remains at zero until 223 s, corresponding to the point at which the dislocation density inside grains attains the critical value and DDRX commences. Subsequently, the microstructure undergoes complete recrystallization by 400 s. Concurrently, the average grain size exhibits a reciprocal trend, demonstrating a rapid decrease from approximately 32.5 µm to 5.5 µm within the first 130 s following DDRX initiation, before stabilizing at 3.7 µm. This inverse correlation between DDRX fraction and grain size, consistent with observations in other studies [
17,
20], underscores the microstructural refinement resulting from the formation of new, smaller grains during discontinuous dynamic recrystallization.
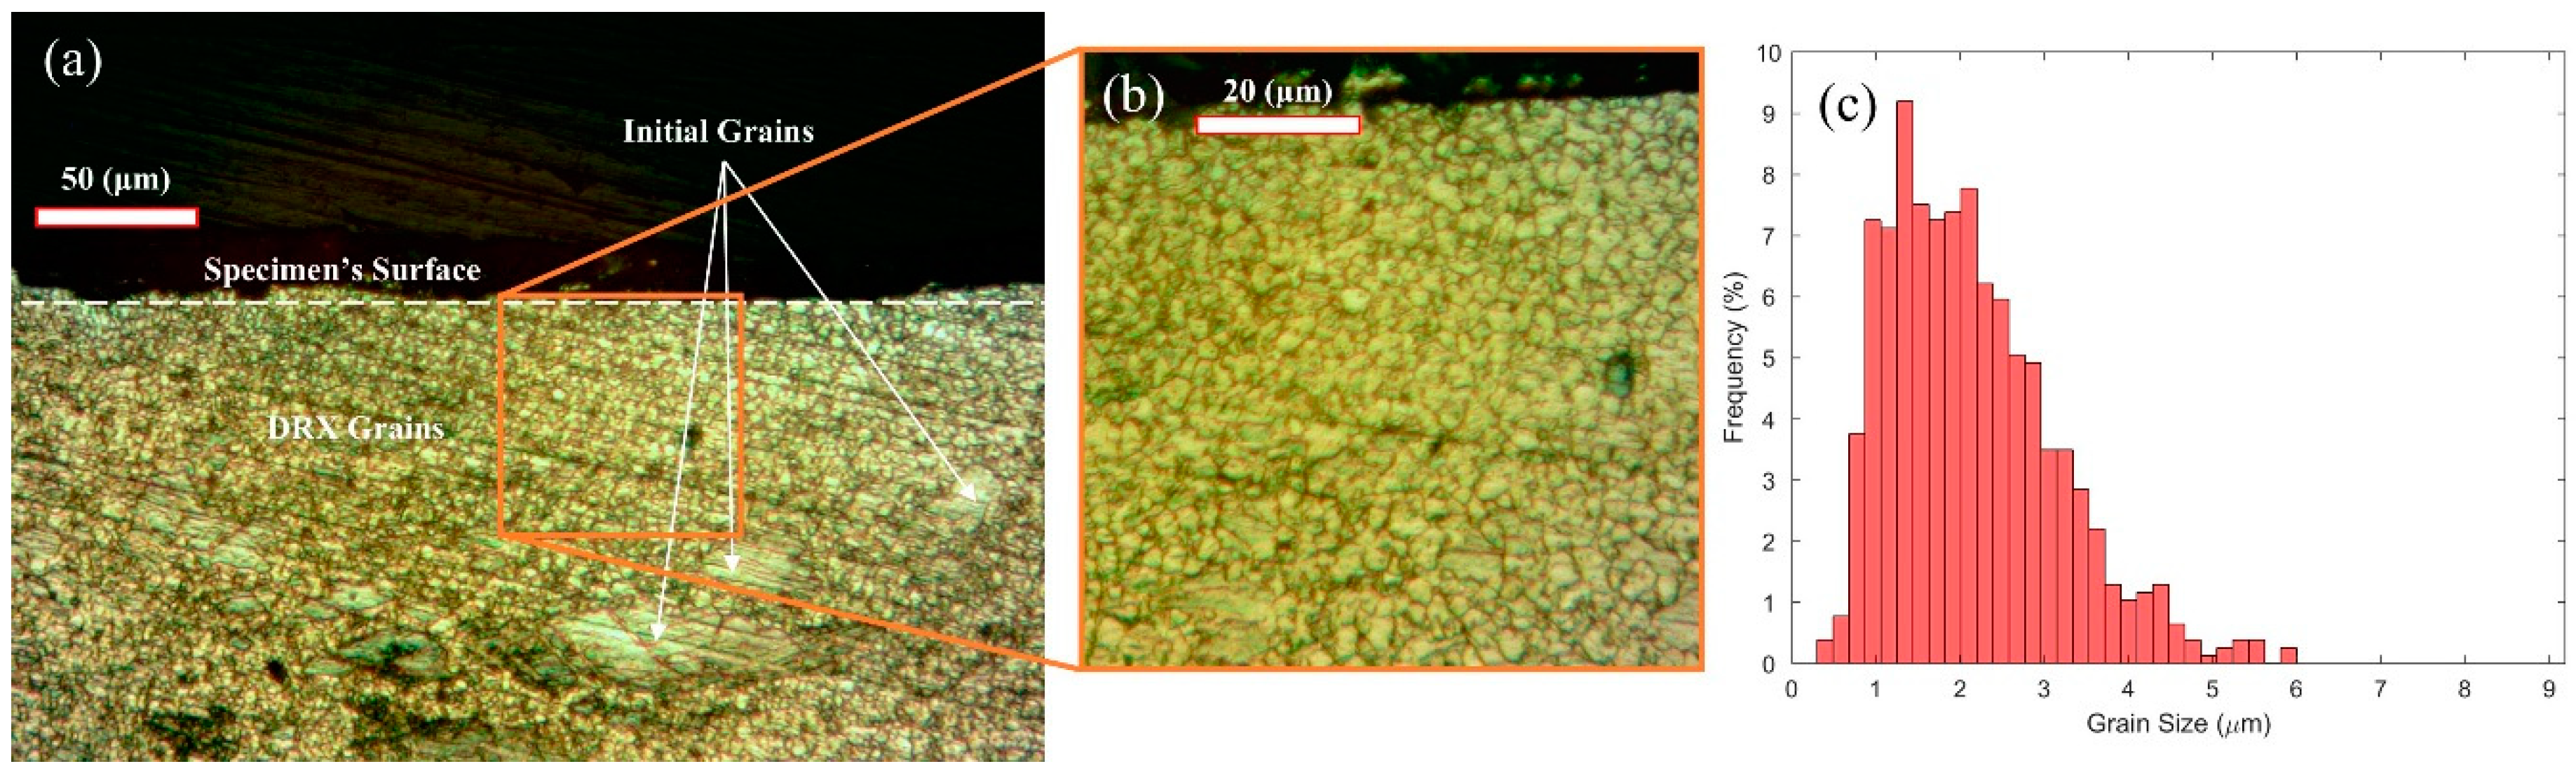
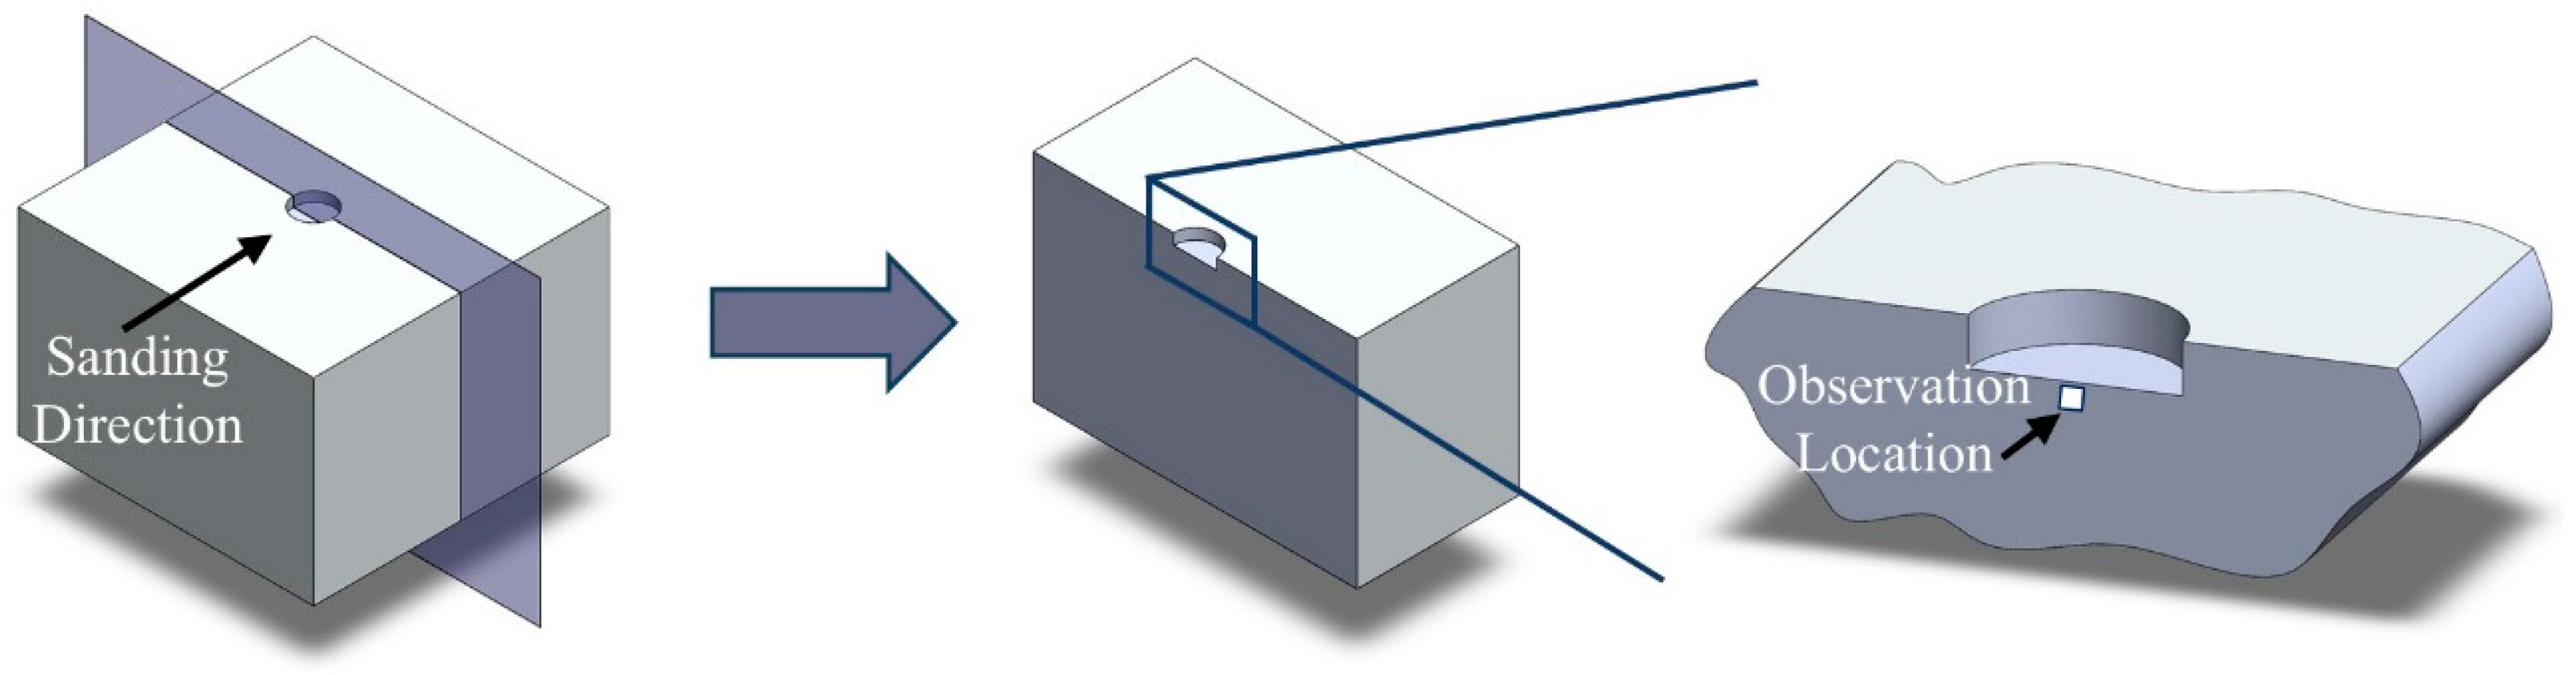
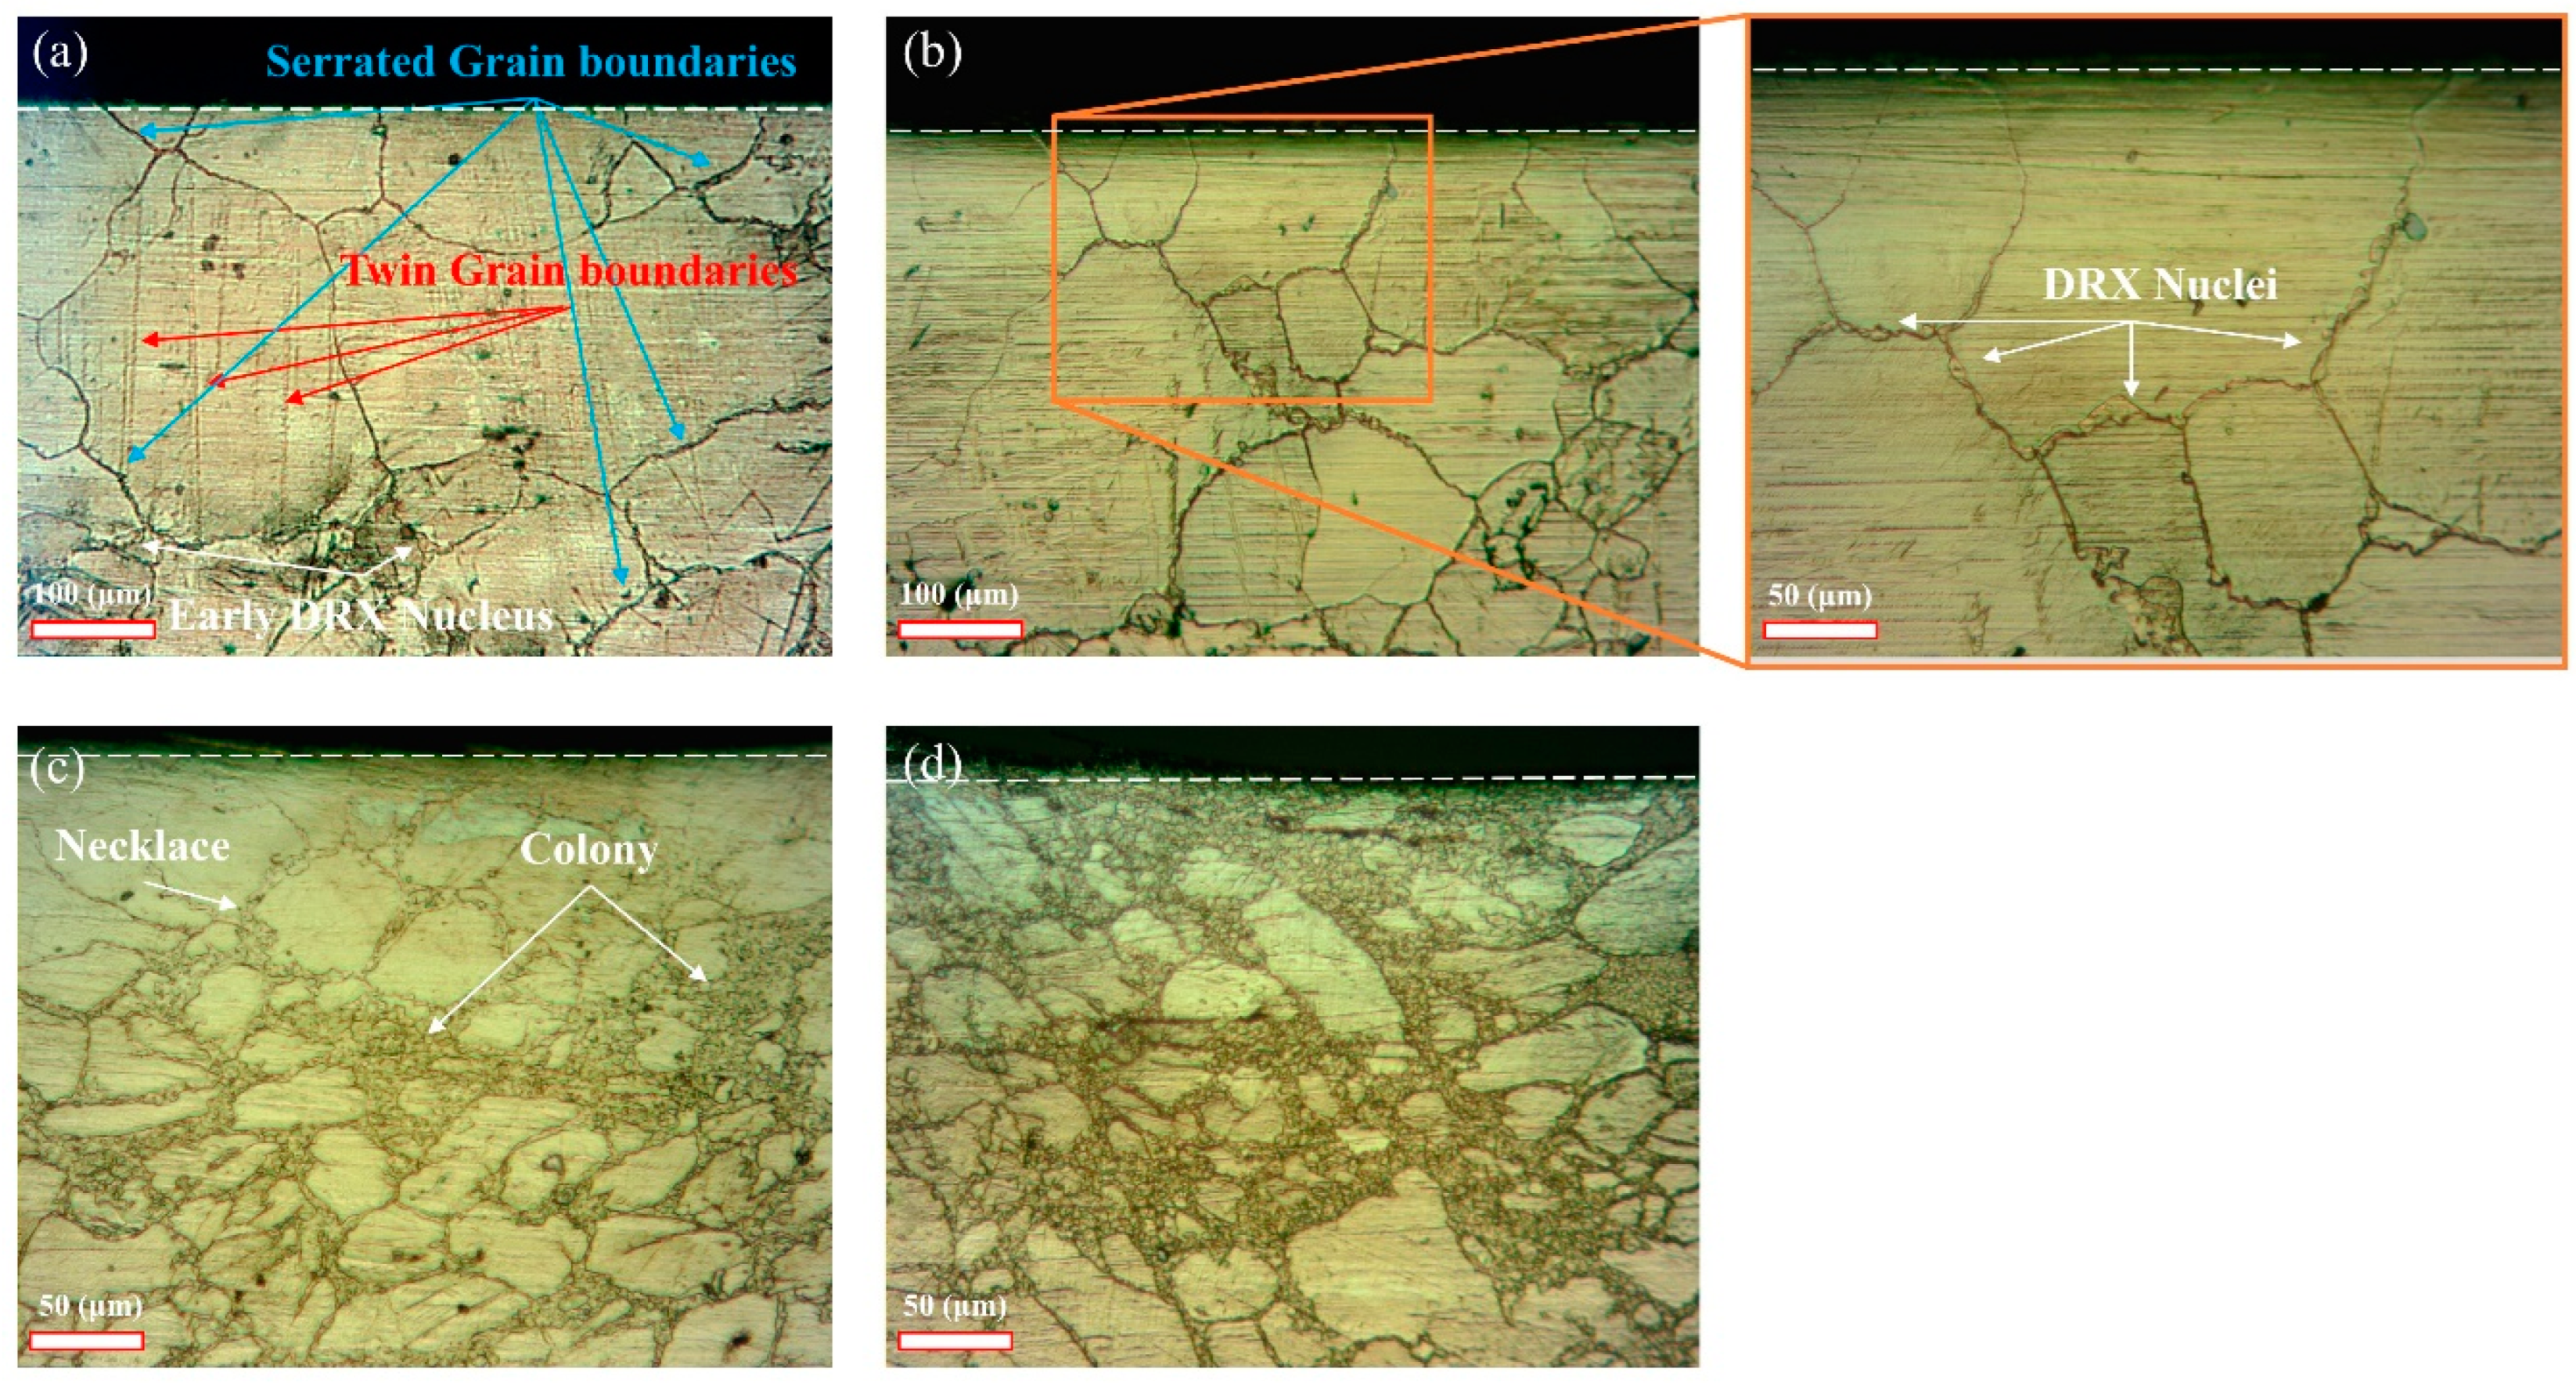
For the purpose of validating the simulated microstructural evolution, experimental analysis of the AZ31 magnesium alloy during impression creep testing was conducted using optical microscopy. The resulting experimental microstructures, illustrated in
Figure 13, exhibit a comparable trend to those predicted by the simulation, as presented in
Figure 11.
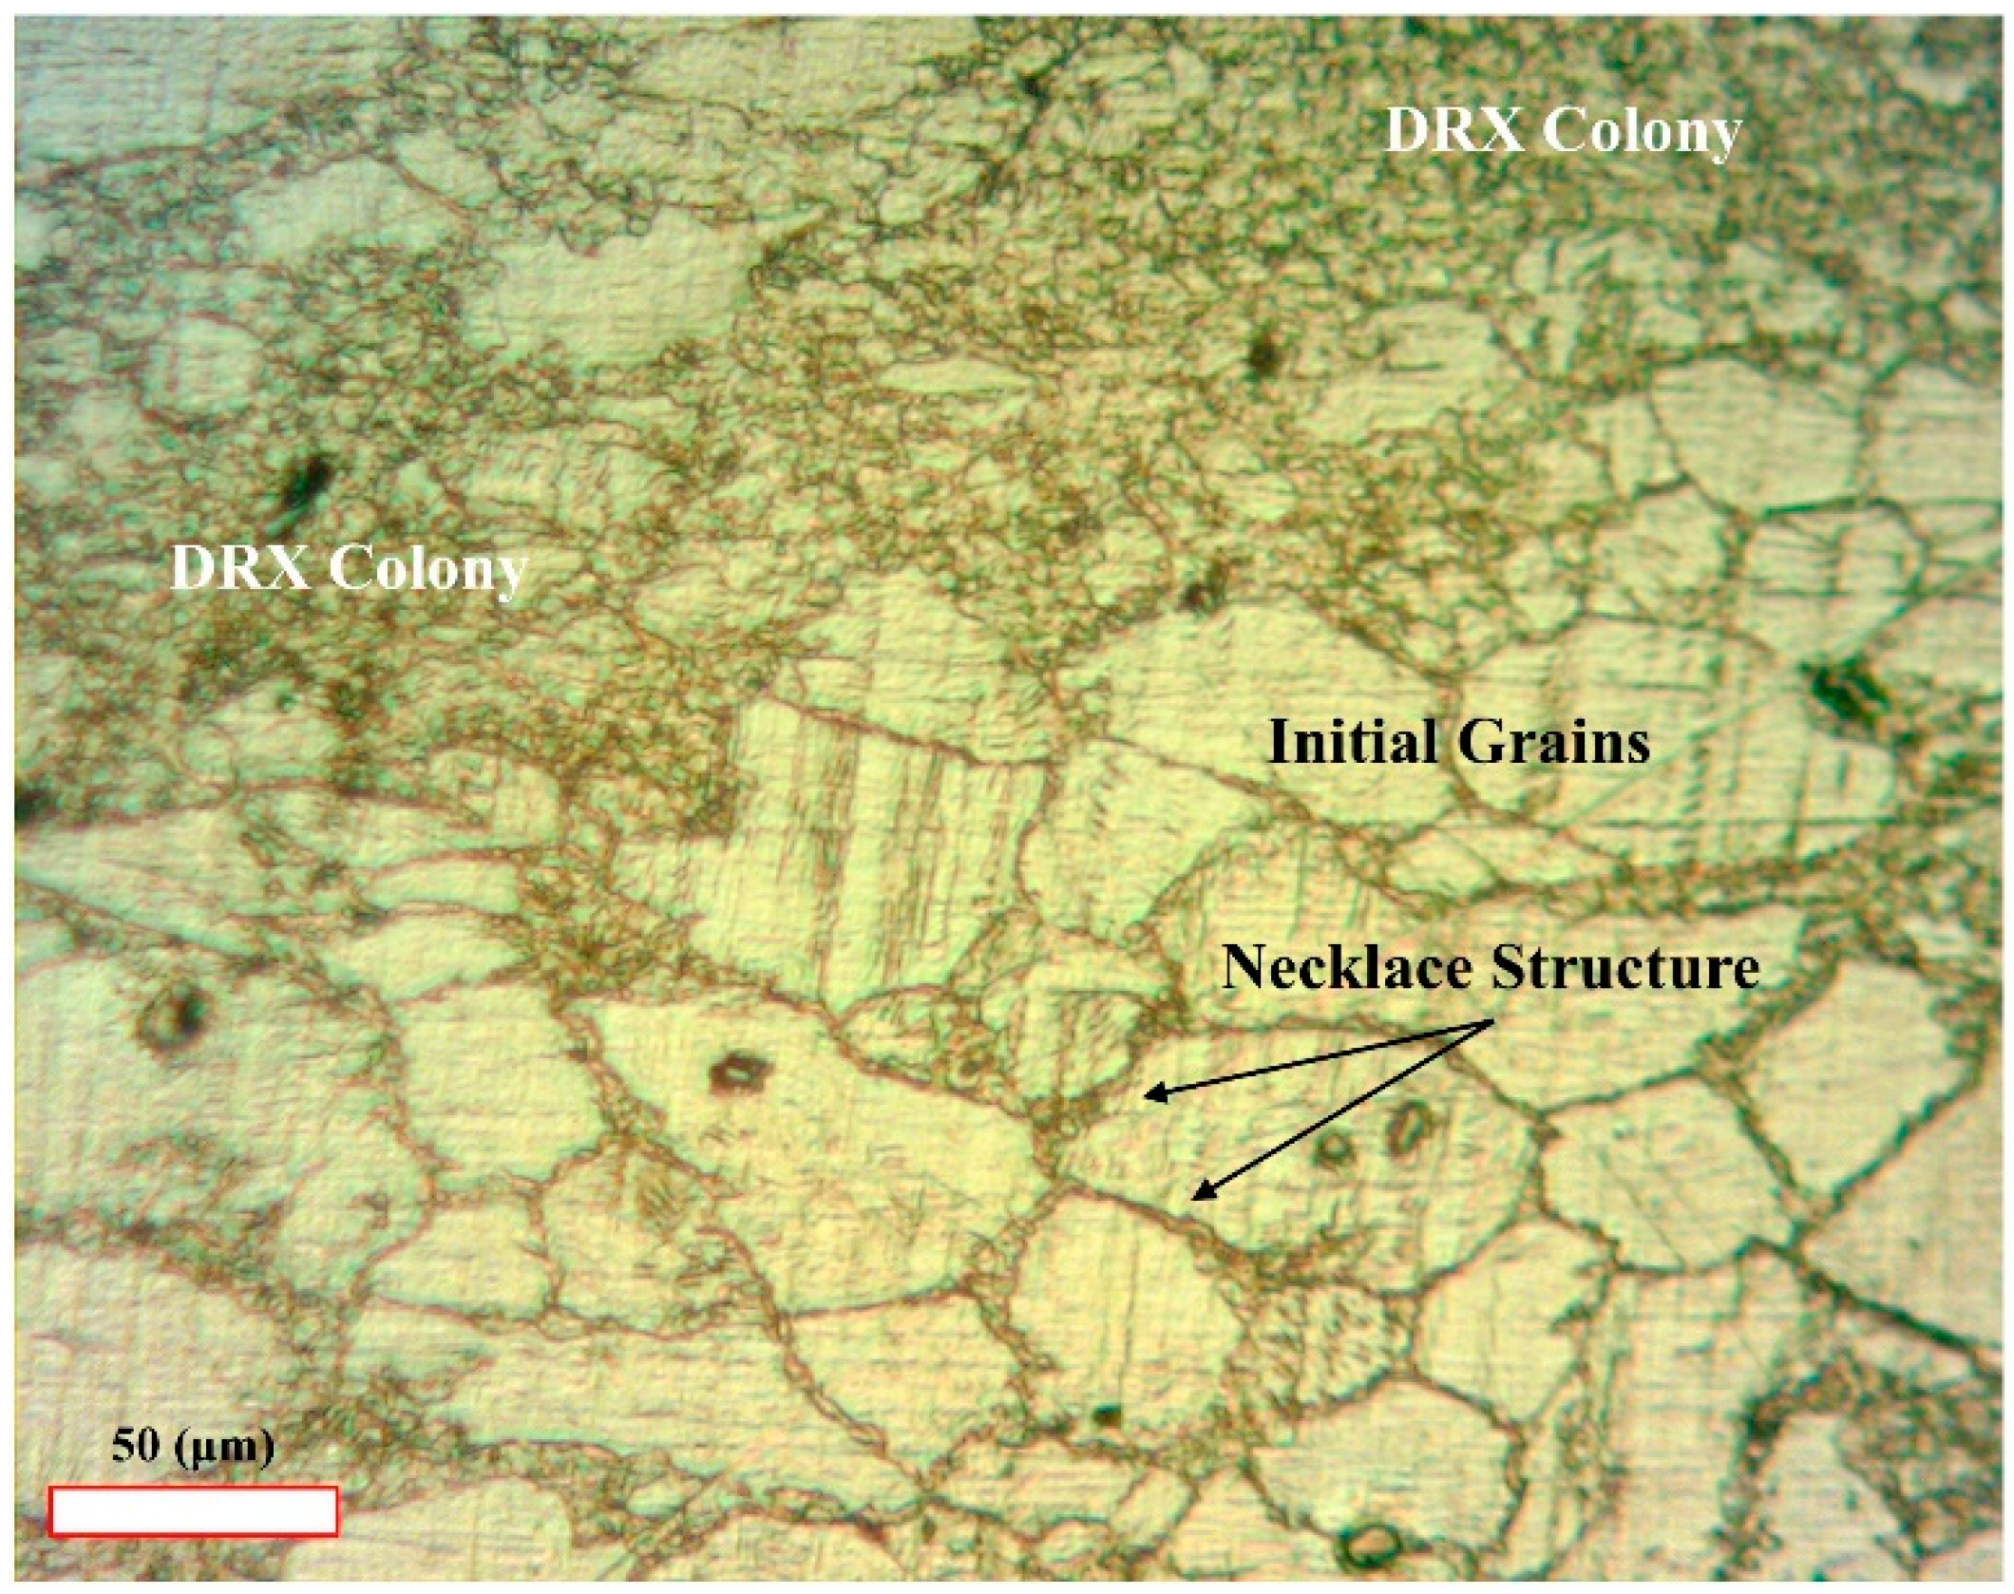
The acquisition of the metallographic images presented herein posed significant experimental challenges. Precise measurement of impression depth was difficult, and sample preparation was a protracted process necessitating the utilization of multiple specimens. As depicted in
Figure 13a, the serrated grain boundaries, which are known to be susceptible to dynamic recrystallization (DRX) [
86,
87], exhibit no discernible evidence of DRX at an impression depth of 80 μm. However, a limited number of DRX nuclei are observed at triple junctions, where the elevated grain boundary area-to-volume ratio appears to promote recrystallization at dislocation densities below the critical threshold [
74,
75]. Subsequently, the DRX process is initiated, with nuclei formation occurring along grain boundaries, resulting in the characteristic necklace structure observed in
Figure 13b. Further progression of the DRX process, as illustrated in
Figure 13c,d, is characterized by the gradual development of nucleation into the grain interiors, culminating in the formation of DRX grain colonies [
88].
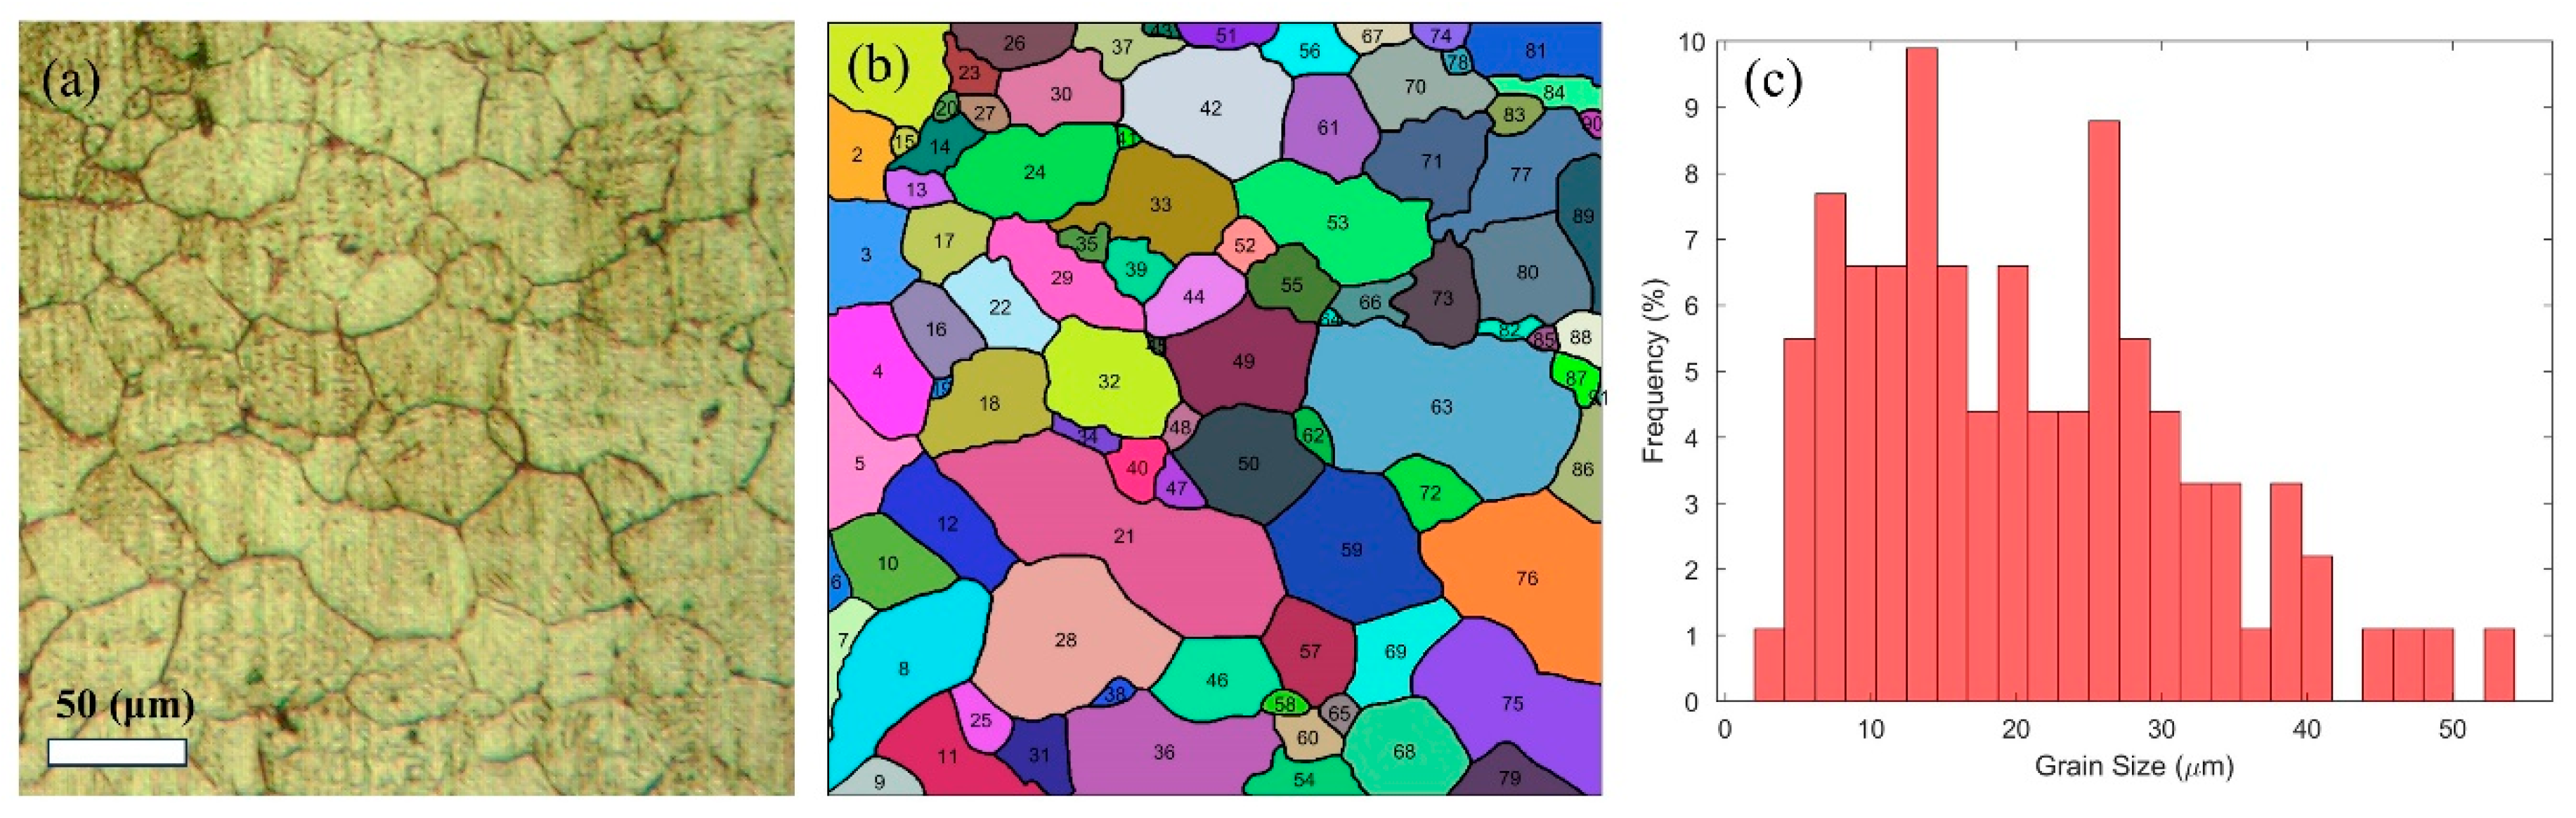
Figure 14a,b present the fully recrystallized microstructure of the AZ31 magnesium alloy, along with an enlarged selected area for detailed microstructural analysis, respectively. The grain size distribution presented in
Figure 14c exhibits a close correlation between experimental and simulated data. Furthermore, the measured average grain size of 3.16 µm demonstrates good agreement with a predicted value of 3.7 µm. This concordance validates the selected material parameters and model parameters, including the seed radius (
) and grid spacing and size, confirming their consistency with experimental observations.
Figure 14.
Microstructure of AZ31 showing complete recrystallization at 100 µm impression depth: (
a) microstructure image, (
b) magnified view of the selected region in (
a), and (
c) grain size distribution histogram.This study has demonstrated that the developed phase-field model accurately predicts both the steady-state impression rate and the discontinuous dynamic recrystallization microstructural evolution during impression creep testing of the AZ31 magnesium alloy. To further elucidate the DRX phenomenon within this context, microstructural analysis was conducted at progressively increasing impression depths. As the indenter penetrates deeper into the specimen during the impression creep process, the DRX regime extends to greater depths and encompasses wider spatial areas, as illustrated in
Figure 15 and
Figure 16. The microstructure beneath the DRX colony, indicative of the incipient stage of discontinuous dynamic recrystallization, exhibits a necklace-like structure.
Figure 15.
Experimental microstructural evolution of AZ31 after impression creep testing, focusing on lower observation depths.
Figure 15.
Experimental microstructural evolution of AZ31 after impression creep testing, focusing on lower observation depths.
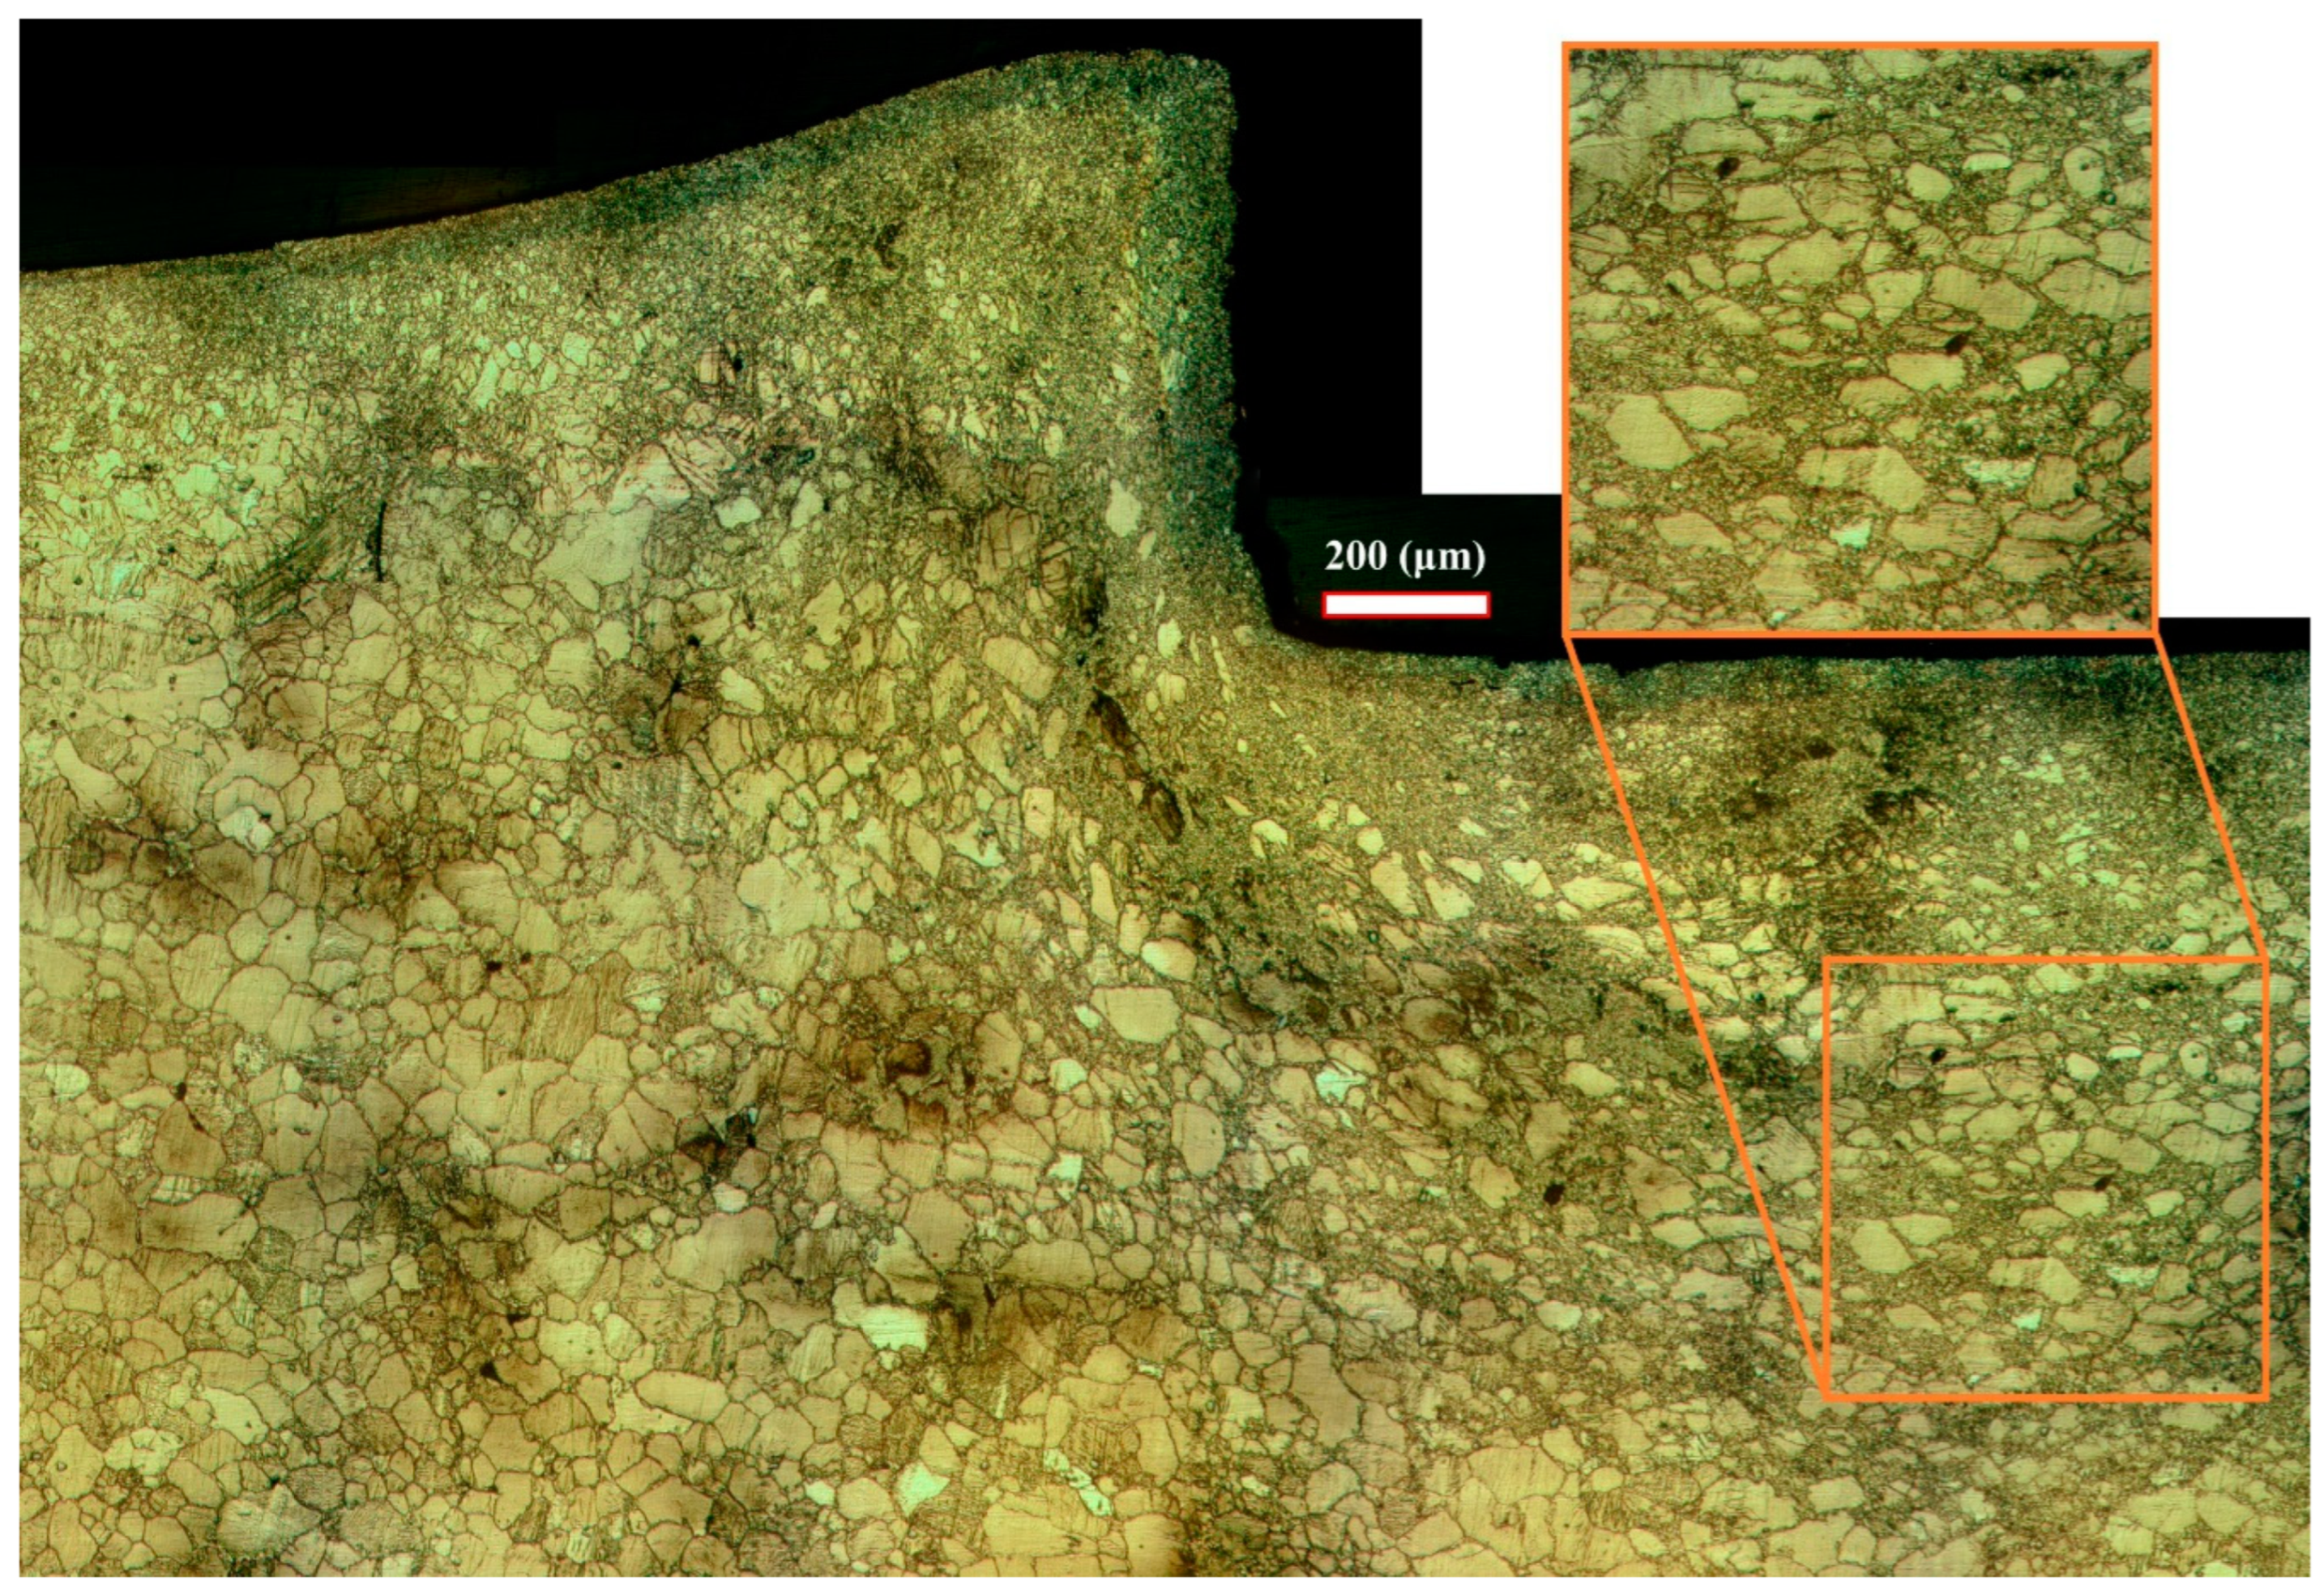
Figure 16.
Assembled microstructure images of AZ31 after impression creep at an impression depth of 450 μm.
Figure 16.
Assembled microstructure images of AZ31 after impression creep at an impression depth of 450 μm.
Figure 16 presents a series of assembled microstructure images, obtained from a specimen subjected to an impression depth of approximately 450 μm, to investigate a larger area in the vicinity of the indenter.
The region immediately adjacent to the indenter exhibits the earliest complete recrystallization during discontinuous dynamic recrystallization, a consequence of the elevated strain and stress concentrations prevalent in this area. With increasing impression depth, the strain field expands, and the DRX zone propagates to encompass the larger surrounding regions of the initially recrystallized microstructure.
Areas characterized by smaller grain sizes demonstrate accelerated recrystallization kinetics compared to larger grains. This phenomenon is attributed to the higher dislocation density within smaller grains at a given strain, coupled with their increased grain boundary-to-volume ratio, which promotes rapid nucleation and growth.
Conversely, larger grains exhibit elevated dislocation densities near their grain boundaries due to the accumulation of geometrically necessary dislocations (GNDs), facilitating the rapid formation of necklace structures. However, their lower intragranular dislocation density and larger grain volume result in delayed recrystallization, necessitating higher strains for completion. The increased grain volume and lower average dislocation density in larger grains contribute to this delayed recrystallization. As observed in the enlarged region depicted in
Figure 16, the DRX colony forms beneath larger grains, despite the average strain in the upper zone exceeding that of the colony zone.


