Abstract
This study evaluates the predictive capabilities of various machine learning (ML) algorithms for estimating the hardness of AlCoCrCuFeNi high-entropy alloys (HEAs) based on their compositional variables. Among the ML methods explored, a backpropagation neural network (BPNN) model with a sigmoid activation function exhibited superior predictive accuracy compared to other algorithms. The BPNN model achieved excellent correlation coefficients (R2) of 99.54% and 96.39% for training (116 datasets) and cross-validation (39 datasets), respectively. Testing of the BPNN model on an independent dataset (14 alloys) further confirmed its high predictive reliability. Additionally, the developed BPNN model facilitated a comprehensive analysis of the individual effects of alloying elements on hardness, providing valuable metallurgical insights. This comparative evaluation highlights the potential of BPNN as an effective predictive tool for material scientists aiming to understand composition–property relationships in HEAs.
1. Introduction
High-entropy alloys (HEAs) are a unique class of alloys where multiple principal elements are mixed in relatively high concentrations to maximize the configurational entropy [1]. The HEAs remain a simple solid solution phase, such as face-centered cubic (FCC, using Co, Cr, Fe, and Ni, etc.), body-centered cubic (BCC, using Mo, Nb, Ta, and Zr, etc.), or a mixture of the two instead of forming complex phases and intermetallic compounds [2]. HEAs possess excellent chemical, and mechanical properties that are absent in traditional metallic alloys. For instance, HEAs show high strength, hardness, cryogenic toughness, and thermal stability at elevated temperatures [3]. Due to their attractive properties, these alloys have attracted immense interest in the scientific community in recent years. Since HEAs are composed of simple phase constituents (either FCC, BCC, or mixed), the selection of alloying elements has a great influence on their mechanical properties.
Due to their relatively high amounts of multi-principal elements, the compositions of HEAs are located near or at the center of the composition space [4]. This multi-dimensional compositional space is practically limitless, which opens up a vast new realm of alloy design with unprecedented freedom. It comes as no surprise that, even after over a decade, only a small fraction of HEAs’ compositional regions have been identified so far within the immense compositional space, and the alloy design is typically carried out by trial-and-error methods with a low success rate. Hence, it is a great challenge to design a search strategy to recognize the desired compositions with some exceptional mechanical properties while minimizing the time and cost-intensive experimentations. In this regard, the progress in computer-aided algorithms with excellent computation capability offers a new opportunity for modeling multi-component alloy systems [5]. Several novel parameter optimization techniques have been developed to design multivariable complex systems [6]. Especially in the case of HEAs, high-throughput CALPHAD [7], high-throughput ab initio method LTVC (for phase identification) [8], DFT, MD (for phase stability, solidification, and crystallization kinetics), and genetic algorithms have been developed to accelerate the design of HEAs [9]. However, accurate prediction of the resulting properties for a given combination of constituent elements is crucial to the development and applications of new HEAs. Unlike parametric approaches, machine learning (ML) is a cutting-edge tool that implicit the relations from existing data [10]. The ML method, due to its huge success in various fields, has become an effective approach and receives greater attention in materials science, especially in the HEAs community [11].
Machine learning is a broad computing field where algorithms play a significant role in problem optimization [12]. Several authors reported various ML algorithm types for the optimization of HEA-related issues. For instance, Chang et al. [13] utilized a simulated annealing algorithm (SA) to predict the composition and hardness of HEAs. Menou et al. [14] used a multi-objective optimization genetic algorithm to design the high-specific-strength HEAs. Therefore, utilizing the best machine learning approach for designing a multi-component system is of great importance. The selection of a proper ML algorithm approach helps us to understand the optimum algorithm for designing HEAs with high accuracy as well as high throughput. Several authors used various ML algorithms to design the HEAs; unfortunately, the information regarding the prediction accuracy of training and testing datasets, as compared with the other algorithms, is often ignored [13]. Finding such information certainly helps alloy designers to choose a highly accurate ML tool. Comparing the efficiency of various commonly used ML algorithms certainly helps researchers to choose the appropriate ML algorithm for a given problem optimization. However, very few studies have reported on this aspect. Considering this, in the present study, we propose various popular ML algorithms (a total of nine ML algorithms, namely Support Vector Machine (SVM), Stochastic Gradient Descent Regressor (SGDR), Bayesian ridge (BR), Automatic Relevance Determination Regression (ARDR), Passive-Aggressive Regressor (PAR), Theil–Sen Regressor (TSR), linear regression (LR), Random Forest (RF) and Backpropagation Neural Networks (BPNNs)) to predict the hardness of multi-component alloy (Al-Co-Cr-Cu-Fe-Ni) systems.
It has been extensively reported that the backpropagation neural network (BPNN) technique is essential in the contemporary development of alloy systems because it can effectively model intricate, non-linear connections between alloy composition, processing variables, and material characteristics [5]. Conventional trial-and-error methods in alloy creation tend to be labor-intensive and require significant resources, whereas BPNNs provide a data-driven solution that can accurately forecast mechanical and physical properties using existing datasets. This speeds up the alloy design process by allowing the virtual evaluation of compositions and directing experimental work more effectively [15]. Additionally, BPNNs can reveal concealed relationships within high-dimensional compositional spaces, rendering them especially beneficial for the creation of advanced materials such as high-entropy alloys. Their adaptability and synergy with various machine learning methods further improve their usability, positioning BPNNs as a vital resource in creating next-generation alloy systems. The use of ANN (Java (1.4) for the prediction of the mechanical response of numerous alloy systems has also been previously reported [16,17].
This work mainly concentrates on the AlCoCrCuFeNi alloy system due to its complex phase transitions with alloying as well as limited work availability [18]. In general, the phase formation completely depends on the alloying elements; for example, the CoCrCuFeNi quinary alloying system exhibits only a single solid solution: the FCC phase. On the other hand, the six-elemental alloy, AlCoCrCuFeNi, forms FCC, BCC, and a combination of phases according to the alloying content. Thus, achieving a detailed understanding of how an alloy’s behavior changes with its composition is quite complex and challenging and needs significant attention [19]. Therefore, the present study mainly focused on selecting the optimal ML algorithm for understanding the composition–structure–property relationships, which helps us to design novel multi-component AlCoCrCuFeNi alloy systems. The performance of each model was determined with the help of the prediction accuracy of both training and validation datasets. Among all ML algorithms, BPNN exhibits a high level of prediction accuracy. Therefore, we utilize the BPNN model to design the new compositions of Al-Co-Cr-Cu-Fe-Ni-based HEAs with excellent mechanical performance. Figure 1 illustrates the overall workflow adopted in this study for predicting the hardness of alloys using various machine learning (ML) algorithms. The process begins with data collection, followed by preprocessing involving training, validation, and testing stages. Multiple ML algorithms, including SVM, SGD, BR, ARD, TSR, LR, RF, and BPNN, are then applied to develop predictive models. These models are evaluated using standard performance metrics such as R2, RMSE, and MAE. A comparative analysis is conducted to determine the best-performing model. Subsequently, the selected models are used to predict hardness for new compositions, accompanied by visualizations. The workflow concludes with interpretation and conclusions, highlighting the influence of alloying elements and recommending optimized compositions for target hardness.
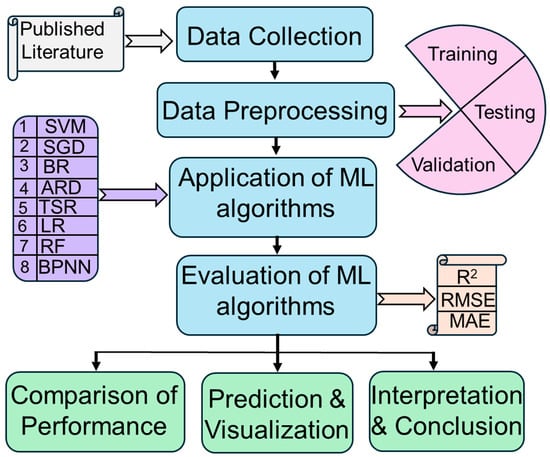
Figure 1.
Schematic flowchart illustrating the methodology and workflow of the present study.
2. Machine Learning (ML) Algorithms
2.1. Brief Notes on Various ML Algorithms Used in the Present Study
2.1.1. Support Vector Machine
Support Vector Machine is an ML tool that can be used for regression and classification-based tasks (mainly used for classification). By definition, an SVM constructs a hyperplane or set of hyperplanes in a high or infinite-dimensional space, which can be used for classification or regression. For example, for a given set of input data and predicts, for each given input, two possible classes form the output (binary linear classifier). In the case of the non-linear or higher-dimensional features, the SVM uses different kernel functions where the given non-linear problem is reformulated as a linear problem by different kernel functions [20].
Mathematically, the optimization problem with a kernel function is expressed as follows [21]:
When
Here, xi = input vectors, yi = class variables, w = weight of vector, b = bias; ξi are added for soft margin classification; ∅(xi) maps the input into a higher-dimensional space; and C controls the trade-off between margin width and classification error.
2.1.2. SGD Regressor
SGD is one of the descent tools that has been successfully applied to large-scale ML problems. Simply, it is an iterative method and a very efficient approach for optimizing an objective function. Due to its fast computation and easy learning, the SGD regression is interesting from a research perspective. SGD Regressor minimizes a loss function using Stochastic Gradient Descent (SGD) and the most common loss is the squared error loss, which is expressed by Equation (1) [22].
Here, w = weight of vector, xi = input feature, yi = output feature, and n = number of samples.
2.1.3. Bayesian Ridge
The Bayesian ridge regression is a kind of linear regression where the predicted value is considered as a linear combination of the input variable. This method is very useful for process regularization. The method has flexibility in the design for any given problem,; however, the predictions take noticeably more time to solve and compute. A linear BR algorithm is mathematically expressed by Equation (2) [23].
Here, X = design matrix, y = response vector, w = weight of vector, and = Gaussian noise with precision a.
2.1.4. Automatic Relevance Determination Regression
ARD regression is a hierarchical Bayesian approach that is widely used for model selection [21]. The main advantage of the ARD is that the model can switch off the irrelevant input variables (which are irrelevant to the prediction of the output variable) by setting the coefficients to zero. Thus, the model is effectively able to infer which variables are relevant and then switch the others off and prevent the model from overfitting. This method is mainly used when a large number of input variables further allow the irrelevant input variables to be left in the model without harm. ARD places the independent Gaussian priors over the weights wi, as expressed by Equation (3) [24].
Here, λi = individual precision for each weight w.
2.1.5. Passive-Aggressive Regressor
Passive-aggressive algorithms are a family of machine learning algorithms that are mainly used for both classification and regression. These algorithms can be used at a large scale with regulation parameters. The mathematical expression for prediction using PAR is expressed by Equation (4) [25].
Here, xt = input feature vector, yt = target value, and wt = weight of vector.
2.1.6. Theil–Sen Regressor
Theil–Sen Regression is a method used for robustly fitting a line to sample points in the plane by choosing the median of the slopes of all lines through pairs of points. Due to its simplicity in computation, the method can be applied in various fields to estimate the trends in the given complex system. Mathematically, for a 2D dataset with input values xi and corresponding outputs yi for i = 1, …., n, the slope mij between any two points is calculated by Equation (5) [26].
The Theil–Sen estimator for the slope is the median of all these pairwise slopes, given by Equation (6).
Once is estimated, the intercept is computed by Equation (7).
So, the final regression line is expressed by Equation (8).
2.1.7. Linear Regression
Regression analysis is one of the most widely used techniques for analyzing multi-factor data. The method is simple and easy to implement and facilitates interpretation of the output coefficients. Diversely, the method over-simplifies real-world problems by assuming a linear relationship among the variables. The model assumes that the relationship is linear and can be expressed by Equation (9) [27].
Here, y = predicted values, β0 = intercept term, βi = coefficient for the independent variables, xi = input features, and ε = error term.
2.1.8. Random Forest
Random Forest is a meta-estimator that fits several classifying decision trees on various sub-samples of the dataset and uses averaging to improve the predictive accuracy and control overfitting. Thus, the algorithm builds multiple decision trees and merges them together to obtain a more accurate and stable prediction. Despite its advantages, RF has some drawbacks, as it requires more computational power as well as additional training time. For regression tasks, it predicts the output by averaging the predictions from all individual trees. The prediction formula for a given input is expressed by Equation (10) [28].
Here, = predicted value and Ti(x) = prediction of the i-th decision tree.
2.1.9. Backpropagation Neural Networks
Backpropagation is simple, fast, and easy to program and is the essence of neural net training. It is a method of fine-tuning the weights of a neural net based on the error rate obtained in the previous epoch. Proper tuning of the weights allows us to reduce error rates and make the model reliable by increasing its generalization. During backpropagation, the error for each neuron is calculated by Equations (11) and (12) [29].
Here, δj = error, yj = actual target output, η: learning rate, and f′(zj): derivative of the activation function.
3. Data Collection and Processing
The database used in the present study was taken from the published literature. A total of 155 combinations of alloy compositions (in at.%) and their respective hardness values were reported in [18]. Overall, the composition of each element varies in vast range and is multi-dimensional. The minimum, maximum, mean, and standard deviation values of each element and hardness values are tabulated in Table 1.

Table 1.
The minimum, maximum, average, and standard deviation values of variables.
The pair plot (or scatter plot matrix) shown in Figure 2 describes the distribution of a single variable and its relationship with all the other variables present in the multi-dimensional variable system [30]. Briefly, the pair plot provides a matrix of the pairwise scatter plots of all variables in the data frame. The principal diagonal of the matrix running from the top left to its bottom right contains the distribution plots or histograms of each variable. Thus, from the pair plot, one can get an idea about the distribution of each variable and the corresponding relation with the other variables present in the database. The data points are randomly distributed and the correlation value (Pearson’s r) between any two given variables is weak and complex. On the other hand, the histogram and the fitted normal distribution curve summarize the distribution of the variable in the database.
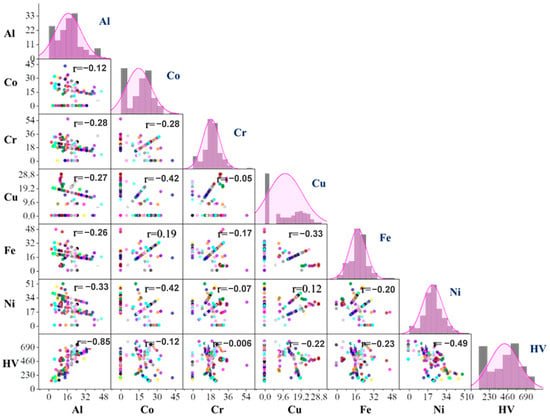
Figure 2.
Data distribution plots and pairwise relationships among chemical components and hardness. The respective Pearson correlation coefficient r between each pair of variables is mentioned in each plot.
4. Results
4.1. Model Development
The composition of the alloy consists of Al, Co, Cr, Cu, Fe, and Ni (in at.%) are considered as the input variables and hardness is the output variable for constructing the model. The predictive models have been developed with various ML algorithms. Among 155 datasets, 116 datasets were used for training, whereas the remaining 39 datasets comprised the validation dataset, which was used for cross-validation during the training to confirm the optimal performance of the various ML algorithms. The optimum model for each ML algorithm was determined based on the cross-validation error calculated using Equation (13).
where Ecve (y) = cross-validation error in prediction of the training and testing dataset for output parameter y. N = number of datasets, Ti(y) = targeted output, and Oi(y) = output calculated.
The cross-validation error during the development of neural networks with the backpropagation ML algorithm is shown in Figure 2. The cross-validation error of training datasets (116) tends to decrease with increasing iterations; hence, it is quite difficult to find the optimum model with only the training datasets. On the other hand, the cross-validation error of test datasets decreased with increasing iterations at the initial stage and attained a minimum value at 20,000 iterations, as indicated in Figure 3. Afterward, the error significantly increased with increasing iterations. Hence, the optimum model was determined based on the minimum test data error.
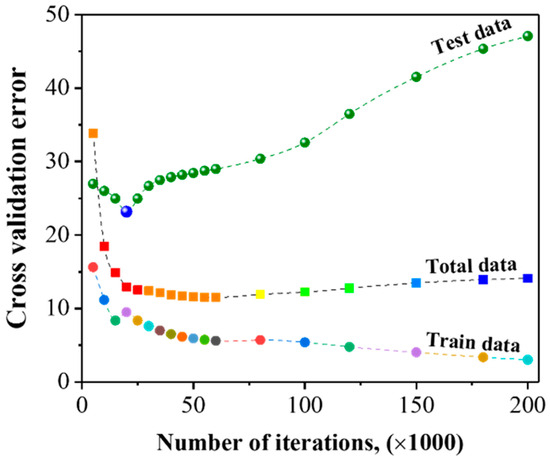
Figure 3.
Change in cross-validation error as a function of iterations in the BPNN model.
4.2. Comparing the Prediction Accuracy of Various ML Algorithms
The predictive performances of different ML algorithms were compared by examining correlation plots of experimental versus predicted hardness values, as depicted in Figure 4. These plots illustrate the correlation between experimental and predicted hardness values and provide the corresponding coefficient of determination (R2) values for the 39 validation datasets. The PAR demonstrated the lowest prediction accuracy, achieving an R2 value of only 52.93%. Conversely, both the SVM and BPNN models showed excellent predictive performance, each yielding R2 values exceeding 90%. Among all the algorithms, the BPNN exhibited the highest accuracy, achieving an R2 of 96.39%. For a clearer comparative evaluation, Figure 5 summarizes the R2 values of the various ML algorithms for training (116 datasets), cross-validation (39 datasets), and testing (14 datasets) phases. Based on the R2 values obtained from all datasets, the BPNN model exhibited minimal prediction error and demonstrated outstanding reliability for predicting the hardness of HEAs.
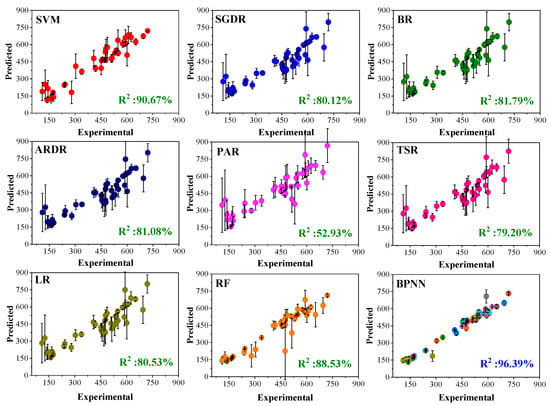
Figure 4.
Performance of various ML algorithms for 39 cross-validation datasets.
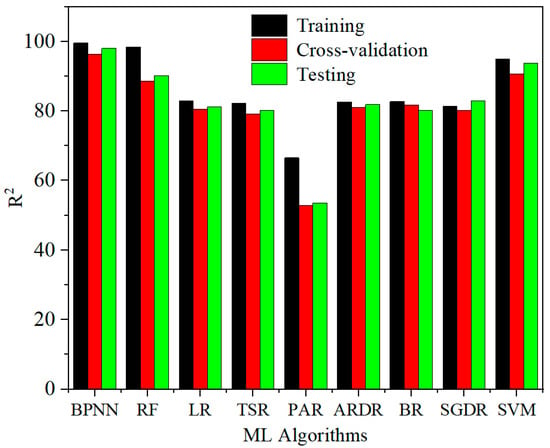
Figure 5.
Coefficient of determination (R2) values of various ML algorithms for training, cross-validation, and testing datasets.
4.3. Testing of BPNN Model
To test the developed BPNN model, we further considered the various HEAs (a total of 14, as shown in Table 2) compositions from the literature [6]. The alloy hardness was predicted using the finalized optimal BPNN model. The predicted hardness and respective error values were tabulated in Table 2. The model was able to estimate the hardness values of the test dataset of HEAs with considerable accuracy. The average error in the predictions was noted as 18.19. Hence, the developed neural networks model with the backpropagation algorithm could correlate the complex relations among the composition and hardness of HEAs compared with other well-known ML algorithms. Moreover, the BPNN model was able to provide significant prediction accuracy even for testing datasets.

Table 2.
The list of datasets used for testing the BPNN machine learning model.
4.4. Effect of Element Concentration on the Hardness
The mechanical properties of HEAs strongly depend on their composition and microstructure. D.B. Miracle et al. [32] reported that the alloy composition determines the existing phases and their volume fractions, atomic interactions that influence the properties through the intrinsic properties of the phases. However, the individual elemental effect on hardness values of HEAs is rather limited and only a few studies focused on the variation in the individual element amount effect on the mechanical properties of HEAs [33,34]. Therefore, herein, with the help of the developed BPNN model, we tried to estimate the effect of alloying elements on the hardness of HEAs. The metallurgical reasoning of predicted hardness results was given, and the results were supported by the published data. As illustrated in Figure 6a, Al tends to increase the hardness with concentration. As reported in [35], the concentration of Al increases, the single-phase FCC (low-hardness phase~HV 100–200) transforms to BCC+FCC and then to the single-phase BCC/B2 phase, which has higher hardness ranging from HV 500 to 600. The BPNN predicted trend regarding the variation in hardness as a function of Al content shows close agreement with the experimental trend [36]. As shown in Figure 6b, the effect of Co on hardness is quite negligible, yet it tends to minimize the hardness slightly. Qin et al. [37] reported that an increase in Co content leads to the formation of the FCC phase, which tends to decrease the hardness, and the other possible reason is due to the low solubility of Co in the BCC solid solution which means that the element is rejected from the high-hardness phases and causes a reduction in hardness [36]. In contrast with the Co, the Cr gradually increases the hardness, as depicted in Figure 6c. Shun et al. [33] observed that at low concentrations, Cr forms the FCC phase, and as the Cr content increases, the phase fraction of FCC is decreased, and the element stabilizes the BCC phase. Accordingly, we observed the lowest hardness value when the Cr content was low, and as the amount of Cr increased, the hardness increased gradually (Figure 6c). The Cu did not appear to have considerable influence on the hardness and the value was almost constant throughout the given range of Cu concentration (0 to 30 at.%), as illustrated in Figure 6d. The estimated behavior of hardness as a function of Fe content is plotted in Figure 6e. From the figure, it is clear that an increase in Fe content leads to a continuous decrement in the hardness, and similar results have been reported in the literature [37]. According to Chen et al. [37], the lattice distortion and absence of the Cr3Ni2 phase are the main possible reasons for Fe content which results in the deterioration of hardness. Finally, the effect of Ni content on hardness is shown in Figure 6f. Ni tends to increase the hardness at low content levels (<8 at.%); however, increasing Ni content leads to a decrease the hardness of up to 20 at.%, and the hardness remained constant with a further increase in Ni content. A similar trend of Ni’s effect has been reported by Suresh et al. [32]. They investigated the effect of Ni content on hardness and found that higher Ni content (>10 at.%) significantly decreased the hardness due to the stabilization of single FCC phase. At lower concentrations, the increase in hardness was due to the presence of a mixture of both FCC and hard tetragonal phases. Hence, from the estimated results, it can be concluded that the developed BPNN model is able to correlate the concentration and hardness of HEAs and provides detailed knowledge regarding the qualitative influence of alloying elements on hardness.
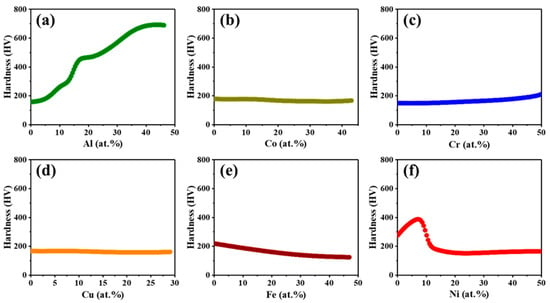
Figure 6.
The BPNN model estimated the results of the element concentration effect on hardness behavior: (a) Al, (b) Co, (c) Cr, (d) Cu, (e) Fe, and (f) Ni.
4.5. Validation of the Model Predictions with Experimental Results
The composition–property correlations predicted by the BPNN model were validated with the experimental results. Such validation ensures a great degree of confidence in the accuracy of predictions made in the present study. To verify the predicted behavior of hardness, we compared the experimental hardness values of various AlxCoCrCuFeNi (where x is 0, 1.5, and 3 mole fraction) alloys. Further, the predicted behavior was explained with the help of microstructural constituents. Figure 7 shows the effect of Al content (given in mole fraction) on hardness, and it is evident that increasing Al content (0 to 3 mole fraction) significantly increases the hardness value (from 130 to 650 HV). The measured chemical composition (at.%) of three alloys and their respective hardness values are tabulated in Table 3.
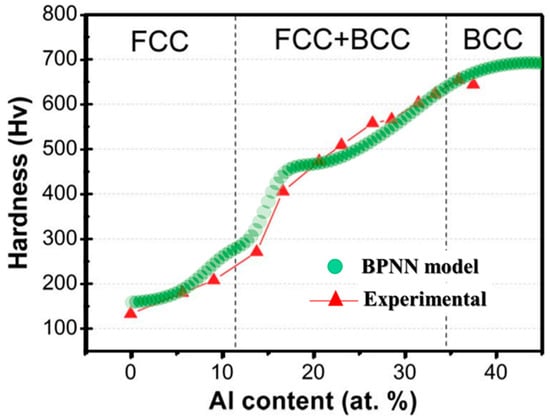
Figure 7.
Effect of Al addition on the hardness of cast AlxCoCrCuFeNi alloy [35]. The increase in hardness with Al content is due to the phase changes from FCC → FCC + BCC → BCC.

Table 3.
Measured composition and respective experimental as well as predicted hardness values of AlxCoCrCuFeNi alloys.
Initially, with 0 at.% of Al, the hardness value of the alloy is lower than 200 HV, and as the Al content increases to ~25 at.%, the value increases to ~510 HV and finally, the maximum Al content of ~39 at.% remarkably improves the hardness value to ~650 HV. On the other hand, the BPNN model predicted hardness values at each Al content are denoted by colored lines (see Figure 7), and the values are shown in Table 3. With the exception of alloys with a high Al concentration (38.9 at.%), the other alloys’ predicted hardness was reasonably well matched with the experimental results (Table 3). At high Al content, the difference between the experimental and predicted hardness was about 100 HV. However, the hardness trend with Al content predicted by the model perfectly followed the experimental trend (see Figure 6a and Figure 7) According to previous reports [1,4], the main causes for such an increase in the hardness values are as follows. As a solid solution element, the Al atoms tend to increase the hardness related to the solution-hardening mechanism. Furthermore, the change in phases from FCC to FCC + BCC followed by the complete BCC phase significantly improves the hardness of the alloy. From a metallurgical perspective, the alloy with 0 at.% Al primarily exhibits a single-phase dendritic microstructure, along with a minor interdendritic component. As the Al content increases to approximately 25 at.%, the dendritic morphology transitions into a network-like pattern due to spinodal decomposition, resulting in a dual-phase FCC + BCC structure. With the further addition of Al, the microstructure evolves into a polycrystalline form predominantly composed of a single BCC phase, which contributes to the observed peak in hardness. Detailed compositional effects on microstructure, as revealed by transmission electron microscopy, are available in Ref. [36]. Overall, the BPNN model effectively captures the intricate composition–property relationships in HEAs. Notably, the predicted outcomes align well with experimental observations, enhancing our understanding of the metallurgical mechanisms involved. This insight is valuable for the rational design of HEAs with tailored properties.
4.6. Significance of Alloy Components for the Hardness
The overall influence of each input variable on the output can be explained with the help of the index of relative importance (IRI). A detailed explanation of this method has been reported in previous studies [39]. The significance of each chemical component on the hardness is represented with the help of a pie chart, as shown in Figure 8.
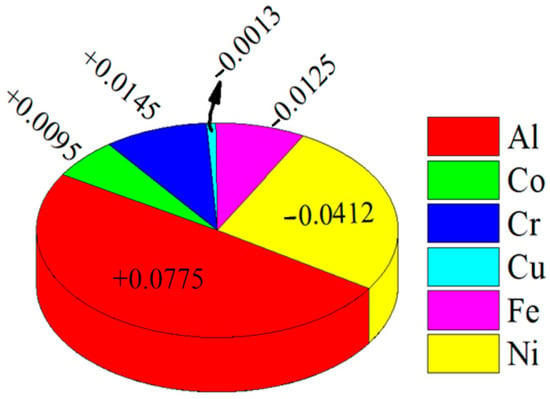
Figure 8.
The significance of chemical components with regard to the hardness of HEAs was estimated using the BPNN model.
According to Figure 8, among all the chemical components, Al shows a positive IRI value (+0.0775), which indicates that this element can lead to an increase in hardness value. On the other hand, Ni exhibits a strong negative impact (with an IRI value of –0.0412) and leads to a decline in the hardness value. The order of relative importance of the chemical components for the hardness value of AlCoCrCuFeNi HEAs can be summarized as “Al > Cr > Co > Cu> Fe > Ni”. Therefore, with the help of this method, one can clearly understand the influence of individual components on the hardness.
5. Conclusions
The results of the present work demonstrate that compared to the other ML models, the BPNN method is in good agreement with the predictions for both training and cross-validation datasets (99.54% and 96.39%, respectively). According to the correlating index values of the training, validation, and testing datasets, the backpropagation ML model can be used as a standalone unit for optimizing the multi-component concentration to achieve better mechanical properties. Furthermore, the model corroborated the hardness values of unknown datasets with considerable accuracy. The graphical user interface was developed to understand the influence of multi-component concentration on hardness, which can help to reduce the level of effort required for the experimentation. The model can also provide a huge number of virtual alloy systems within the given range of input variables. Finally, we determined the relative importance index of the components one can utilize to understand the hierarchical order of input variables on the output. The BPNN model proved to be a powerful tool for predicting HEA hardness, offering accurate results and reinforcing its suitability for data-driven materials design.
Author Contributions
N.G.S.R. and P.L.N. conceptualized the study. The methodology was developed by P.L.N. and M.I. The ANN model software was developed by N.G.S.R. and P.L.N., while validation was performed by A.K.M. and M.I. Formal analysis was conducted by P.L.N. and M.I., with investigation carried out by A.K.M. and U.M.R.P. Resources were provided by S.-W.C. and N.G.S.R. and data curation was handled by P.L.N. The original draft was written by U.M.R.P., A.K.M. and P.L.N., and reviewed and edited by N.G.S.R. and S.-W.C. Visualization was prepared by U.M.R.P. and M.I. The research was supervised by S.-W.C. and N.G.S.R. All authors have read and agreed to the published version of the manuscript.
Funding
This research received no external funding.
Data Availability Statement
All the data are available within the manuscript.
Conflicts of Interest
Author Seong-Woo Choi was employed by the company Mobility & IT Battery Development Center, LG Energy Solution R&D Campus. The remaining authors declare that the research was conducted in the absence of any commercial or financial relationships that could be construed as a potential conflict of interest.
Abbreviations
The following abbreviations are used in this manuscript:
| BPNN | Backpropagation neural network. |
| IRI | Index of relative importance. |
| HEA | High-entropy alloy. |
| FCC | Face centered cubic. |
| BCC | Body-centered cubic. |
| ML | Machine learning. |
References
- George, E.P.; Curtin, W.A.; Tasan, C.C. High entropy alloys: A focused review of mechanical properties and deformation mechanisms. Acta Mater. 2020, 188, 435–474. [Google Scholar] [CrossRef]
- Kaufmann, K.; Vecchio, K.S. Searching for high entropy alloys: A machine learning approach. Acta Mater. 2020, 198, 178–222. [Google Scholar] [CrossRef]
- Xie, J.; Zhang, S.; Sun, Y.; Hao, Y.; An, B.; Li, Q.; Wang, C.-A. Microstructure and mechanical properties of high entropy CrMnFeCoNi alloy processed by electopulsing-assisted ultrasonic surface rolling. Mater. Sci. Eng. A 2020, 795, 140004. [Google Scholar] [CrossRef]
- Ye, Y.F.; Wang, Q.; Lu, J.; Liu, C.T.; Yang, Y. High-entropy alloy: Challenges and prospects. Mater. Today 2016, 19, 349–362. [Google Scholar] [CrossRef]
- Lee, S.Y.; Byeon, S.; Kim, H.S.; Jin, H.; Lee, S. Deep learning-based phase prediction of high-entropy alloys: Optimization, generation, and explanation. Mater. Des. 2021, 197, 109260. [Google Scholar] [CrossRef]
- Zhang, Y.; Yang, X.; Liaw, P.K. Alloy Design and Properties Optimization of High-Entropy Alloys. JOM 2012, 64, 830–838. [Google Scholar] [CrossRef]
- Zhang, F.; Zhang, C.; Chen, S.L.; Zhu, J.; Cao, W.S.; Kattner, U.R. An understanding of high entropy alloys from phase diagram calculations. Calphad 2014, 45, 1–10. [Google Scholar] [CrossRef]
- Lederer, Y.; Toher, C.; Vecchio, K.S.; Curtarolo, S. The search for high entropy alloys: A high-throughput ab-initio approach. Acta Mater. 2018, 159, 364–383. [Google Scholar] [CrossRef]
- Rickman, J.M.; Chan, H.M.; Harmer, M.P.; Smeltzer, J.A.; Marvel, C.J.; Roy, A.; Balasubramanian, G. Materials informatics for the screening of multi-principal elements and high-entropy alloys. Nat. Commun. 2019, 10, 2618. [Google Scholar] [CrossRef]
- Schmidt, J.; Marques, M.R.G.; Botti, S.; Marques, M.A.L. Recent advances and applications of machine learning in solid-state materials science. NPJ Comput. Mater. 2019, 5, 83. [Google Scholar] [CrossRef]
- Zhou, Z.; Zhou, Y.; He, Q.; Ding, Z.; Li, F.; Yang, Y. Machine learning guided appraisal and exploration of phase design for high entropy alloys. NPJ Comput. Mater. 2019, 5, 128. [Google Scholar] [CrossRef]
- Ishtiaq, M.; Tariq, H.M.R.; Reddy, D.Y.C.; Kang, S.-G.; Reddy, N.G.S. Prediction of Creep Rupture Life of 5Cr-0.5Mo Steel Using Machine Learning Models. Metals 2025, 15, 288. [Google Scholar] [CrossRef]
- Chang, Y.-J.; Jui, C.-Y.; Lee, W.-J.; Yeh, A.-C. Prediction of the Composition and Hardness of High-Entropy Alloys by Machine Learning. JOM 2019, 71, 3433–3442. [Google Scholar] [CrossRef]
- Menou, E.; Tancret, F.; Toda-Caraballo, I.; Ramstein, G.; Castany, P.; Bertrand, E.; Gautier, N.; Díaz-Del-Castillo, P.E.J.R. Computational design of light and strong high entropy alloys (HEA): Obtainment of an extremely high specific solid solution hardening. Scr. Mater. 2018, 156, 120–123. [Google Scholar] [CrossRef]
- Wang, J.; Kwon, H.; Kim, H.S.; Lee, B.-J. A neural network model for high entropy alloy design. NPJ Comput. Mater. 2023, 9, 60. [Google Scholar] [CrossRef]
- Ishtiaq, M.; Tiwari, S.; Nagamani, M.; Kang, S.-G.; Reddy, N.G.S. Data-Driven ANN-Based Predictive Modeling of Mechanical Properties of 5Cr-0.5Mo Steel: Impact of Composition and Service Temperature. Crystals 2025, 15, 213. [Google Scholar] [CrossRef]
- Ishtiaq, M.; Tiwari, S.; Panigrahi, B.B.; Seol, J.B.; Reddy, N.S. Neural Network-Based Modeling of the Interplay between Composition, Service Temperature, and Thermal Conductivity in Steels for Engineering Applications. Int. J. Thermophys. 2024, 45, 137. [Google Scholar] [CrossRef]
- Wen, C.; Zhang, Y.; Wang, C.; Xue, D.; Bai, Y.; Antonov, S.; Dai, L.; Lookman, T.; Su, Y. Machine learning assisted design of high entropy alloys with desired property. Acta Mater. 2019, 170, 109–117. [Google Scholar] [CrossRef]
- Singh, S.; Wanderka, N.; Murty, B.S.; Glatzel, U.; Banhart, J. Decomposition in multi-component AlCoCrCuFeNi high-entropy alloy. Acta Mater. 2011, 59, 182–190. [Google Scholar] [CrossRef]
- Rashidi, A.; Sigari, M.H.; Maghiar, M.; Citrin, D. An analogy between various machine-learning techniques for detecting construction materials in digital images. KSCE J. Civ. Eng. 2016, 20, 1178–1188. [Google Scholar] [CrossRef]
- Cortes, C.; Vapnik, V. Support-vector networks. Mach. Learn. 1995, 20, 273–297. [Google Scholar] [CrossRef]
- Bottou, L. Large-Scale Machine Learning with Stochastic Gradient Descent. In Proceedings of COMPSTAT’2010; Springer Science & Business Media: Berlin/Heidelberg, Germany, 2010; pp. 177–186. [Google Scholar]
- MacKay, D.J.C. Bayesian Interpolation. Neural Comput. 1992, 4, 415–447. [Google Scholar] [CrossRef]
- Mackay, D.J.C. Probable networks and plausible predictions—A review of practical Bayesian methods for supervised neural networks. Netw. Comput. Neural Syst. 1995, 6, 469–505. [Google Scholar] [CrossRef]
- Crammer, K.; Dekel, O.; Keshet, J.; Shalev-Shwartz, S.; Singer, Y. Online Passive-Aggressive Algorithms. J. Mach. Learn. Res. 2006, 7, 551–585. [Google Scholar]
- Sen, P.K. Estimates of the Regression Coefficient Based on Kendall’s Tau. J. Am. Stat. Assoc. 1968, 63, 1379–1389. [Google Scholar] [CrossRef]
- Fernandes, A.C.P.; Fonseca, A.R.; Pacheco, F.A.L.; Fernandes, L.S. Water quality predictions through linear regression—A brute force algorithm approach. MethodsX 2023, 10, 102153. [Google Scholar] [CrossRef]
- Hastie, T.; Tibshirani, R.; Friedman, J. The Elements of Statistical Learning: Data Mining, Inference, and Prediction, 2nd ed.; Springer Series in Statistics; Springer: New York, NY, USA, 2009. [Google Scholar]
- Goodfellow, I.; Bengio, Y.; Courville, A.; Bengio, Y. Deep Learning; MIT Press: Cambridge, MA, USA, 2016; Volume 1. [Google Scholar]
- Sharma, N.; Ghosh, S.; Saha, M. Open Data for Sustainable Community: Glocalized Sustainable Development Goals; Springer: Singapore, 2021. [Google Scholar]
- Tung, C.-C.; Yeh, J.-W.; Shun, T.-T.; Chen, S.-K.; Huang, Y.-S.; Chen, H.-C. On the elemental effect of AlCoCrCuFeNi high-entropy alloy system. Mater. Lett. 2007, 61, 1–5. [Google Scholar] [CrossRef]
- Miracle, D.B.; Senkov, O.N. A critical review of high entropy alloys and related concepts. Acta Mater. 2017, 122, 448–511. [Google Scholar] [CrossRef]
- Yeh, J.-W.; Chen, S.-K.; Lin, S.-J.; Gan, J.-Y.; Chin, T.-S.; Shun, T.-T.; Tsau, C.-H.; Chang, S.-Y. Nanostructured High-Entropy Alloys with Multiple Principal Elements: Novel Alloy Design Concepts and Outcomes. Adv. Eng. Mater. 2004, 6, 299–303. [Google Scholar] [CrossRef]
- Koppoju, S.; Konduri, S.P.; Chalavadi, P.; Bonta, S.R.; Mantripragada, R. Effect of Ni on Microstructure and Mechanical Properties of CrMnFeCoNi High Entropy Alloy. Trans. Indian Inst. Met. 2020, 73, 853–862. [Google Scholar] [CrossRef]
- Tsai, M.-H.; Yeh, J.-W. High-Entropy Alloys: A Critical Review. Mater. Res. Lett. 2014, 2, 107–123. [Google Scholar] [CrossRef]
- Tong, C.-J.; Chen, Y.-L.; Yeh, J.-W.; Lin, S.-J.; Chen, S.-K.; Shun, T.-T.; Tsau, C.-H.; Chang, S.-Y. Microstructure characterization of Alx CoCrCuFeNi high-entropy alloy system with multiprincipal elements. Metall. Mater. Trans. A 2005, 36, 881–893. [Google Scholar] [CrossRef]
- Qin, G.; Xue, W.; Fan, C.; Chen, R.; Wang, L.; Su, Y.; Ding, H.; Guo, J. Effect of Co content on phase formation and mechanical properties of (AlCoCrFeNi)100-xCox high-entropy alloys. Mater. Sci. Eng. A 2018, 710, 200–205. [Google Scholar] [CrossRef]
- Tong, C.-J.; Chen, M.-R.; Yeh, J.-W.; Lin, S.-J.; Chen, S.-K.; Shun, T.-T.; Chang, S.-Y. Mechanical performance of the AlxCoCrCuFeNi high-entropy alloy system with multiprincipal elements. Metall. Mater. Trans. A 2005, 36, 1263–1271. [Google Scholar] [CrossRef]
- Reddy, N.S.; Panigrahi, B.B.; Ho, C.M.; Kim, J.H.; Lee, C.S. Artificial neural network modeling on the relative importance of alloying elements and heat treatment temperature to the stability of α and β phase in titanium alloys. Comput. Mater. Sci. 2015, 107, 175–183. [Google Scholar] [CrossRef]
Disclaimer/Publisher’s Note: The statements, opinions and data contained in all publications are solely those of the individual author(s) and contributor(s) and not of MDPI and/or the editor(s). MDPI and/or the editor(s) disclaim responsibility for any injury to people or property resulting from any ideas, methods, instructions or products referred to in the content. |
© 2025 by the authors. Licensee MDPI, Basel, Switzerland. This article is an open access article distributed under the terms and conditions of the Creative Commons Attribution (CC BY) license (https://creativecommons.org/licenses/by/4.0/).