Article

Ammonia Content in Natural Taranakite: An Experimental Study of Thermal Stability

1
Department of Chemistry and Industrial Chemistry (DCCI), University of Genoa, Via Dodecaneso 31, 16146 Genova, Italy
2
Istituto Italiano di Tecnologia, Via Morego 30, 16163 Genoa, Italy
3
Department for the Earth, Environment and Life Sciences (DISTAV), University of Genoa, Corso Europa 26, 16132 Genoa, Italy
*
Author to whom correspondence should be addressed.
Crystals 2025, 15(4), 378; https://doi.org/10.3390/cryst15040378
Submission received: 30 March 2025 / Revised: 17 April 2025 / Accepted: 18 April 2025 / Published: 20 April 2025
(This article belongs to the Special Issue Layered Materials and Their Applications)

Abstract

:
Taranakite is a mineral consisting of a hydrated layered aluminum phosphate, with the formula K3Al5(PO3OH)6(PO4)2·18H2O; its structure belongs to the R-3C group. If the mineral grows in an environment rich in bat and bird guano, the high nitrogen guano content induces the intercalation of NH4+ into the structure, replacing the potassium ion. The thermal decomposition of guano-derived taranakite releases water and ammonia. The aim of this work is to confirm the presence of ammonium in the guano-derived taranakite. Thermogravimetric analysis (TGA) was performed on taranakite collected in Pollera Cave (Liguria), and the gases evolved during its decomposition were analyzed by Fourier-transform infrared (FT-IR) spectroscopy. All the samples were characterized before and after thermal analysis by means of powder X-ray diffractometry (PXRD) and scanning electron microscopy (SEM). The release of crystallization water occurs at a temperature below 200 °C; further ammonia can be detected above 200 °C.

1. Introduction

Taranakite (K3Al5(PO3OH)6(PO4)2·18H2O) is a hydrated layered aluminum phosphate that crystallizes in the trigonal system (R-3C). Its occurrence in nature was first documented as an alteration product of andesitic rocks which interacted with seabird guano on the Sugar Loaf Islands (Taranaki region, New Zealand) [1]. The unit cell of taranakite consists of six layers, with composition K3Al5(PO3OH)6(PO4)2·12H2O, alternated with six interlayers with composition 6H2O. This peculiar structural configuration results in a very large unit cell (V ≈ 6234 Å3) whose parameter c is equal to ~95.05 Å, proving to be one of the longest known lattice constants in the mineral kingdom [2]. The formation of natural taranakite in caves, as a reaction product between bat guano and detrital silicates, has been reported widely throughout the world [3]; moreover, it is also known to occur in highly concentrated fertilizer bands [4]. In natural contexts, the K+ ion end member of the taranakite lattice is the only known one, but it can often be NH4-bearing [5,6] due to the high content of nitrogen in the guano of bats and birds from which it is derived. Although not recognized as a valid mineral species, the ammonium analog of taranakite—(NH4)3Al5(PO3OH)6(PO4)2·18H2O, often referred to as NH4-taranakite—has been considered within experimental works devoted to the study of phosphorous and nitrogen fixation mechanisms in soils affected by heavy use of fertilizers [7].
Between the 1950s and 1960s, various authors carried out experimental works that contributed to improving knowledge about the formation mechanisms of taranakite. Kittrick and Jackson [8] observed that the reaction between kaolinite and a 1 M K3PO4 solution at room temperature resulted in the formation of taranakite after 23 months. Tamimi et al. [9] and later Liu et al. [10] exposed a variety of soil samples from Hawaii islands to ammonium phosphate- and potassium phosphate-rich solutions, respectively; both research groups verified the efficient and rapid formation of taranakite and postulated that the heavy use of phosphate fertilizers in clay-rich natural soils would lead to the fixation of phosphate in the form of taranakite or NH4-bearing taranakite. Zhou et al. [11] and Liu et al. [10] studied the perturbation effects of iron on the formation of NH4-taranakite. Meyer et al. [7], by combining thermodynamic modeling, synchrotron-based XANES, and sequential extraction experiments, concluded that taranakite and NH4-taranakite are two of the most important Al-P phases that regulate the availability of phosphorus in the volume of soil directly altered by fertilizers [12,13,14], as well as the bioavailability of potassium [15].
The use of taranakite to improve the properties of polystyrene-based flame retardants [16] and to be a precursor in the low-temperature synthesis of the microporous structure AlPO4-15 [13] has also been studied. Moreover, its involvement with the retarding hydration of cements has been studied [17]. For all the above, the knowledge of the amount of ammonium in the taranakite lattice, along with its position in the lattice, allows both the planning of possible uses of the mineral and the forecasting of its environmental impacts.
Under heating, taranakite undergoes a first mass loss of six interlayer water molecules at about 125 °C. The obtained structure, solved by Dick and Zeiske [18] using SC-XRD and Neutron Powder Scattering, is deprived of the interlayers and is held together by hydrogen bonds between the interlayers. This phase was also documented to occur in nature and it is named francoanellite, in honour of Franco Anelli, former speleologist and discoverer of the Castellana Caves, where the mineral was first found [19]. A second dehydration step is reported to take place at about 180 °C, leading to the complete amorphization of the material.
The aim of this work is to contribute to the current knowledge regarding the thermal stability of natural taranakite and the rate of release of nitrogen at varying temperatures, by using thermogravimetric analysis coupled with Fourier-transform infrared spectroscopy of the evolved gases. Thermal analysis is widely used in the study of minerals, both natural and synthesized, for specific purposes [20,21]. Thermogravimetry is a common technique to characterize water-containing minerals and analyze the product due to the loss of crystallization water [22]. This is fundamental to better assess how taranakite regulates the cycle of phosphorus and nitrogen in heavily fertilized soils at varying conditions [23]. Moreover, it can be useful in the design of laboratory procedures for the preparation of soil samples requiring oven drying, during which unexpected increases in NH4+ availability from inorganic sources were documented and, while not fully understood, hypothetically linked to the presence of NH4-taranakite [24].

2. Materials and Methods

2.1. Sample Preparation

The samples employed for this study were collected from a cave in northwestern Italy (Pollera Cave—Liguria). At the site, taranakite occurs as white powdery aggregates at the contact between a subfossil deposit of bat guano and clay sediments. The samples, previously stored in a sealed plastic container, were dried at room temperature for a few days, purified under the binocular microscope, and ground in an agate mortar. The samples have been characterized by X-ray diffraction before and after the thermal analysis.

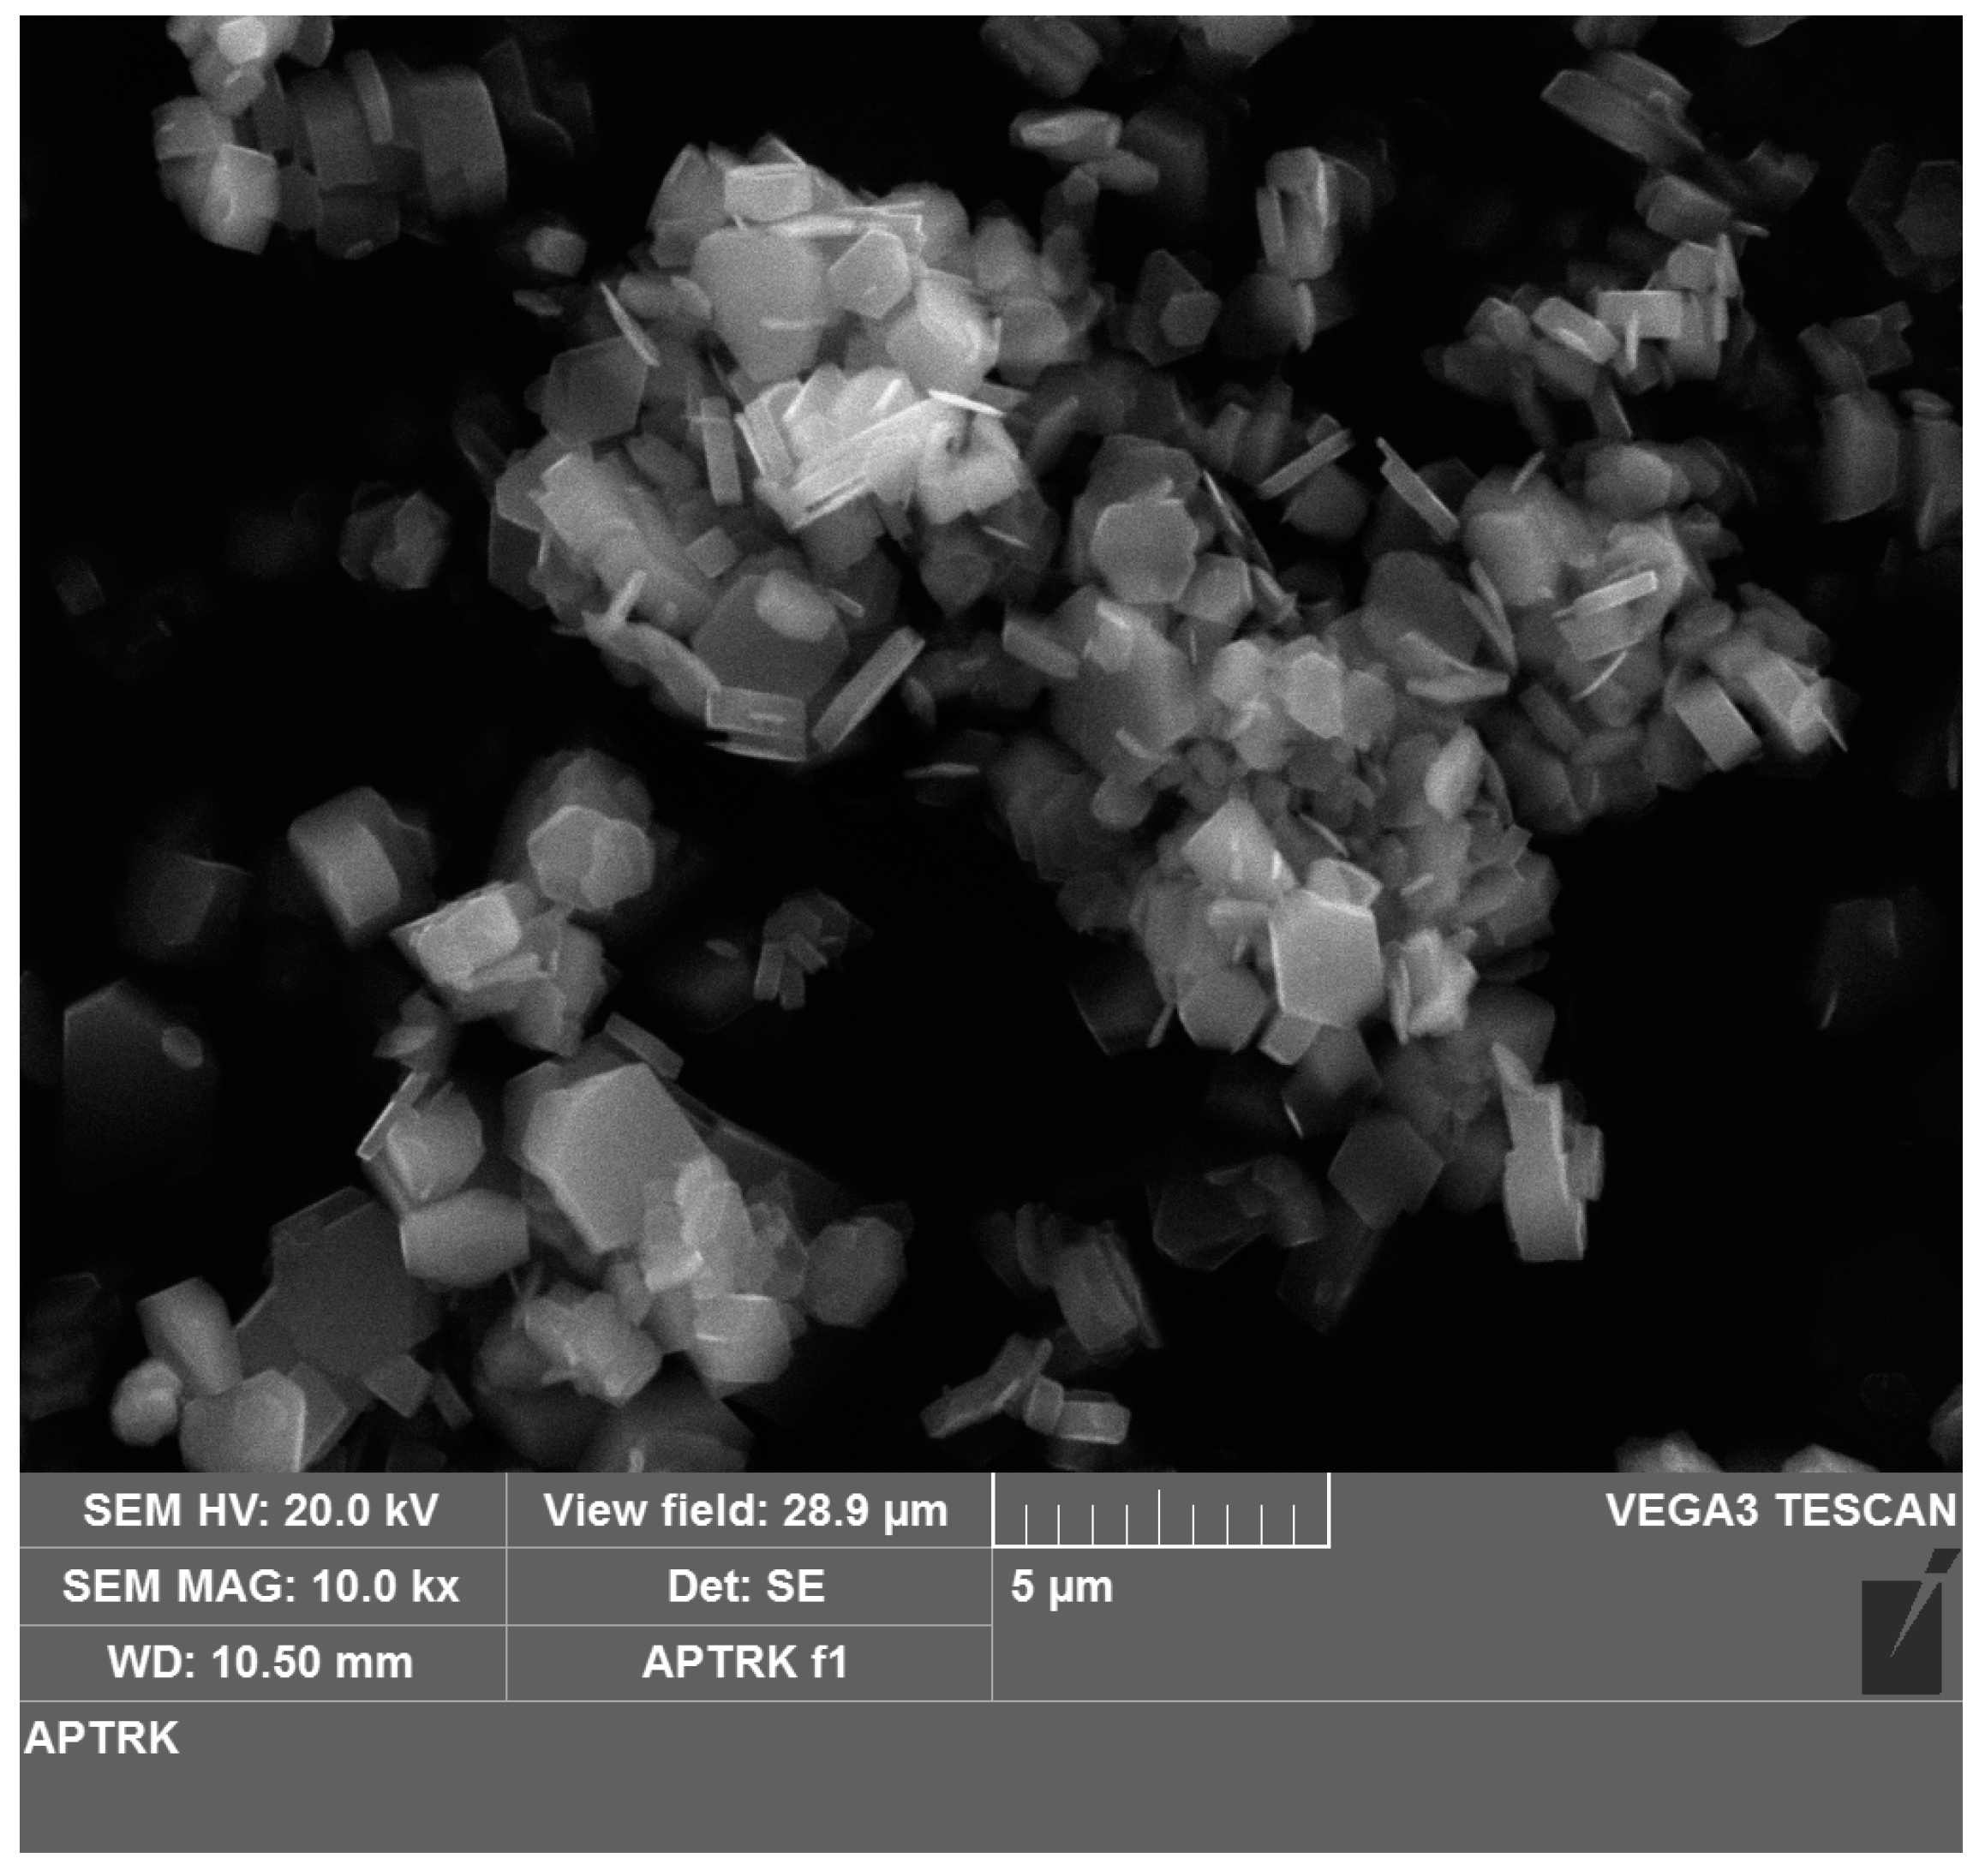
2.2. Scanning Electron Microscopy (SEM)

Scanning electron microscopy (SEM) observations were conducted using an SEM Vega3—Tescan type LMU, equipped with an APOLLO XSDD—EDAX detector with a DPP3 type analyzer (AMETEK (Berwyn, PA 19312, USA)), operated at 15 kV accelerating voltage, 2–15 nA beam current, and with a 10–25 µm beam diameter.

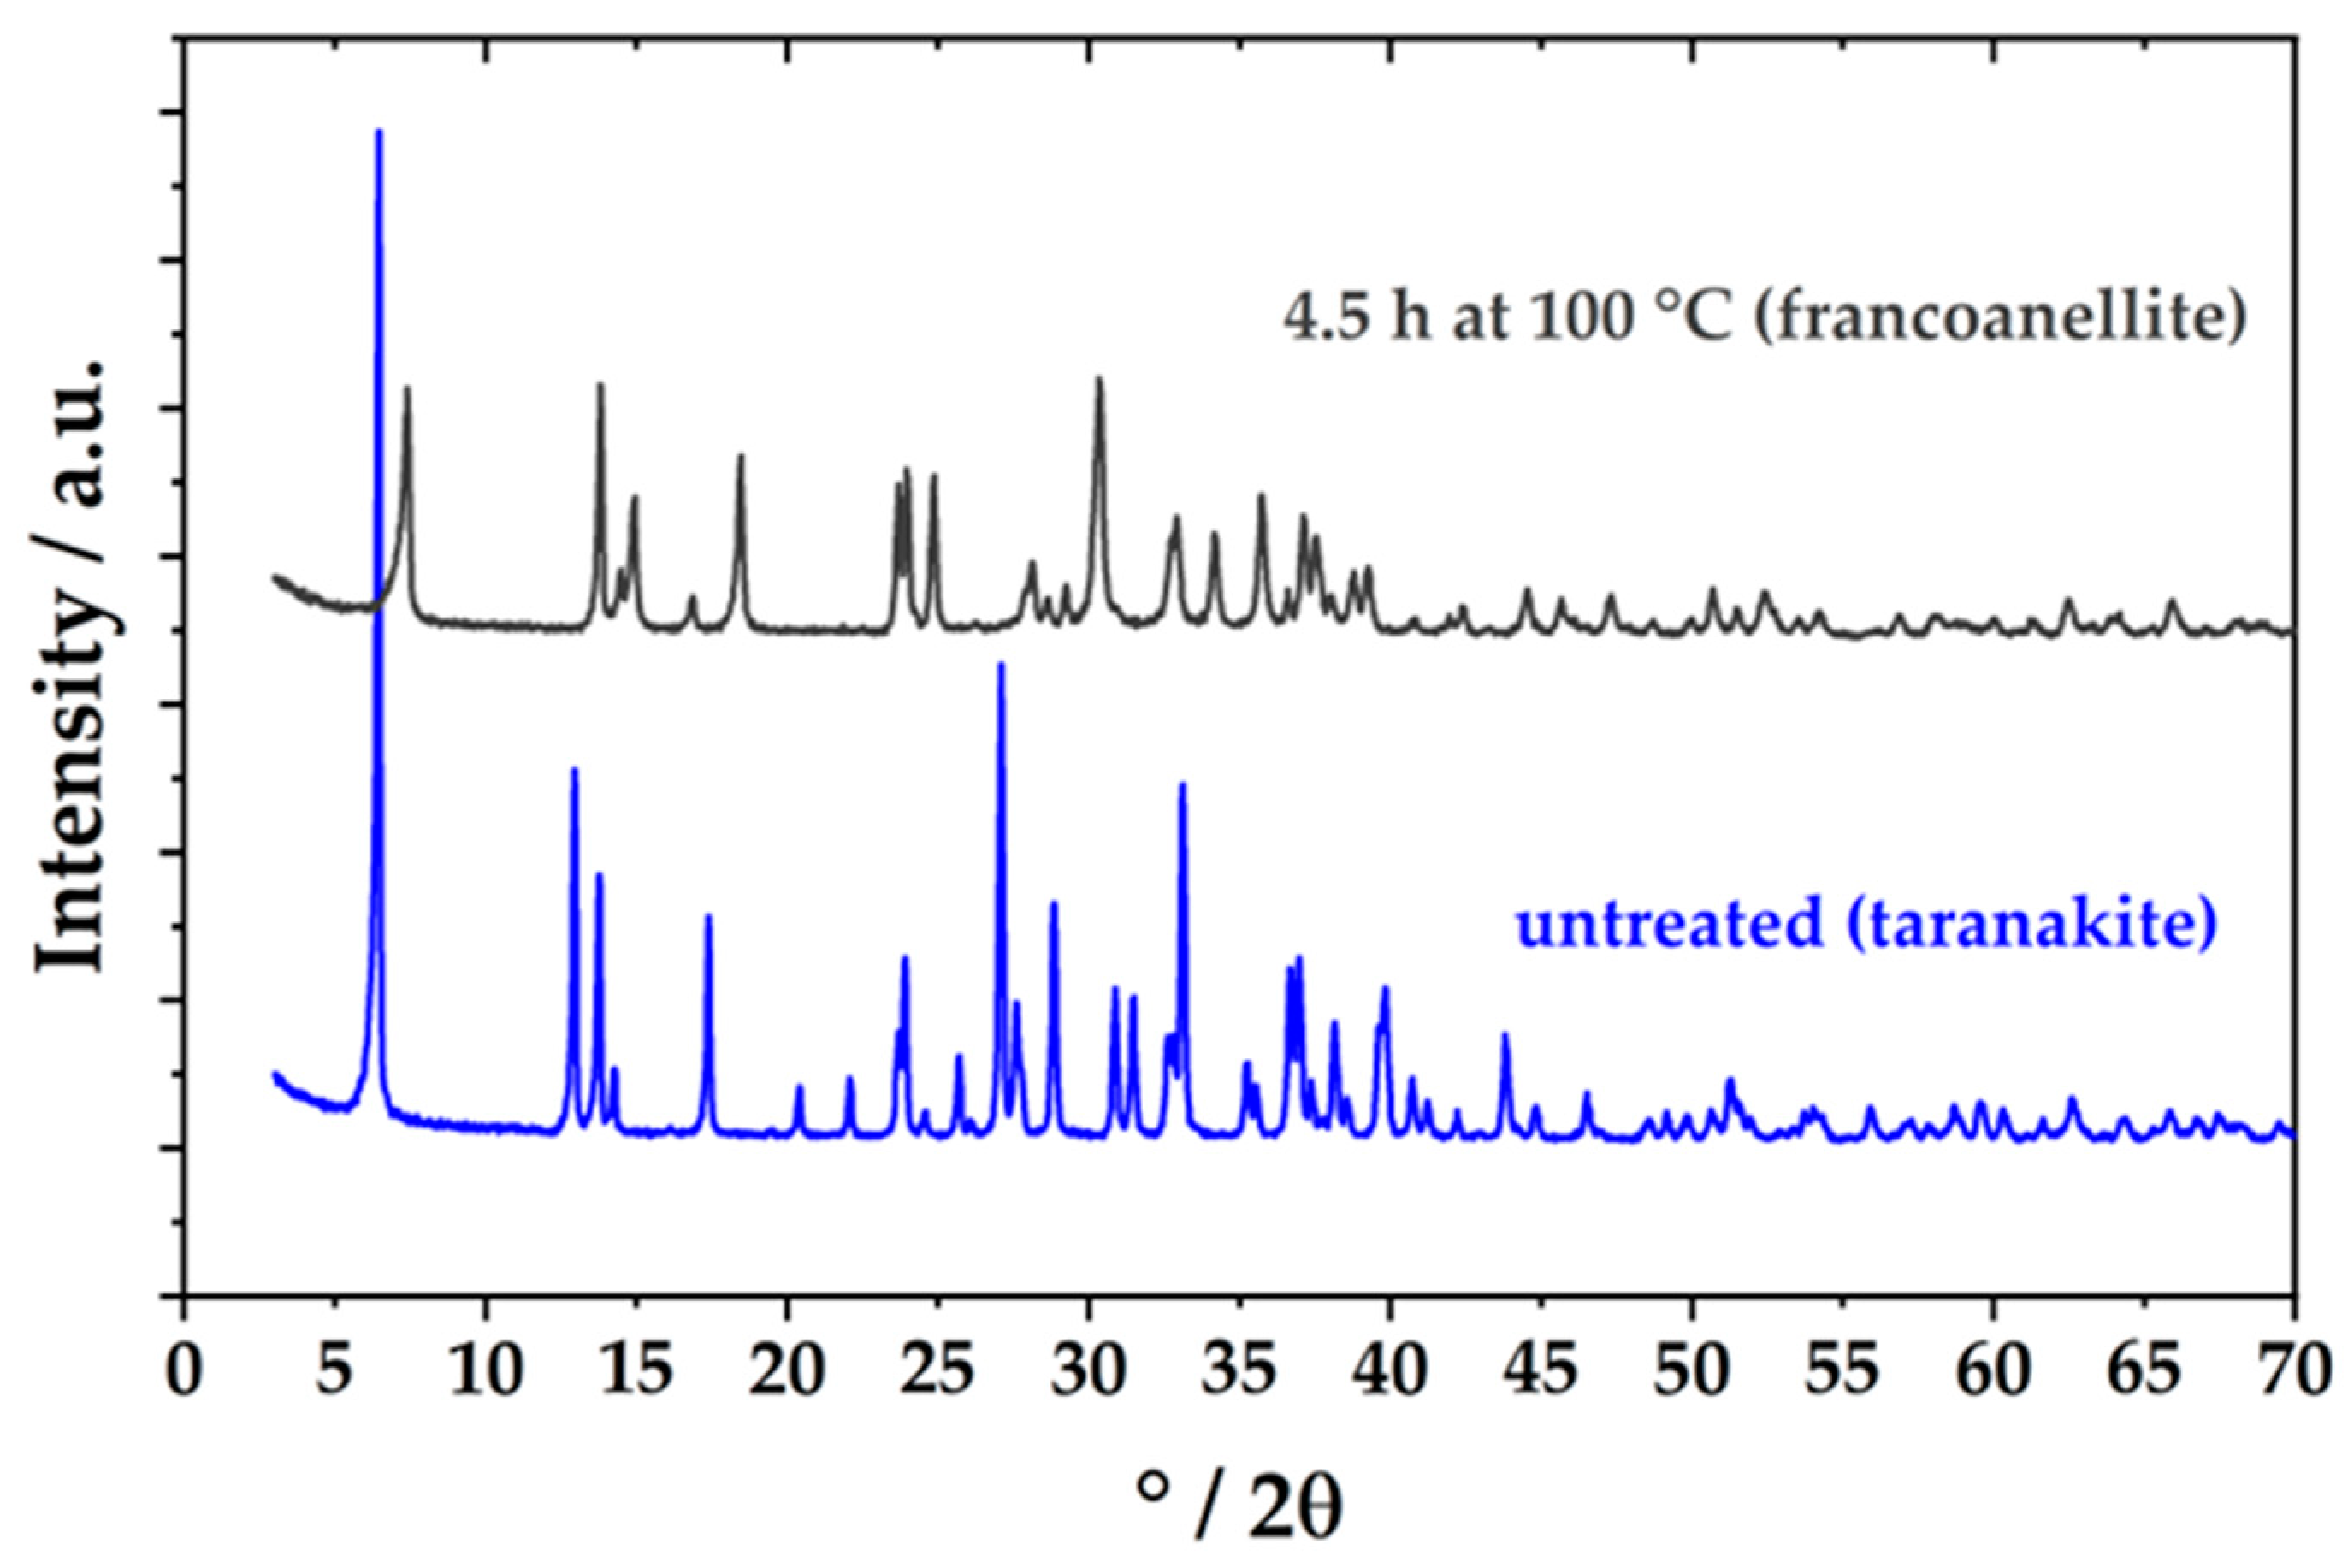
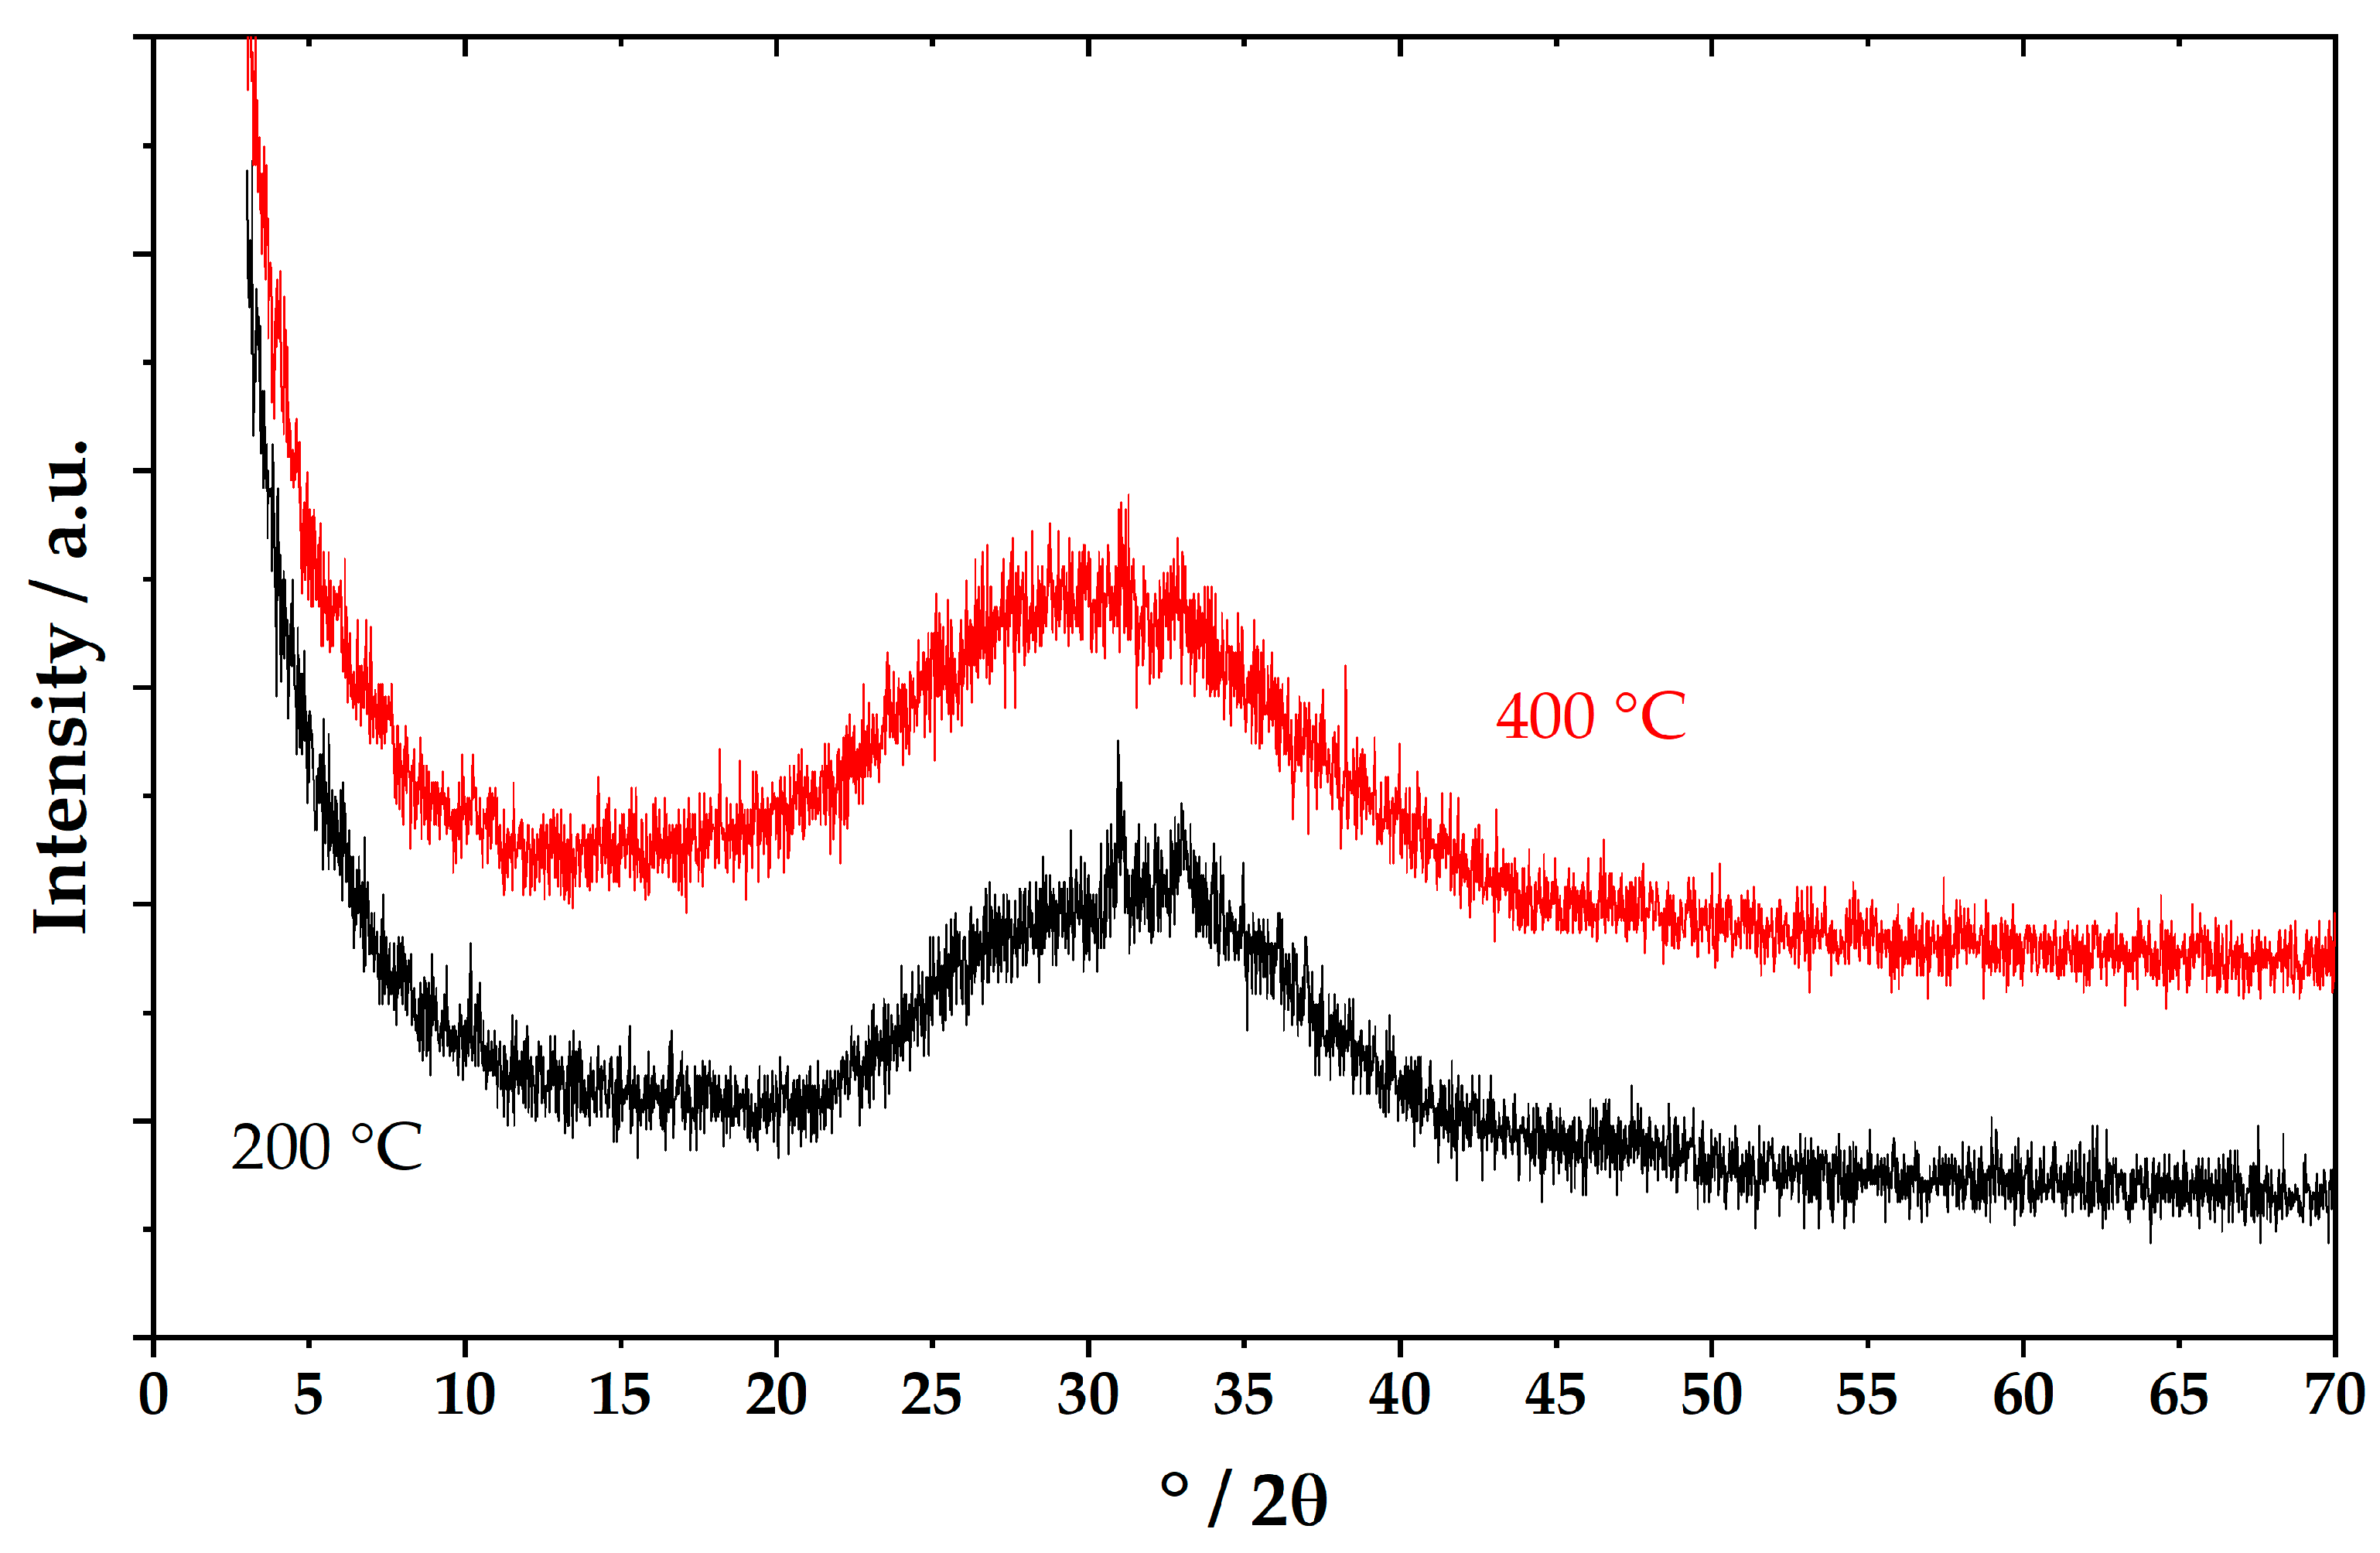
2.3. Powder X-Ray Diffraction (PXRD)

As the powder X-ray diffraction analysis (PXRD), the obtained powder was front-loaded on a Panalytical Si low-background sample holder. Data collection was carried out using a Philips (Amsterdam, The Netherlands) PW3710 diffractometer working at 40 kV and 20 mA, equipped with a Co anode (Co Kα = 1.78901 Å), a 173 mm radius goniometer, an Fe filter, and a 0-D proportional counter, in the angular range 3–70° 2θ, with a step size of 0.02° and a scan time per step of 2 s. The incident beam was directed using a 1° fixed divergence slit and 0.04 rad Soller slits, while the diffracted beam path was equipped with a 0.2 mm receiving slit, 0.04 rad Soller slits, and a 1° anti-divergence slit. Phase identification was performed using the X’Pert HighScore software and the diffraction patterns from the PDF-2 database and the Crystallography Open Database [25]. X-ray diffraction data were refined by the Rietveld method using Profex [26] in order to derive lattice parameters of natural taranakite and of francoanellite obtained from its thermal treatment.

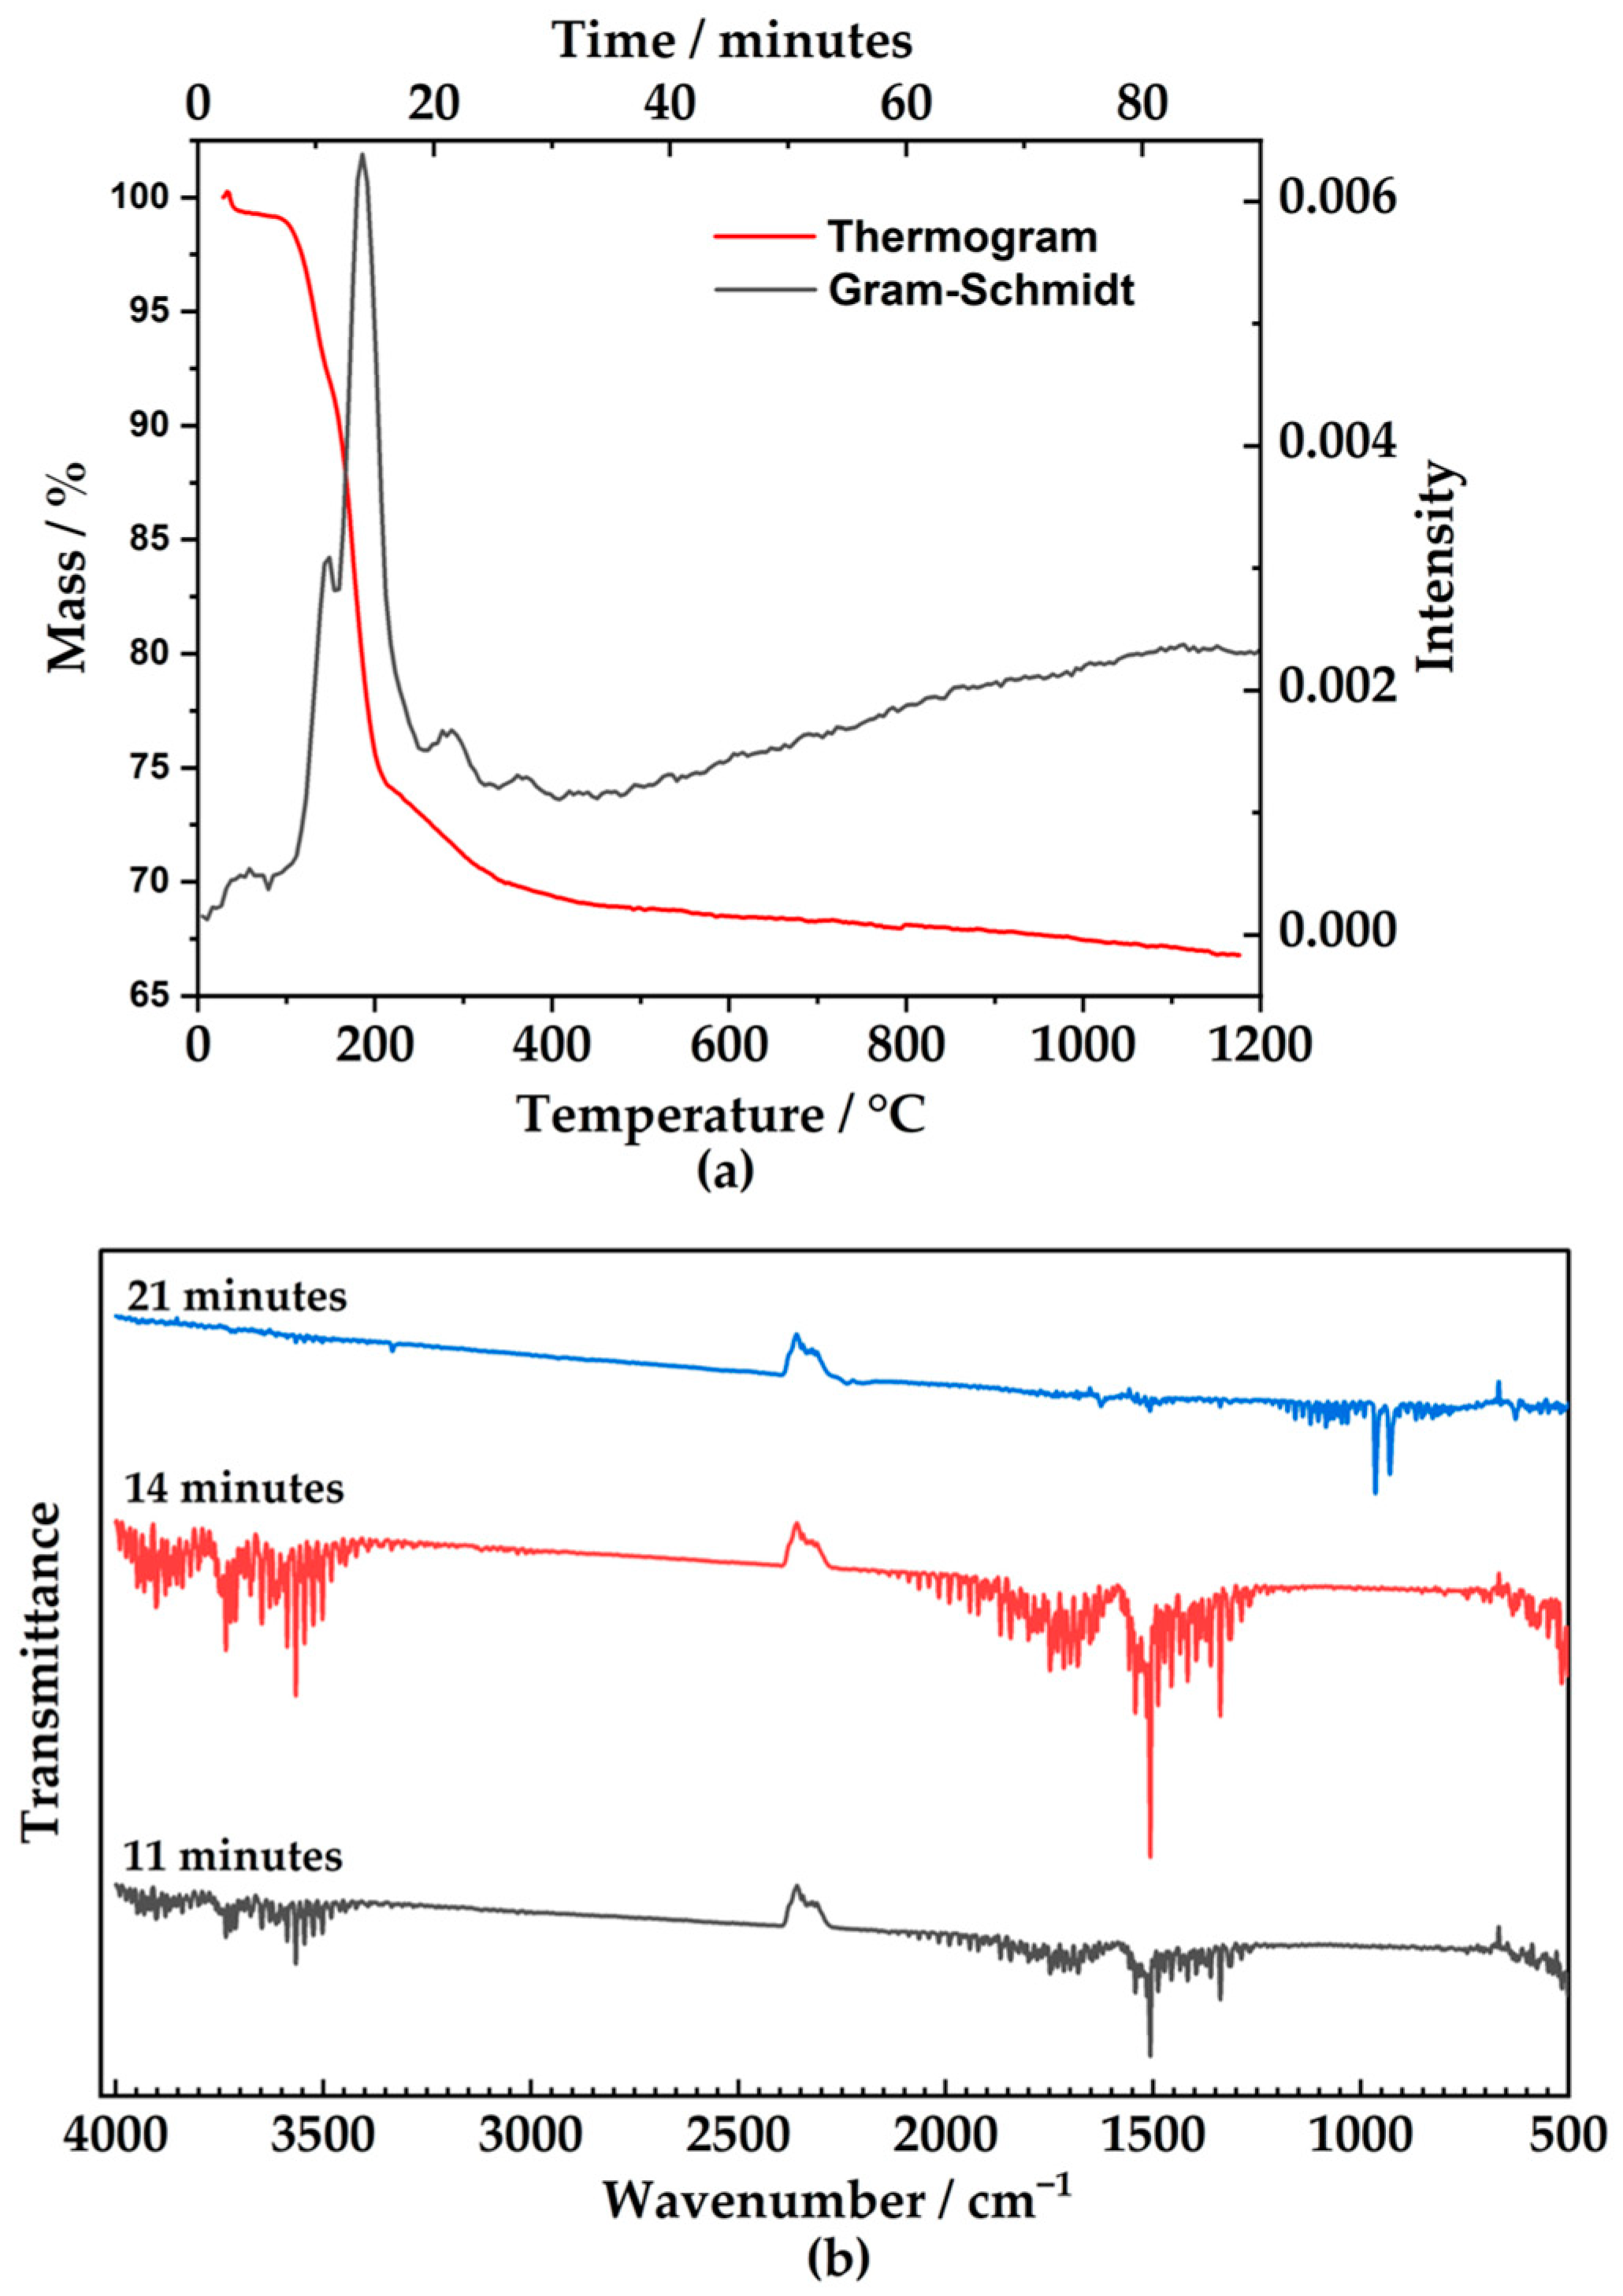
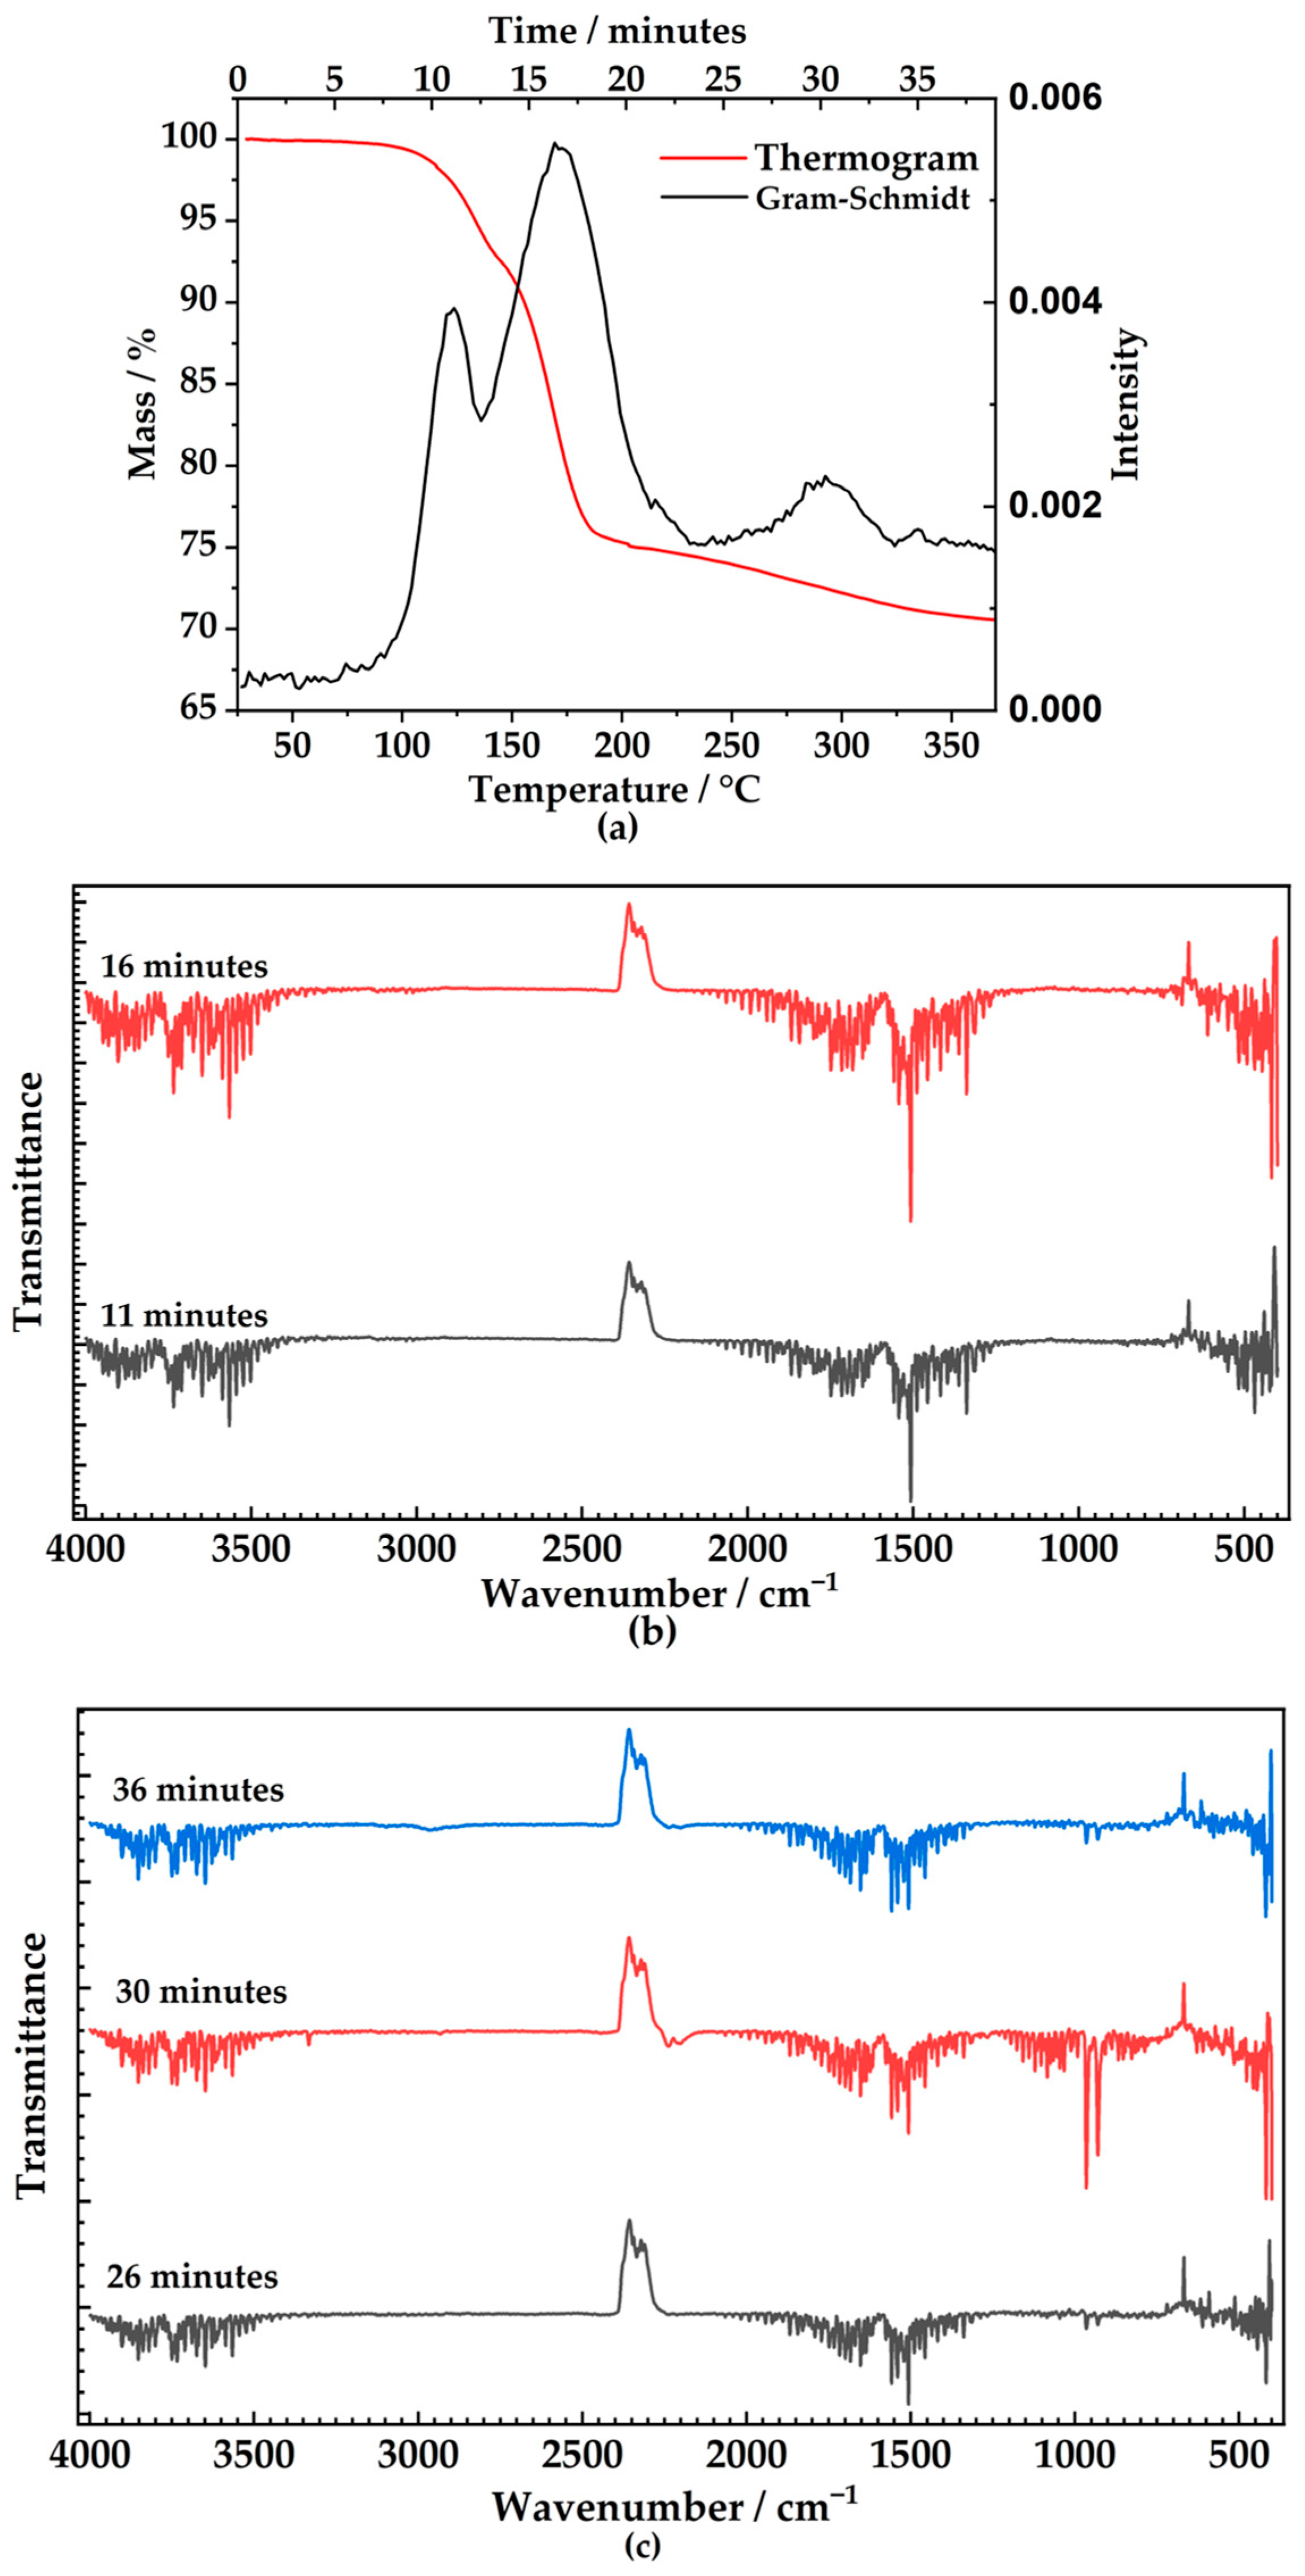
2.4. Thermogravimetric Analysis and Coupled Infra-Red Spectra on Exhaust Gases

An apparatus H/LABSYSEVO-1A SETARAM (Automation, Milan, Italy) was used to carry out the thermogravimetric analyses at different heating rates. The thermocouple calibration was performed with high-purity elements such as Ag and Au. The temperature accuracy was estimated to be within 0.5% of the measured value. The measurements occurred in alumina open crucibles under an Argon flux of 50 mL/min. Thermal analysis was designed under three different experimental conditions: one experiment performed from room temperature to 1200 °C employed a constant heating rate of 15 °C/min; a second procedure ranging from room temperature to 200 °C at 15 °C/min, and a third measure was carried out with heating up to 400 °C applying a heating rate of 15 °C/min (from room temperature to 150 °C and from 215 °C to 400 °C), while a slower heating rate of 5 °C/min was used from 150 °C to 215 °C.
Infra-red spectra of the exhaust gases were recorded with a ThermoFischer Nicolet iS20 apparatus (Thermo Fisher Scientific Inc., Monza, Italy). Each spectrum was collected with 8 scans and a wavenumber resolution of 4 cm−1. The Gram–Schmidt (GS) curve was recorded as a function of time, and each point corresponds to a spectrum collected. The intensity in the GS signals depends on the amount of gas evolved in comparison to the background. The multicomponent analysis of the gases released during heating has been carried out with OMNIC software [27].

3. Results and Discussion

The thermal behavior of Taranakite has been studied, combining thermogravimetry with the spectroscopic analysis of the gases produced, for a deeper understanding of NH3 release during heating. The starting mineral has been characterized by SEM and PXRD. Figure 1 shows the SEM image recorded on the guano-derived taranakite sample. The sample appears monomineralic, with small pseudohexagonal taranakite crystals aggregated (mean diameter ≈ 3 µm) in uneven nodules.
The PXRD characterization is discussed in the following. As aforementioned, natural ammonium-bearing taranakite minerals are common in bat and bird guano; the presence of ammonium in taranakite can be detected by identifying ammonia by FTIR spectroscopy in the gases released during the thermal decomposition. A thermogravimetric analysis of FeNH4(SO4)2 was performed as a reference, as its decomposition is expected to evolve ammonia [28]. The results are reported in Figure S1 (see Supporting Information).
Figure 2 summarizes the experiment performed on ammonium-bearing taranakite heating up to 1200 °C, at a constant heating rate of 15 °C/min. The different steps of mass decrease will be discussed.
The first mass loss, ranging from 80 to 140 °C, is due to a 6% mass loss of water. The heating induces the release of water, as shown in the FT-IR spectrum collected at 11 min (black line) in Figure 2b. The peaks clusters in the range 3400–3700 cm−1 and 1200–2000 cm−1 are diagnostic of the O-H stretching in the gaseous phase. In this transition, we estimated an approximate loss of 6 mols of water (see Table 1), leading to the formation of francoanellite. In Figure 3 (black line), the X-ray diffraction pattern of the taranakite sample after thermal treatment at 100 °C for 4.5 h is reported, which confirms the francoanellite formation. The unit cell parameters of francoanellite obtained by Rietveld refinement of the PXRD data are a = 8.70048(47) Å, c = 82.2910(67) Å, V = 5294.15(82) Å3. The blue line in Figure 3 shows the PXRD pattern of the starting taranakite sample; the unit cell parameters of taranakite, calculated by means of Rietveld refinement of the PXRD data, are a = 8.71309(25) Å, c = 95.0142(42) Å, V = 6246.89(49) Å3.
The second thermal effect occurs between 141 °C and 215 °C. Similarly to the previous transition, the mineral loses water, at a time of 14 min, and corresponding to the second signal in the Gram–Schmidt curve. This mass loss is higher than the previous one; in this case, we estimated a loss of 12 mols of water (see Table 1), which leads to the formation of an amorphous phase. Finally, the presence of ammonium-bearing taranakite is confirmed from the FT-IR spectrum recorded at 21 min. The spectrum, corresponding to the 4% mass loss in the range 200–300 °C, shows two peaks at 929–964 cm−1, related to the H-N-H vibration, revealing the presence of structural ammonium in the sample. The same peaks were found in the spectra of the gas released during the decomposition of the salt we used as a standard (see Figure S1). This indicates the presence of ammonium in guano-derived taranakite collected in the Pollera Cave. The AlPO4 resulting from the thermal treatment was analyzed by PXRD, which is reported in Figure S2 and discussed in depth in the Supporting Information [29].
For the purpose of estimating the amount of ammonia mols in the mineral with the aim to completely discriminate the release of water and ammonia, two thermal treatments have been set up by changing some experimental conditions: the first one was performed up to 200 °C and the second one up to 400 °C at different heating rates.
Figure 4a shows the thermograms and the related Gram–Schmidt of the experiment carried out until 200 °C. The spectra recorded at the maximum signal in the Gram–Schimdt at 10 and 14 min, respectively, are reported in Figure 4b.
It is worth noting that the gas evolved by this thermal decomposition of taranakite does not contain ammonia, confirming that its release occurs above 200 °C. The spectra show the typical vibrations of water in the vapor phase, with two clusters in the range 3400–3700 cm−1 and 1200–2000 cm−1 due to the presence of O-H stretching. The release of ammonia above 200 °C is confirmed by the experiments carried out up to 400 °C, as shown in Figure 5.
As previously discussed in the experiment carried out up to 1200 °C, taranakite shows two massive water losses in the temperature range 25–200 °C, as shown in the black and red lines in Figure 5b. Figure 5c reports the details of the 4% mass loss, occurring above 200 °C, that is partially due to the release of ammonia. The three FT-IR spectra reported follow the Gram–Schmidt band centered at 30 min, and all three patterns show the typical H-N-H vibration. The sequence of the three FT-IR patterns in Figure 5c allows us to describe the ammonia release range located between 240 and 325 °C. From this analysis, the number of mols of the gas released during the thermal decomposition was estimated and they are reported in Table 1.
The ratio between the gas mols and the taranakite mols for the first mass losses shows clearly the transition from francoanellite and the amorphous phase, respectively. Omnic specta software (Thermo Fisher Scientific) allowed us to estimate the average amount of ammonia in the gas released during the thermal decomposition starting at 202 °C. The ratio of ammonia mols with respect to the initial mols of taranakite suggests that about 1 mol of ammonium replaces potassium in the taranakite. In the same thermal step, 2 mols of water evolved, leading to a total number of water mols of 20 instead of the 18 expected. The differences in the estimation of the water mols could probably be due to humidity, which affects the amount of water released during the first mass loss.
X-ray powder diffraction data collected on the products of thermal treatment resulting from TG-DTA analysis up to 200 °C and 400 °C confirm the complete amorphization of the material, indicated by the presence of a broad low-intensity peak centered at about 31° 2θ (Figure 6).

4. Conclusions

The thermal behavior of guano-derived taranakite has been studied and investigated by analyzing the gases released during the thermal decomposition of taranakite, along with its structural and morphological characteristics with XRPD and FESEM measurements, respectively. The presence of ammonium in this mineral has been confirmed. Taranakite initially loses crystallization water, as shown in the spectra recorded on the gas released below 200 °C. However, by increasing the temperature above 200 °C, the release of ammonia from taranakite occurs. The presence of ammonia in the evolved gases is corroborated by the two characteristic peaks below 1000 cm−1 due to the H-N-H vibrations.
Moreover, the complete amorphization of the structure has already occurred at this temperature, as demonstrated by the PXRD pattern collected after 200 °C thermal treatment, proving that the role of ammonium does not affect the crystallinity of the compound, but only the crystallization water is responsible for the crystal structure of the mineral. These results suggest that the ammonium cation substitutes for the potassium cation in the structure.

Supplementary Materials

The following supporting information can be downloaded at https://www.mdpi.com/article/10.3390/cryst15040378/s1; Figure S1: (a) Thermogram (red curve) and Gram–Schmidt curve (black curve) in the experiment performed on FeNH4(SO4)2. (b) Spectra recorded in correspondence with the maximum of the peaks of the Gram–Schmidt. The spectra were recorded at 33 min (black curve), 39 min (red curve), and 47 min (blue curve); Figure S2: C: peaks assigned to orthorombic AlPO4 isotypic with cristobalite [29,30]; T: peaks assigned to triclinic AlPO4 isotypic with tridymite [31]. Table S1. Summary of the trasmittance and wavenumber of the spectra collected; Table S2. Peak information from X-ray powder diffraction experiments. Only peaks with relative intensity > 4% are reported.

Author Contributions

Conceptualization, Y.G. and M.C.; methodology, A.M.C. and M.C.; software, Y.G. and M.C.; validation, Y.G., M.C., C.C. and A.M.C.; formal analysis, Y.G., M.C., C.C. and A.M.C.; investigation, Y.G., M.C. and A.M.C.; resources, C.C. and A.M.C.; data curation, Y.G., M.C. and A.M.C.; writing—original draft preparation, Y.G. and M.C.; writing—review and editing, Y.G., M.C., C.C. and A.M.C.; visualization, Y.G., M.C., C.C. and A.M.C.; supervision, C.C. and A.M.C.; project administration, Y.G., M.C., C.C. and A.M.C.; funding acquisition, C.C. and A.M.C. All authors have read and agreed to the published version of the manuscript.

Funding

This research received no external funding.

Data Availability Statement

The data presented in this study are available on request from the corresponding author.

Conflicts of Interest

The authors declare no conflicts of interest.

Abbreviations

The following abbreviations are used in this manuscript:
SEMScanning electron microscopy
PXRDPowder X-ray diffractometry
TG-DTAThermogravimetry differential thermal analysis
FT-IRFourier transform infrared spectroscopy

References

  1. First Taranakite Report. In NZ Exhibition, 1865 Reports and Awards of the Jurors with Hector and Skey. 1865, pp. 423–425. Available online: https://books.google.it/books?id=icIRAAAAYAAJ&ie=ISO-8859-1&redir_esc=y (accessed on 1 July 2024).
  2. Dick, S.; Gobner, U.; Weib, A.; Robl, C.; Grobmann, G.; Ohms, G.; Zeiske, T. Taranakite-the Mineral with the Longest Crystallographic Axis. Inorganica Chim. Acta 1998, 269, 47–57. [Google Scholar] [CrossRef]
  3. Giurgiu, A.; Onac, B.P.; Tămaş, T.; Fornós, J.J.; Giurgiu, A.M. Evolution of Guano under Different Environmental Conditions: A Mineralogical Approach. In Proceedings of the 16th International Congress of Speleology, Brno, Czech Republic, 21–28 July 2013; Volume 3, pp. 483–485. [Google Scholar]
  4. Prabhudesai, S.S.; Kadrekar, S.B. Reaction Products from Fertilizer Phosphorus in Lateritic Soils of Konkan Region. J. Indian. Soc. Soil Sci. 1984, 32, 52–56. [Google Scholar]
  5. Audra, P.; De Waele, J.; Bentaleb, I.; Chroňáková, A.; Krištůfek, V.; D’Angeli, I.M.; Carbone, C.; Madonia, G.; Vattano, M.; Scopelliti, G.; et al. Guano-Related Phosphate-Rich Minerals in European Caves. Int. J. Speleol. 2019, 48, 75–105. [Google Scholar] [CrossRef]
  6. Dumitraş, D.G.; Marincea, Ş. Leucophosphite and Associated Minerals in the Fossil Bat Guano Deposit in Gaura cu Muscă Cave, Locvei Mountains, Romania. Minerals 2025, 15, 180. [Google Scholar] [CrossRef]
  7. Meyer, G.; Bell, M.J.; Lombi, E.; Doolette, C.L.; Brunetti, G.; Novotny, E.H.; Klysubun, W.; Zhang, Y.; Kopittke, P.M. Phosphorus Speciation in the Fertosphere of Highly Concentrated Fertilizer Bands. Geoderma 2021, 403, 115208. [Google Scholar] [CrossRef]
  8. Kittrick, J.A.; Jackson, M.L. Electron-microscope observations of the reaction of phosphate with minerals, leading to a unified theory of phosphate fixation in soils. J. Soil Sci. 1956, 7, 81–88. [Google Scholar] [CrossRef]
  9. Tamimi, Y.N. Reaction of Ammonium Phosphate with Gibbsite and Clays. Ph.D. Thesis, University of Hawaii, Honolulu, HI, USA, 1964. [Google Scholar]
  10. Liu, C.; Huang, P.M.; Zhou, J.M. Residence Time Effect on Iron Perturbation of Taranakite Formation. Soil Sci. Soc. Am. J. 2002, 66, 109–116. [Google Scholar] [CrossRef]
  11. Zhou, J.M.; Liu, C.; Huang, P.M. Perturbation of Taranakite Formation by Ferrous and Ferric Iron under Acidic Conditions. Soil Sci. Soc. Am. J. 2000, 64, 885–892. [Google Scholar] [CrossRef]
  12. Schwieger, W.; Meyer Zu Altenschildesche, H.; Kokotailo, G.T.; Fyfe, C.A. Low Temperature Syntheses of Highly-Ordered Framework Materials: The Aluminium Phosphate Ammonium Taranakite. Z. Für Anorg. Und Allg. Chem. 1998, 624, 1712–1717. [Google Scholar] [CrossRef]
  13. Meyer, G.; Bell, M.J.; Doolette, C.L.; Brunetti, G.; Zhang, Y.; Lombi, E.; Kopittke, P.M. Plant-Available Phosphorus in Highly Concentrated Fertilizer Bands: Effects of Soil Type, Phosphorus Form, and Coapplied Potassium. J. Agric. Food Chem. 2020, 68, 7571–7580. [Google Scholar] [CrossRef]
  14. Murrell, T.S.; Mikkelsen, R.L.; Sulewski, G.; Norton, R.; Thompson Editors, M.L. Improving Potassium Recommendations for Agricultural Crops; Springer Nature: Berlin/Heidelberg, Germany, 2021. [Google Scholar] [CrossRef]
  15. Cau Dit Coumes, C.; Rousselet, A.; Xu, B.; Mercier, C.A.; Gauffinet, S. Investigation of aluminum nitrate as a set retarder of magnesium potassium phosphate cement: Mechanisms involved in diluted suspension. Cem. Concr. Res. 2021, 150, 106608. [Google Scholar] [CrossRef]
  16. Chaparadza, A.; Majoni, S. The Effects of Aluminum and Silicon Phosphates on Thermal Stability and Flammability of Polystyrene. J. Chem. Sci. 2022, 134, 11–21. [Google Scholar] [CrossRef]
  17. Arlidge, E.Z.; Farmer, V.C.; Mitchell, B.D.; Mitchell, W.A. Infra-red, X-ray and thermal analysis of some aluminium and ferric phosphates. J. Appl. Chem. 1963, 13, 17–27. [Google Scholar] [CrossRef]
  18. Dick, S.; Zeiskeb, T. Francoanellite K3Al5(HPO4)6(PO4)2·12H2O: Structure and Synthesis by Topochemical Dehydration of Taranakite. Z. Naturforsch 1998, 53, 711–719. [Google Scholar] [CrossRef]
  19. Balenzano, F.; Dell’anna, L.; Di Pierro, M.; Italy, B. Francoanellite, H6K3Al5(PO4)8·13H2O, a new mineral from the caves of Castellana, Puglia, southern Italy. Neues Jahrb. Mineral. Monatshefte 1976, 2, 49–57. Available online: https://zh.mindat.org/reference.php?id=16150032 (accessed on 1 July 2024).
  20. Dal Poggetto, G.; Fortunato, M.; Cardinale, A.M.; Leonelli, C. Thermal, Chemical and Mechanical Characterization of Recycled Corundum Powder in Metakaolin-Based Geopolymer Binder. Appl. Clay Sci. 2023, 237, 106875. [Google Scholar] [CrossRef]
  21. Cardinale, A.M.; Vecchio Ciprioti, S.; Fortunato, M.; Catauro, M. Thermal Behavior and Antibacterial Studies of a Carbonate Mg–Al-Based Layered Double Hydroxide (LDH) for in Vivo Uses. J. Therm. Anal. Calorim. 2023, 148, 1523–1532. [Google Scholar] [CrossRef]
  22. Król, M.; Dechnik, J.; Szymczak, P.; Handke, B.; Szumera, M.; Stoch, P. Thermal Behavior of Clinoptilolite. Crystals 2024, 14, 646. [Google Scholar] [CrossRef]
  23. Frazier, A.W.; Taylor, A.W. Characterization of Taranakites and Ammonium Aluminum Phosphates. Soil Sci. Soc. Am. J. 1965, 29, 545–547. [Google Scholar] [CrossRef]
  24. Frye, W.W.; Hutcheson, T.B. Release of NH4+ in Soils by Oven Drying. Soil. Sci. Soc. Am. J. 1981, 41, 889–892. [Google Scholar] [CrossRef]
  25. Graulis, S.; Chateigner, D.; Downs, R.T.; Yokochi, A.F.T.; Quirós, M.; Lutterotti, L.; Manakova, E.; Butkus, J.; Moeck, P.; Le Bail, A. Crystallography Open Database—An Open-Access Collection of Crystal Structures. J. Appl. Crystallogr. 2009, 42, 726–729. [Google Scholar] [CrossRef] [PubMed]
  26. Doebelin, N.; Kleeberg, R. Profex: A Graphical User Interface for the Rietveld Refinement Program BGMN. J. Appl. Crystallogr. 2015, 48, 1573–1580. [Google Scholar] [CrossRef] [PubMed]
  27. Thermo Fisher Scientific Inc. Driver Version: 9.13.1229, Nicolet IS20, Firmware Version: 1.02, Pat. Available online: www.Thermoscientific.Com/Pm_molspec (accessed on 1 January 2025).
  28. Song, X.; Zhao, J.; Li, Y.; Sun, Z.; Yu, J. Thermal Decomposition Mechanism of Ammonium Sulfate Catalyzed by Ferric Oxide. Front. Chem. Sci. Eng. 2013, 7, 210–217. [Google Scholar] [CrossRef]
  29. Mooney, R.C.E. The Crystal Structure of Aluminum Phosphate and Gallium Phosphate, Low-Cristobalite Type. Acta Cryst. 1956, 9, 728–734. [Google Scholar] [CrossRef]
  30. Graetsch, H.E. Thermal expansion and thermally induced variations of the crystal structure of AlPO4 low cristobalite. Neues Jahrb. Mineral. Monatshefte 2003, 7, 289–301. [Google Scholar] [CrossRef]
  31. Graetsch, H.E. Two forms of aluminium phosphate tridymite from X-ray powder data. Acta Cryst. 2000, C56, 401–403. [Google Scholar] [CrossRef]
Figure 1. SEM images recorded on the guano-derived taranakite sample.
Crystals 15 00378 g001
Figure 2. (a) Thermogram (red curve) and Gram–Schmidt curve (black curve) in the experiment performed up to 1200 °C. (b) Infra-red spectra were recorded in correspondence with the maximum of the peaks in the Gram–Schmidt curve. The FT-IR spectra were recorded at 11 min (black curve), 14 min (red curve), and 21 min (blue curve).
Crystals 15 00378 g002
Figure 3. PXRD patterns of the taranakite untreated sample (blue curve) and taranakite after the thermal treatment at 100 °C for 4.5 h (black curve).
Crystals 15 00378 g003
Figure 4. (a) Thermogram (red curve) and Gram–Schmidt curve (black curve) in the experiment performed up to 200 °C. (b) Infra-red spectra recorded in correspondence with the maximum of the peaks of the Gram–Schmidt. The spectra were recorded at 10 min (black line) and 14 min (red line).
Crystals 15 00378 g004
Figure 5. (a) Thermogram (red curve) and Gram–Schmidt curve (black curve) in the experiment performed up to 400 °C. (b) Infra-red spectra recorded in correspondence with the maximum of the peaks of the Gram–Schmidt at 11 (black line) and 16 min (red line). (c) Spectra recorded at 26 (black line), 30 (red line), and 26 min (blue line).
Crystals 15 00378 g005
Figure 6. PXRD pattern of the taranakite samples after the thermal treatment at 200 °C (black curve) and 400 °C (red curve).
Crystals 15 00378 g006
Table 1. Main mass losses correlated with the temperature and the main gas released during the decomposition.
Temperature RangeTime (Gram–Schmidt)Main Peaks/Clusters in the SpectrumGas CompositionMass Loss (mg)Molar Loss (mmol) Ratio Gas mols/Taranakite mols
80–140 °C11 min3400–3700 cm−1
1200–2000 cm−1
Water1.530.05~6
141–215 °C16 min3400–3700 cm−1
1200–2000 cm−1
Water3.120.14~12
240–325 °C30 min3400–3700 cm−1
1200–2000 cm−1
Water0.570.03~2
Two peaks 929–964 cm−1Ammonia0.320.02~1
Disclaimer/Publisher’s Note: The statements, opinions and data contained in all publications are solely those of the individual author(s) and contributor(s) and not of MDPI and/or the editor(s). MDPI and/or the editor(s) disclaim responsibility for any injury to people or property resulting from any ideas, methods, instructions or products referred to in the content.

