Communication

Quantitative Analysis of Shear Texture Evolution in Accumulative Roll Bonded AA 1060 Aluminum Alloy

1
Avic Chengdu Caic Electronics Co., Ltd., Chengdu 610000, China
2
College of Mechanical Engineering, Yanshan University, Qinhuangdao 066004, China
3
Key Laboratory of Metastable Materials Science and Technology, College of Materials Science and Engineering, Yanshan University, Qinhuangdao 066004, China
*
Authors to whom correspondence should be addressed.
Crystals 2025, 15(4), 369; https://doi.org/10.3390/cryst15040369
Submission received: 13 February 2025 / Revised: 11 April 2025 / Accepted: 14 April 2025 / Published: 17 April 2025
(This article belongs to the Special Issue Microstructure and Deformation of Advanced Alloys)

Abstract

:
AA 1060 aluminum alloy underwent roll bonding with reductions of 25% and 35%, followed by accumulative roll bonding (ARB) for up to seven cycles at ambient temperature. The evolution of surface layer texture throughout the ARB process was analyzed using X-ray diffraction. Initially, the cube texture at the surface progressively transitioned to the r-cube texture throughout ARB, and the r-cube orientation intensity increases from 0 to 9.2 as the true strain accumulates. The shear texture evolution at the surface layer was quantified through mathematical formulations of texture volume fractions and accumulated true strain. The rate (dMi/dε) of cube texture reduction and r-cube texture formation are initially 15% and 20%, respectively, and they decrease rapidly with increasing cumulative true strain and then slow down to 0.6% and 0.8%. The quantitative analysis of the texture evolution used the JMAK equation, which is rarely applied in ARB studies.

1. Introduction

Crystallographic texture significantly influences the anisotropic mechanical behavior of metals. Extensive research has been conducted on quantifying rolling textures using various mathematical and empirical models. The Taylor–Bishop–Hill model and rate-sensitive crystal plasticity model are commonly employed to simulate lattice rotation in rolled metal sheets, providing insights into polycrystalline behavior [1,2,3]. Among them, the Taylor–Bishop–Hill model focuses on the plastic deformation of crystalline materials, especially on the behavior of slip systems in single-crystal materials. The rate-sensitive crystal plasticity model, on the other hand, describes the effect of strain rate on the plastic deformation of crystals by introducing the rate dependence, which is applicable to the deformation process at high speed and high temperature. In addition to these two models, the Johnson–Mehl–Avrami–Kolmogorov (JMAK) equation employed in this paper is often used to quantitatively analyze the texture evolution during rolling and heat treatment [4,5,6,7]. This facilitated the assessment of initial texture, precipitation state, and strain hardening effects.
During the ARB, shear texture is introduced at the surface layer due to friction between the roll and sheet surfaces [8,9,10,11,12,13,14,15,16]. Kim et al. [13] observed the development of shear textures, including r-cube and γ-fiber components, on the surface of ARB-processed AA 8011 aluminum sheets. Su et al. [14] found that the surface layer of ARB-processed AA 6061 alloy primarily consisted of r-cube orientation, with its volume fraction increasing progressively up to five cycles. Although numerous studies have been carried out on shear texture development during the ARB process, quantitative analyses are relatively scarce compared to conventional rolling deformation [15,16]. This scarcity can be attributed to several factors. First, the thin shear deformation band at the surface is easily worn away during the sample preparation process. Second, the ARB process is highly complex, involving multiple rolling, stacking, and bonding steps. During this process, uneven strain distribution and complex interface behaviors interact, posing a great challenge to establishing accurate quantitative models. In addition, previous studies also lacked a comprehensive approach, with systematic interpretations of the shear texture evolution mechanism.
Therefore, we select the AA 1060 aluminum alloy because of its relatively simple composition. This reduces the interference from complex interactions of alloying elements, facilitating the establishment of quantitative models [17,18]. The JMAK equation is used to quantitatively analyze the shear texture evolution of AA 1060 aluminum alloy during the ARB process. This approach allows for a more in depth understanding of the kinetics of shear texture evolution [12]. We aim to use X-ray diffraction to systematically investigate the shear texture evolution at the surface layer of AA 1060 aluminum alloy during the ARB process. By quantifying the volume fraction variations in cube and r-cube components using the JMAK equation, which has rarely been applied in ARB studies, we can more accurately describe the texture evolution process. This not only helps to understand the underlying mechanism of texture evolution but also provides a theoretical basis for optimizing the ARB process and improving the properties of AA 1060 aluminum alloy products.

2. Experimental Procedure

The material for this study was a commercially available AA 1060 aluminum sheet with a thickness of 1.8 mm. The as-received sheets were annealed at 500 °C for 2 h to achieve a fully recrystallized microstructure. After annealing, sheets measuring 130 mm × 80 mm × 1.8 mm were cut from the aluminum stock. Following thorough cleaning with stainless steel brushes, pairs of the annealed sheets were stacked to a total thickness of 3.6 mm and secured with copper wires. Copper wires were employed to firmly secure the front end of the stacked sheets, with the purpose of precluding the aluminum sheets from detaching during the rolling process. In order to introduce shear strain into the surface of 1060 aluminum alloy and gradually increase the amount of shear strain, the sheets need to be rolled under different deformation conditions. The stacked sheets underwent single-pass reductions of approximately 25%, 35%, and 50% along the rolling direction (RD) using a laboratory rolling mill equipped with 230 mm diameter rolls and operating at 0.4 m/s. Sheets subjected to a 50% reduction were cut to half their original length, resulting in two sheets each approximately equivalent in length to the initial sheet. This 50% reduction was performed for up to seven cycles.
Microstructural analysis during the accumulative roll bonding (ARB) process was conducted using Axiover 200MAT optical microscopy following etching with a 0.5% HF solution. Texture measurements were carried out with a Rigaku D/Max-2500 diffractometer utilizing CuKα radiation. For each sample’s surface layer, pole figures for (111), (200), and (220) planes were recorded with a maximum tilt angle of 75°. The orientation distribution functions (ODFs) were derived from the pole figures through the application of the series expansion method (lmax = 16) [19]. To determine the volume fractions of primary texture components, an enhanced integration method was employed [20,21,22,23]. Specifically, to compute the volume fraction of the θ-fiber (<001> parallel to the normal direction (ND)), the intensities of the ODF f(g) within 20° of the θ-fiber center in the Euler space subset were integrated.

3. Results and Discussion

Figure 1 presents optical micrographs of AA 1060 aluminum sheets processed via ARB after 0, 1, 3, and 6 cycles. The as-received sheets, annealed at 500 °C for 2 h, displayed fully recrystallized grains with slight elongation. After one-cycle ARB processing, the sheets were effectively bonded, as evidenced by a well-formed interface. Following three cycles, the grain structure evolved into a lamellar form along the rolling direction (RD), making the bonding interfaces less distinguishable through chemical etching. This observation indicates that subsequent ARB cycles significantly enhanced interfacial bonding. After six cycles, further rolling led to markedly elongated grain structures, with individual grains becoming challenging to identify through standard metallographic techniques.
Figure 2 illustrates the surface layer texture evolution of the AA 1060 sheets. Initially, the annealed sheet displayed the dominant cube texture with minor R and Goss orientations, with intensities of 7.4, 3.6, and 2.1, respectively. The cube orientation is the most common orientation in aluminum alloys, and its position in Eulerian space is (0, 0, 0) [24]. As the accumulated true strain increased from 0 to 0.69, the orientation intensity of the cube diminished, gradually transitioning to a 22.5° ND-rotated cube orientation. The intensities of the Goss and R orientations also decreased to negligible levels. Upon reaching a true strain of 1.39, the surface layer developed a weak r-cube shear texture, which intensified with a further strain of up to 4.85. At this strain level, the r-cube texture reached a strong intensity of 9.2. To elucidate the r-cube shear texture development, Figure 3 illustrates the variation in the orientation intensity, f(g), along the Φ = 0° line within the φ2 = 0° plane. The cube orientation progressively rotated toward the r-cube orientation along the φ1 axis, with its intensity decreasing as the r-cube orientation intensity increased. When the cumulative true strain was 1.39, the position of the maximum orientation strength changed from cube orientation to r-cube orientation. The r-cube texture strength reached its maximum at this point when the cumulative true strain reached 4.85, which is 9.2.
The ratio of the volume fraction of the θ-fiber, R, and other components (Mi) to that under a random condition (Mi-random), as a function of accumulated true strain, is depicted in Figure 4. In a perfectly random sample, the volume fractions of the θ-fiber, R, and other components are 17.99%, 16.90%, and 51.47%, respectively. As the true strain increases, the ratio of the R component starts to decrease, and when the true strain reaches 0.69, the ratio of the R component is minimized and then remains constant. The strength of the θ-fiber component increases rapidly when the true strain increases from 0 to 0.69, followed by a slow increase in strength. For the remaining component, there is a slight increase in strength as the true strain increases from 0 to 6.9 due to a large reduction in the R component in the early part of the period, followed by a slow decrease. This trend suggests that the R orientation rotates toward the θ-fiber component through the remaining orientation region, leading to an increase in the ratios of the remaining and θ-fiber components. Once the ratio of the R component stabilizes at a lower value at a strain of 0.69, orientations in the remaining region continue to rotate toward the θ-fiber component. This rotation reduces the ratio of the remaining component and increases the ratio of the θ-fiber component.
Texture evolution can be quantitatively assessed by examining the variation in texture volume fractions with rolling true strain. Figure 5a illustrates the changes in the volume fractions of the cube and r-cube textures as a function of accumulated true strain in the surface layer of sheets processed by ARB. The volume fraction of the cube texture decreases with the increasing true strain, whereas the r-cube component increases. Previous work established an empirical formula relating texture volume fractions to rolling true strain to quantify texture evolution [25]. This study extends this approach by quantitatively analyzing the evolution of shear texture during the ARB process. The variation in texture volume fractions (Mi) with accumulated true strain is described by the following equation [22]:
f i = M i M i 0 M i M i 0
where Mi0 and Mi∞ denote the texture volume fractions at the start and end in the ARB, respectively. In terms of the cube texture, Mi∞ equals 0, while in terms of the r-cube texture, Mi∞ equals 1. The relationship between fi and accumulated true strain ε is expressed by a JMAK-type equation [25]. The JMAK equation is often used to quantitatively analyze the texture evolution during rolling and heat treatment processes. For example, in our previous research, we applied the JMAK equation to simulate the evolution of the recrystallization texture and the β-fiber rolling texture during the rolling deformation process, and it yielded excellent results [12,23].
f i = 1 exp ( k i ε n i )
where ki is an empirical constant, and ni represents the strain exponent for the cube and r-cube components. The fi data can be plotted as ln(ε) versus fi, as shown in Figure 5b. Parameters ki and ni were determined by fitting the experimental data to the JMAK equation (Equation (2)). Table 1 presents the values of ki, ni, and r for the linear fits. A higher correlation coefficient indicates that the JMAK equation effectively models the changes in the texture volume fraction throughout the ARB process.
In order to assess the cube and r-cube textures’ evolution rates under shear conditions, the derivative dMi/dε of the texture volume fractions with respect to accumulated true strain was calculated using Equations (1) and (2). The results are illustrated in Figure 6. As the true strain increases, the disappearance rate of the cube component increases rapidly in the early part of the period and then gradually becomes slower. For the r-cube component, the rate of formation increases rapidly in the first stage and then becomes slow.

4. Conclusions

The development of shear texture at the surface layer during the ARB process was examined using X-ray diffraction. The primary findings are summarized as follows:
(1)
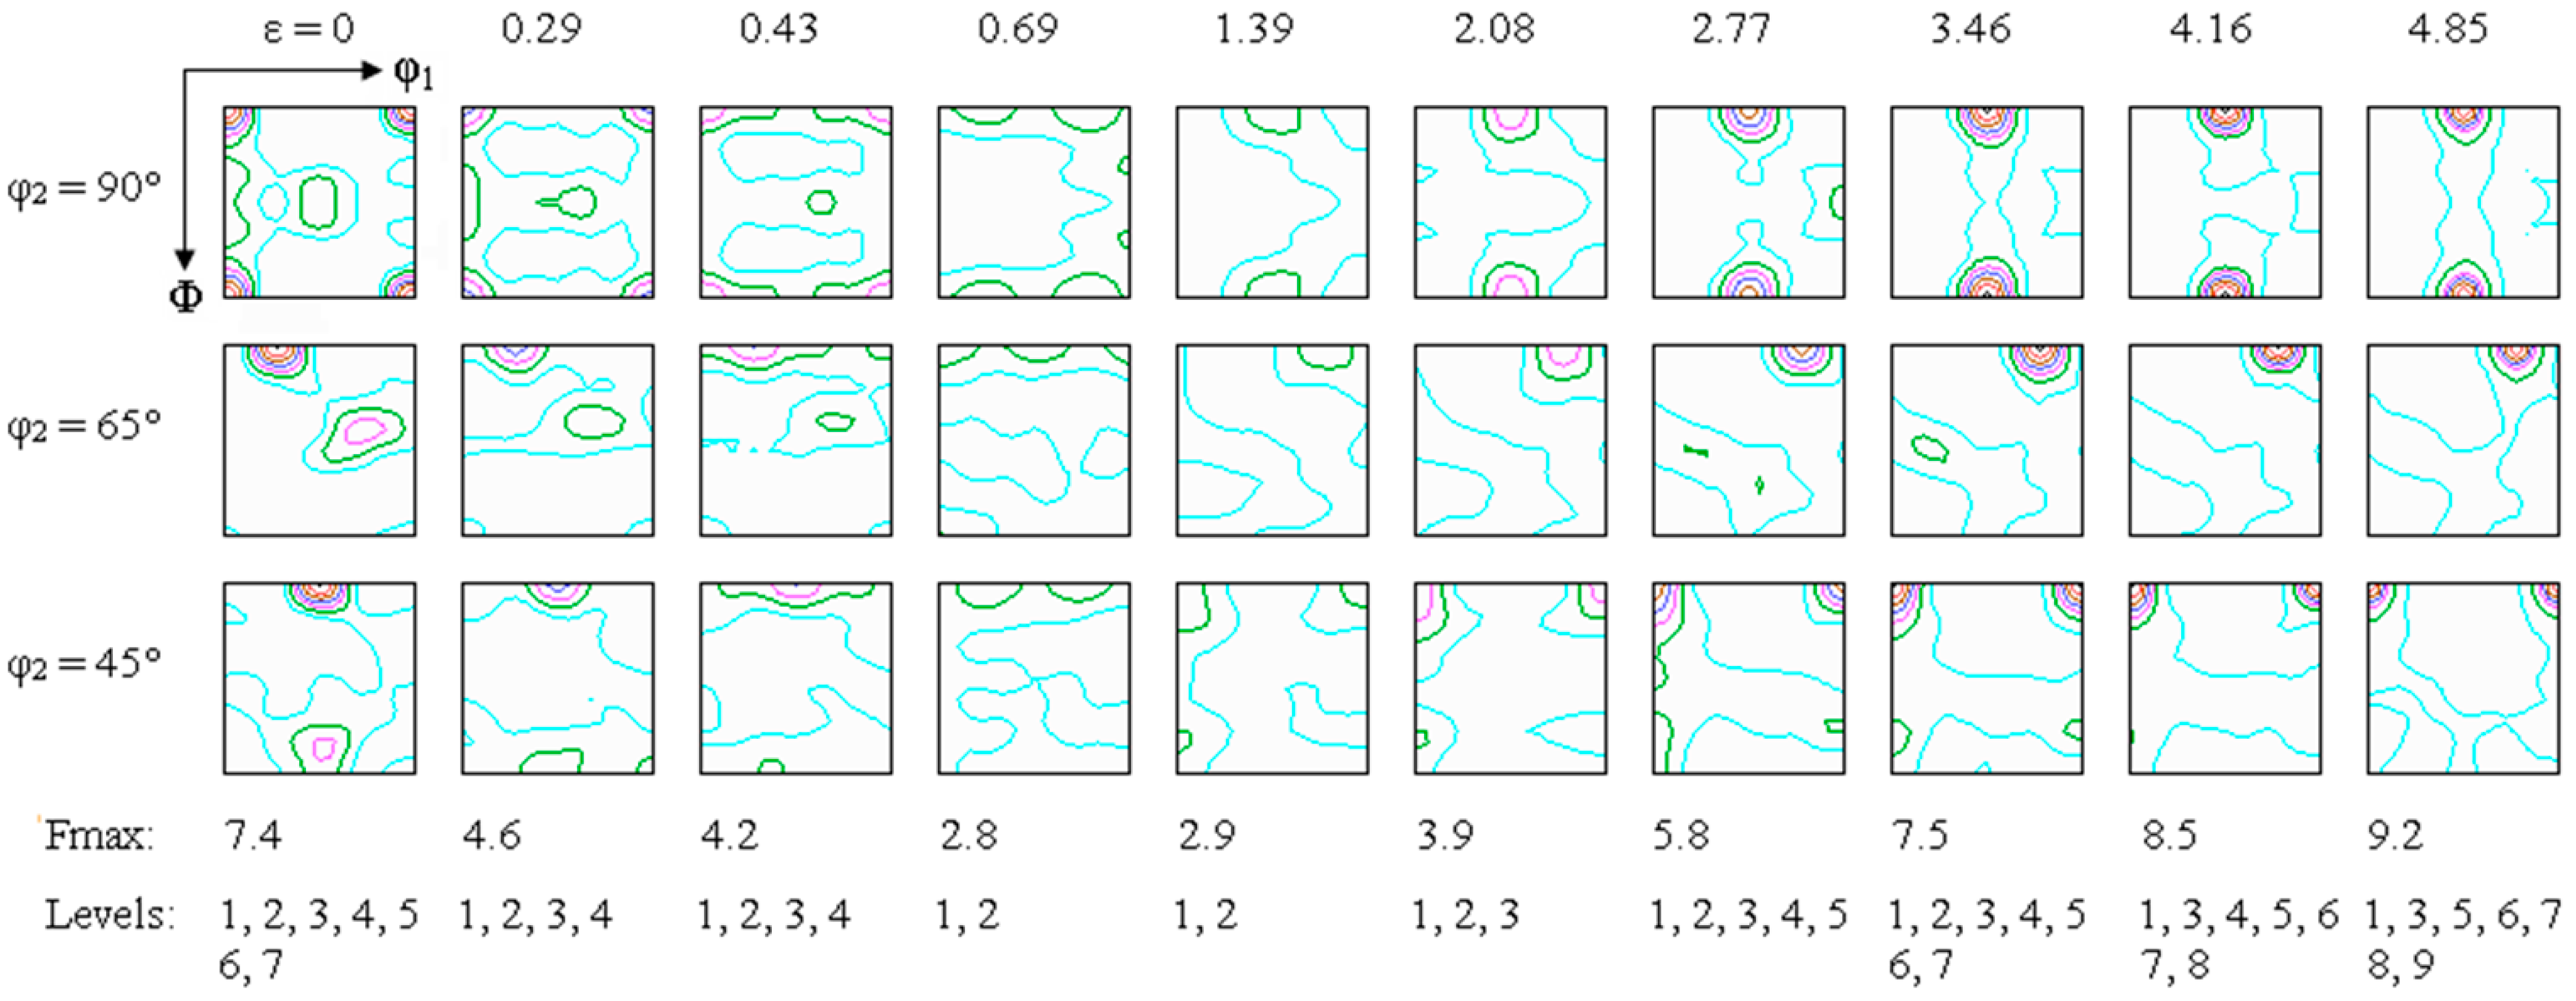
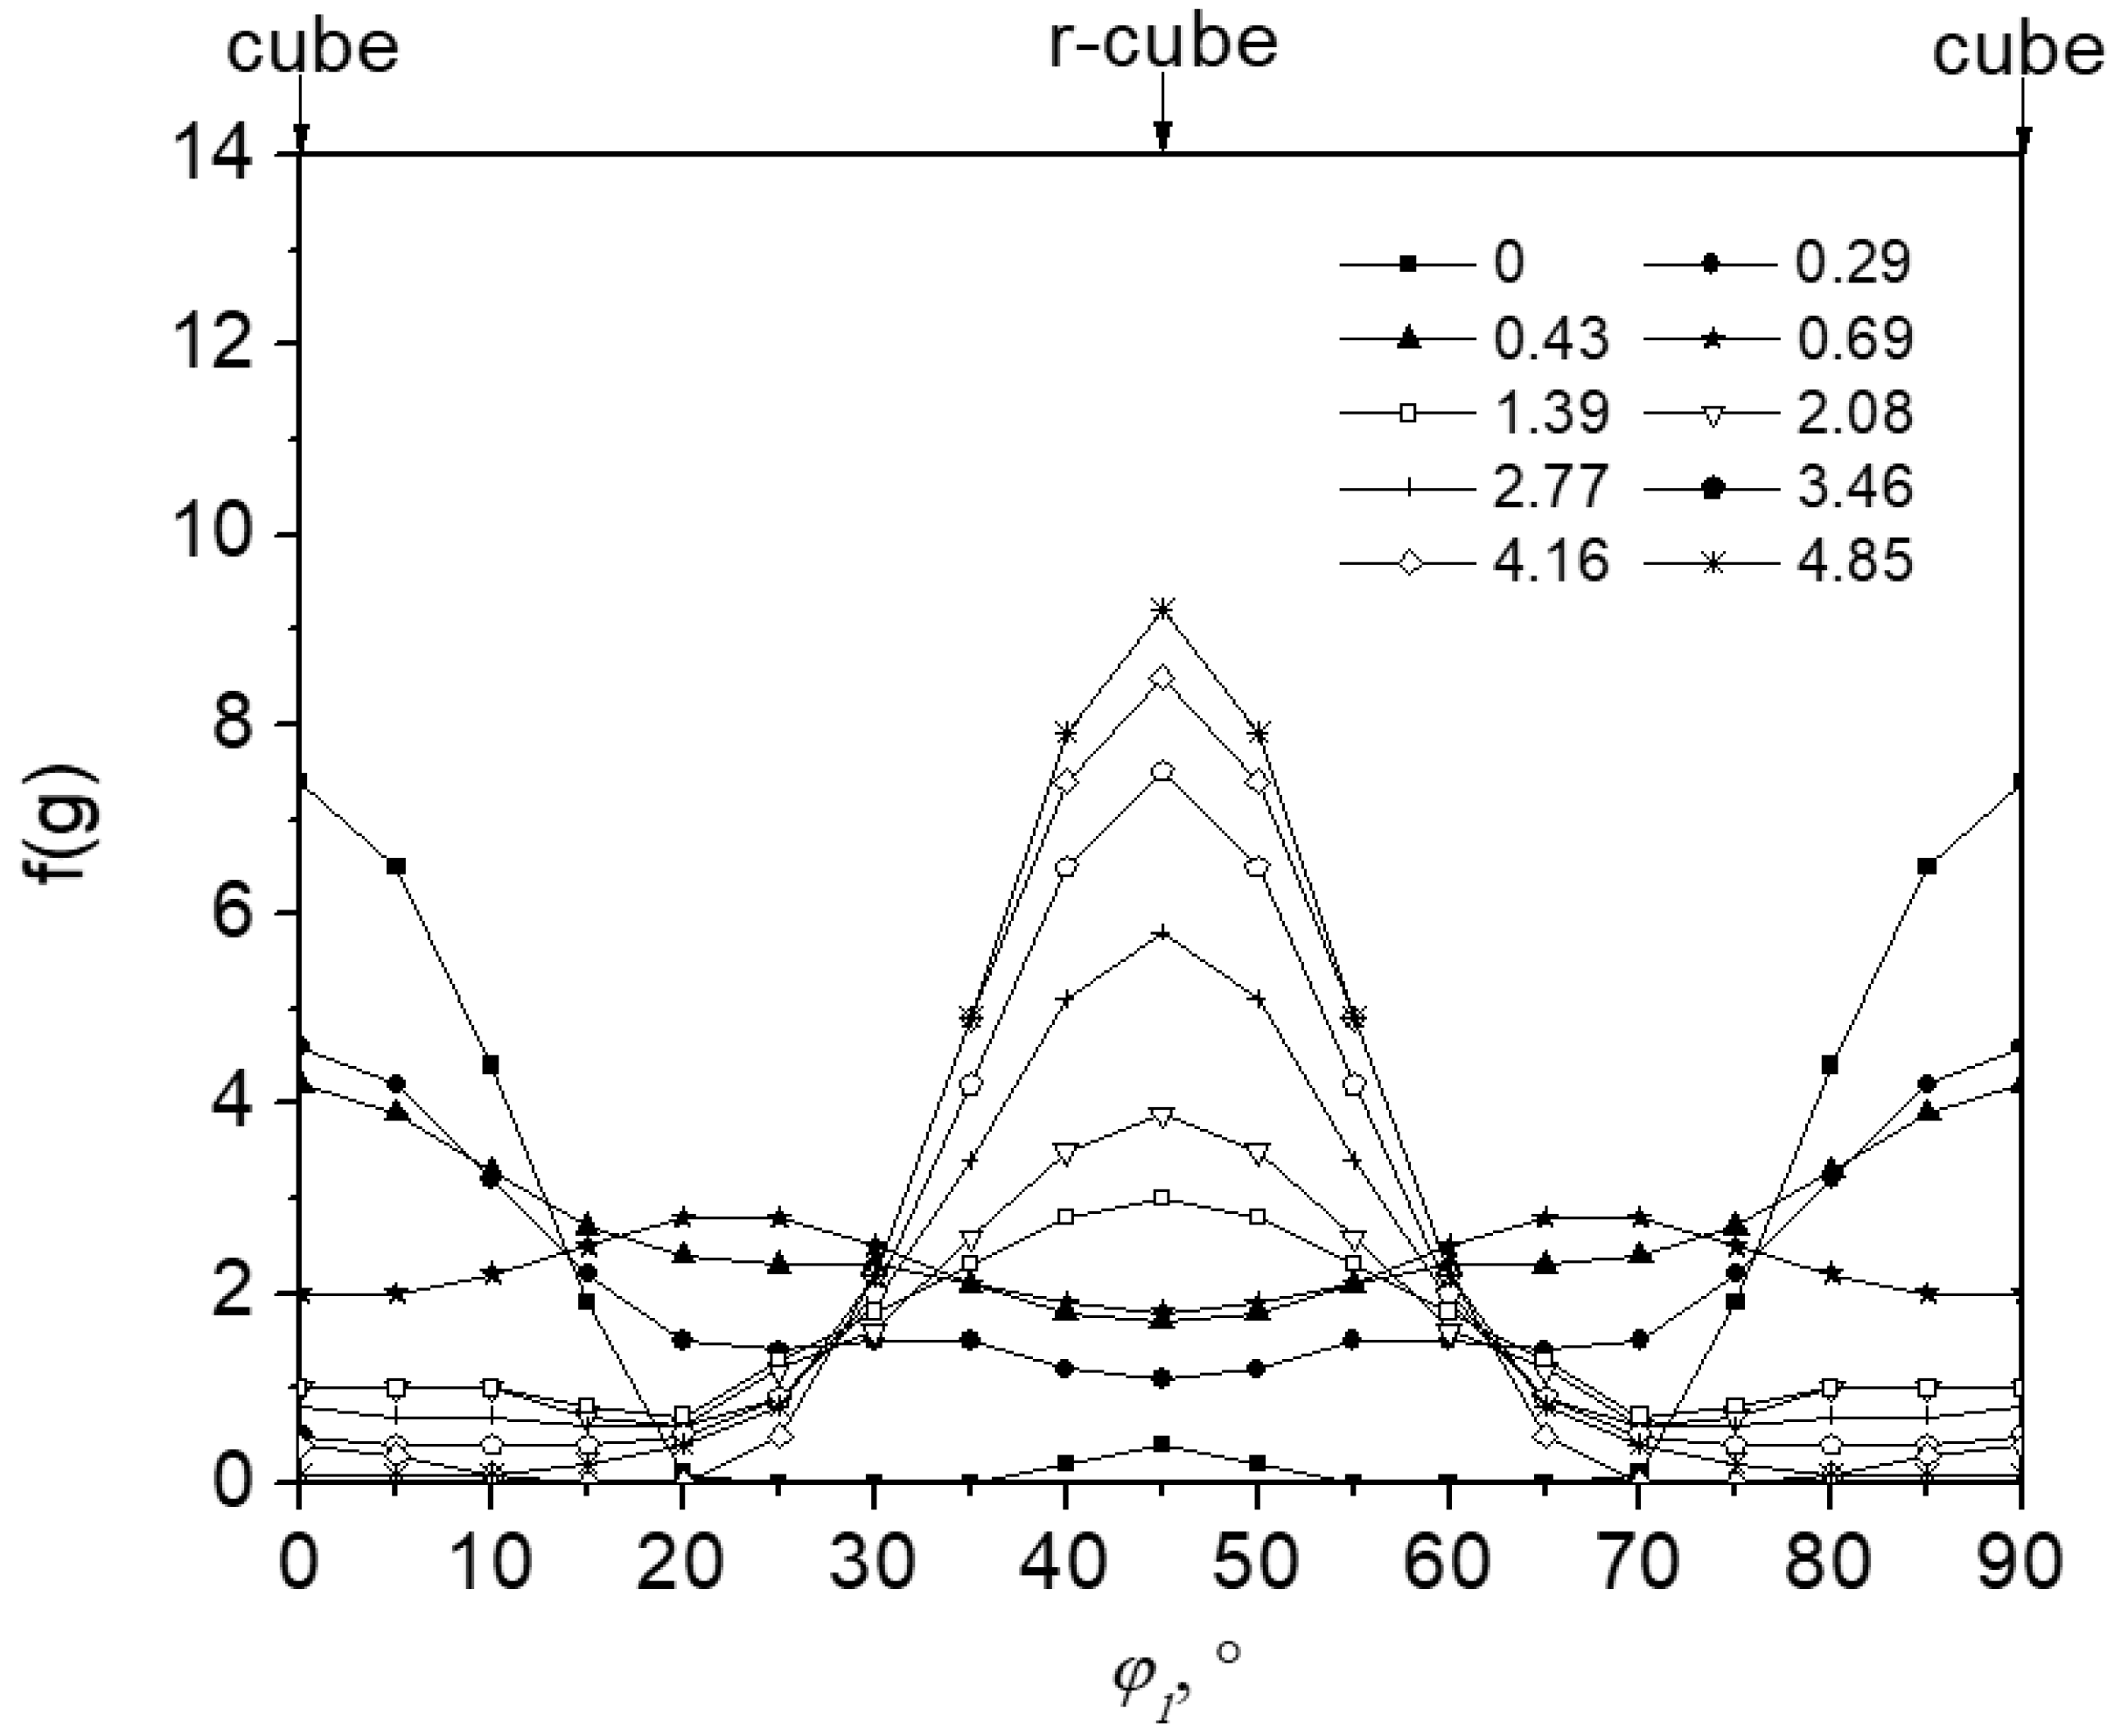
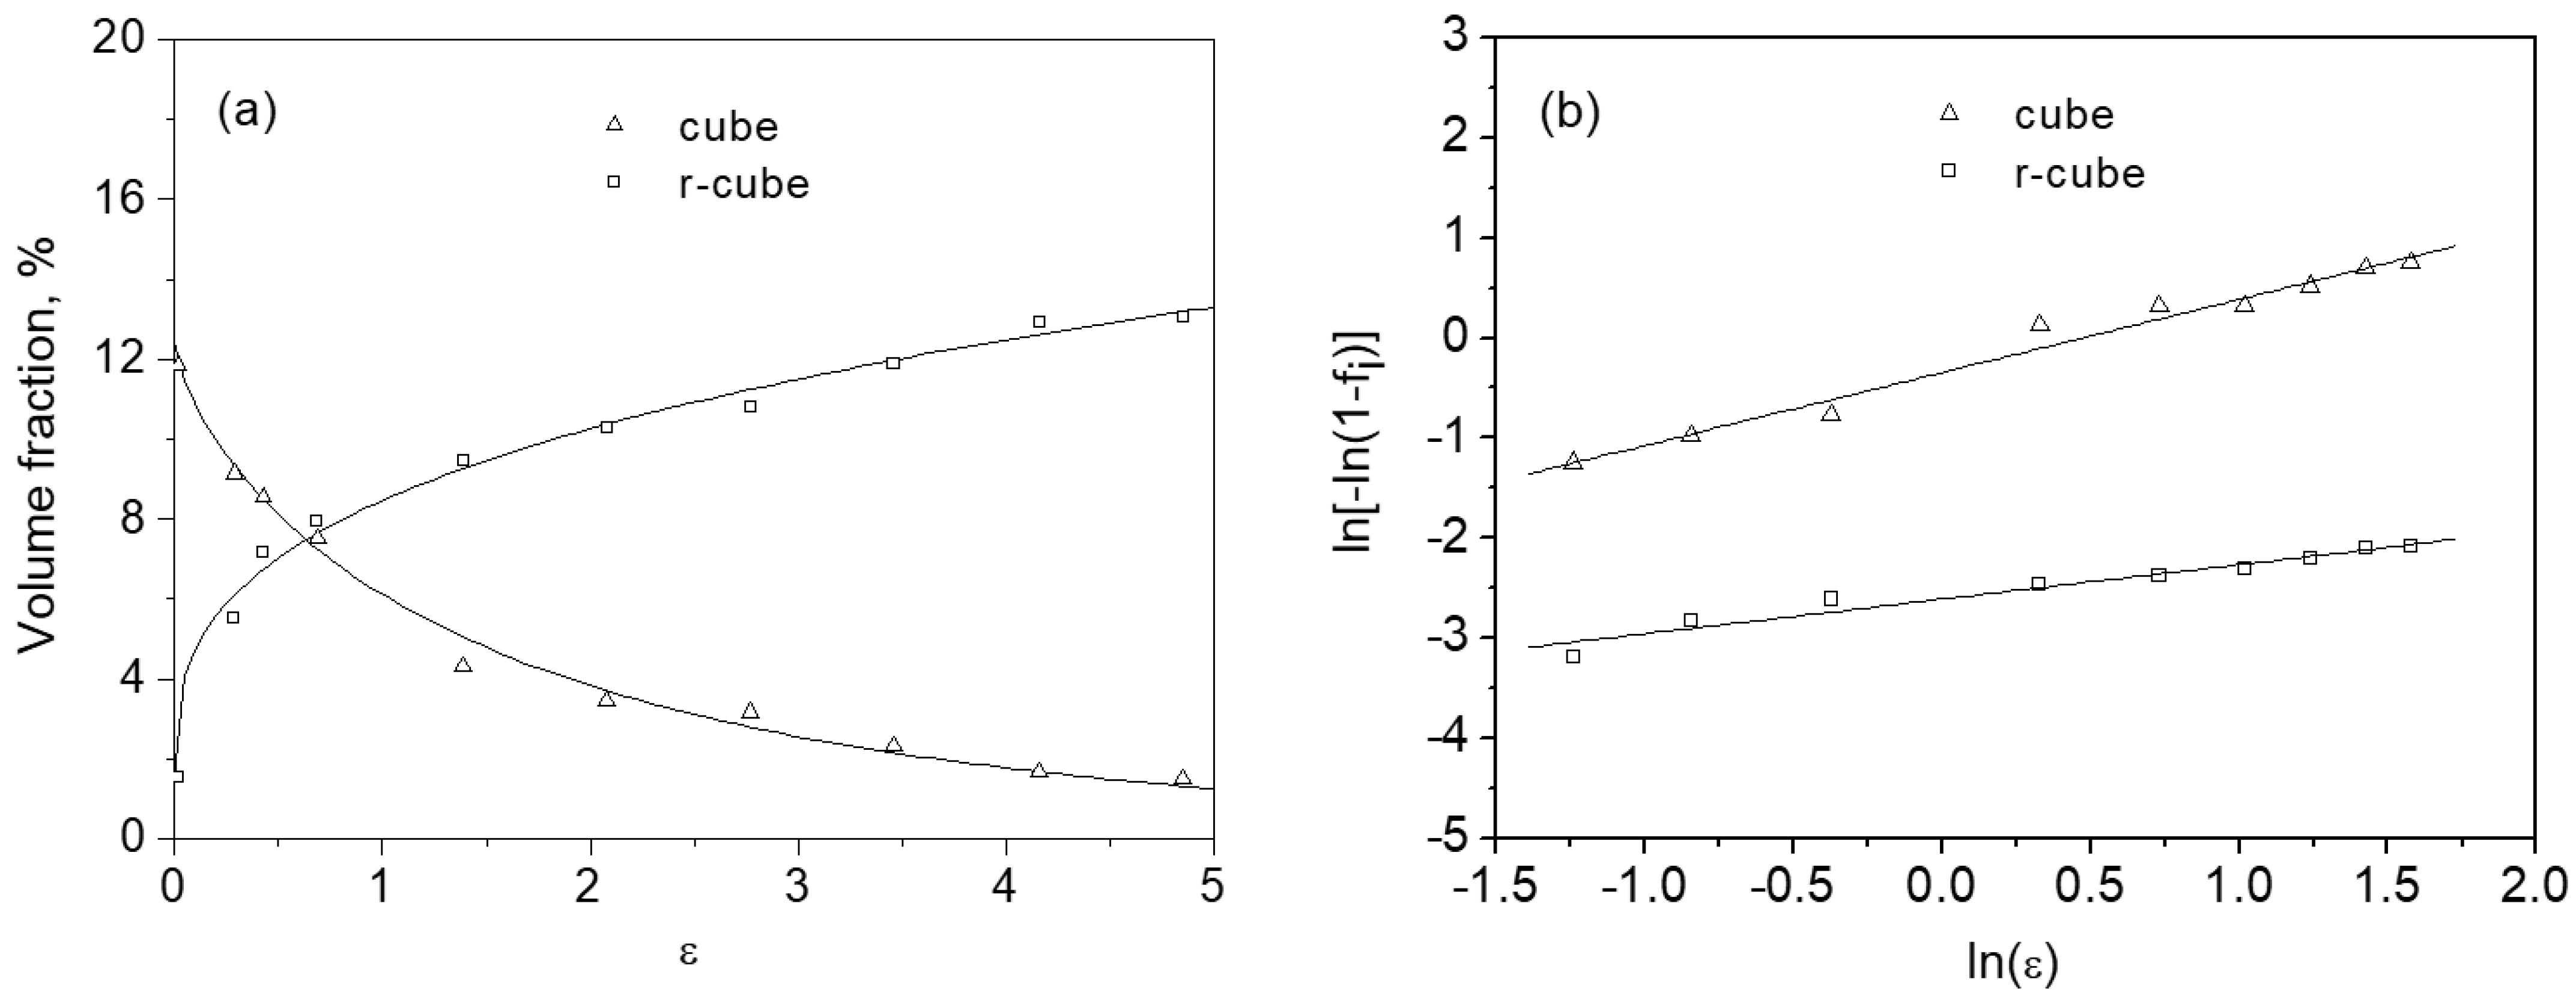
During the ARB process, the initial cube texture at the surface layer progressively transformed into a r-cube texture. As the accumulated true strain increased, the intensity of the cube texture diminished while the intensity of the r-cube texture was enhanced. At an accumulated true strain of 4.85, a pronounced r-cube texture was observed at the surface layer.
(2)
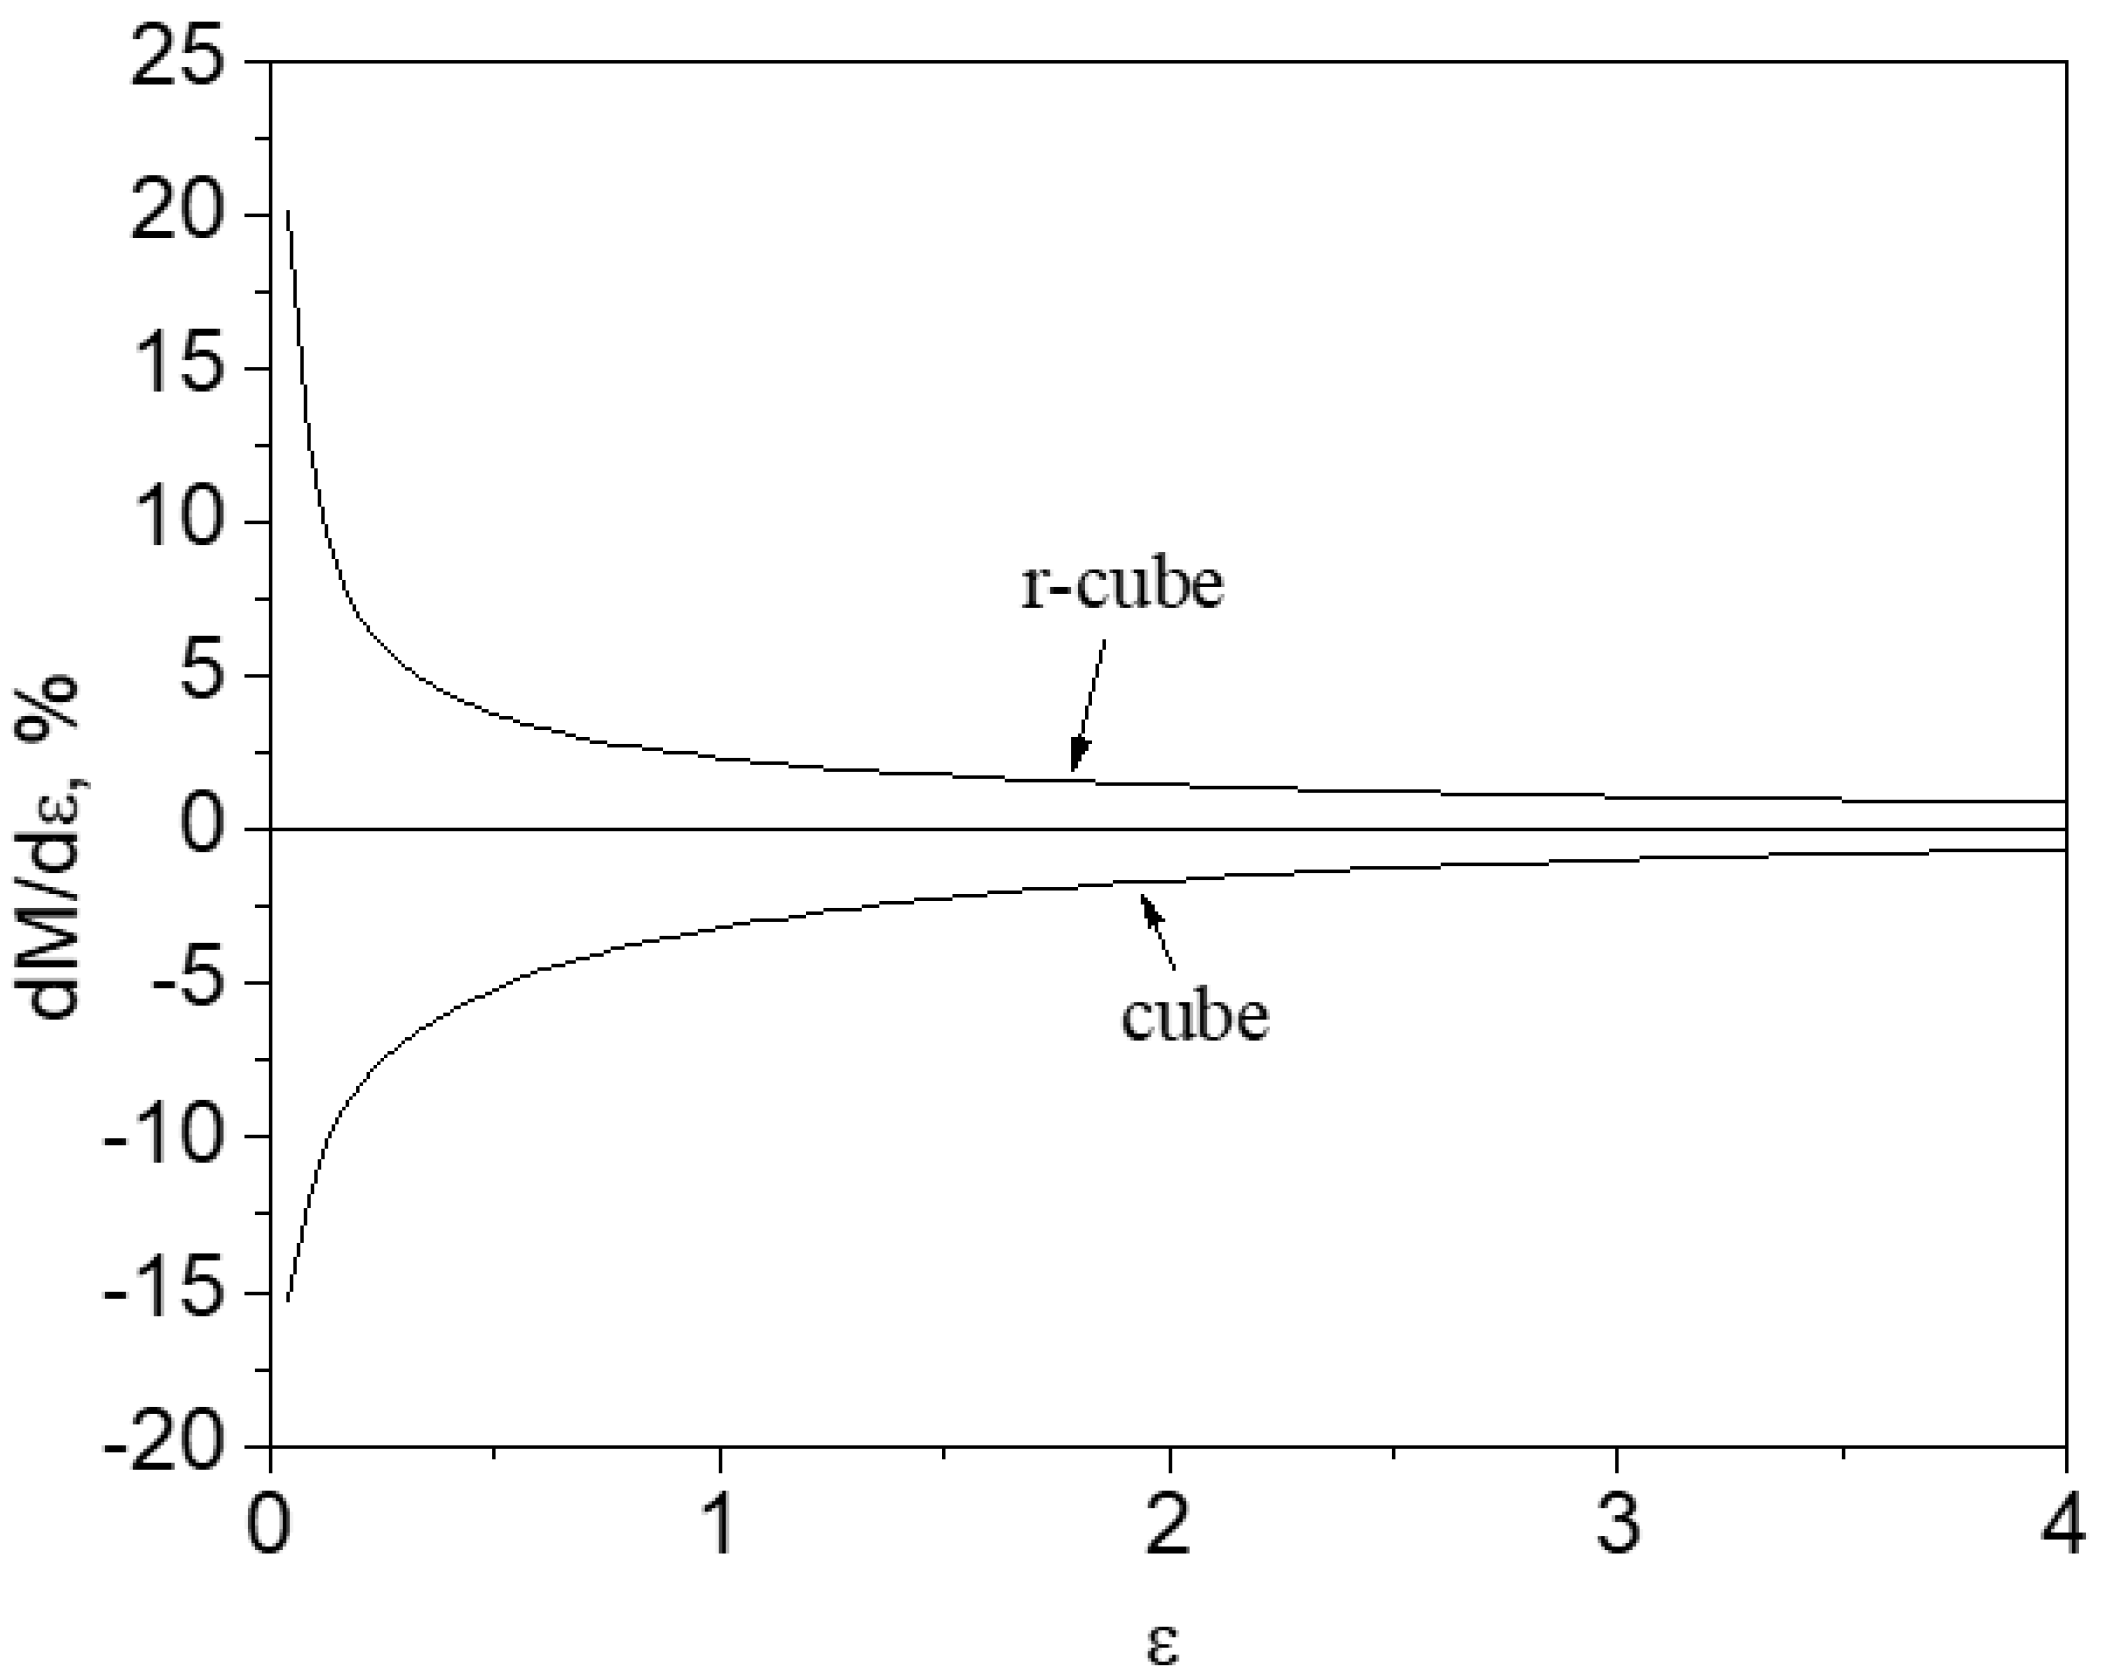
The development of shear texture at the surface layer was described using mathematical models relating texture volume fractions to accumulated true strain. The rate at which the cube component diminished and the r-cube component formed initially decreased rapidly with increasing strain, and subsequently the rates of change slowed down.
(3)
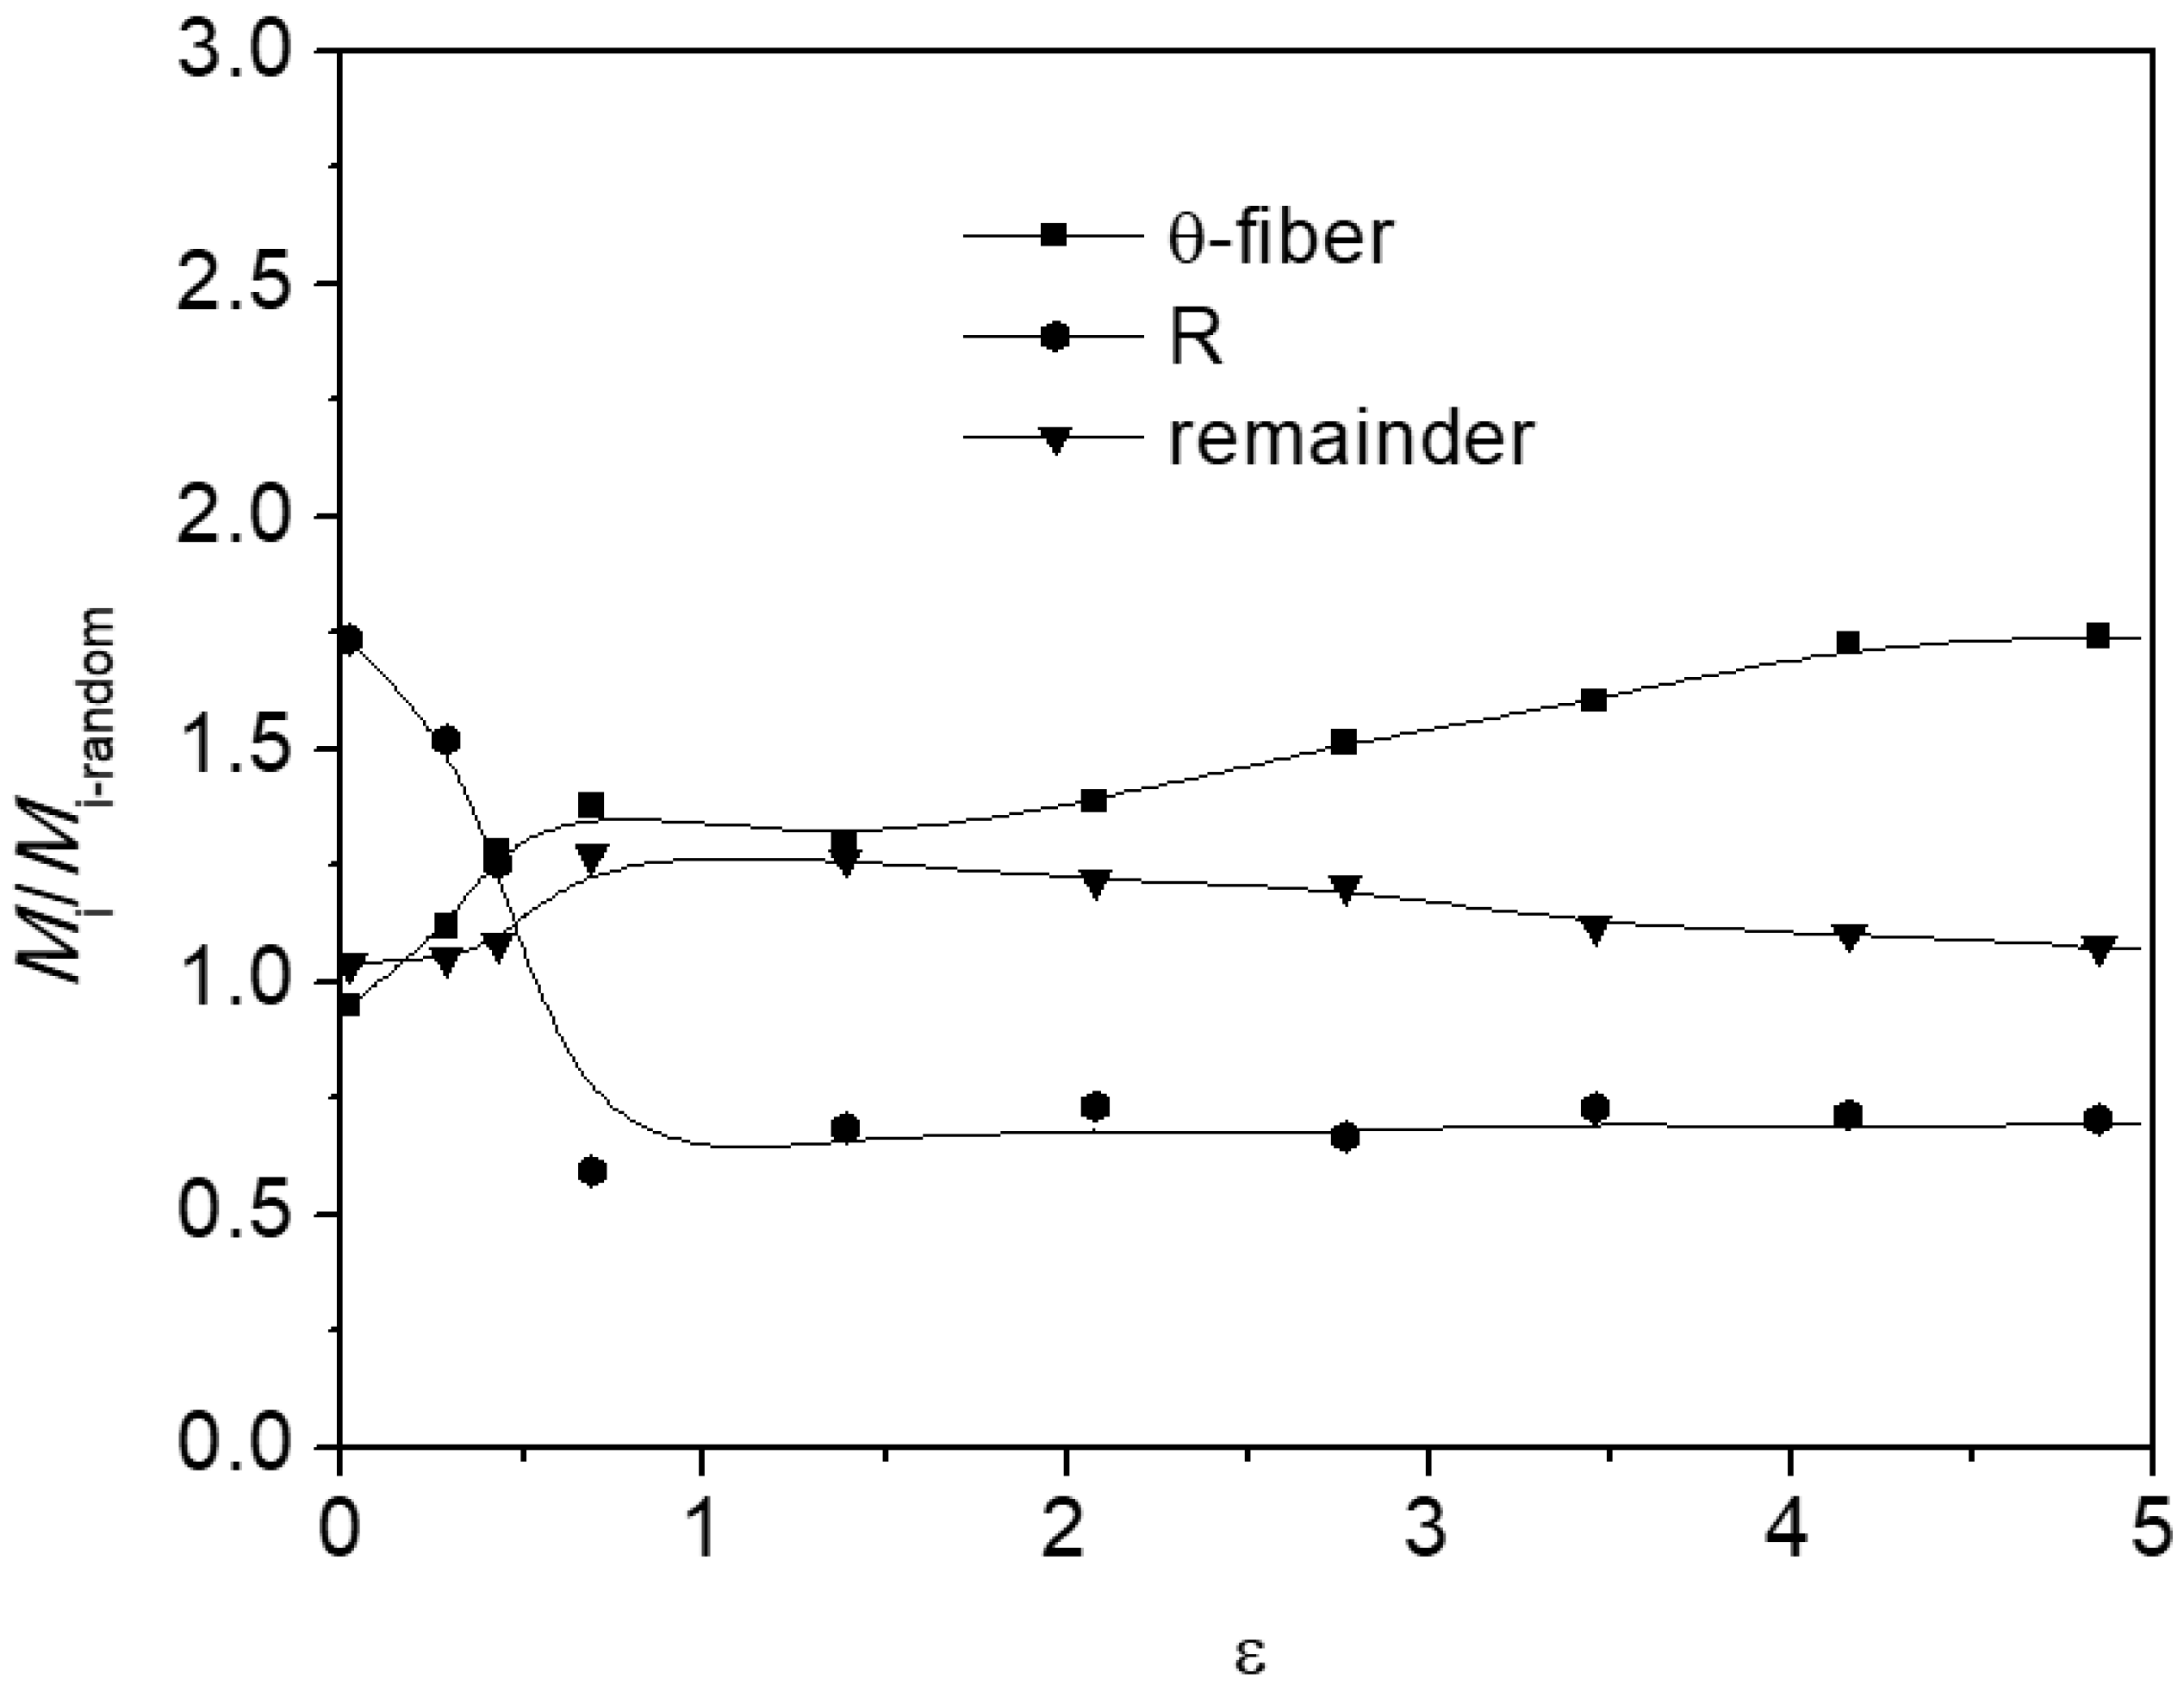
The strength of the R component at the surface layer decreased sharply to a value of 0.69 with increasing true strain and then stabilized. Conversely, the strength of the remaining component increased initially before decreasing slowly. This indicates that the R orientation transitions toward the r-cube orientation through the residual texture region during the ARB process.

Author Contributions

Conceptualization: P.D., C.L., L.L., B.C., M.L., Z.W. and S.L.; Formal analysis: P.D., C.L., L.L. and B.C.; Investigation: P.D., Z.W. and S.L.; Resources: P.D., Z.W. and S.L.; Writing—review & editing: P.D., Z.W. and S.L. All authors have read and agreed to the published version of the manuscript.

Funding

This work was supported by the National High Technology Research and Development Program of China (863 Program, No. 2013AA031304).

Data Availability Statement

The raw/processed data required to reproduce these findings cannot be shared at this time as the data also form part of an ongoing study.

Acknowledgments

We are grateful to Zhanli Guo for his insightful comments on the manuscript.

Conflicts of Interest

Peng Du, Chao Li, Lei Liu, Bao Chen, and Mingyu Li were employed by the Avic Chengdu Caic Electronics Co., Ltd. The remaining author declares that the research was conducted in the absence of any commercial or financial relationships that could be construed as a potential conflict of interest.

References

  1. Houtte, P.V. On the equivalence of the relaxed Taylor theory and the Bishop-Hill theory for partially constrained plastic deformation of crystals. Mater. Sci. Eng. 1982, 55, 69–77. [Google Scholar] [CrossRef]
  2. Hirsch, J.; Lücke, K. Overview no. 76: Mechanism of deformation and development of rolling textures in polycrystalline f.c.c. metals-II. Simulation and interpretation of experiments on the basis of Taylor-type theories. Acta Metall. Mater. 1988, 36, 2883–2904. [Google Scholar] [CrossRef]
  3. Delannay, L.; Kalidindi, S.R.; Houtte, P.V. Quantitative prediction of textures in aluminium cold rolled to moderate strains. Mater. Sci. Eng. A 2002, 336, 233–244. [Google Scholar] [CrossRef]
  4. Liu, W.C.; Zhai, T.; Man, C.-S.; Radhakrishnan, B.; Morris, J.G. Effect of initial texture on texture evolution in cold-rolled AA 5182 aluminium alloy. Philos. Mag. 2004, 84, 3305–3321. [Google Scholar] [CrossRef]
  5. Liu, W.C.; Li, Z.; Man, C.-S.; Raabe, D.; Morris, J.G. Effect of precipitation on rolling texture evolution in continuous cast AA 3105 aluminum alloy. Mater. Sci. Eng. A 2006, 434, 105–113. [Google Scholar] [CrossRef]
  6. Zhang, J.X.; Liu, C.; Liu, W.C.; Man, C.-S. Effect of precipitation state on texture evolution in cold-rolled continuous cast AA 2037 aluminum alloy. J. Alloys Compd. 2017, 728, 1199–1208. [Google Scholar] [CrossRef]
  7. Liu, W.C.; Man, C.-S.; Raabe, D. Effect of strain hardening on texture development in cold rolled Al-Mg alloy. Mater. Sci. Eng. A 2010, 527, 1249–1254. [Google Scholar] [CrossRef]
  8. Fattah-Alhosseini, A.; Gashti, S.O. Corrosion behavior of ultra-fine grained 1050 aluminum alloy fabricated by ARB process in a buffer borate solution. J. Mater. Eng. Perform. 2015, 24, 3386–3393. [Google Scholar] [CrossRef]
  9. Jamaati, R.; Toroghinejad, M.R.; Mohtadi-Bonab, M.A.; Edris, H.; Szpunar, J.A.; Salmani, M.R. Texture development of ARB-processed steel-based nanocomposite. J. Mater. Eng. Perform. 2014, 23, 4436–4445. [Google Scholar] [CrossRef]
  10. Zhang, Y.B.; Mishin, O.V.; Godfrey, A. Analysis of through-thickness heterogeneities of microstructure and texture in nickel after accumulative roll bonding. J. Mater. Sci. 2014, 49, 287–293. [Google Scholar] [CrossRef]
  11. Toroghinejad, M.R.; Jamaati, R.; Hoseini, M.; Szpunar, J.A.; Dutkiewicz, J. Texture evolution of nanostructured aluminum/copper composite produced by the accumulative roll bonding and folding process. Metall. Mater. Trans. A 2013, 44, 1587–1598. [Google Scholar] [CrossRef]
  12. Wang, Z.J.; Ma, M.; Qiu, Z.X.; Zhang, J.X.; Liu, W.C. Microstructure, texture and mechanical properties of AA 1060 aluminum alloy processed by cryogenic accumulative roll bonding. Mater. Charact. 2018, 139, 269–278. [Google Scholar] [CrossRef]
  13. Kim, H.W.; Kang, S.B.; Tsuji, N.; Minamino, Y. Deformation textures of AA8011 aluminum alloy sheets severely deformed by accumulative roll bonding. Metall. Mater. Trans. A 2005, 36A, 3151–3163. [Google Scholar] [CrossRef]
  14. Su, L.H.; Lu, C.; Gazder, A.A.; Saleh, A.A.; Deng, G.Y.; Tieu, K.; Li, H.J. Shear texture gradient in AA6061 aluminum alloy processed by accumulative roll bonding with high roll roughness. J. Alloys Compd. 2014, 594, 12–22. [Google Scholar] [CrossRef]
  15. Li, S.; Sun, F.; Li, H. Observation and modeling of the through-thickness texture gradient in commercial-purity aluminum sheets processed by accumulative roll-bonding. Acta Mater. 2010, 58, 1317–1331. [Google Scholar] [CrossRef]
  16. Jamaati, R.; Toroghinejad, M.R.; Hoseini, M.; Szpunar, J.A. Texture development in Al/Al2O3 MMCs produced by anodizing and ARB processes. Mater. Sci. Eng. A 2011, 528, 3573–3580. [Google Scholar] [CrossRef]
  17. Sun, H.Y.; Wang, Z.J.; Du, P.; Zhang, J.X.; Liu, W.C. Effect of rolling reduction and heat treatment on the microstructure and mechanical properties of Al1060/Al6061-0.5 SiC/Al1060 laminates. Mater. Sci. Eng. A 2022, 830, 142328. [Google Scholar] [CrossRef]
  18. Zhou, Y.L.; Yang, Y.; Tan, Y.B.; Xiang, S.; Ma, M.; Zhao, F.; Yang, M. Recrystallization behavior and texture evolution during annealing of cryogenic-rolled 3003 aluminum alloy. J. Alloys Compd. 2024, 997, 174818. [Google Scholar] [CrossRef]
  19. Bunge, H.J. Texture Analysis in Materials Science; Elsevier: Amsterdam, The Netherlands, 1982. [Google Scholar]
  20. Liu, W.C.; Morris, J.G. Kinetics of the formation of the β fiber rolling texture in continuous cast AA 5xxx series aluminum alloys. Scr. Mater. 2002, 47, 743–748. [Google Scholar] [CrossRef]
  21. Liu, W.C.; Morris, J.G. Comparison of the texture evolution in cold rolled DC and SC AA 5182 aluminum alloys. Mater. Sci. Eng. A 2003, 339, 183–193. [Google Scholar] [CrossRef]
  22. Liu, W.C.; Morris, J.G. Quantitative analysis of texture evolution in cold-rolled, continuous-cast AA 5xxx-series aluminum alloys. Metall. Trans. A 2004, 35A, 265–277. [Google Scholar] [CrossRef]
  23. Wang, W.X.; Zhang, J.X.; Wang, Z.J.; Liu, W.C. A comparative study of the transformation kinetics of recrystallization texture of CC and DC 3003 aluminum alloys. Mater. Charact. 2018, 141, 412–422. [Google Scholar] [CrossRef]
  24. Miszczyk, M.M.; Paul, H.; Driver, J.H.; Poplewska, J. The influence of deformation texture on nucleation and growth of cube grains during primary recrystallization of AA1050 alloy. Acta Mater. 2017, 129, 378–387. [Google Scholar] [CrossRef]
  25. Zhao, Y.M.; Liu, W.C.; Morris, J.G. Comparison of texture evolution during cold rolling between direct chill and continuous cast aluminium alloy 5052. Mater. Sic. Technol. 2003, 19, 1379–1385. [Google Scholar] [CrossRef]
Figure 1. Optical microstructures of the ARB-processed sheets after (a) 0, (b) 1, (c) 3, and (d) 6 cycles.
Crystals 15 00369 g001
Figure 2. Texture evolution at the surface layer during the ARB process of AA 1060 aluminum sheet.
Crystals 15 00369 g002
Figure 3. Orientation intensity f(g) along the line of Φ = 0° in the plane of φ2 = 0° at the surface layer of the ARB-processed sheets.
Crystals 15 00369 g003
Figure 4. Variation in the value of Mi/Mi-random with accumulated true strain for the ARB-processed sheets.
Crystals 15 00369 g004
Figure 5. (a) The change in the volume fraction of the cube and r-cube components with accumulated true strain and (b) variation in ln[−ln(1−fi)] as a function of the lnε of the ARB-processed sheets.
Crystals 15 00369 g005
Figure 6. Derivative of the volume fractions of the cube and r-cube components as a function of accumulated true strain at the surface layer.
Crystals 15 00369 g006
Table 1. Values of ki and ni in Equation (2) for the ARB-processed AA 1060 aluminum sheets at the surface layer.
Texture
Component
Mi0 (%)kinir
cube12.440.71 (0.68 ~ 0.74)0.84 ± 0.040.955
r-cube1.530.073 (0.071 ~ 0.076)0.35 ± 0.030.952
Disclaimer/Publisher’s Note: The statements, opinions and data contained in all publications are solely those of the individual author(s) and contributor(s) and not of MDPI and/or the editor(s). MDPI and/or the editor(s) disclaim responsibility for any injury to people or property resulting from any ideas, methods, instructions or products referred to in the content.

