Article

Evolution of Syngenite, K2Ca(SO4)2·H2O over a Wide Range of Temperatures and Pressures

1
Department of Crystallography, St. Petersburg State University, University Emb. 7/9, 199034 St. Petersburg, Russia
2
National Research Center “Kurchatov Institute”, St. Petersburg Institute of Nuclear Physics, Institute of Silicate Chemistry, 2, Makarov Emb., 199034 St. Petersburg, Russia
3
Institute of Digital Security, St. Petersburg State Marine Technical University, 3, Lotsmanskaya Str., 190121 St. Petersburg, Russia
4
Institute of Geosciences, Christian-Albrechts University of Kiel, D-24098 Kiel, Germany
5
Elettra Sincrotrone Trieste S.C.p.A, AREA Science Park, 34149 Basovizza, Italy
6
Kola Science Center, Russian Academy of Sciences, Fersman Str. 14, 184209 Apatity, Russia
*
Author to whom correspondence should be addressed.
Crystals 2025, 15(4), 334; https://doi.org/10.3390/cryst15040334
Submission received: 13 March 2025 / Revised: 26 March 2025 / Accepted: 26 March 2025 / Published: 31 March 2025
(This article belongs to the Section Crystalline Metals and Alloys)

Abstract

:
The crystal chemistry of syngenite K2Ca(SO4)2·H2O and its lattice dynamics under low and high temperatures and high pressure were studied. The research facilities used include in situ temperature variable single-crystal (SCXRD) and powder X-ray diffraction (PXRD), in situ PXRD under high pressure (HP), thermal analysis (DSC and TGA), and Raman spectroscopy. For the first time, a detailed study of syngenite in the range of negative temperatures down to −180 °C was performed. It indicates the absence of phase transitions in the range from −180 °C to 240 °C. The largest expansion of the structure is observed along the α11, which is consistent with the layered architecture. The minor thermal expansion along the α22 is observed in the plane of the [Ca(SO4)2]2− layer, formed by the bassanite-type chains. The study of powder samples at HP up to 20 GPa was carried out using synchrotron radiation and a diamond anvil cell. The phase transition is registered at 10 GPa. After the decompression, the syngenite post-phase becomes partially amorphized.

1. Introduction

Sulfates of potassium and calcium are important constituents of evaporite deposits [1], acting as ore sources of these components. One of the characteristic minerals found in evaporite environments is syngenite K2Ca(SO4)2·H2O [2]. Syngenite has also been reported from volcanic exhalations [3], as well as from guano deposits in highly arid environments [4].
Calcium sulfates are not only found in Earth’s surface environments, but also on extraterrestrial objects, in particular, on the surface of Mars [5]. Calcium sulfate minerals are commonly associated with hydrous Mg sulfates [6,7]. They are important in understanding the water characteristics in the past on Mars. Furthermore, it has been demonstrated previously [5] that syngenite and görgeyite, along with gypsum, can be readily deposited on the surface of Mars under both hydrothermal and non-hydrothermal conditions. The behavior of Ca sulfates at high pressure is of interest in extraterrestrial studies, which are usually analyzed using synchrotron sources. Previous work in this field has focused primarily on phases such as gypsum [8] and anhydrite [9].
The study of calcium sulfates, including syngenite, is also relevant for the cement research and the phenomenon of “sulfate attack” [10]. Syngenite is an undesirable component of cement clinker and can be formed at the early stages of hydration of cement as well as during the reaction of gypsum with solutions rich in K2SO4 [11,12].
Several previous works have been devoted to the study of transformations of syngenite by the means of thermal analysis [13,14], powder X-ray diffraction, and IR spectroscopy [15]. Syngenite thermal properties, investigated in [15] on natural (with admixture of gypsum and ammonium nitrate) and synthetic samples, showed the stability up to the temperature of 200 °C, followed by the dehydration and decomposition to K2Ca2(SO4)3 and amorphous K2SO4. The crystal structure of syngenite was first described by Gorogotskaya [16] and later refined in the P21/m space group by Corazza and Sabelli [17], Bokii et al. [18], and Ballirano et al. [19].
The present work aims to provide a comprehensive physico-chemical study of the behavior of syngenite under high-temperature and high-pressure environments. Note that the surface temperature of Mars varies from −150 °C to 10–20 °C [20]. The temperature range in our study overlaps with the latter. Synchrotron radiation has been used to study the behavior of syngenite in the high-pressure range up to 20 GPa.

2. Materials and Methods

2.1. Materials

The studied sample of syngenite originates from its type locality, the old potassium salt deposit Kalusa in the Carpathian Mountains. The material for the study was selected from a transparent, colorless tabular single crystal (1.5 × 2 × 3 cm) of syngenite.

2.2. Methods

In situ single-crystal X-ray diffraction (SCXRD) measurements. The crystal of syngenite with dimensions of 0.05 × 0.05 × 0.03 mm3 was selected for data collection using an optical microscope and mounted on a glass fiber. The SCXRD data were collected in the temperature range from −173 to 227 °C using a Rigaku XtaLAB Synergy-S diffractometer (Rigaku Oxford Diffraction, Oxford, UK) equipped with a micro-focus sealed X-ray tube (MoKa radiation; operating at 50 kV and 1.0 mA), HyPix-6000HE detector and an Oxford Cryostream 800 (Oxford, UK) cooling system supplied with N2 flow. A complete data set was collected in the mentioned temperature range with the step of 10 °C. The data were integrated and corrected for absorption using a multi-scan type model using the Rigaku CrysAlisPro software (ver. 1.171.41.103a) [21]. The crystal structure of syngenite was refined using the SHELXL software package (ver. 2014) [22]. Hydrogen atoms were added in idealized positions. Parameters and refinement details for the entire temperature range are given in the supplemented CIF-file and deposited in the CCDC database (deposition numbers 2,433,778–2,433,816). Bond-valence sums were calculated using parameters for ion pairs from [23]. Bond length evolution plots were constructed using chrystchemlib package (ver. 1.0) [24]. The thermal motions of atoms have an effect on the bond lengths obtained during the SC-XRD [25]. Corrections for bond lengths in SC-XRD in syngenite were calculated using a formula for the rigid-body motion:
R SRB 2 = R obs 2 + 3 8 π 2 ( B eq ( Y ) B eq ( X ) ) ,
where RSRB and Robs are corrected and observed Y–X bond lengths, respectively; Beq(X) and Beq(Y) are equivalent temperature factors of X (central atom) and Y (ligand), respectively. The thermal parameters Uij instead of Bij were used and implemented in the CIF-files.
In situ low- (LT) and high-temperature (HT) powder X-ray diffraction (PXRD) measurements were performed using a high-resolution diffractometer Rigaku “Ultima IV” (Rigaku, Tokyo, Japan) (CoKα X-ray sealed tube (focus size—0.4 × 12 mm), 40 kV/30 mA). The LT experiment was performed on a copper plate in the range from −180 °C to 250 °C and 5 °C steps. The HT experiment was performed on a platinum plate in the range from 20 °C to 800 °C and 20 °C steps. Phase identification was performed using PDXL software (ver. 2.0) [26] and refined in TOPAS software (ver. 5.0) [27]. The thermal expansion tensor was calculated using the RietveldToTensor software (ver. 1.0) [28].
Thermal analysis. Crystals with no visible impurities were selected under an optical microscope for differential scanning calorimetry (DSC) and thermogravimetric analysis (TGA). DSC and TGA were performed using the Netzsch STA 449 F3 Jupiter (Netzsch, Selb, Germany). The samples were heated from 40 to 500 °C and then cooled to 200 °C at a rate of 10 °C/min in airflow of 50 mL/min.
Raman spectroscopy. Raman spectra were acquired by the means of a Horiba Jobin-Yvon LabRam HR800 Raman spectrometer (Horiba Jobin-Yvon, Palaiseau, France), equipped with an Olympus BX41 optical microscope (Olympus, Tokyo, Japan) with a resolution of 2 cm−1 and the laser beam spot size of 5 μm and calibrated using a Si wafer and a peak at 510.5 cm−1. Raman spectra were excited by the means of a 532 nm laser.
In situ HP powder synchrotron XRD measurements. The Syngenite sample was ground in an agate mortar. The HP experiment was carried out at the Elettra third-generation synchrotron radiation source in Trieste (Italy). The HP diffraction beamline from Eletta, Xpress operates with a monochromatic X-ray beam (25 keV) in combination with a PILATUS3 S 6M detector (Rigaku, Tokyo, Japan) in angle dispersive mode. Stepwise hydrostatic compression from ambient pressure to 20 GPa was achieved using a membrane diamond anvil cell (DAC), type Betsa. A cullet size of 500 microns was chosen for the experiment. The steel gasket was pre-indented at 95 bars, resulting in a sample chamber drilled with dimensions of 200 × 60 microns. The diffractometer was calibrated by using the CeO2 powder standard and using Dioptas software (ver. 3.12) for processing 2D X-ray diffraction data [29]. A powder sample was pre-compressed on the gasket hole, which was subsequently filled with a Daphne 7474 as a pressure transmitting medium (PTM) [30]. Along with the sample and the PTM, a ruby chip was added as a pressure calibrant [31]. 37 XRD patterns were collected following the experiment plan: 0–5 GPa range with a 0.5 GPa step, 5–10 GPa range with a 1 GPa step, 10–20 GPa range with a 2 GPa step, and then on decompression in several steps. Subsequent data processing was performed in the TOPAS program (ver. 5.0), noting the wavelength λ = 0.4957 Å. Unit cell parameter approximation and calculation of baric compression tensors were performed in the program ThetaToTensor (ver. 2.0) [32].

3. Results

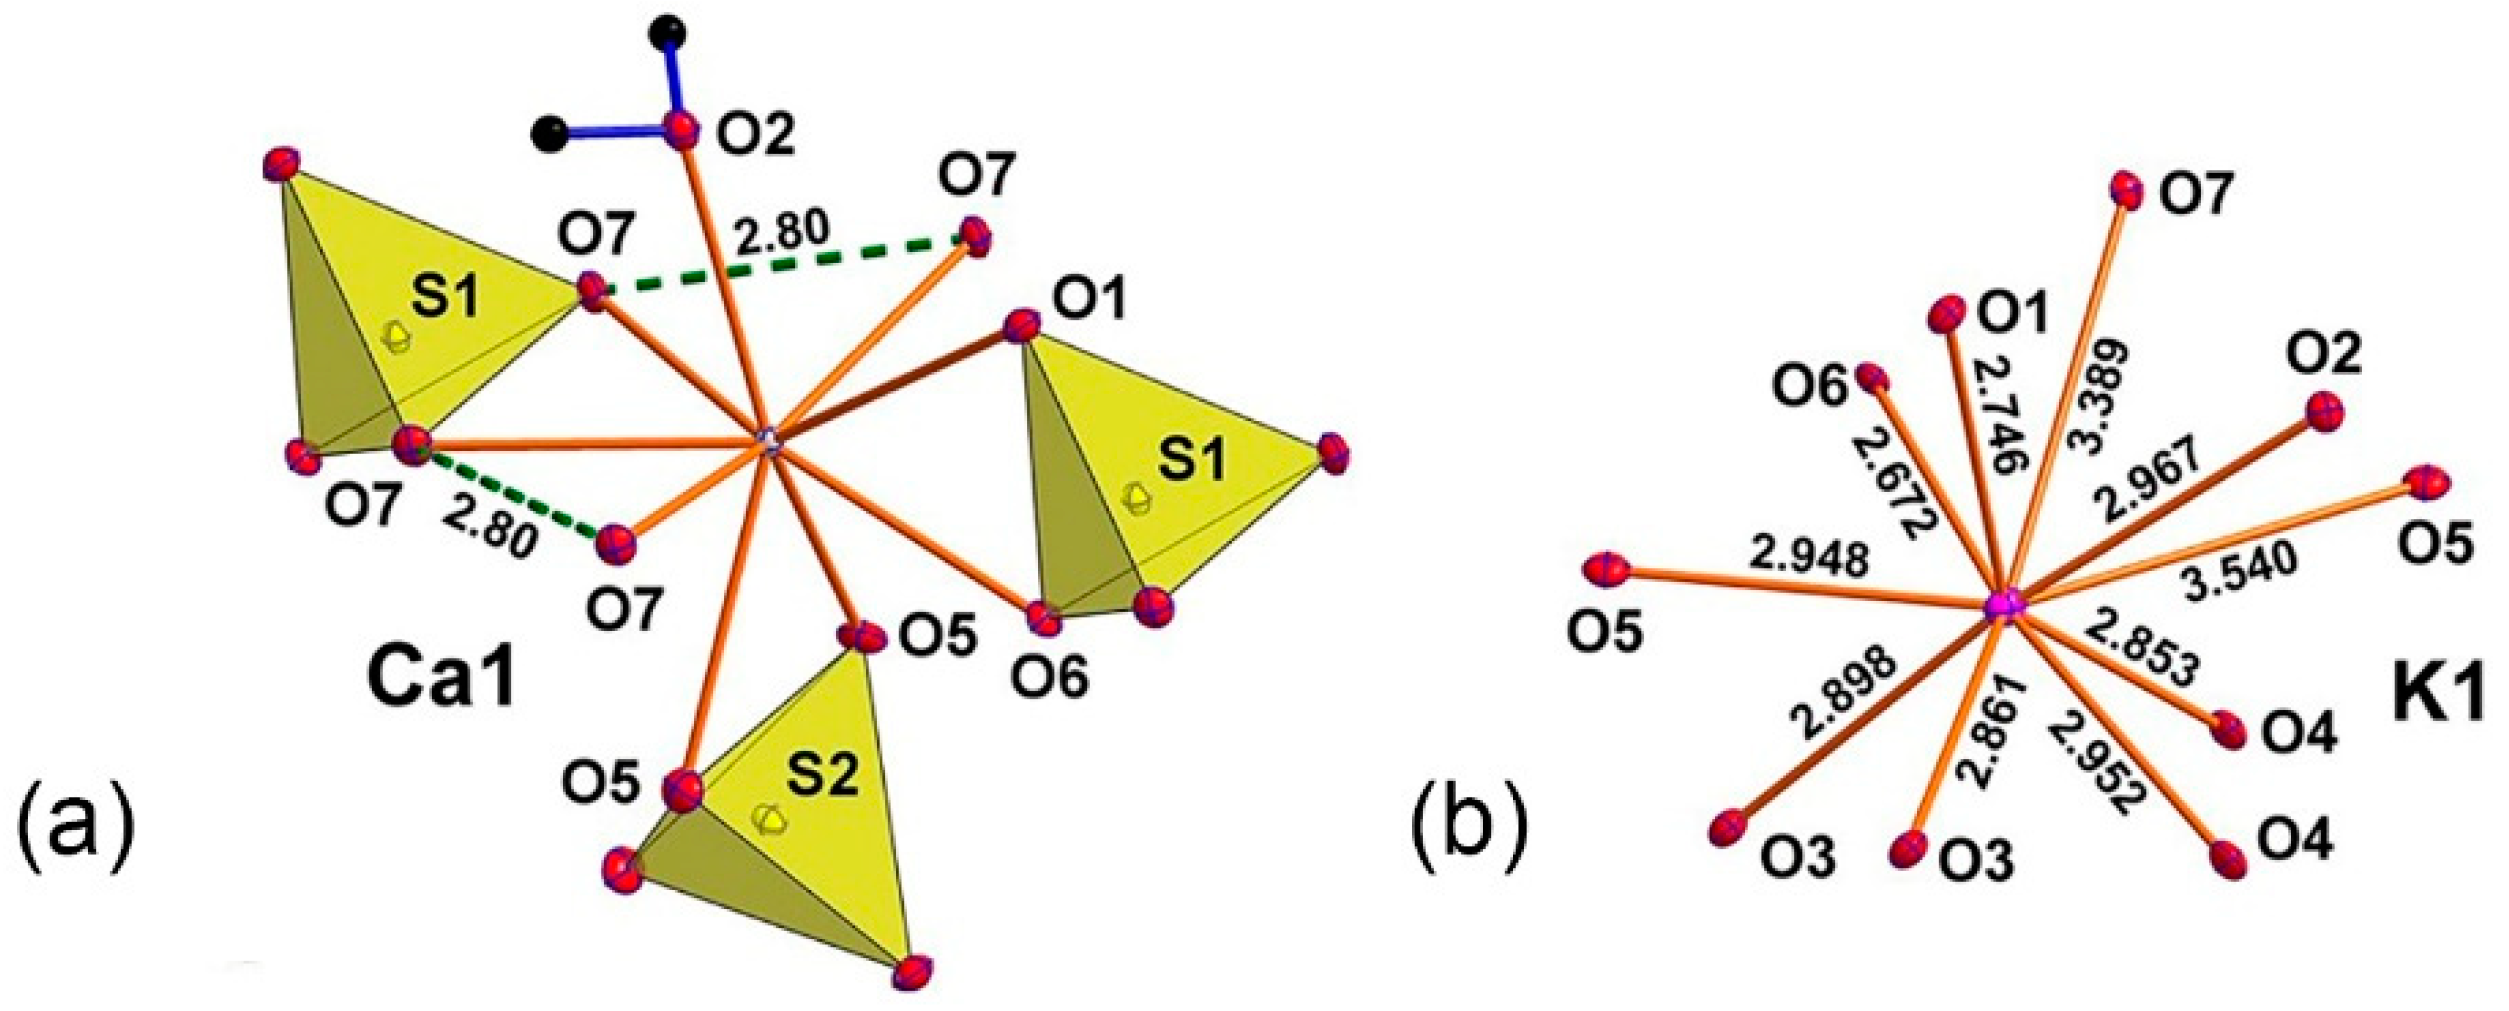
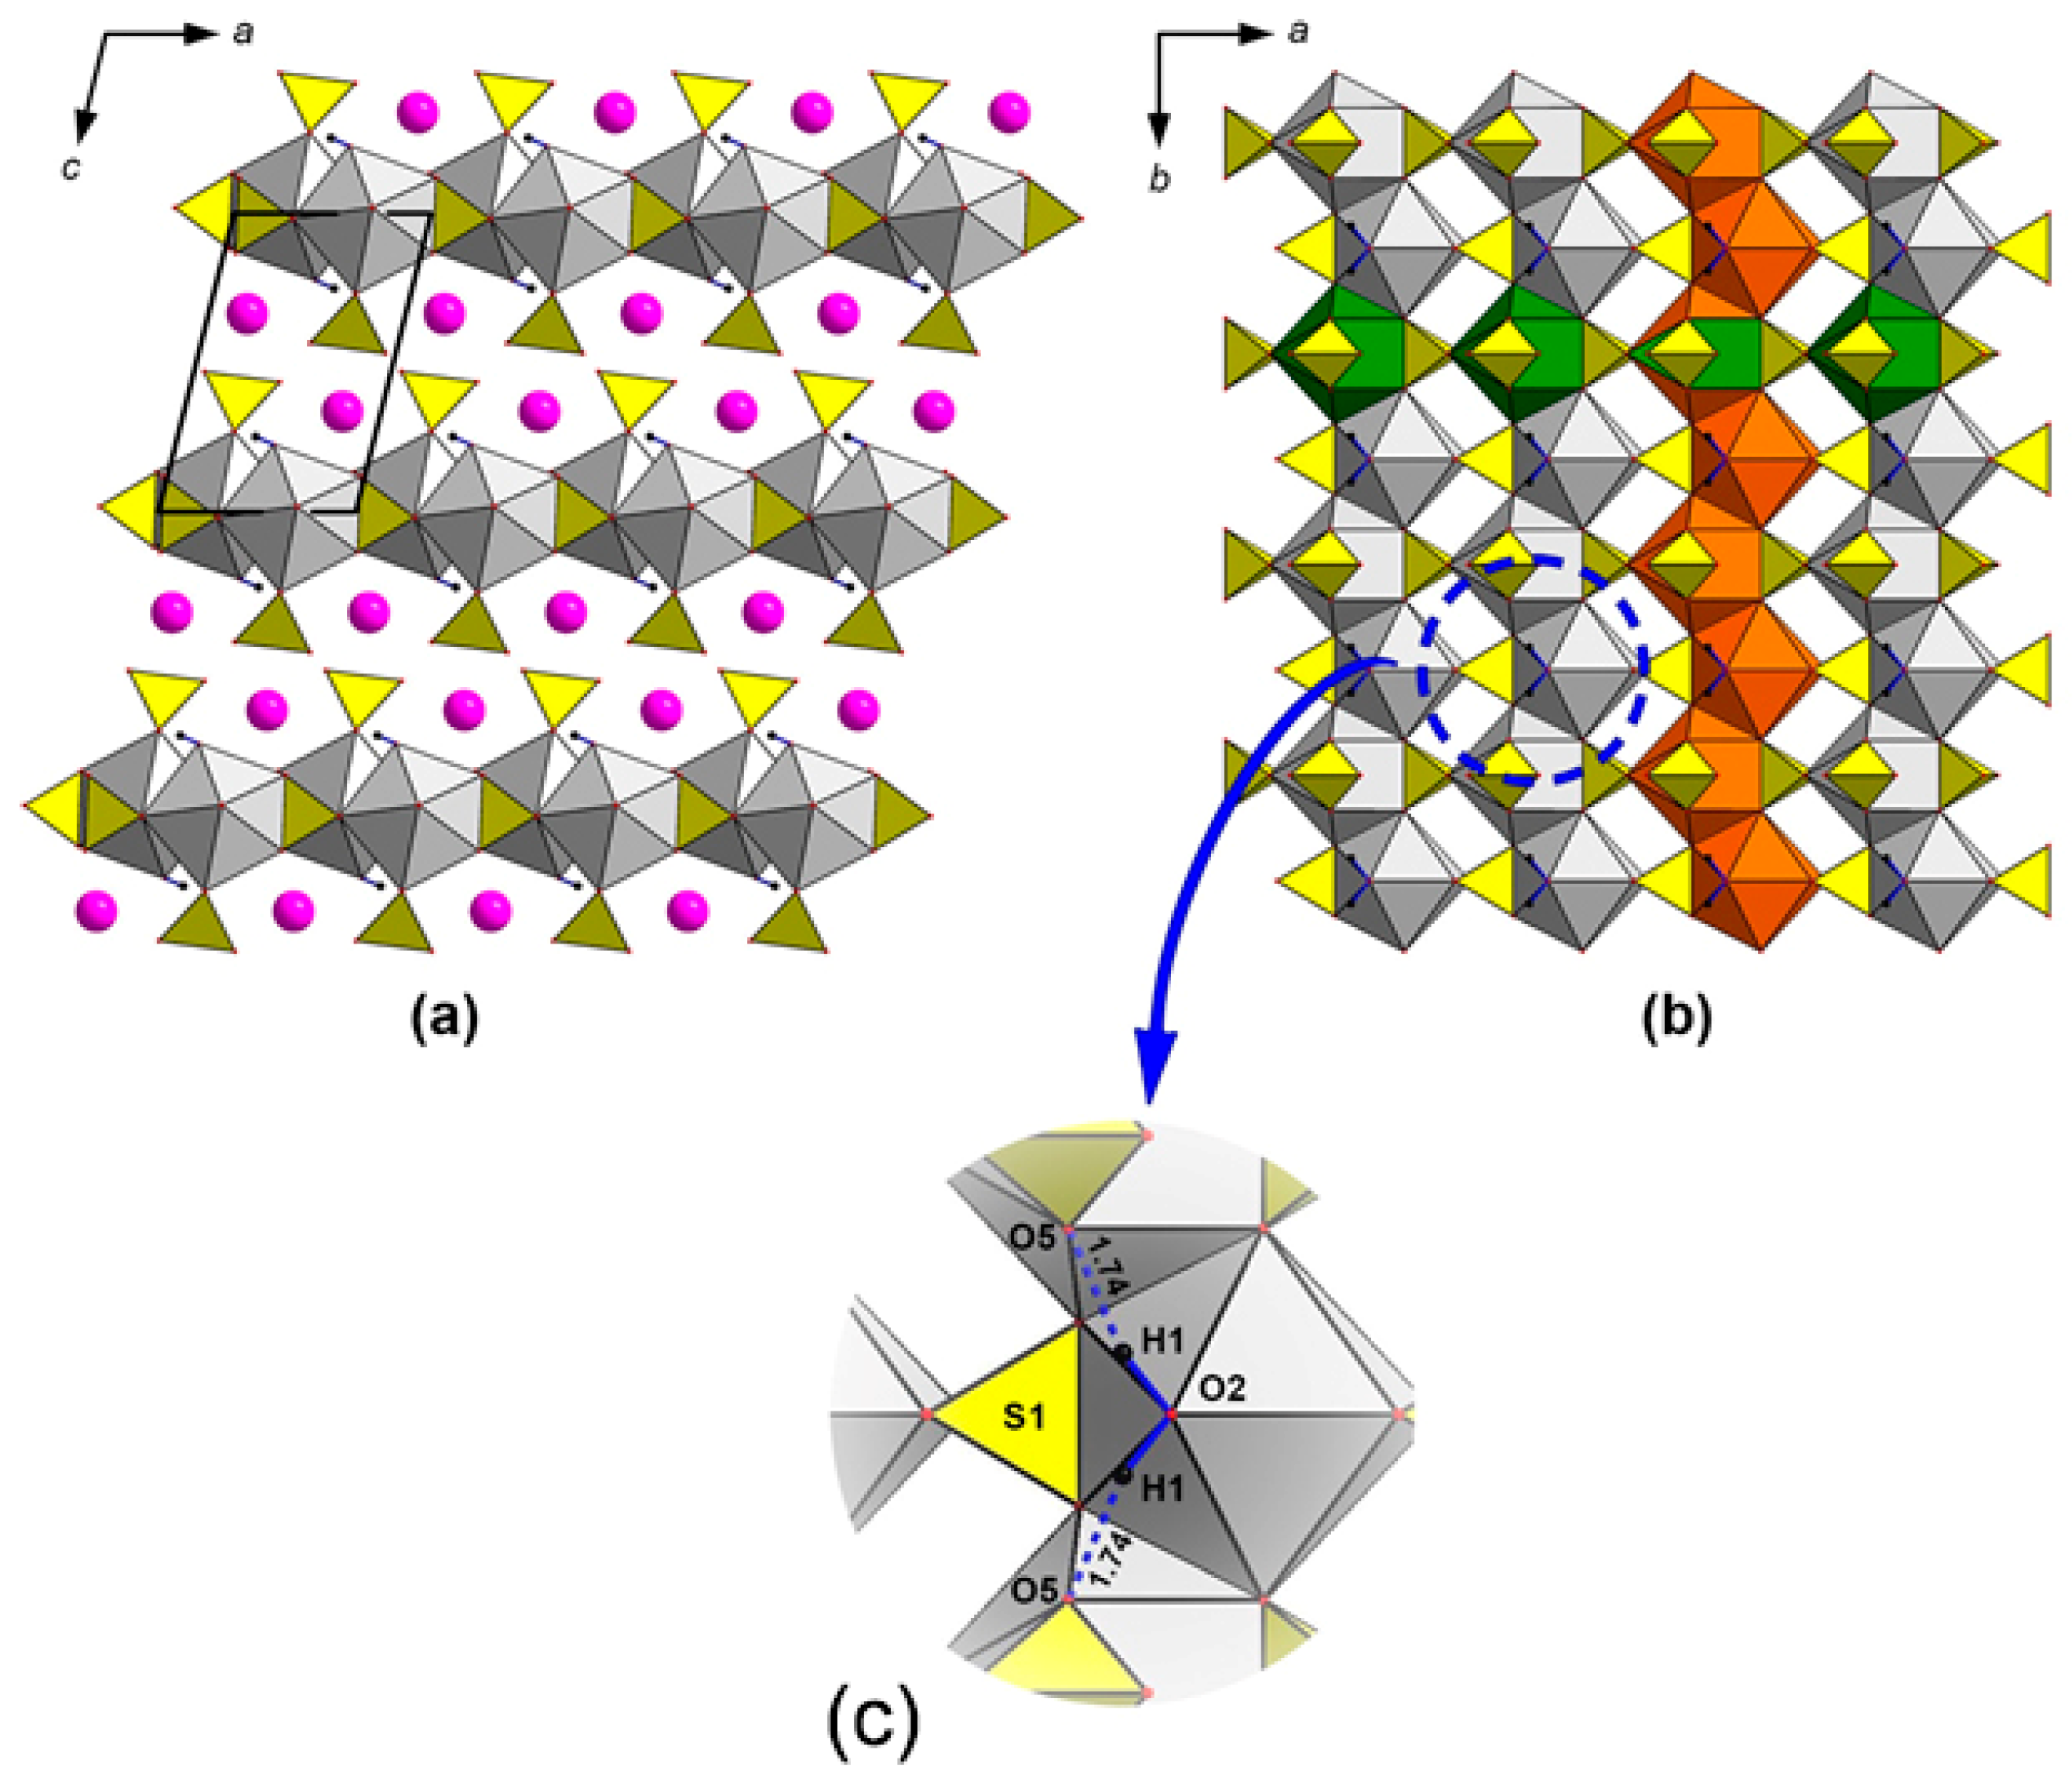
3.1. Syngenite Structure Refinement at −173 °C

The crystal structure of syngenite was refined using a starting model from [18] (Table 1). Selected interatomic distances (Å) in the crystal structure of syngenite are given in Table 2. Bond valence analysis (in valence units = v.u.) is provided in Table 3. Atomic coordinates and displacement parameters are reported in Table 4.
The coordination environment of Ca2+ consists of nine oxygen atoms, thus forming the CaO9 polyhedron (Figure 1a) with individual Ca–O bond lengths in the range from 2.4008(16) Å to 2.7040(16) Å. One of the CaO9 vertices is occupied by an H2O molecule. K+ cations have KO10 coordination environments with <K–O> = 2.921 Å (Figure 1b). All the K–O bonds ≤ 3.55 Å were taken into consideration.
The crystal structure of syngenite contains two symmetrically independent sites of S6+ cations. Each one is surrounded by four oxygen atoms forming regular tetrahedra with S–O bond lengths varying from 1.4684(16) Å to 1.4821(10) Å and from 1.4779(17) Å to 1.4846(11) Å in S1O4 and S2O4 tetrahedra, respectively.
The crystal structure of syngenite is based on layers formed by CaO9 and SO4 polyhedra and parallel to the ab plane (Figure 2a). These layers are formed by the bassanite-type infinite chains (Figure 2b). The chains are linked into layers via common O7–O7 edges of 2.80 Å. Potassium atoms are located in the interlayer space.

3.2. Raman Spectroscopy

Raman spectroscopy (Figure 3) was performed under ambient conditions. A list of the observed Raman peaks is reported in Table 5 with tentative assignments based on [33,34].

3.3. DSC and TGA Analysis

A polycrystalline probe of 8 mg was placed in an alundum crucible with a lid. The heating was performed from 40 to 500 °C and subsequently cooled down to 200 °C at 10°/min in an air (O2) flow of 50 mL/min. TG and DSC curves of syngenite are shown in Figure 4. The TG curve shows two main mass loss steps. The first one is associated with the loss of the adsorbed water, and the second is related to the dehydration of syngenite.
The initial syngenite crystal (Figure 4) used for the thermal analysis was transparent and colorless and had cleavage planes along the elongation. Several splinter-like pieces of the different size, milky white and opaque, are observed at the bottom of the crucible after the heating. During the dehydration, the initial crystal was destroyed along cleavage cracks. At 267 °C, a rapid dehydration led to the emergence of internal stresses, which tore the initial syngenite crystal and split it into fragments. The stage lasted for ~120 s and the mass ejection fit into 15 s. This can be explained by a sharp increase in the surface area, i.e., the destruction of the initial syngenite crystal into smaller crystalline pieces.
In [15], Kloprogge et al. observed the two stages of water loss in the syngenite structure: (i) at 100 °C; (ii) in the range of 250–350 °C. In our study, thermal effects are manifested in two temperature ranges: 267–323 °C and 429–491 °C. Such a difference is probably due to the experimental conditions and, most importantly, the purity of the sample. Klopprogge et al. conducted the experiment in a flowing nitrogen atmosphere (80 cm3/min) at 2 °C/min, while we performed the thermal analysis in an airflow of 50 mL/min and at 10 °C/min. In [15], the authors note the presence of gypsum as an impurity. Our data show that the crystallization of the calciolangbeinite phase, K2Ca2(SO4)3, is not observed in the temperature range of 260–420 °C. This temperature range is intermediate to the complete transformation of syngenite to a mixture of anhydrous sulfates. Notably, syngenite is not completely amorphized during the dehydration process, as observed for many hydrated sulfates.

3.4. Low- and High-Temperature Powder X-Ray Diffraction

The experiment was performed under a low vacuum of 600 Pa at two temperature ranges: from −180 °C to 250 °C and from 20 °C to 800 °C. For the high-temperature experiment, a platinum plate was chosen to avoid a reaction of the sample with the metal. Three stages of syngenite transformation were identified using PXRD data. Syngenite is stable across the temperature range from −180 °C to 250 °C (marked in blue in Figure 5). Several ice peaks in the range from −80 to −60 °C were identified. At the first stage (marked in red in Figure 5), between 260 and 420 °C, syngenite dehydrates and transforms to anhydrous phases. The reliable determination of the phase composition at this interval was not achieved. At the second stage (marked in black) from 440 to 580 °C the following phases were identified: K2Ca2(SO4)3 [35], β-K2(SO4) (orthorhombic) [36], and α-K2(SO4) (hexagonal) [37]. At the third stage (marked in green), in the range 600–800 °, two phases are retained from the previous stage: hexagonal K2(SO4) and K2Ca2(SO4)3. The behavior of syngenite at increasing temperatures can be summarized as follows (1):
2K2Ca(SO4)2·H2O = K2Ca2(SO4)3 + K2(SO4) + 2H2O

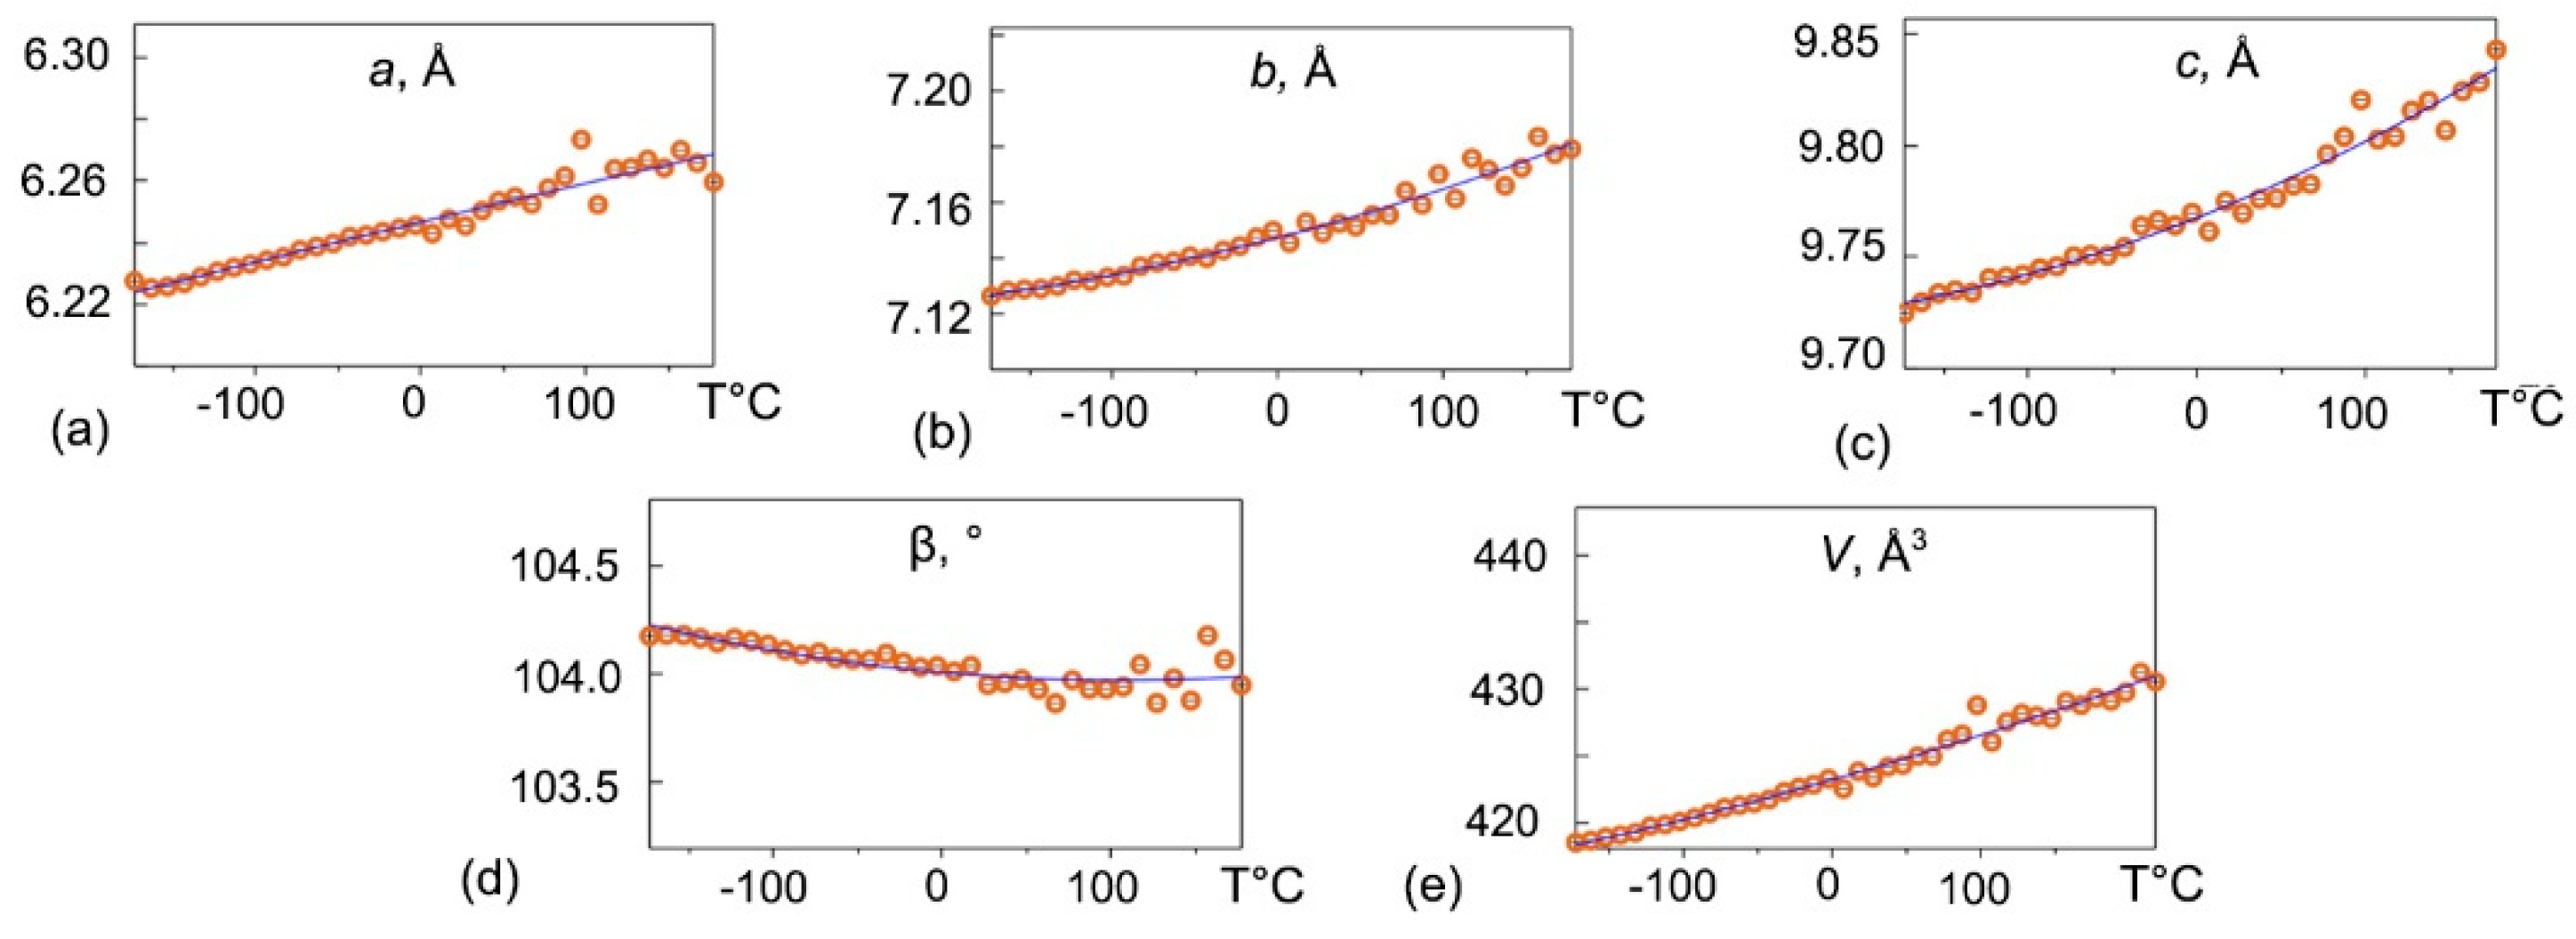
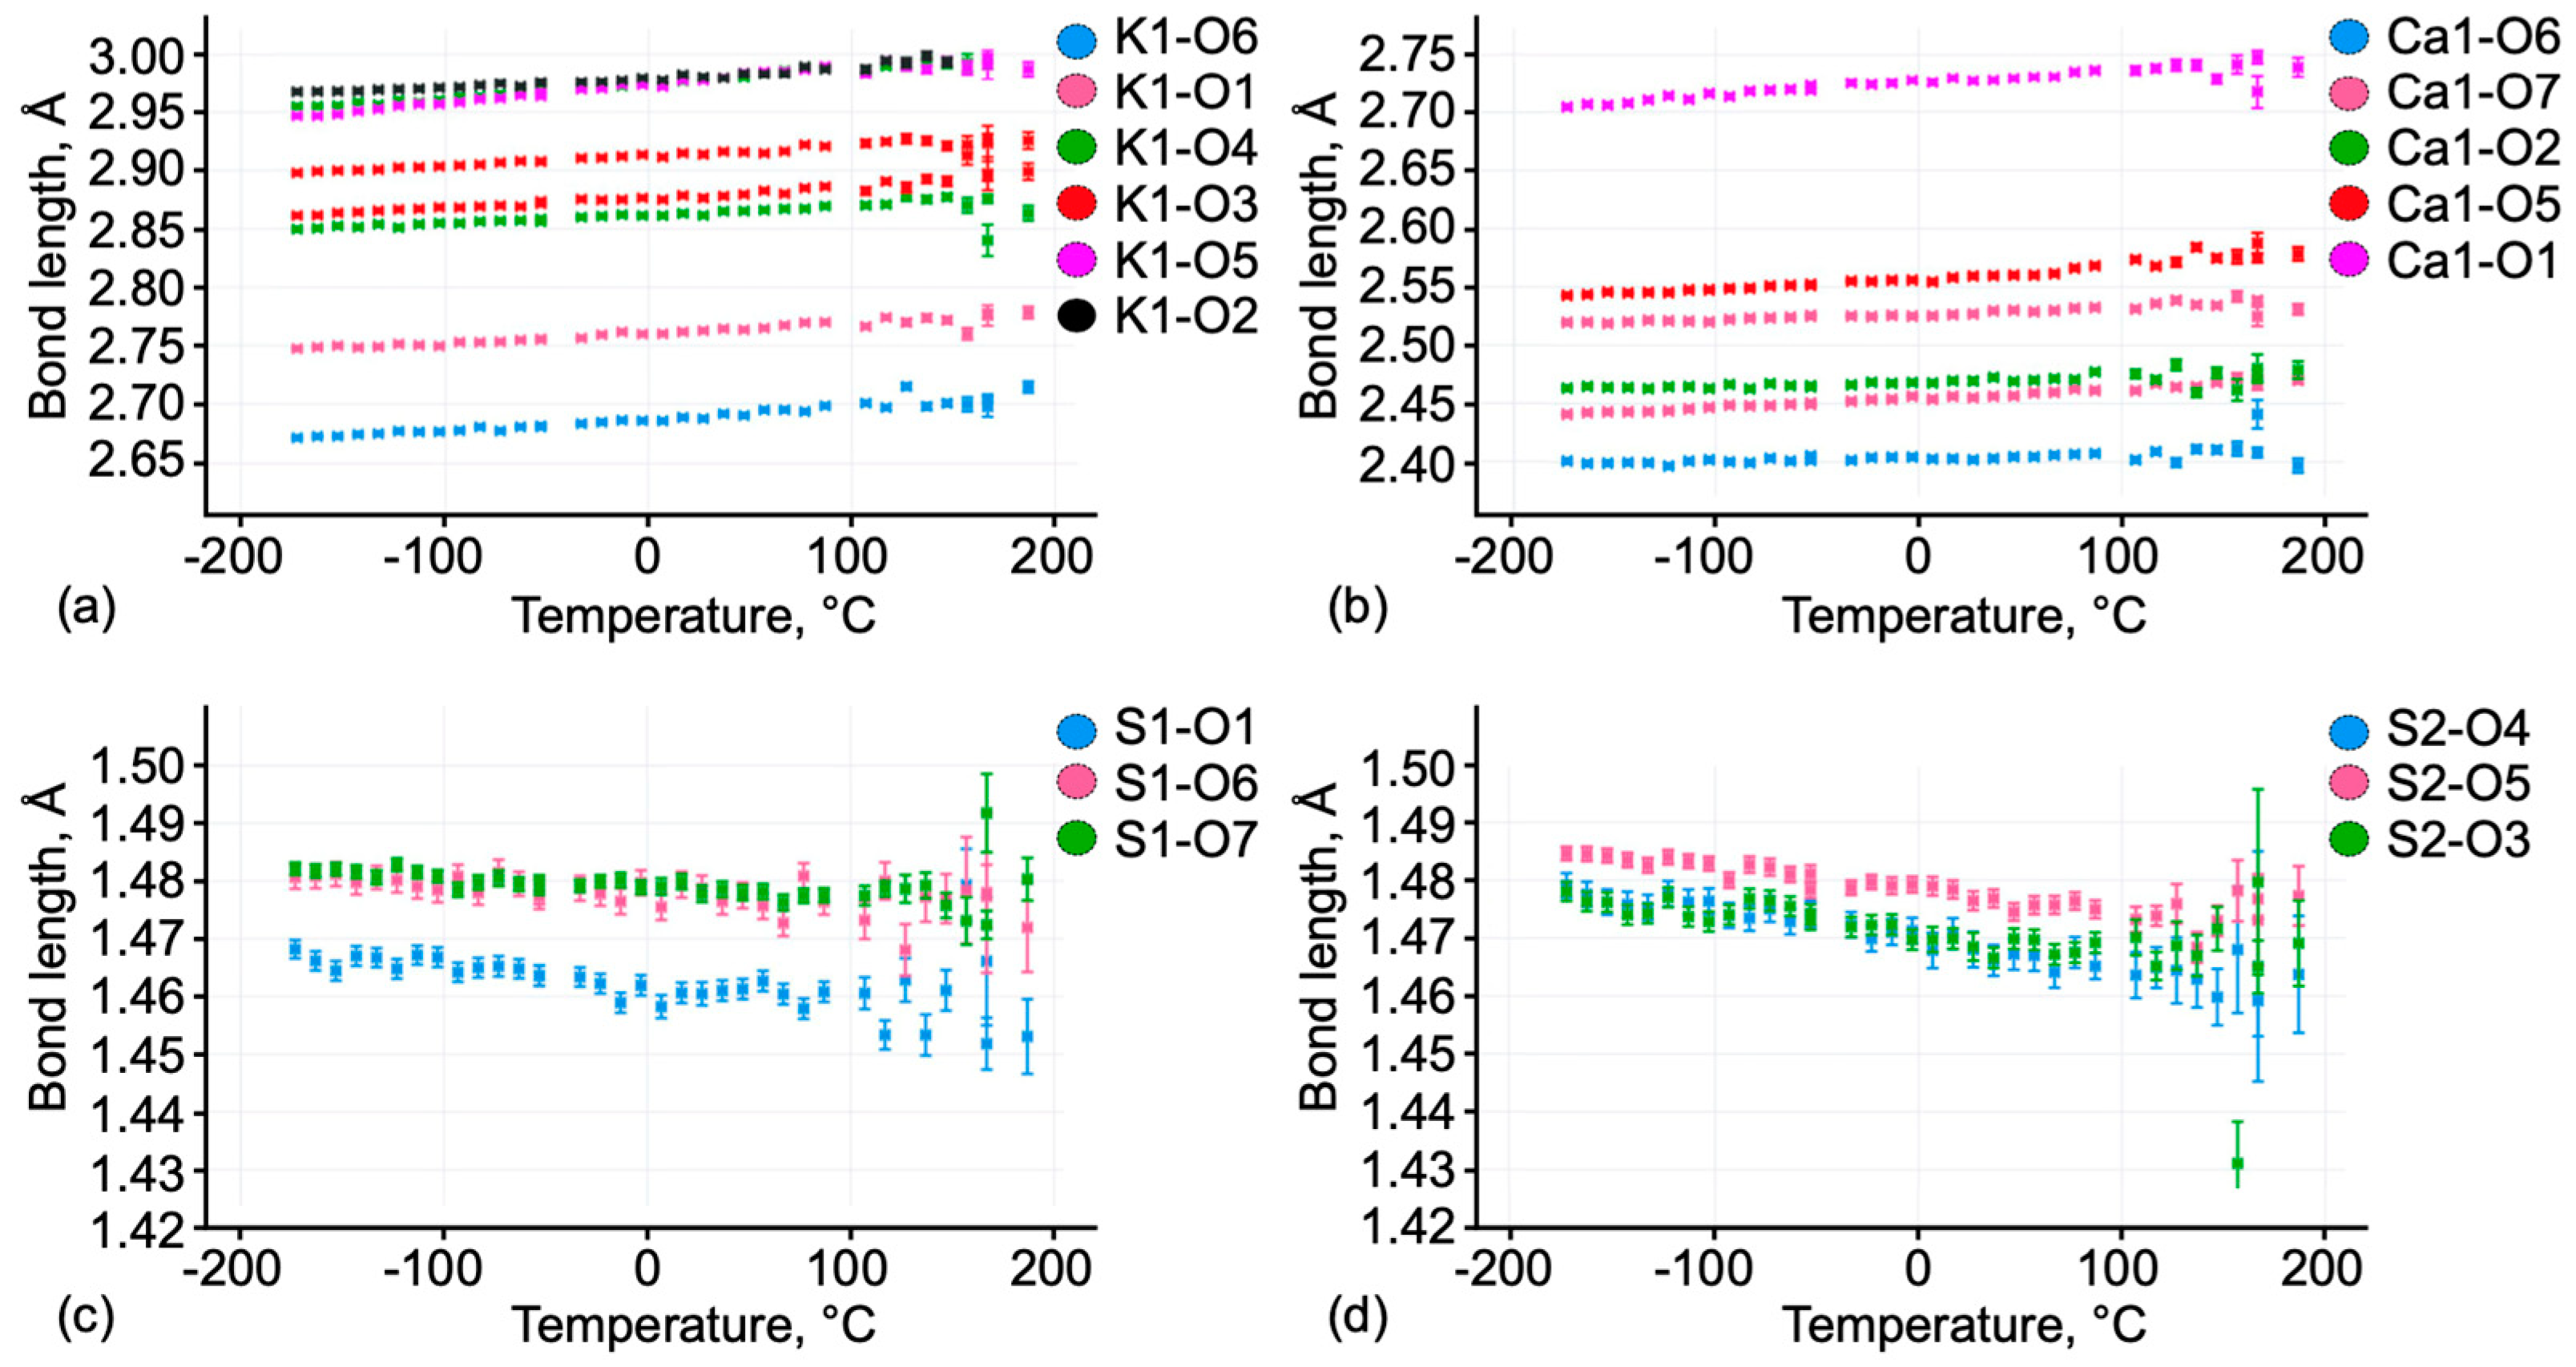
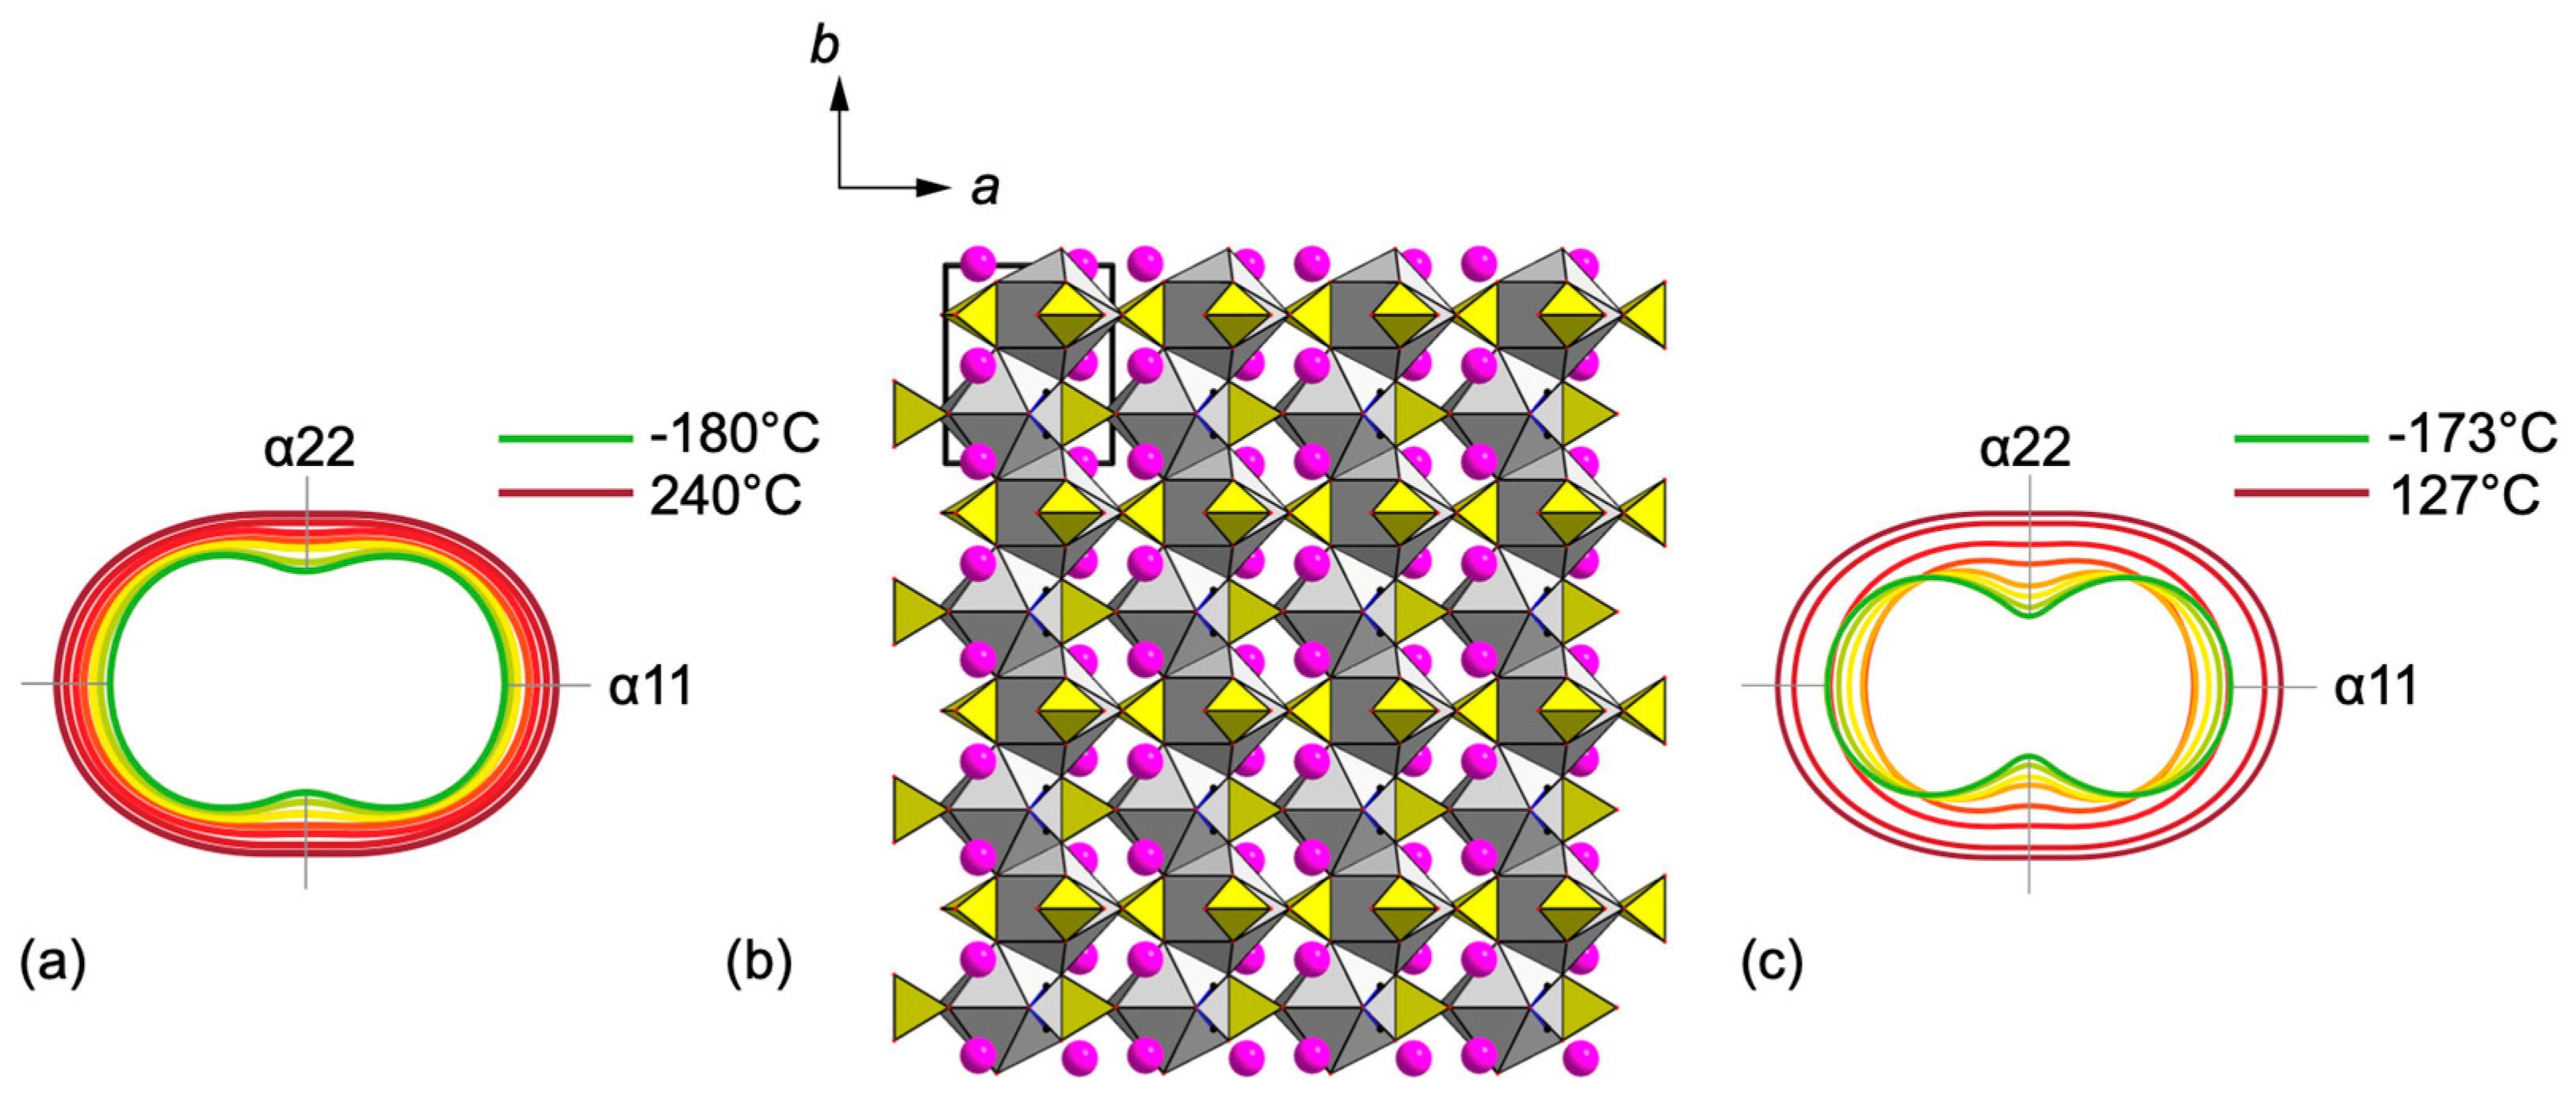
3.5. Thermal Expansion

The evolution of syngenite unit-cell parameters determined by PXRD upon heating in the range from −180 to 250 °C is shown in Figure 6. The unit-cell parameters a, b, c, and V increase upon the temperature rise, whereas the β angle value decreases. The maximum thermal expansion occurs along the monoclinic angle bisector. The temperature dependence of the unit-cell parameters of syngenite can be described by the following Functions (2)–(6):
a(T) = 6.24966(100) + 0.148965(81) × 10−3 T
b(T) = 7.14920(12) + 0.149081(78) × 10−3 T + 0.077849(12) × 10−6 T2
c(T) = 9.76445(23) + 0.298622(15) × 10−3 T + 0.013513(12) × 10−6 T2
β(T) = 104.03373(10) − 0.795529(64) × 10−3 T + 0.883099(51) × 10−6 T2
V(T) = 423.2637(21) + 33.379234(14) × 10−3 T + 9.062139(11) × 10−6 T2
Thermal expansion coefficients (×10−6 °C−1) of the syngenite unit cell are listed in Table 6 and Table 7.
Thermal expansion studies by the means of the single-crystal X-ray diffraction upon heating were performed with a 10 °C step. The crystal structure data quality decreases significantly above 167 °C, thus preventing a detailed interpretation. The evolution of syngenite unit-cell parameters determined by LTSCXRD and HTSCXRD upon heating in the range from −174 to 167 °C is shown in Figure 7. The unit-cell parameters a, b, c, and V increase upon the temperature rise, whereas the β angle value decreases. The temperature dependence of the unit-cell parameters of syngenite can be described by the second order polynomials (7)–(11):
a(T) = 6.20612(95) + 0.179146(61) × 10−3 T − 0.021(65) × 10−6 T2
b(T) = 7.11511(77) + 0.1540(50) × 10−3 T + 0.204(53) × 10−6 T2
c(T) = 9.72017(15) + 0.2991(93) × 10−3 T + 0.45(10) × 10−6 T2
β(T) = 104.43578(14) − 0.694(92) × 10−3 T + 3.27(99) × 10−6 T2
V(T) = 423.13(13) + 32.05(85) × 10−3 T + 24.9(91) × 10−6 T2
The crystal structure of syngenite was refined in the temperature range from −174 to 167 °C. The plots of bond-length evolution upon heating are given in Figure 8. M–O bonds increase more intensely compared to S–O bonds in the sulfate tetrahedra.

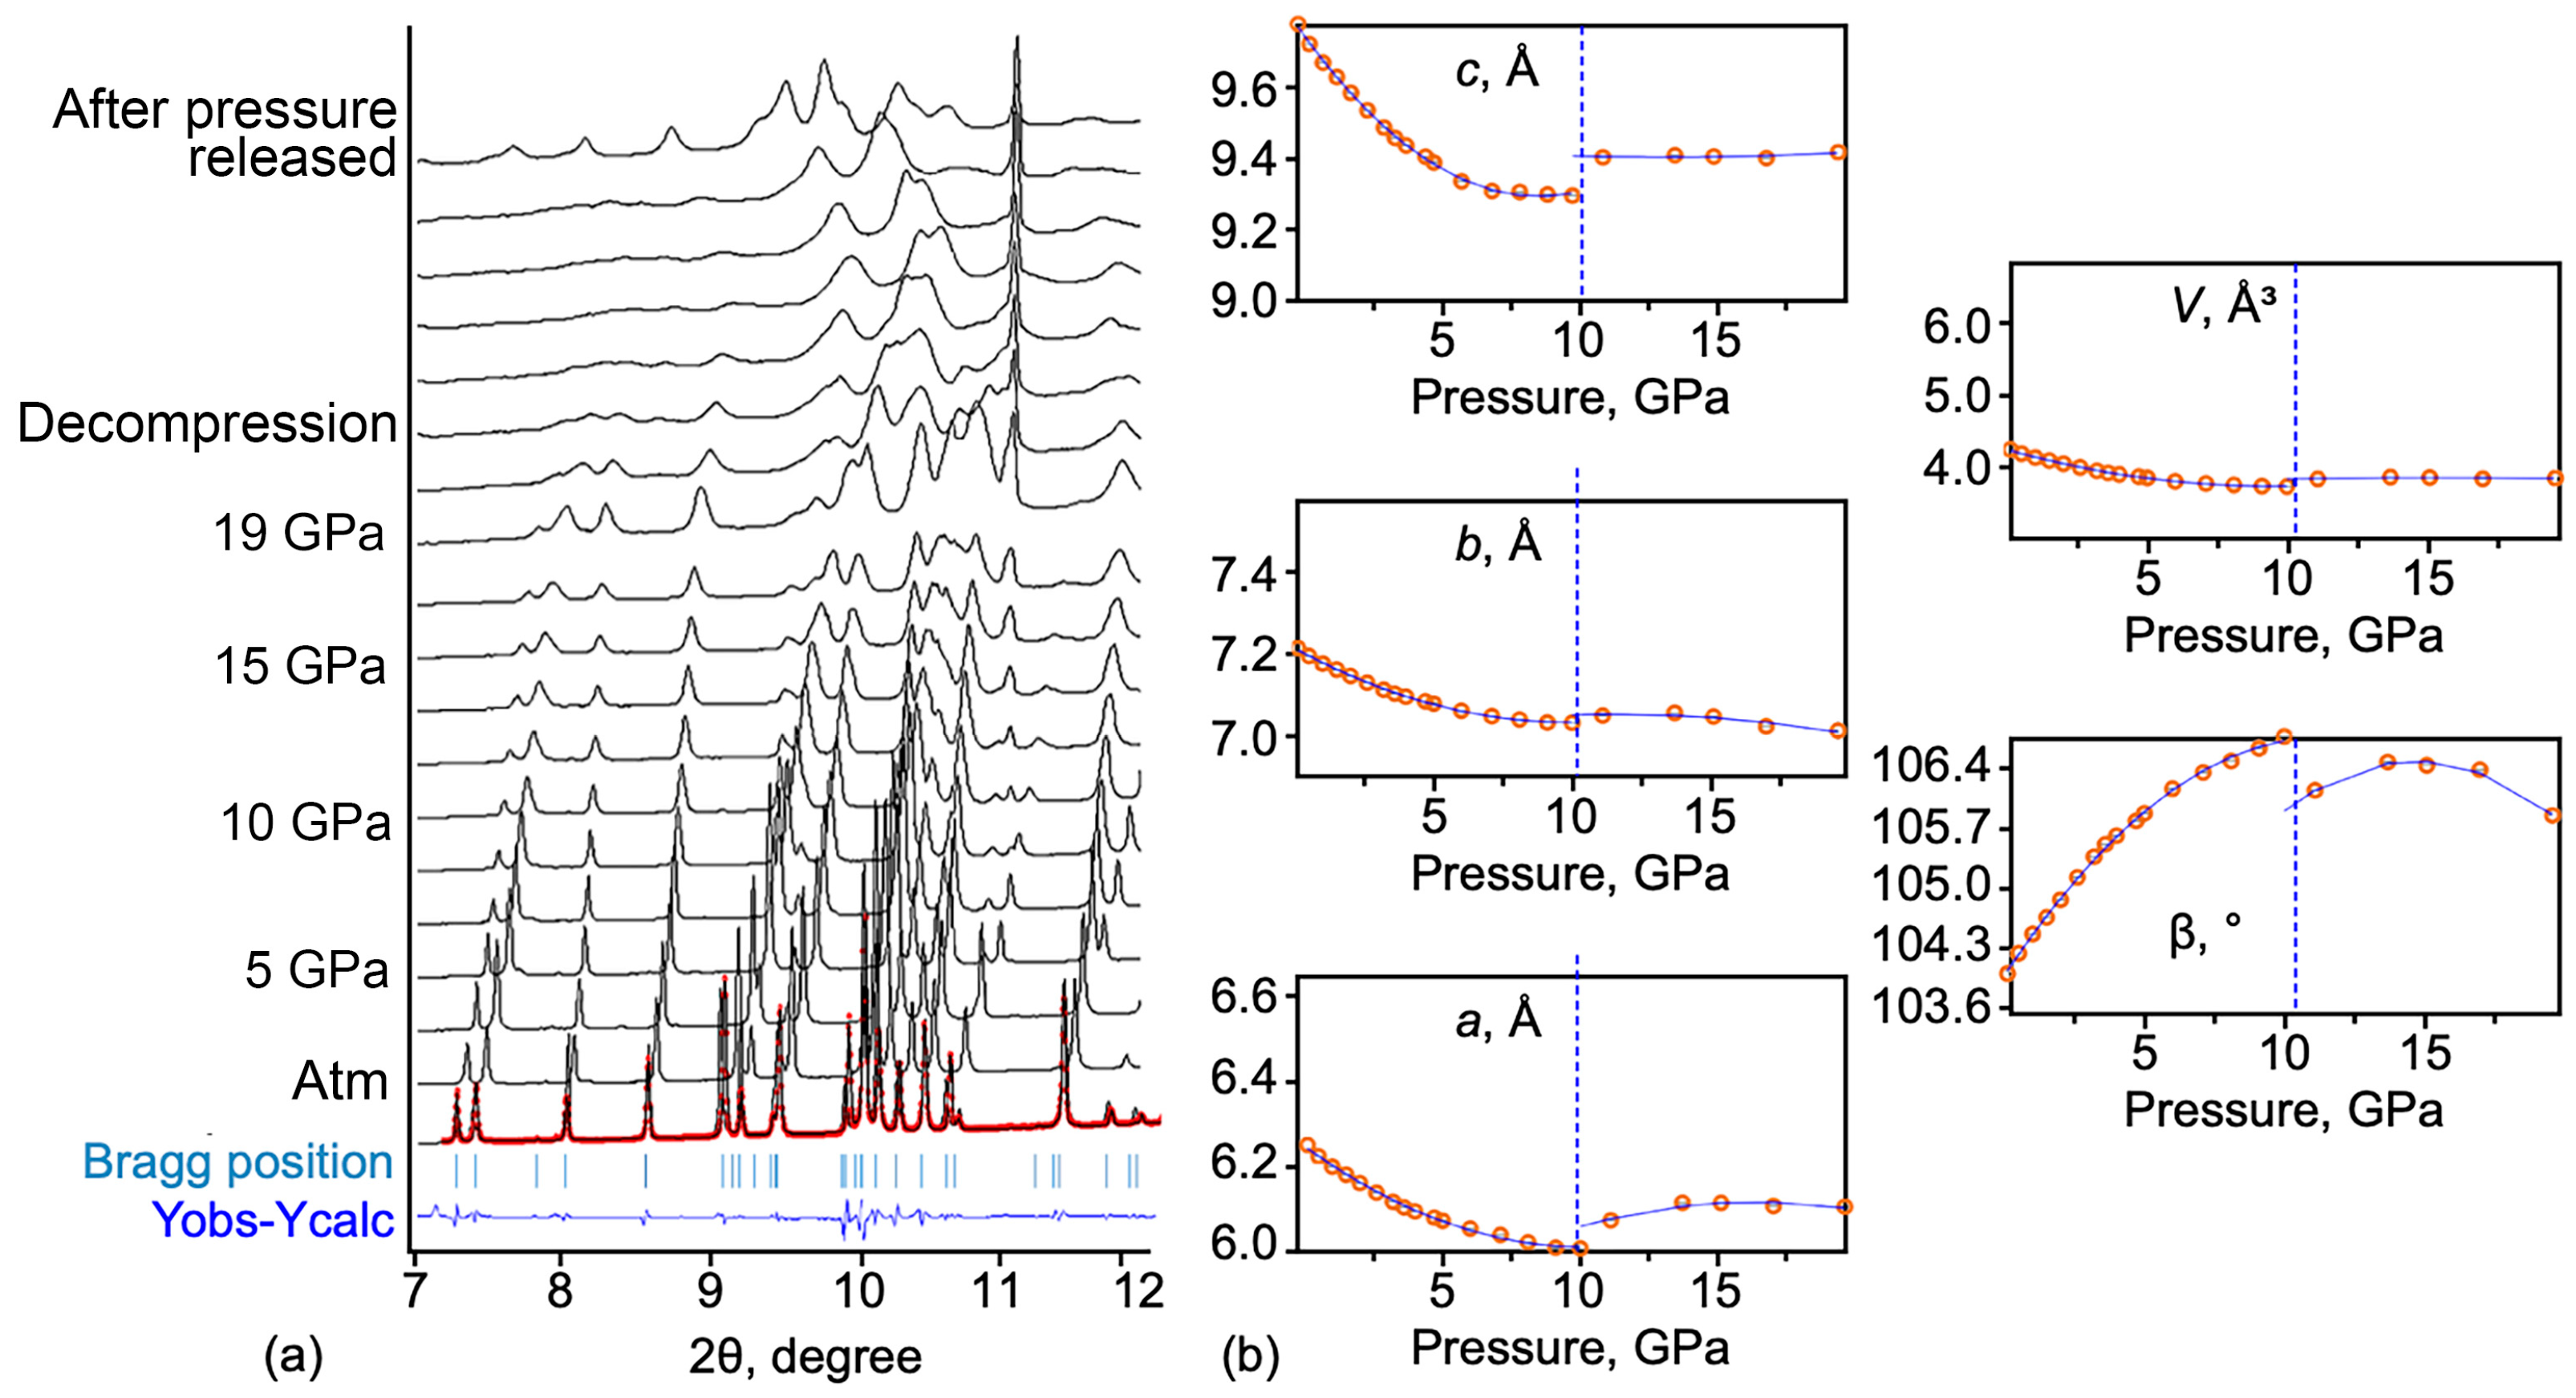
3.6. Baric Compression

A series of high-pressure powder X-ray data was obtained. The evolution of the diffraction patterns upon pressure increase change is shown in Figure 9a. A profile refinement (le Bail) was performed for each pattern. Obtained data quality allowed the refinement of the unit-cell parameters of syngenite upon the pressure increase. Figure 9b shows the evolution of the unit-cell parameters of syngenite as a function of pressure. The high-pressure study revealed that the unit-cell parameters a, b, and c decrease up to ~10 GPa. In contrast, the β angle increases upon the pressure rise from 103.99(1)° at ambient pressure to 106.47(1)° at 13.7 GPa. At ~10 GPa, the shifting of all parameters is observed, indicating a potential phase transition of the first order.
The unit-cell parameters were approximated by the second-order polynomials for the pressure range from 0.1 to 11 GPa (Equations (12)–(16)):
a(P) = 6.24517(27) − 0.04669(13) P + 0.00231(12) P2
b(P) = 7.14585(14) − 0.03699(67) P + 0.00188(66) P2
c(P) = 9.77624(37) − 0.11031(18) P + 0.00627(178) P2
β(P) = 103.98117(19) + 0.4907(94) P − 0.0216(924) P2
V(P) = 423.19058(42) − 10.7560(20) P + 0.57311(2) P2
The unit-cell parameters were also approximated by the second-order polynomials for the pressure range from 11 to 19.6 GPa (Equations (17)–(21)):
a(P) = 5.73663(12) − 0.04613(16) P − 0.00141(51) P2
b(P) = 6.89155(12) + 0.01594(16) P − 0.00068(512) P2
c(P) = 9.45595(82) − 0.00807(11) P + 0.00031(356) P2
β(P) = 100.79932(56) + 0.7725(75) P − 0.0262(245) P2
V(P) = 369.35474(18) + 1.954(23) P − 0.0631(7) P2
The baric compression tensor was calculated for the syngenite crystal structure (Table 8). Figure 10 presents the dynamics of changes in the thermal expansion tensor obtained via the powder XRD (Figure 10a) and via the single-crystal XRD (Figure 10b). The dynamics of the compression tensor of the syngenite crystal structure upon increasing pressure from 0.1 to 10 GPa is shown in Figure 10c.

4. Concluding Remarks

In this paper, attention was given to the evolution of the syngenite crystal structure under low and high temperatures and under high pressure. The single-crystal temperature variable XRD studies are in good agreement with the powder temperature variable XRD studies (Figure 11). For the first time, a detailed study of syngenite in the range of negative temperatures down to −180 °C was performed. It indicates that there are no phase transitions in this temperature range, and the syngenite crystal structure is stable. The bond lengths in K, Ca, and S polyhedra increase upon heating. Nevertheless, the general coordination environments of atoms do not change. The strongly anisotropic character of the thermal expansion is preserved over the entire temperature range up to 240 °C. The largest expansion of the structure is observed along the α11 direction, which is consistent with the layered architecture and the elongation of the weak K–O bonds upon heating. The minor thermal expansion along α22 is registered in the plane of the [Ca(SO4)2]2− layer, formed by the bassanite-type chains.
HP synchrotron experiments of syngenite up to 20 GPa were performed for the first time. The maximum compression occurs along the larger diagonal of the parallelogram ac, i.e., in the same direction as the largest observed thermal expansion. This behavior is typical for monoclinic structures. The probable phase transition is registered at 10 GPa. After the decompression, the syngenite post-phase becomes partially amorphized. To understand the nature of the syngenite phase transition, it is necessary to perform single-crystal high-pressure synchrotron measurements.

Author Contributions

A.B. (Anna Baikina): single-crystal and powder X-ray diffraction data collection, data curation, writing-original draft preparation, visualization, interpretation; A.Z.: writing—original draft preparation, data curation, high-pressure X-ray data interpretation; A.B. (Artem Borisov): single-crystal X-ray study, crystal structure visualization, data curation, writing—original draft preparation; F.A.: high-pressure synchrotron experiments, writing—original draft preparation and revision; A.H.: writing—original draft preparation; V.U.: thermal analysis; O.S.: conceptualization, manuscript revision. All authors have read and agreed to the published version of the manuscript.

Funding

This research received no external funding.

Data Availability Statement

Data are contained within the article.

Acknowledgments

The synchrotron X-ray diffractions were performed at the Xpress beamline from Elettra Synchrotron Radiation Facility thanks to proposal number 20220113. Technical support (project # 118201839) by the SPbSU X-ray Diffraction Centre is gratefully acknowledged.

Conflicts of Interest

The authors declare no conflicts of interest.

References

  1. Spencer, R.J. Sulfate minerals in evaporite deposits. Rev. Mineral. Geochem. 2000, 40, 173–192. [Google Scholar] [CrossRef]
  2. Babel, M.; Schreiber, B.C. Geochemistry of evaporites and evolution of seawater. In Treatise on Geochemistry, 2nd ed.; Holland, H.D., Turekian, K.K., Eds.; Elsevier: Oxford, UK, 2014; Volume 3, pp. 483–560. [Google Scholar] [CrossRef]
  3. Pekov, I.V.; Kovrugin, V.M.; Siidra, O.I.; Chukanov, N.V.; Belakovskiy, D.I.; Koshlyakova, N.N.; Yapaskurt, V.O.; Turchkova, A.G.; Möhn, G. Antofagastaite, Na2Ca(SO4)2·1.5H2O, a new mineral related to syngenite. Mineral. Mag. 2019, 83, 781–790. [Google Scholar] [CrossRef]
  4. Snow, M.R.; Pring, A.; Allen, N. Minerals of the Wooltana Cave, Flinders Ranges, South Australia. Trans. R. Soc. S. Aust. 2014, 138, 214–230. [Google Scholar] [CrossRef]
  5. Vaniman, D.T.; Bish, D.L.; Ming, D.W.; Bristow, T.F.; Morris, R.V.; Blake, D.F.; Chipera, S.J.; Morrison, S.M.; Treiman, A.H.; Rampe, E.B.; et al. Mineralogy of a mudstone at Yellowknife Bay, Gale crater, Mars. Science 2014, 343, 1243480. [Google Scholar] [CrossRef] [PubMed]
  6. Wang, A.; Freeman, J.J.; Jolliff, B.L.; Chou, I.-M. Sulfates on Mars: A systematic Raman spectroscopic study of hydration states of magnesium sulfates. Geochim. Cosmochim. Acta 2006, 70, 6118–6135. [Google Scholar] [CrossRef]
  7. García-Florentino, C.; Gomez-Nubla, L.; Huidobro, J.; Torre-Fdez, I.; Ruíz-Galende, P.; Aramendia, J.; Hausrath, E.M.; Castro, K.; Arana, G.; Madariaga, J.M. Interrelationships in the gypsum-syngenite-gorgeyite system and their possible formation on Mars. Astrobiology 2021, 21, 332–344. [Google Scholar] [CrossRef]
  8. Comodi, P.; Nazzareni, S.; Zanazzi, P.F.; Speziale, S. High-pressure behavior of gypsum: A single-crystal X-ray study. Am. Mineral. 2008, 93, 1530–1537. [Google Scholar] [CrossRef]
  9. Bradbury, S.E.; Williams, Q. X-ray diffraction and infrared spectroscopy of monazite-structured CaSO4 at high pressures: Implications for shocked anhydrite. J. Phys. Chem. Solids 2009, 70, 134–141. [Google Scholar] [CrossRef]
  10. Neville, A. The confused world of sulfate attack on concrete. Cem. Concr. Res. 2004, 34, 1275–1296. [Google Scholar] [CrossRef]
  11. Smillie, S.; Moulin, E.; Glasser, F.P. Freshness of cement: Conditions for syngenite CaK2(SO4)2·H2O formation. Adv. Cem. Res. 1993, 5, 93–96. [Google Scholar] [CrossRef]
  12. Zhao, Y.; Hu, X.; Yuan, Q.; Shi, C. The change of phase assemblage and desorption of bound chloride for seawater cement paste under sulfate attack. Cem. Concr. Compos. 2023, 139, 105033. [Google Scholar] [CrossRef]
  13. Dankiewicz, J.; Wieczorek-Ciurowa, K. Kinetic study of the thermal dehydration of syngenite K2Ca(SO4)2·H2O under isothermal conditions. J. Therm. Anal. Calorim. 1978, 13, 543–552. [Google Scholar] [CrossRef]
  14. Dankiewicz, J.; Wieczorek-Ciurowa, K. Kinetic study of the thermal dehydration of syngenite K2Ca(SO4)2·H2O under non-isothermal conditions. J. Therm. Anal. Calorim. 1979, 15, 11–24. [Google Scholar] [CrossRef]
  15. Kloprogge, J.T.; Ding, Z.; Martens, W.N.; Schuiling, R.D.; Duongc, L.V.; Frost, R.L. Thermal decomposition of syngenite, K2Ca(SO4)2·H2O. Thermochim. Acta 2004, 417, 143–155. [Google Scholar] [CrossRef]
  16. Gorogotskaya, L.I. Crystal structure of singenite K2Ca[SO4]2·H2O. Dokl. Acad. Nauk. SSSR 1964, 157, 67–69. (In Russian) [Google Scholar]
  17. Corazza, E.; Sabelli, C. The crystal structure of syngenite, K2Ca(SO4)2·H2O. Z. Kristallogr. 1967, 124, 398–408. [Google Scholar] [CrossRef]
  18. Bokii, G.B.; Pal’chik, N.A.; Antipin, M.Y. The crystal structure of syngenite. Sov. Phys. Crystallogr. 1978, 23, 141–143. (In Russian) [Google Scholar]
  19. Ballirano, P.; Belardi, G.; Maras, A. Refinement of the structure of synthetic syngenite K2Ca(SO4)2·H2O from X-ray powder diffraction data. Neues Jahrb. Für Mineral. 2005, 182, 15–21. [Google Scholar] [CrossRef]
  20. Barlow, N. Mars: An Introduction to Its Interior, Surface and Atmosphere; CUP: Cambridge, UK, 2008; p. 286. [Google Scholar] [CrossRef]
  21. Rigaku OD. CrysAlisPro Software System, Version 1.171.41.103a; Rigaku Corporation: Oxford, UK, 2021.
  22. Sheldrick, G.M. Crystal structure refinement with SHELXL. Acta Cryst. C 2015, 71, 3–8. [Google Scholar] [CrossRef]
  23. Gagné, O.C.; Hawthorne, F.C. Comprehensive derivation of bond-valence parameters for ion pairs involving oxygen. Acta Crystallogr. B 2015, 71, 562–578. [Google Scholar] [CrossRef]
  24. Raschenko, S.V. Chrystchemlib: A Python library and GUI for analysis of crystal structure datasets. J. Appl. Crystallogr. 2025, 58, 290–295. [Google Scholar] [CrossRef]
  25. Downs, R.T. Analysis of harmonic displacement factors. In High-Temperature and High-Pressure Crystal Chemistry; Hazen, R.M., Downs, R.T., Eds.; De Gruyter: Berlin, Germany, 2000; Volume 41, pp. 61–87. [Google Scholar] [CrossRef]
  26. Rigaku OD. PDXL: Integrated X-Ray Powder Diffraction Software; Rigaku Corporation: Oxford, UK, 2016. [Google Scholar]
  27. Bruker AXS. Topas V5.0; Bruker AXS: Karlsruhe, Germany, 2014. [Google Scholar]
  28. Bubnova, R.S.; Firsova, V.A.; Volkov, S.N.; Filatov, S.K. RietveldToTensor: Program for Processing Powder X-Ray Diffraction Data Under Variable Conditions. Glass Phys. Chem. 2018, 44, 33–40. [Google Scholar] [CrossRef]
  29. Prescher, C.; Prakapenka, V.B. DIOPTAS: A program for reduction of two-dimensional X-ray diffraction data and data exploration. High Press. Res. 2015, 35, 223–230. [Google Scholar] [CrossRef]
  30. Klotz, S.; Chervin, J.-C.; Munsch, P.; Le Marchand, G. Hydrostatic limits of 11 pressure transmitting media. J. Phys. D Appl. Phys. 2009, 42, 075413. [Google Scholar] [CrossRef]
  31. Dewaele, A.; Torrent, M.; Loubeyre, P.; Mezouar, M. Compression curves of transition metals in the Mbar range: Experiments and projector augmented-wave calculations. Phys. Rev. B 2008, 78, 104102. [Google Scholar] [CrossRef]
  32. Bubnova, R.S.; Firsova, V.A.; Filatov, S.K. Software for determining the thermal expansion tensor and the graphic representation of its characteristic surface (theta to tensor-TTT). Glass Phys. Chem. 2013, 39, 347–350. [Google Scholar] [CrossRef]
  33. Kloprogge, J.T.; Schuiling, R.D.; Ding, Z.; Hickey, L.; Wharton, D.; Frost, R.L. Vibrational spectroscopic study of syngenite formed during the treatment of liquid manure with sulphuric acid. Vib. Spectrosc. 2002, 28, 209–221. [Google Scholar] [CrossRef]
  34. Buzgar, N.; Buzatu, A.; Sanislav, I.V. The Raman study on certain sulfates. Analele Ştiinţifice Ale Univ. 2009, 55, 5–23. [Google Scholar]
  35. Speer, D.; Salje, E. Phase transitions in langbeinites. I. Crystal chemistry and structures of K-double sulfates of the langbeinite type M2K2(SO4)3, M = Mg, Ni, Co, Zn, Ca. Phys. Chem. Miner. 1986, 13, 1724. [Google Scholar] [CrossRef]
  36. Arnold, H.; Kurtz, W.; Richter-Zinnius, A.; Bethke, J.; Heger, G. The phase transition of K2SO4 at about 850 K. Acta Crystallogr. B 1981, 37, 1643–1651. [Google Scholar] [CrossRef]
  37. Van den Berg, A.J.; Tuinstra, F. The space group and structure of α-K2SO4. Acta Crystallogr. B 1978, 34, 3177–3181. [Google Scholar] [CrossRef]
Figure 1. Coordination environment for Ca (a) and K (b) atoms in the crystal structure of syngenite. The thermal ellipsoids of atoms are drawn at a 50% probability.
Crystals 15 00334 g001
Figure 2. General projection of syngenite crystal structure along b and c axis (a,b) (CaO9 = grey; SO4 = yellow; K atoms = pink). Orange color designates the bassanite-type chain running along b and green color designates the chain elongated along a. Enlarged fragment of the syngenite structure with hydrogen bonds shown by blue dashed lines (c).
Crystals 15 00334 g002
Figure 3. Raman spectrum of syngenite.
Crystals 15 00334 g003
Figure 4. TG (green) and DSC (red) curves of syngenite. Syngenite crystal before (a) and after the experiment (b). (b) Color and transparency changes of crystals are shown in inset photographs.
Crystals 15 00334 g004
Figure 5. Evolution of PXRD patterns of syngenite upon heating.
Crystals 15 00334 g005
Figure 6. The evolution of syngenite unit-cell parameters a (a); b (b); c (c); β (d); V (e) upon heating in the range from −180 to 250 °C obtained by the means of powder X-ray diffraction.
Crystals 15 00334 g006
Figure 7. The evolution of syngenite unit-cell parameters (a) a; (b) b; (c) c; (d) β; (e) V upon heating in the range from −174 to 167 °C obtained by the means of single crystal X-ray diffraction.
Crystals 15 00334 g007
Figure 8. Changes in bond-length values (a) K1-O; (b) Ca1-O; (c) S1-O; (d) S2-O in the crystal structure of syngenite upon heating.
Crystals 15 00334 g008
Figure 9. Evolution of PXRD patterns upon pressure increase (a). Evolution of the unit-cell parameters upon pressure increase (b), where the dashed line indicates the potential phase transition.
Crystals 15 00334 g009
Figure 10. General projection of the crystal structure of syngenite along the b axis (CaO9 = grey; SO4 = yellow; K atoms = pink) (a). Evolution of the thermal expansion tensor based on powder X-ray diffraction data upon heating (b). Evolution of the thermal expansion tensor based on single-crystal X-ray diffraction data upon heating (c). Evolution of the baric compression tensor upon pressure increase (d).
Crystals 15 00334 g010
Figure 11. Evolution of the thermal expansion tensor based on powder X-ray diffraction data upon heating (a). General projection of the crystal structure of syngenite along the c axis (b). Evolution of the thermal expansion tensor based on single-crystal X-ray diffraction data upon heating (c).
Crystals 15 00334 g011
Table 1. Crystallographic data and refinement parameters for syngenite.
Crystal data:
Temperature−173 °C
RadiationMoKα, 0.71073 Å
Crystal systemmonoclinic
Space groupP21/m
a (Å)6.2276(2)
b (Å)7.1264(2)
c (Å)9.7249(3)
β (°)104.174(3)
Volume (Å3)/Z418.46(2)/2
Dcalc (g/cm3)2.606
μ (mm−1)2.269
Crystal size (mm)0.05 × 0.05 × 0.03
Data collection:
θ range (°)3.374–27.995
h, k, l ranges−8 → 8, −8 → 9, −12 → 12
Total reflections collected4733
Unique reflections (Rint)1091 (0.0259)
Unique reflections F > 4σF1050
Structure refinement:
Weighting scheme a, b0.0287, 0.2531
R1[F > 4σF], wR2[F > 4σF]0.0200, 0.0525
R1 all, wR2 all0.0209, 0.0533
Goodness-of-fit1.068
Largest diff. peak and hole, e Å−30.358, −0.525
Table 2. Selected interatomic distances (Å) in the crystal structure of syngenite.
BondLengthBondLengthBondLength
Ca1–O62.4008(16)K1–O62.6712(12)S1–O11.4684(16)
–O72.4409(10)–O12.7474(13)–O61.4806(15)
–O72.4409(10)–O42.8496(13)–O71.4821(10)
–O22.4632(17)–O32.8612(13)–O71.4821(10)
–O72.5196(11)–O32.8980(12)<S1–O>1.478
–O72.5196(11)–O52.9466(11)S2–O31.4779(17)
–O52.5428(12)–O42.9547(14)–O41.4791(15)
–O52.5428(12)–O22.9674(12)–O51.4846(11)
–O12.7040(16)–O73.3885(11)–O51.4846(11)
–O53.5406(11)
<Ca–O>2.508<K–O>2.921<S2–O>1.482
Table 3. Bond-valence sums calculation performed using parameters for the ion pairs from [23].
O1O2O3O4O5O6O7∑→
Ca10.140.26 0.21 × 2 →0.300.27 × 2 →
0.22 × 2 →
2.10
K10.170.100.13
0.12
0.13
0.10
0.10
0.02
0.210.031.12
S11.52 1.471.47 × 2 →5.93
S2 1.481.481.46 × 2 → 5.88
H1 0.78 0.22 1.00
∑↓1.841.141.731.712.021.981.98
Table 4. Atomic coordinates and displacement parameters in the crystal structure of syngenite.
SitexyzUeq
Ca10.33229(7)¼0.96804(4)0.00475(11)
K10.19574(5)0.00708(4)0.33628(3)0.00840(10)
S10.83905(8)¼0.98918(5)0.00423(12)
S20.26602(8)¼0.63740(6)0.00529(12)
O10.0200(3)¼0.11840(17)0.0081(3)
O20.5016(3)¼0.22504(17)0.0083(3)
O30.0518(3)¼0.53026(17)0.0089(3)
O40.4494(3)¼0.56531(18)0.0103(3)
O50.28027(18)0.08345(15)0.73091(12)0.0091(2)
O60.9400(3)¼0.86626(17)0.0070(3)
O70.69383(17)0.08360(14)0.98150(11)0.0071(2)
H10.608(3)0.144(2)0.252(3)0.041(7)
Table 5. Observed bands (cm−1) in the Raman spectrum of syngenite.
This WorkKloprogge et al., 2002 [33]Buzgar et al., 2009 [34]
183 240T (M, H2O)
424 ν2 (SO4)
442441442
478471477
492491495
632 ν4 (SO4)
641641641
660 663
981981982ν1 (SO4)
100610041006
1099 1084ν3 (SO4)
11171120
113811381143
116911661167
3319 3305ν (H2O)
Table 6. Thermal expansion coefficients (×10−6 °C−1) in the range from −180 to 250 °C obtained by the means of powder X-ray diffraction.
Tα11α22α33αaαbαcαβαV
−18037.36(59)16.99(27)17.23(27)25.73(53)16.99(37)23.94(13)−10.69(21)71.6(1.1)
−15037.21(50)17.64(24)17.93(24)26.54(46)17.64(32)23.92(13)−10.18(18)72.78(99)
−12037.09(42)18.28(21)18.61(21)27.36(39)18.28(28)23.90(13)−9.67(16)73.97(84)
−9036.99(34)18.93(17)19.25(18)28.17(32)18.93(23)23.89(13)−9.17(13)75.17(69)
−6036.92(26)19.57(14)19.87(14)28.97(26)19.57(18)23.87(13)−8.66(10)76.36(55)
−3036.89(20)20.21(11)20.45(11)29.78(20)20.21(14)23.85(13)−8.154(79)77.55(43)
036.90(15)20.853(87)20.988(87)30.58(15)20.85(11)23.84(13)−7.647(61)78.74(33)
3036.95(14)21.493(78)21.485(78)31.38(14)21.493(96)23.82(13)−7.139(54)79.93(29)
6037.05(15)22.131(91)21.934(90)32.18(15)22.13(11)23.80(13)−6.631(62)81.11(34)
9037.19(20)22.77(12)22.33(12)32.98(20)22.77(14)23.78(13)−6.123(81)82.30(43)
12037.39(25)23.40(16)22.68(15)33.77(25)23.40(18)23.77(13)−5.61(11)83.48(55)
15037.64(31)24.04(20)22.97(19)34.56(32)24.04(23)23.75(13)−5.11(13)84.65(69)
18037.94(37)24.67(24)23.21(23)35.35(38)24.67(27)23.75(13)−5.11(13)84.65(69)
21038.30(43)25.30(29)23.39(26)36.14(45)25.30(32)23.72(13)−4.09(19)87.00(97)
24038.70(50)25.93(33)23.53(30)36.92(52)25.93(37)23.70(13)−3.58(22)88.2(1.1)
Table 7. Thermal expansion coefficients (×10−6 °C−1) in the range from −180 to 250 °C obtained by the means of single crystal X-ray diffraction.
Tα11α22α33αaαbαcαβαV
−17341.1(4.4)16.0(1.7)6.72(73)25.5(4)16.0(2.4)14.4(3.1)−23.4(4)63.9(6.9)
−15339.9(3.8)16.6(1.5)8.56(82)24.8(3.6)16.6(2.1)16.3(2.8)−22.2(3.7)65.1(6.2)
−13338.8(3.2)17.2(1.4)10.34(87)24.1(3.2)17.2(1.9)18.2(2.5)−21.0(3.5)66.3(5.6)
−11337.8(2.7)17.7(1.3)12.04(88)23.5(2.8)17.7(1.7)20.1(2.2)−19.7(3.2)67.5(4.9)
−9336.8(2.3)18.3(1.1)13.63(86)22.8(2.5)18.3(1.5)22.0(1.9)−18.5(2.9)68.8(4.3)
−7336.1(1.9)18.8(1)15.08(80)22.1(2.1)18.8(1.3)23.9(1.6)−17.3(2.7)70.0(3.7)
−5335.5(1.5)19.41(86)16.34(72)21.5(1.8)19.4(1.1)25.8(1.4)−16.1(2.4)71.2(3.1)
−3317.34(63)19.97(72)35.1(1.2)20.8(1.5)19.97(92)27.7(1.1)−14.8(2.2)72.4(2.6)
−1318.03(53)20.53(61)35.1(1)20.1(1.2)20.53(76)29.63(99)−13.6(1.9)73.7(2.1)
718.37(46)21.09(53)35.42(89)19.4(1)21.09(66)31.52(85)−12.4(1.7)74.9(1.8)
2718.36(43)21.65(51)36.10(85)18.8(1)21.65(63)33.41(81)−11.2(1.4)76.1(1.7)
4718.03(45)22.21(56)37.08(93)18.1(1.1)22.21(68)35.30(88)−9.9(1.2)77.3(1.9)
6717.45(51)22.76(66)38.3(1.1)17.5(1.3)22.76(80)37.2(1)−8.7(1)78.5(2.2)
8716.68(57)23.32(80)39.7(1.3)16.8(1.6)23.32(97)39.1(1.2)−7.46(87)79.7(2.7)
10715.76(64)23.88(97)41.3(1.6)16.1(1.9)23.9(1.1)40.9(1.4)−6.23(75)81.0(3.2)
12714.74(69)24.4(1.1)43.0(2)15.5(2.2)24.4(1.3)42.8(1.7)−5.00(71)82.2(3.8)
14713.64(73)25.0(1.3)44.7(2.3)14.8(2.6)25.0(1.5)44.7(2)−3.76(78)83.4(4.4)
16712.48(74)25.5(1.5)46.5(2.7)14.1(2.9)25.5(1.7)46.5(2.3)−2.53(92)84.5(5)
Table 8. Values of baric compression tensor coefficients (×10−6 GPa−1) of syngenite at different pressures (in GPa).
Pα11α22α33αaαbαcαβαV
0.1−5617(103)−5178(95)−15,276(280)−7477(207)−5178(93)−11,283(182)4719(92)−26,071(465)
5−7718(83)−2589(28)−2599(28)−3891(59)−2589(26)−5065(52)2587(25)−12,907(140)
10−417(127)−101(31)1670(509)−89(225)101(100)1642(202)536(91)1355(577)
15−25(2708)−667(2489)97(362)645(243)−667(210)101(109)−139(65)156(573)
Disclaimer/Publisher’s Note: The statements, opinions and data contained in all publications are solely those of the individual author(s) and contributor(s) and not of MDPI and/or the editor(s). MDPI and/or the editor(s) disclaim responsibility for any injury to people or property resulting from any ideas, methods, instructions or products referred to in the content.

