
Gemological Characteristics and Spectral Characteristics of Grossular from Mt. Bozhushan in Southeast Yunnan Province

 , , ,
, , ,
Abstract
:1. Introduction
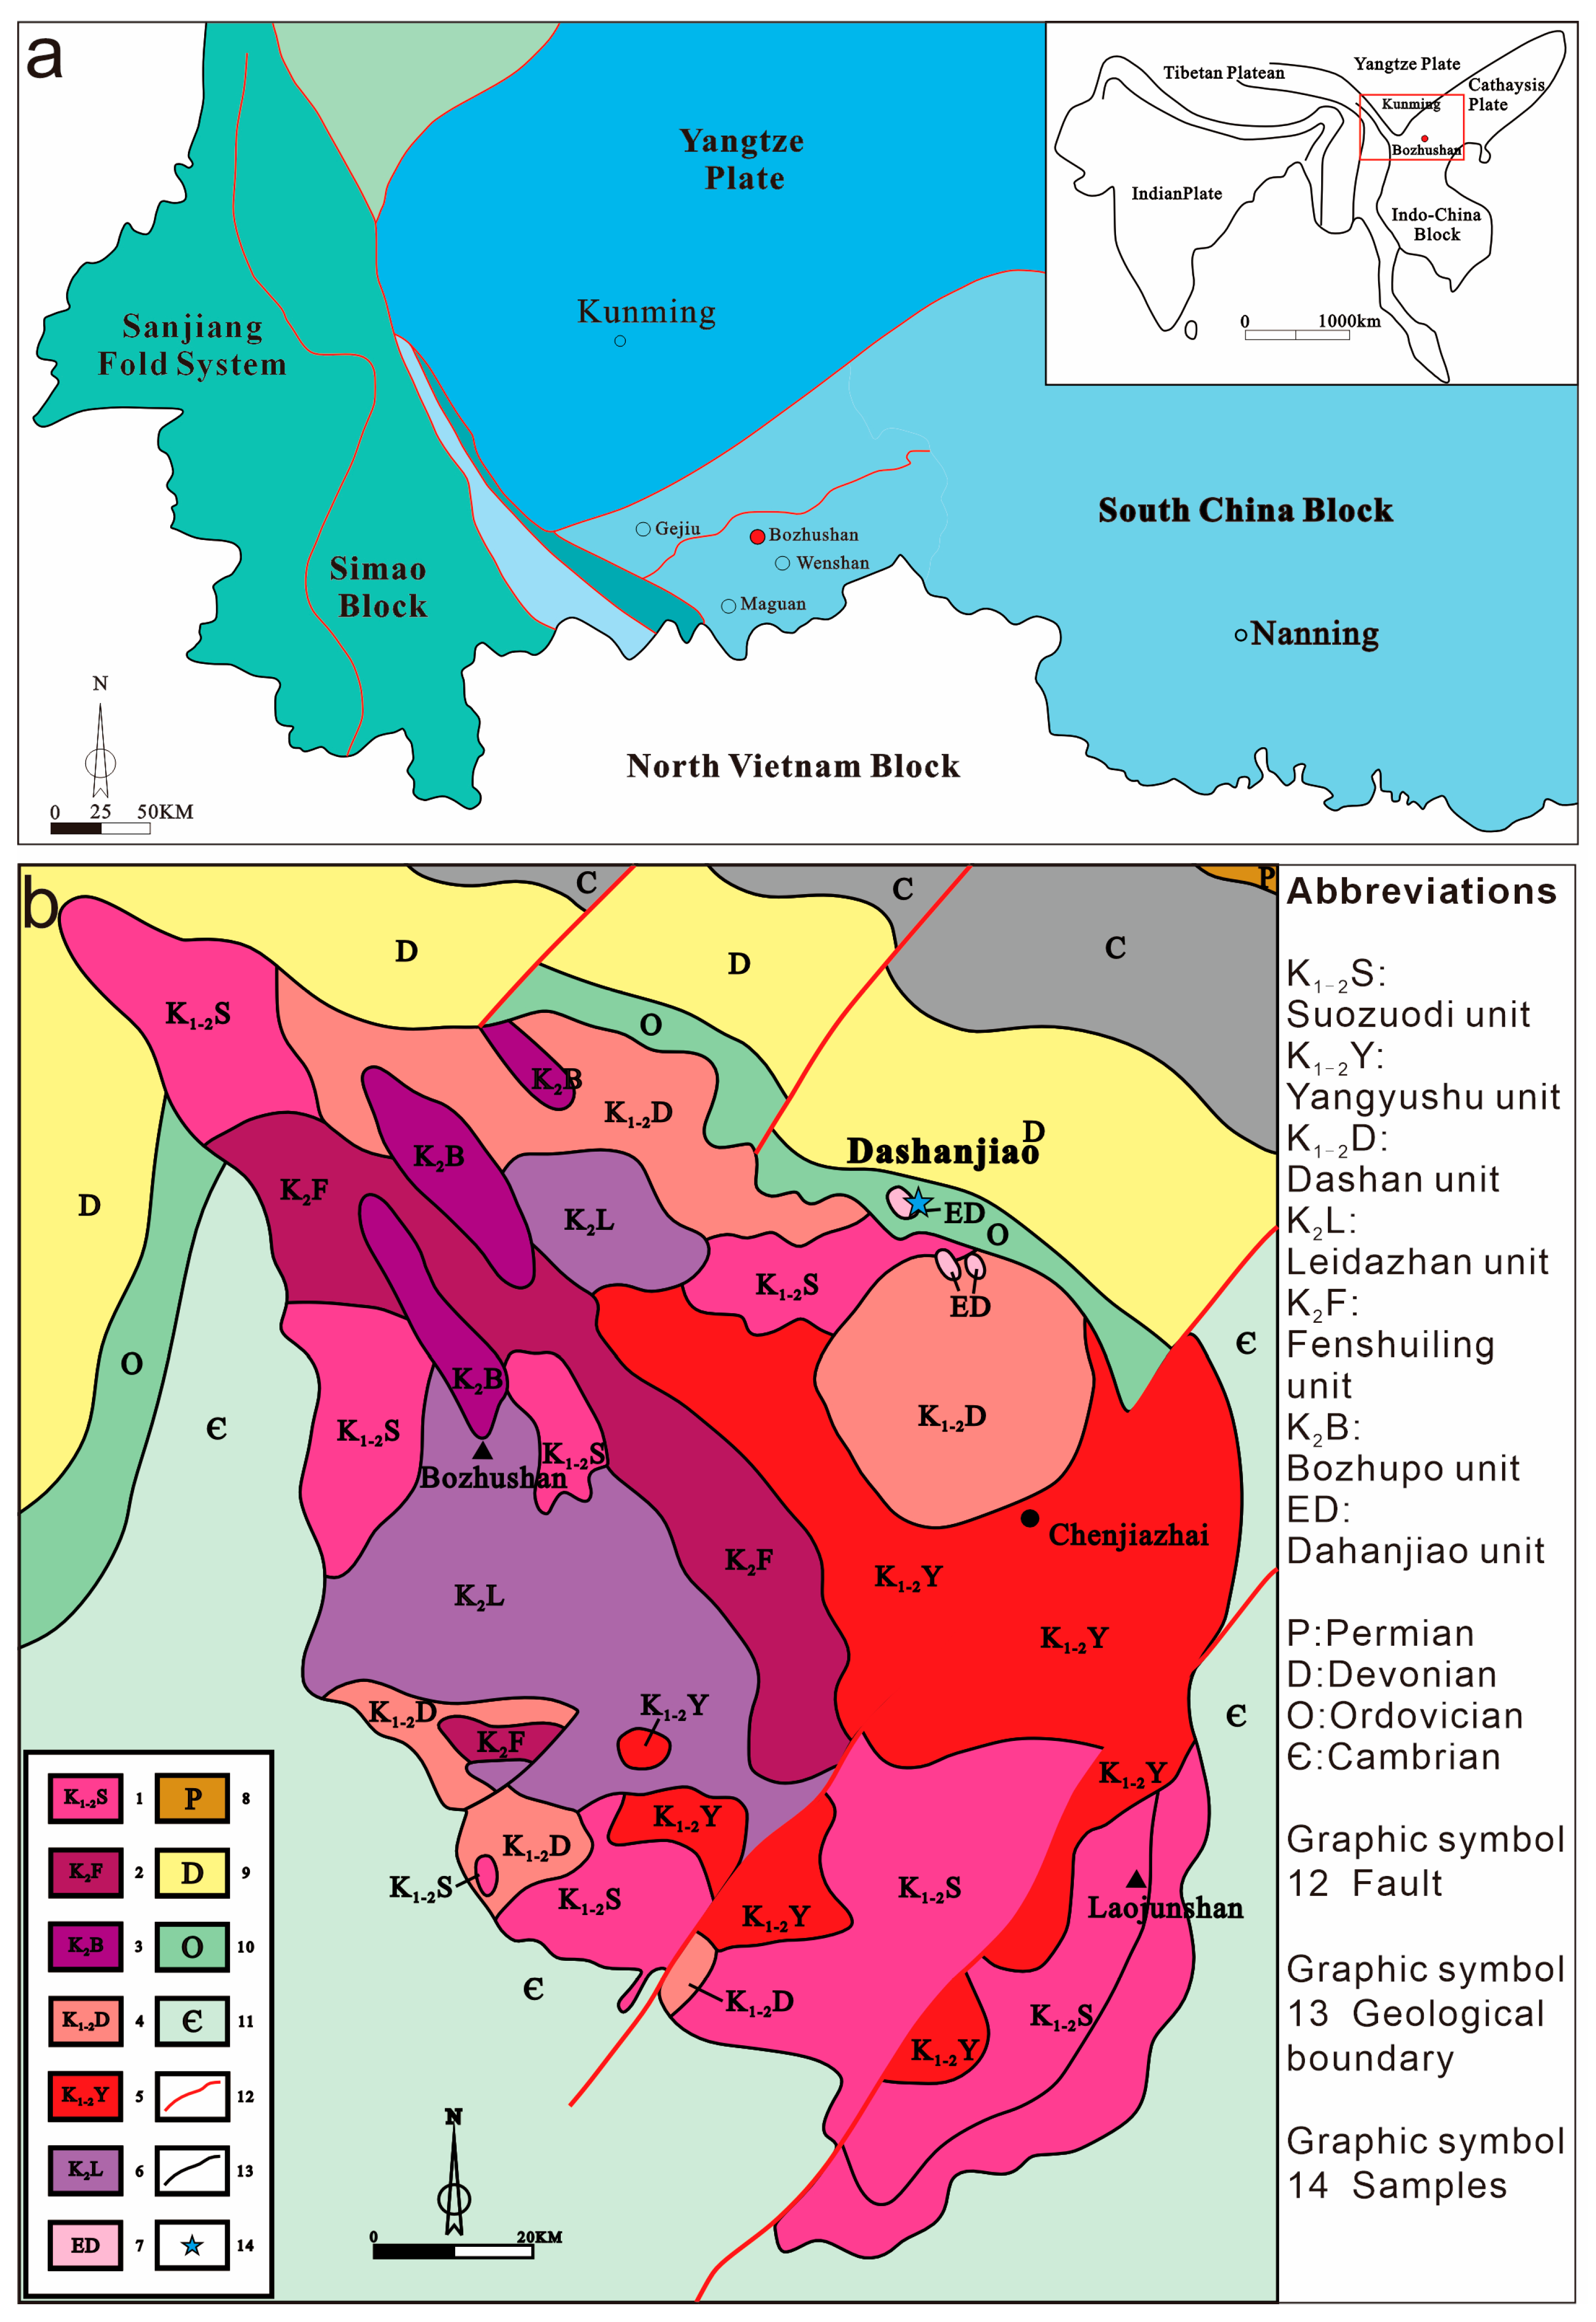
Geologic Setting
- Stratigraphy:
- Structural Framework:
- Magmatic Assemblage:
2. Material and Methods
2.1. Sample Materials
2.2. Methods
2.2.1. Basic Gemological Testing
2.2.2. Electron Probe Microanalysis (EPMA)
2.2.3. Laser Ablation Inductively Coupled Plasma Mass Spectrometry (LA-ICP-MS)
2.2.4. Ultraviolet–Visible Absorption Spectroscopy (UV-VIS)
2.2.5. Fourier Transform Infrared Spectroscopy (FTIR)
2.2.6. Laser Raman Spectroscopy (RAMAN)
3. Results and Discussion
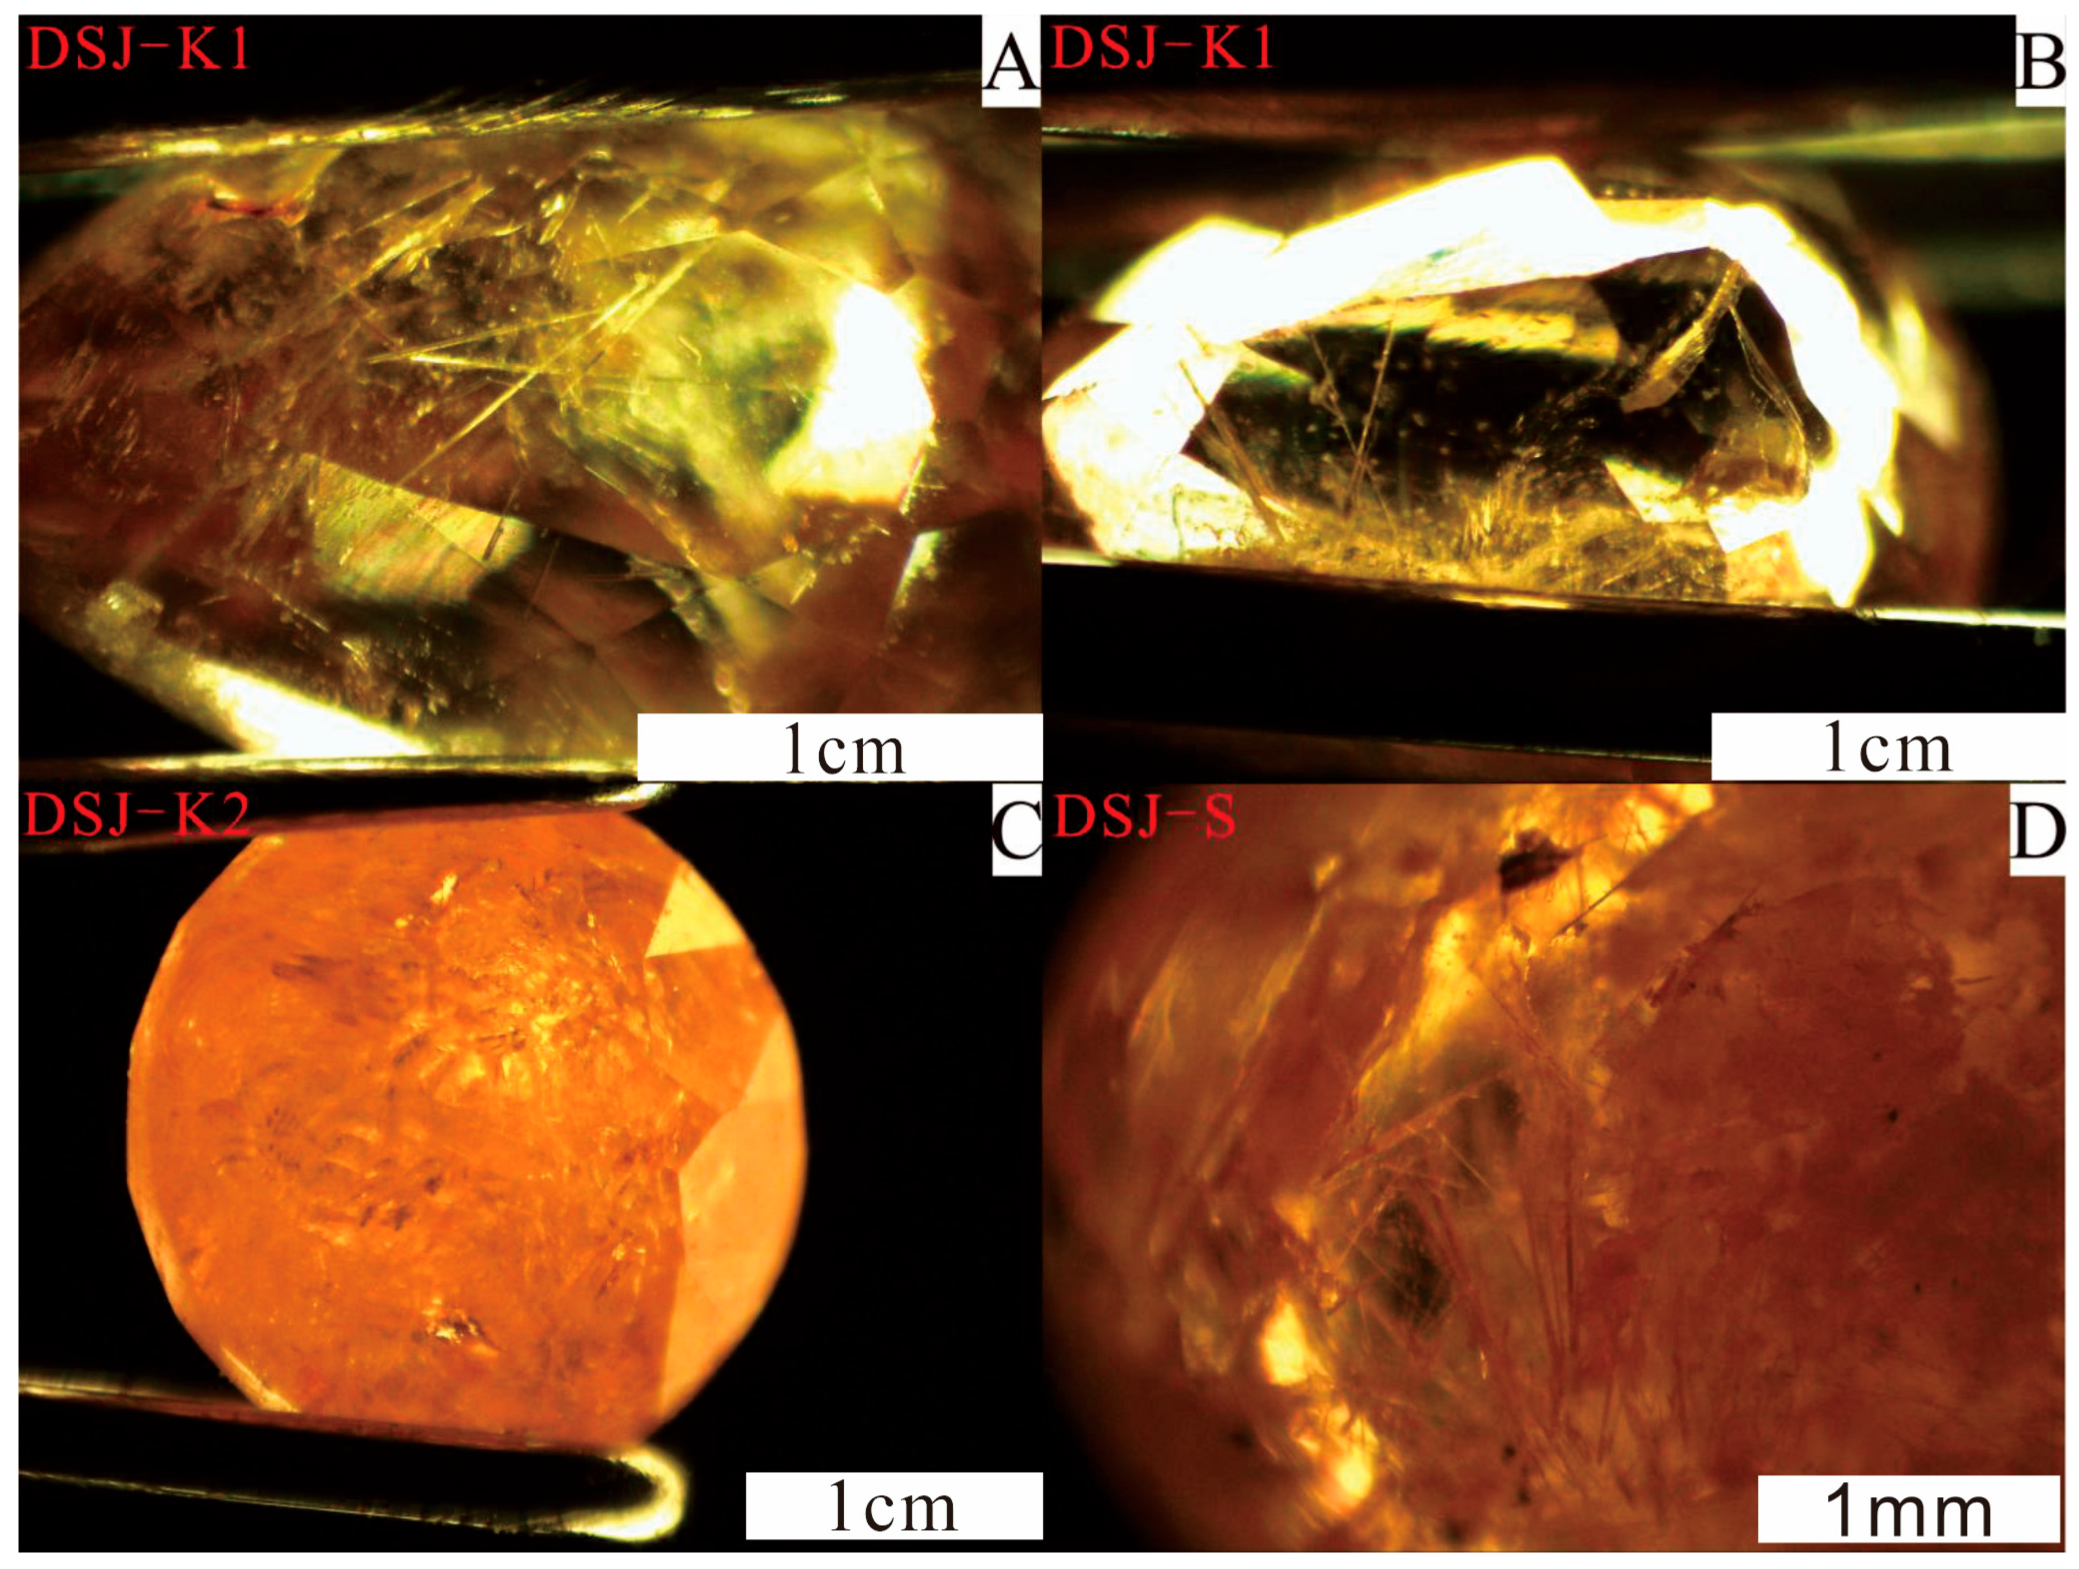
Gemological Characteristics
4. Analysis and Discussion of Test Results
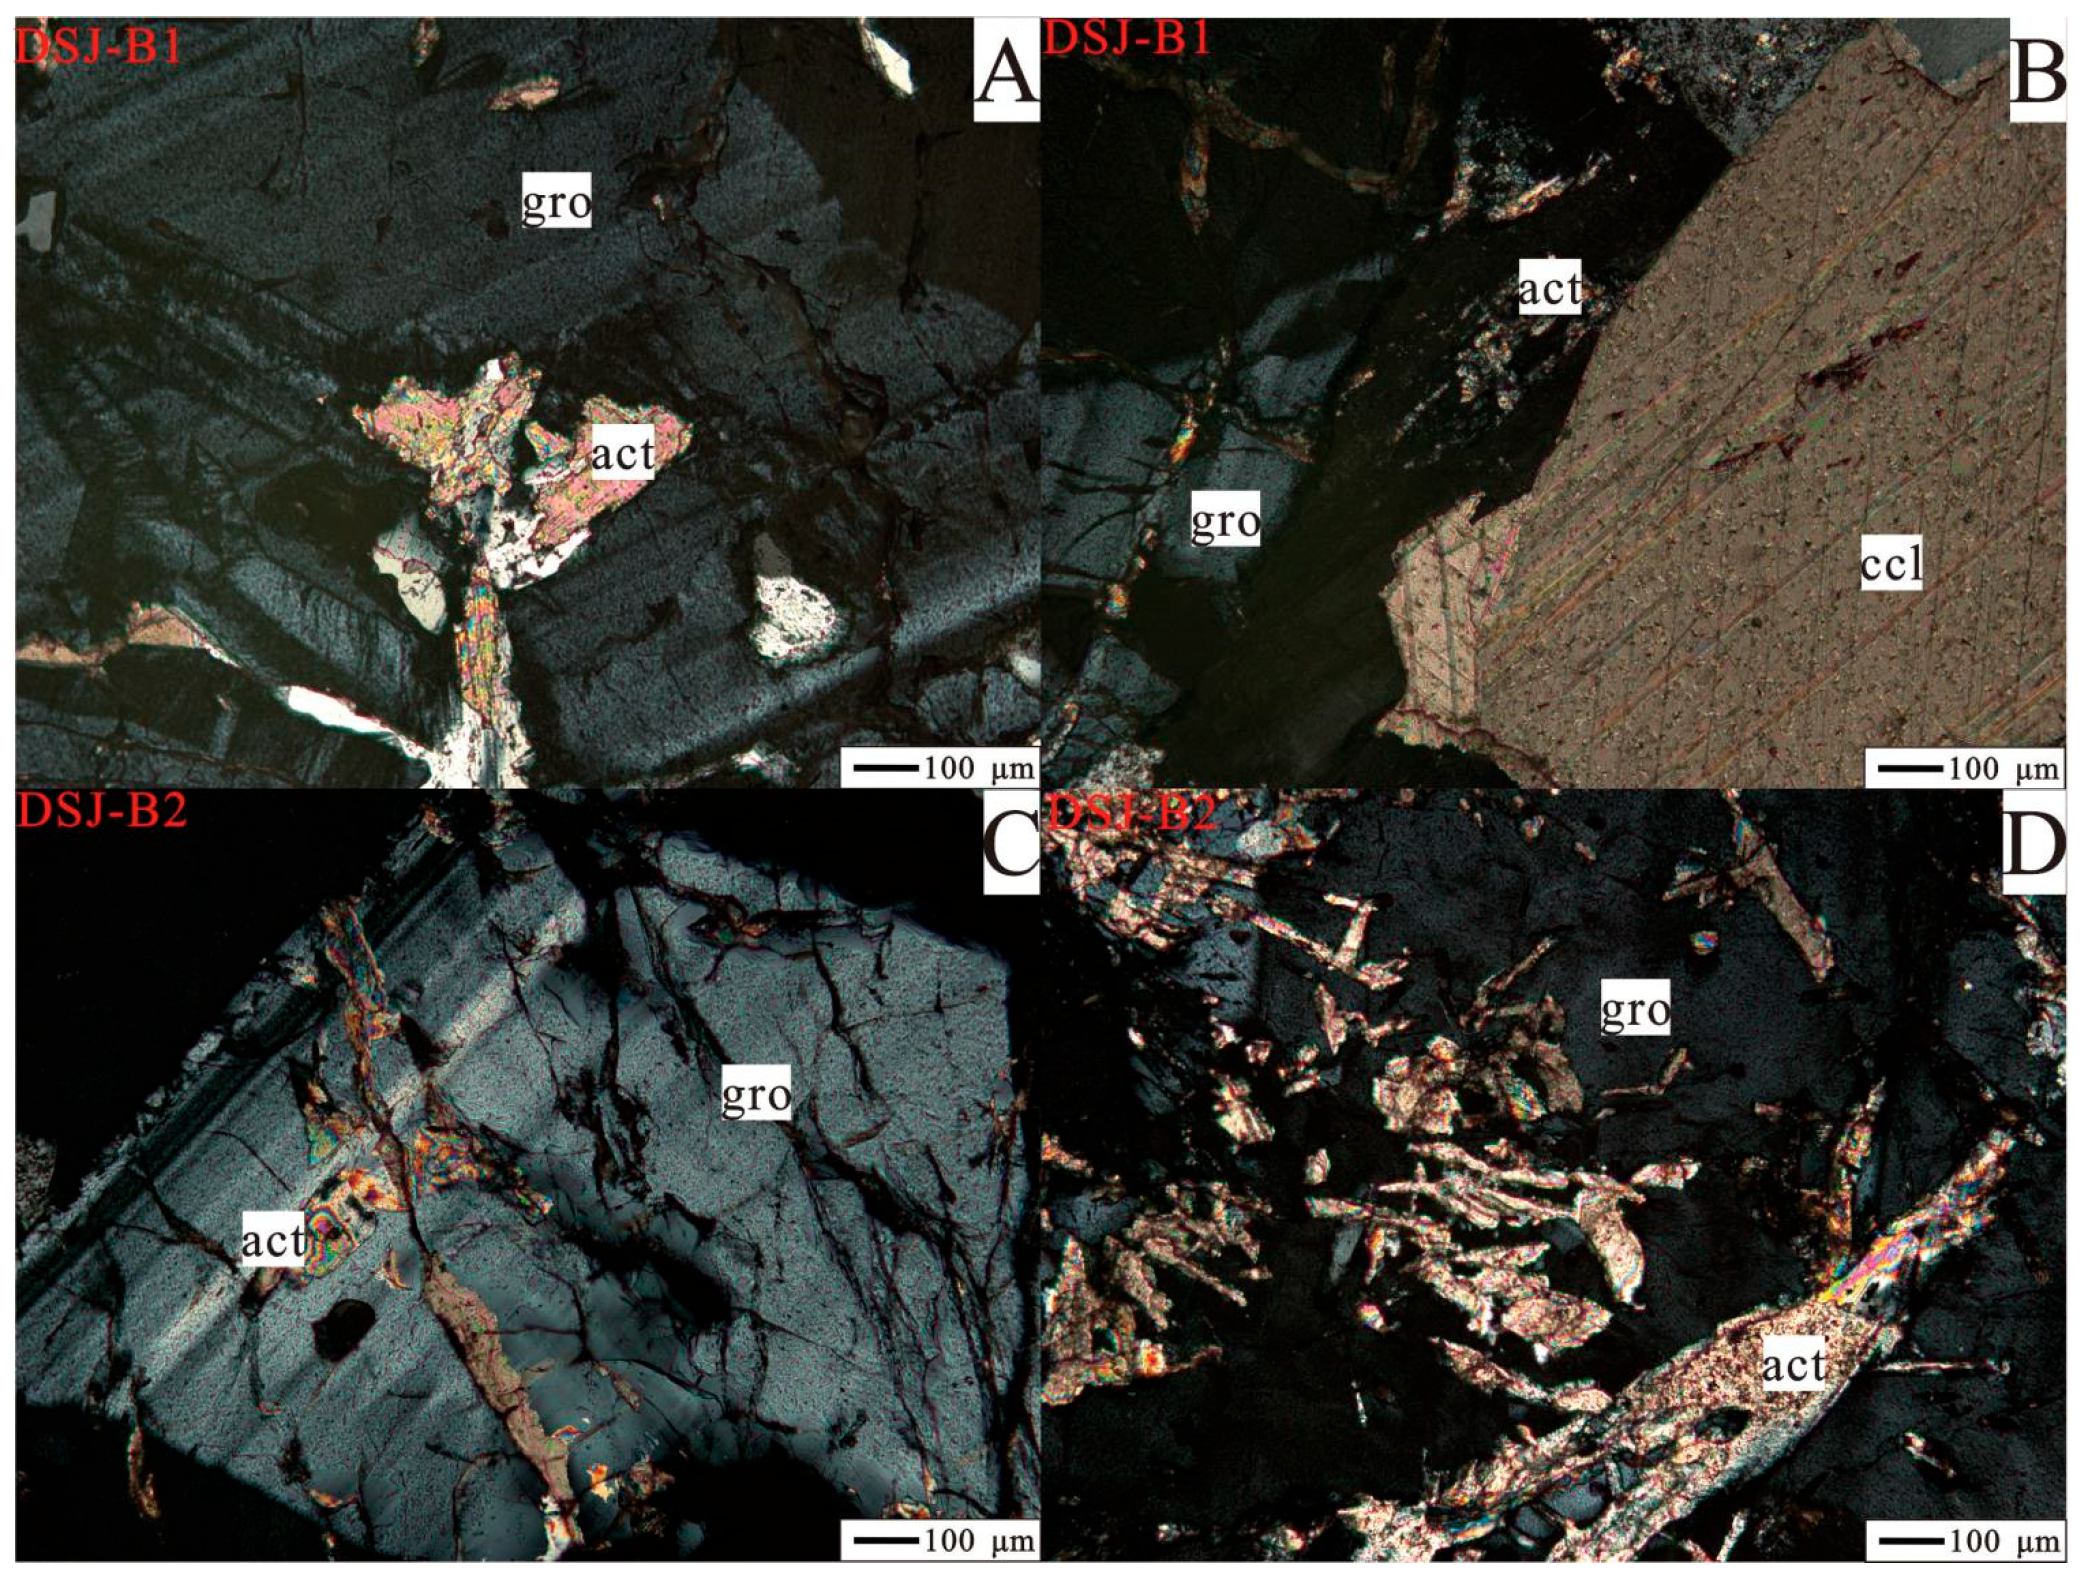
4.1. Microscopic Characteristics
4.2. Compositional Analysis
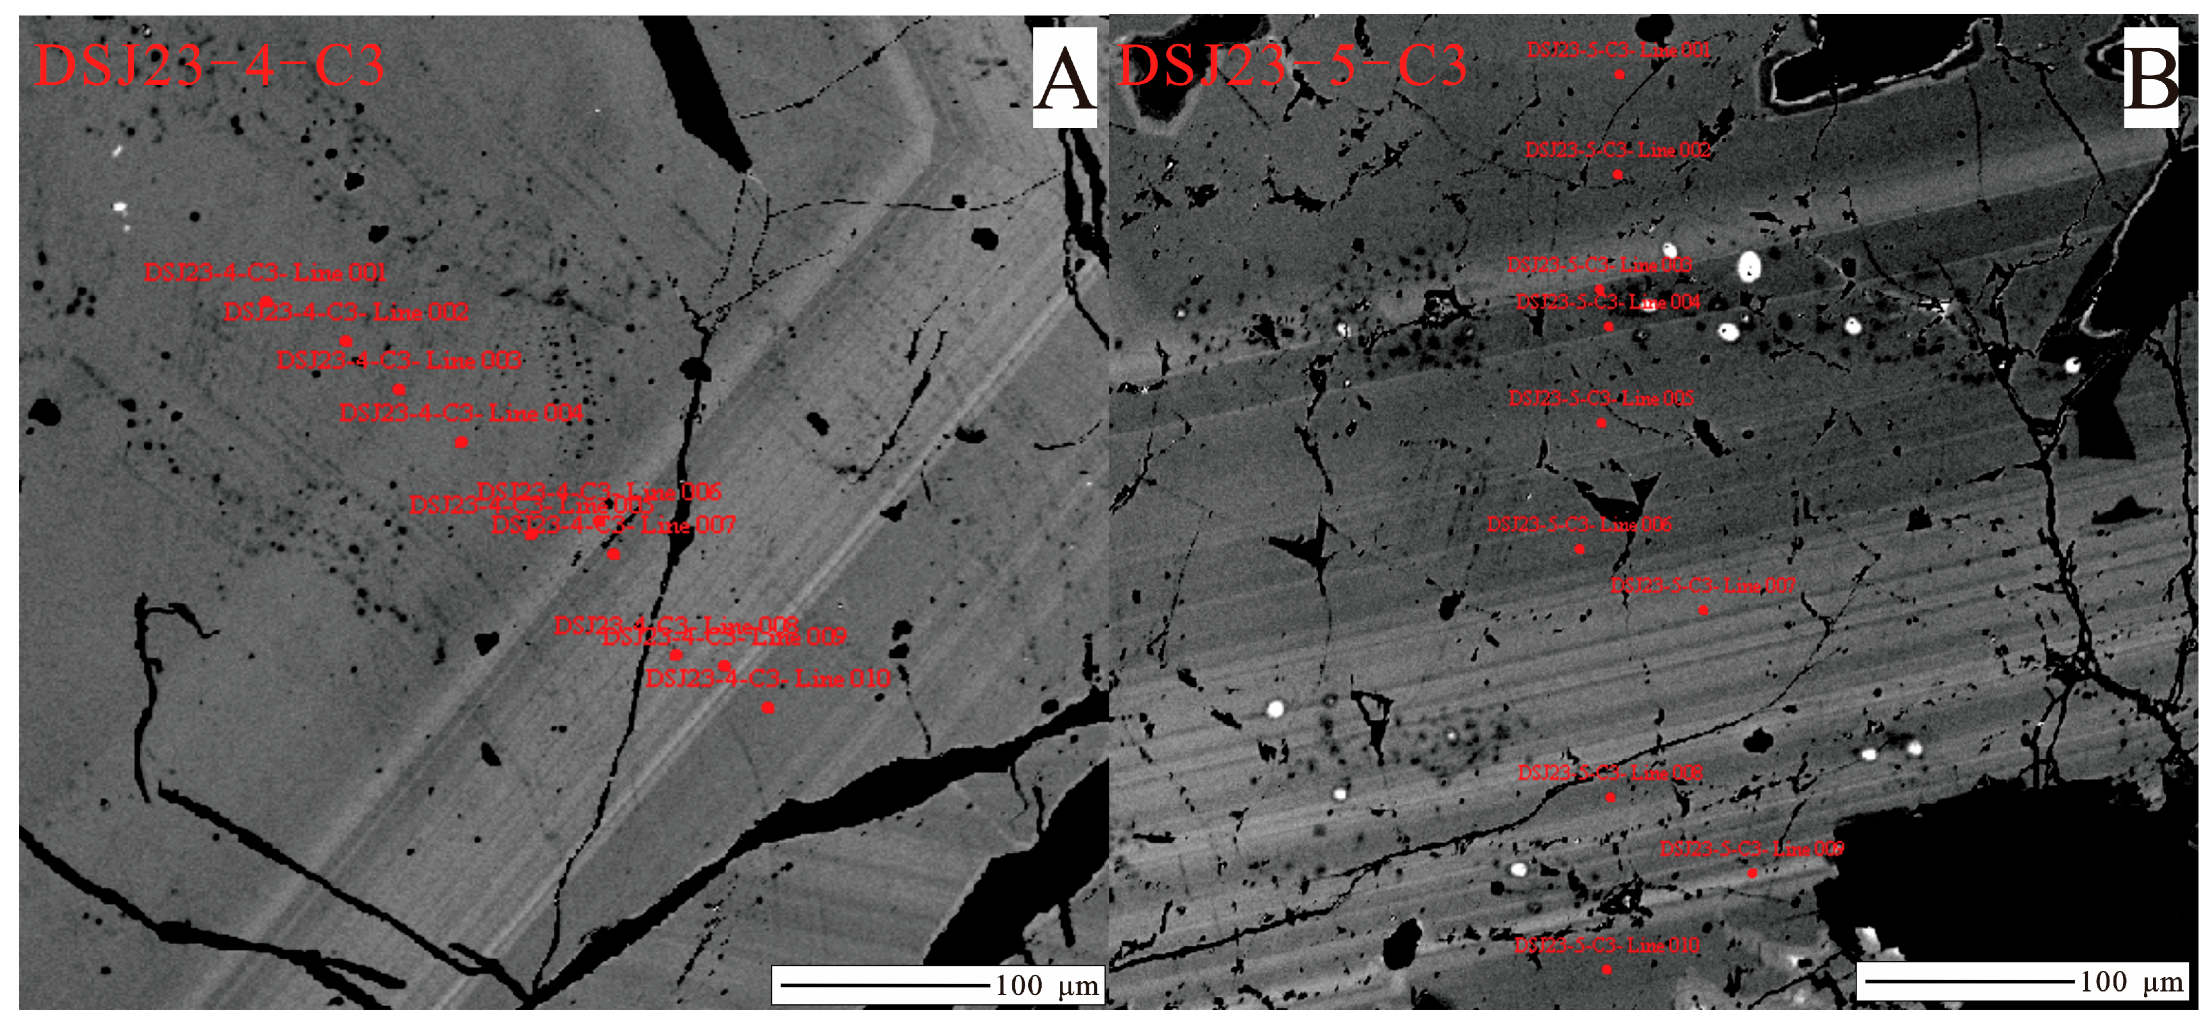
4.2.1. Electron Probe Microanalysis (EPMA)
4.2.2. LA-ICP-MS Analysis
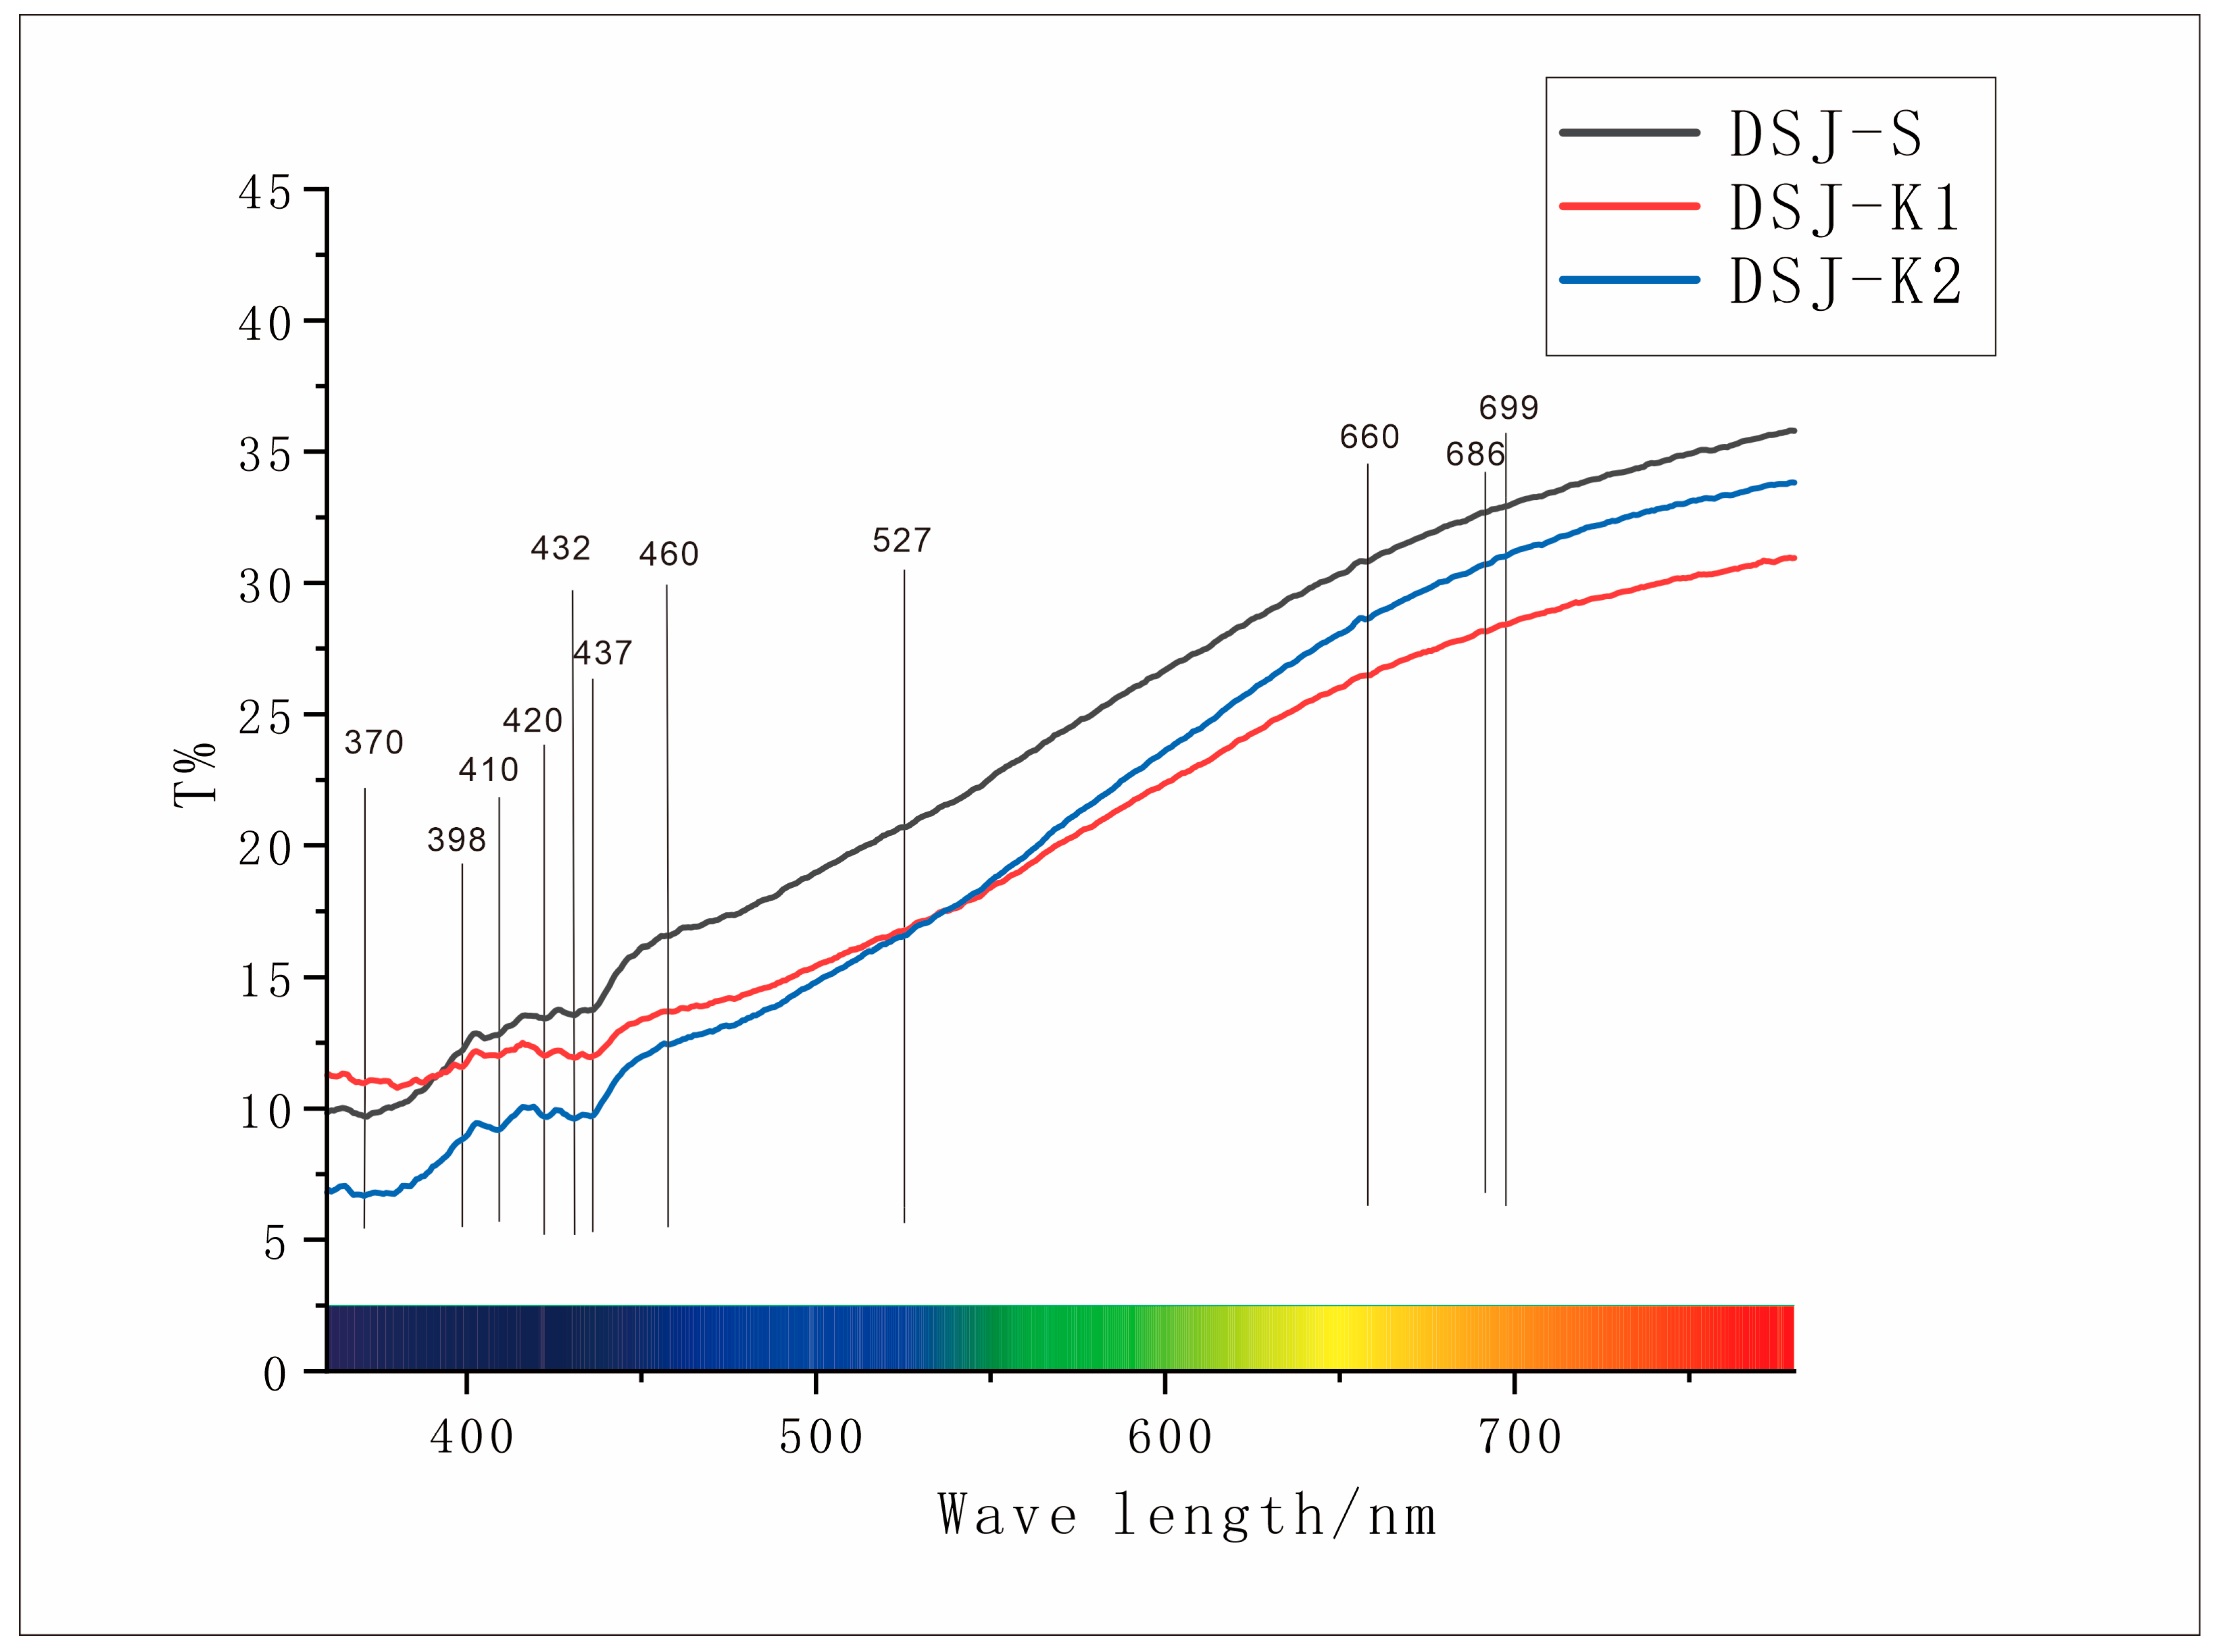
4.3. UV-Vis Absorption Spectroscopy Analysis
4.4. FTIR Spectroscopy Analysis
- A: 964 ± 4 cm−1.
- C: 866 ± 3 cm−1.
- D: 841 ± 5 cm−1.
- E: 616 ± 1 cm−1.
- F: 553 ± 3 cm−1.
- G: 510 ± 3 cm−1.
- H: 488 ± 3 cm−1.
- I: 455 ± 5 cm−1.

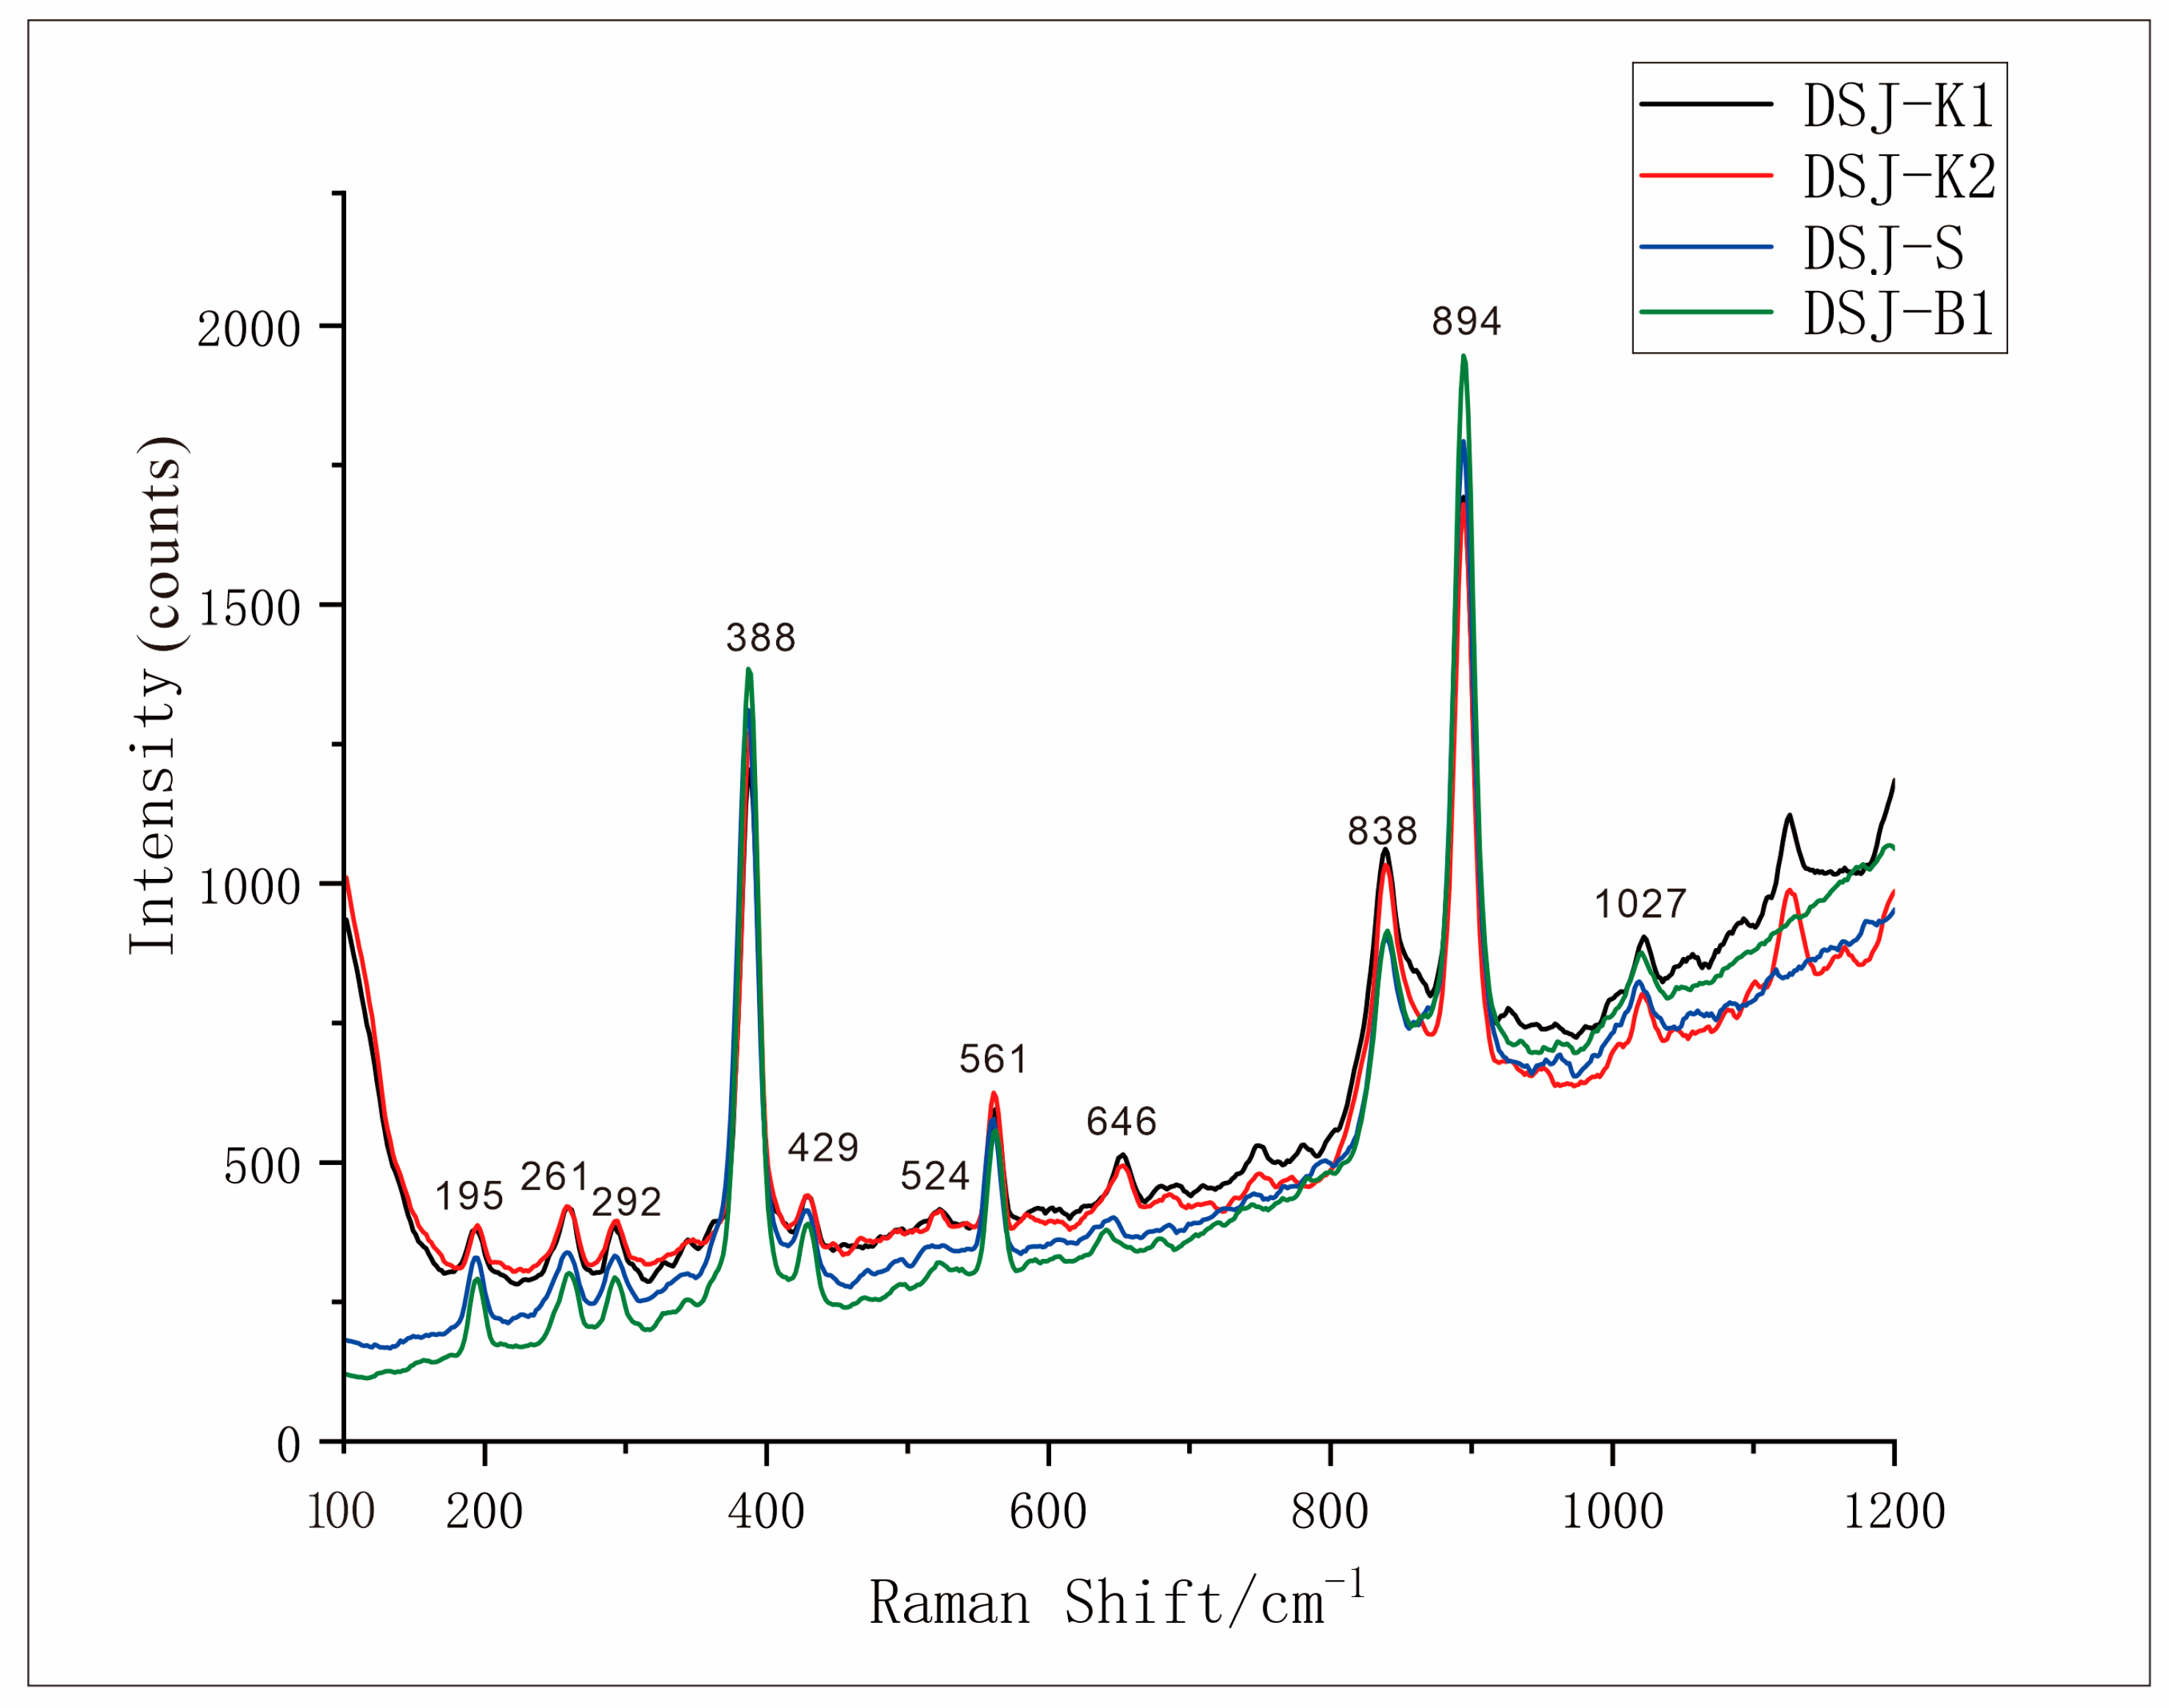
4.5. Raman Spectroscopy Analysis
4.6. Discussion
5. Conclusions
Author Contributions
Funding
Data Availability Statement
Acknowledgments
Conflicts of Interest
References
- Jang-Green, H.; Beaton, D. Light yellow-green grossular from Kenya. Gems Gemol. 2009, 45, 65–66. [Google Scholar]
- Zhang, L.; Fan, Y.; Zhang, S.; Gu, L.; Zhang, G. The Geological Conditions and Prospecting Prediction of Midwest Side of Bozhushan Granite Skarn Type Tungsten Tin Polymetallic Deposits in Southeast Yunnan. Henan Sci. 2014, 5, 846–850. [Google Scholar]
- People’s Republic of China—Geological Map Description—1:50,000-Mingjiu Sheet; Ministry of Geology and Mineral Resources of the People’s Republic of China, Yunnan Mineral Exploration and Development Bureau: Kunming, China, 1996.
- Cheng, Y.B. Spatial-Temperal Evolution of the Magmatism and Mineralization in the Gejiu Supergiant Sn Poly Metal Lie Distirct and Insights into Several Key Problems. Ph.D. Thesis, China University of Geosciences (Beijing), Beijing, China, 2012. [Google Scholar]
- Bai, J.G. Study on Metallogenic Model of Bainiuchang Super Large Silver Polymetallic Deposit, Yunnan. Ph.D. Thesis, China University of Geosciences (Wuhan), Wuhan, China, 1996. [Google Scholar]
- Zhang, S.T.; Chen, G.C. Geological characteristics and evolutionary patterns of the Bozhushan composite pluton in southeastern Yunnan. Yunnan Geol. 1997, 16, 22–232. [Google Scholar]
- Shi, L. Special Geological Report of the Ministry of Geology and Mineral Resources of the People’s Republic of China—IV—Ore Deposits and Minerals—No. 12—Metallogenic regularity of Tin ore Belt in Western Yunnan; Ministry of Geology and Mineral Resources of the People’s Republic of China: Beijing, China, 1989. [Google Scholar]
- Structure Probe, Inc. SPI Calcite Mineral Standard, Catalog #02653-MN; [Mineralogical Reference]; SPI: West Chester, PA, USA, 2020. [Google Scholar]
- Jochum, K.P.; Weis, U.; Stoll, B.; Kuzmin, D.; Yang, Q.; Raczek, I.; Jacob, D.E.; Stracke, A.; Birbaum, K.; Frick, D.A.; et al. Determination of Reference Values for NIST SRM 610–617 Glasses Following ISO Guidelines. Geostand. Geoanalytical Res. 2011, 35, 397–429. [Google Scholar] [CrossRef]
- Günther, D.; Hattendorf, B. Solid sample analysis using laser ablation inductively coupled plasma mass spectrometry. Trac Trends Anal. Chem. 2005, 24, 255–265. [Google Scholar]
- Flanagan, F.J.; Gottfried, D. USGS Rock Standards IV: Composition of Three USGS Rock Standards. Geostand. Newsl. 1980, 4, 115–121. [Google Scholar]
- Jochum, K.P.; Willbold, M.; Raczek, I.; Stoll, B.; Herwig, K. Chemical Characterisation of the USGS Reference Glasses GSA-1G, GSC-1G, GSD-1G, GSE-1G, BCR-2G, BHVO-2G and BIR-1G Using EPMA, ID-TIMS, ID-ICP-MS and LA-ICP-MS. Geoanalytical Res. 2005, 29, 285–302. [Google Scholar] [CrossRef]
- China Geological Survey. CGSG-1G: Synthetic Silicate Glass Reference Material for Microanalysis; Certificate: Beijing, China, 2020. [Google Scholar]
- National Research Center for Geoanalysis. Certification Report for CGSG-2G Basalt Glass; [Technical Report]; National Research Center for Geoanalysis: Beijing, China, 2018. [Google Scholar]
- Liu, Y.; Hu, Z.; Gao, S.; Günther, D.; Xu, J.; Gao, C.; Chen, H. In situ analysis of major and trace elements of anhydrous minerals by LA-ICP-MS without applying an internal standard. Chem. Geol. 2008, 257, 34–43. [Google Scholar]
- Cui, Y. Gemological Characteristics and Colorimetry of Yellow to Orange-Red Garnets. Master’s Thesis, China University of Geosciences, Beijing, China, 2021. [Google Scholar]
- Zhang, H.K.; Liu, C.H.; Song, Q.R.; Shen, X.T. Gemological and chemical characteristics of manganese-aluminum garnets from Zambia. J. Gems Gemmol. 2021, 23, 1–10. [Google Scholar]
- Zhu, L. Study on Gemological Characteristics of Red to Yellow Series Garnets. Master’s Thesis, China University of Geosciences (Beijing): Beijing, China, 2015. [Google Scholar]
- Einaudi, M.T.; Meinert, L.D.; Newberry, R.J. Skarn Deposits; Economic Geology 75th Anniversary Volume: Littleton, CO, USA, 1981. [Google Scholar] [CrossRef]
- Roedder, E. Volume 12: Fluid Inclusions. Rev. Mineral. 1984, 12, 644. [Google Scholar]
- Meinert, L.D. Skarns and skarn deposits. Geosci. Can. 1992, 19, 145–161. [Google Scholar]
- Zheng, Q.R. Calculation of Fe3+ and Fe2+ from electron microprobe analysis. Acta Mineral. Sin. 1983, 55–62. [Google Scholar]
- Lu, Y.F. GeoKit: A geochemical toolkit developed with VBA. Geochimica 2004, 459–464. [Google Scholar] [CrossRef]
- Tao, L.F.; Hu, X.T.; Tong, Y.L.; Zhao, Y. Gemological properties and coloration mechanism of magnesium-aluminum garnets from the Elahera mining area, Sri Lanka. Bull. Chin. Ceram. Soc. 2017, 36. [Google Scholar] [CrossRef]
- Lü, L.S.; Mao, B.; He, X.M. Current research status on mineralogy and geochemistry of East African chrome-vanadium grossular (Tsavorite). J. Gems Gemmol. 2014, 16, 1–13. [Google Scholar]
- Geiger, C.A.; Stahl, A.; Rossman, G.R. Raspberry-red grossular from Sierra de Cruces Range, Coahuila, Mexico. Eur. J. Mineral. 1999, 11, 1109–1113. [Google Scholar] [CrossRef]
- Slack, G.A.; Chrenko, R.M. Optical absorption of natural garnets from 1000 to 30000 wavenumbers. J. Opt. Soc. Am. 1971, 61, 1325–1329. [Google Scholar] [CrossRef]
- Vigier, M.; Fritsch, E. Pink axinite from Merelani, Tanzania: Origin of colour and luminescence. J. Gemmol. 2020, 37, 192–205. [Google Scholar] [CrossRef]
- Blumentritt, F.; Fritsch, E. Photochromism and photochro-mic gems:A review and some new data(partⅠ). J. Gemmol. 2021, 37, 780–800. [Google Scholar] [CrossRef]
- Gilles-Guery, L.; Galoisy, L.; Schnellrath, J.; Baptiste, B.; Calas, G. Mn3+ and the pink color of gem-quality euclase from northeast Brazil. Am. Mineral. 2022, 107, 489–494. [Google Scholar] [CrossRef]
- Manutchehr-Danai, M. Dictionary of Gems and Gemology; Springer: Berlin/Heidelberg, Germany, 2009; p. 404. [Google Scholar]
- Rossman, G.R. Color in gems: The new technologies. Gems Gemol. 1981, 17, 60–71. [Google Scholar] [CrossRef]
- Nassau, K. The Physics and Chemistry of Color: The Fifteen Causes of Color; Wiley: New York, NY, USA, 1983. [Google Scholar]
- Breeding, C.M.; Shigley, J.E. The “type” classification system of diamonds and its importance in gemology. Gems Gemol. 2009, 45, 96–111. [Google Scholar]
- Hofmeister, A.M.; Chopelas, A. Vibrational spectroscopy of end-member silicate garnets. Phys. Chem. Miner. 1991, 17, 503–526. [Google Scholar]
- Kolesov, B.A.; Geiger, C.A. Raman spectra of silicate garnets. Phys. Chem. Miner. 1998, 25, 142–151. [Google Scholar] [CrossRef]
- Armbruster, T.; Birrer, J.; Libowitzky, E.; Beran, A. Crystal chemistry of Ti-bearing andradites. Eur. J. Mineral. 1998, 10, 907–921. [Google Scholar] [CrossRef]
- Wang, Y.C. Raman spectroscopy of grossular-andradite solid solutions. Chin. J. High Press. Phys. 2020, 34, 3–11. [Google Scholar]
- Yang, P.Y. Compositional Characteristics and Color Quality Evaluation of Iron-Magnesium-Aluminum Garnets; China University of Geosciences (Beijing): Beijing, China, 2021. [Google Scholar]

| Points | SiO2 | TiO2 | Al2O3 | Cr2O3 | FeOT | MnO | MgO | CaO | Na2O | K2O | Total |
|---|---|---|---|---|---|---|---|---|---|---|---|
| DSJ23-4-C3-1 | 39.123 | 0.006 | 21.157 | 0 | 2.092 | 1.62 | 0.05 | 35.012 | 0 | 0.007 | 99.067 |
| DSJ23-4-C3-2 | 39.301 | 0 | 20.99 | 0 | 2.396 | 1.565 | 0.082 | 34.946 | 0.017 | 0 | 99.297 |
| DSJ23-4-C3-3 | 39.298 | 0.009 | 21.069 | 0 | 2.153 | 1.563 | 0.059 | 35.152 | 0.046 | 0.002 | 99.351 |
| DSJ23-4-C3-4 | 39.313 | 0 | 20.88 | 0.003 | 2.578 | 1.547 | 0.047 | 34.922 | 0.006 | 0 | 99.296 |
| DSJ23-4-C3-5 | 38.885 | 0.109 | 20.821 | 0 | 2.293 | 1.545 | 0.064 | 35.113 | 0.031 | 0.018 | 98.879 |
| DSJ23-4-C3-6 | 38.938 | 0.19 | 20.398 | 0.004 | 3.296 | 1.91 | 0.039 | 34.408 | 0.022 | 0.007 | 99.212 |
| DSJ23-4-C3-7 | 39.282 | 0 | 20.839 | 0.011 | 2.381 | 1.63 | 0.048 | 34.856 | 0 | 0.005 | 99.052 |
| DSJ23-4-C3-8 | 39.446 | 0.011 | 20.031 | 0 | 3.477 | 1.546 | 0.033 | 34.879 | 0.019 | 0.018 | 99.46 |
| DSJ23-4-C3-9 | 38.873 | 0.068 | 19.941 | 0 | 3.818 | 1.766 | 0.035 | 34.28 | 0.029 | 0.003 | 98.813 |
| DSJ23-4-C3-10 | 39.206 | 0 | 20.443 | 0 | 3.045 | 1.322 | 0.022 | 35.043 | 0.016 | 0 | 99.097 |
| DSJ23-5-C3-1 | 39.457 | 0.008 | 20.783 | 0.008 | 2.716 | 1.675 | 0.032 | 35.012 | 0.024 | 0 | 99.715 |
| DSJ23-5-C3-2 | 39.122 | 0.202 | 20.825 | 0 | 2.324 | 1.4 | 0.096 | 35.281 | 0 | 0 | 99.25 |
| DSJ23-5-C3-3 | 39.062 | 0.107 | 20.153 | 0 | 3.435 | 1.879 | 0.041 | 34.065 | 0 | 0 | 98.742 |
| DSJ23-5-C3-4 | 39.086 | 0.006 | 20.772 | 0 | 2.322 | 1.39 | 0.083 | 35.046 | 0 | 0.008 | 98.713 |
| DSJ23-5-C3-5 | 39.339 | 0.107 | 20.718 | 0 | 2.607 | 1.348 | 0.051 | 35.125 | 0.009 | 0 | 99.304 |
| DSJ23-5-C3-6 | 39.314 | 0.033 | 20.627 | 0 | 2.624 | 1.524 | 0.033 | 34.593 | 0 | 0 | 98.748 |
| DSJ23-5-C3-7 | 39.195 | 0.003 | 19.888 | 0 | 3.895 | 1.475 | 0.025 | 34.975 | 0 | 0 | 99.456 |
| DSJ23-5-C3-8 | 39.254 | 0 | 20.347 | 0 | 3.14 | 1.528 | 0.026 | 34.851 | 0 | 0 | 99.146 |
| DSJ23-5-C3-9 | 39.259 | 0 | 20.505 | 0.016 | 3.127 | 1.595 | 0.039 | 34.513 | 0.035 | 0 | 99.089 |
| DSJ23-5-C3-10 | 39.523 | 0.002 | 20.415 | 0 | 2.992 | 1.311 | 0.028 | 35.03 | 0.004 | 0 | 99.305 |
| Points | Si | Ti | AlⅣ | Ti* | AlⅥ | Cr | Fe3+ | Fe2+ | Mn | Mg | Ca |
|---|---|---|---|---|---|---|---|---|---|---|---|
| DSJ23-4-C3-line001 | 2.9871 | 0.00 | 0.00 | 0.0003 | 1.9039 | 0.0000 | 0.1212 | 0.01 | 0.10 | 0.01 | 2.86 |
| DSJ23-4-C3-line002 | 2.9958 | 0.00 | 0.00 | 0.0000 | 1.8857 | 0.0000 | 0.1227 | 0.03 | 0.10 | 0.01 | 2.86 |
| DSJ23-4-C3-line003 | 2.9925 | 0.00 | 0.00 | 0.0005 | 1.8909 | 0.0000 | 0.1231 | 0.01 | 0.10 | 0.01 | 2.87 |
| DSJ23-4-C3-line004 | 2.9986 | 0.00 | 0.00 | 0.0000 | 1.8770 | 0.0002 | 0.1256 | 0.04 | 0.10 | 0.01 | 2.85 |
| DSJ23-4-C3-line005 | 2.9771 | 0.00 | 0.00 | 0.0063 | 1.8787 | 0.0000 | 0.1468 | 0.00 | 0.10 | 0.01 | 2.88 |
| DSJ23-4-C3-line006 | 2.9823 | 0.00 | 0.00 | 0.0109 | 1.8413 | 0.0002 | 0.1719 | 0.04 | 0.12 | 0.00 | 2.83 |
| DSJ23-4-C3-line007 | 3.0031 | 0.00 | 0.00 | 0.0000 | 1.8776 | 0.0007 | 0.1155 | 0.04 | 0.11 | 0.01 | 2.86 |
| DSJ23-4-C3-line008 | 3.0132 | 0.00 | 0.00 | 0.0006 | 1.8033 | 0.0000 | 0.1691 | 0.05 | 0.10 | 0.00 | 2.86 |
| DSJ23-4-C3-line009 | 2.9923 | 0.00 | 0.00 | 0.0039 | 1.8091 | 0.0000 | 0.1983 | 0.05 | 0.12 | 0.00 | 2.83 |
| DSJ23-4-C3-line010 | 2.9997 | 0.00 | 0.00 | 0.0000 | 1.8434 | 0.0000 | 0.1573 | 0.04 | 0.09 | 0.00 | 2.87 |
| DSJ23-5-C3-line001 | 2.9994 | 0.00 | 0.00 | 0.0005 | 1.8620 | 0.0005 | 0.1377 | 0.03 | 0.11 | 0.00 | 2.85 |
| DSJ23-5-C3-line002 | 2.9838 | 0.00 | 0.00 | 0.0116 | 1.8719 | 0.0000 | 0.1373 | 0.01 | 0.09 | 0.01 | 2.88 |
| DSJ23-5-C3-line003 | 3.0071 | 0.00 | 0.00 | 0.0062 | 1.8285 | 0.0000 | 0.1449 | 0.08 | 0.12 | 0.00 | 2.81 |
| DSJ23-5-C3-line004 | 2.9960 | 0.00 | 0.00 | 0.0003 | 1.8765 | 0.0000 | 0.1309 | 0.02 | 0.09 | 0.01 | 2.88 |
| DSJ23-5-C3-line005 | 3.0007 | 0.00 | 0.00 | 0.0061 | 1.8625 | 0.0000 | 0.1237 | 0.04 | 0.09 | 0.01 | 2.87 |
| DSJ23-5-C3-line006 | 3.0169 | 0.00 | 0.00 | 0.0019 | 1.8656 | 0.0000 | 0.0967 | 0.07 | 0.10 | 0.00 | 2.84 |
| DSJ23-5-C3-line007 | 2.9961 | 0.00 | 0.00 | 0.0002 | 1.7918 | 0.0000 | 0.2156 | 0.03 | 0.10 | 0.00 | 2.86 |
| DSJ23-5-C3-line008 | 3.0041 | 0.00 | 0.00 | 0.0000 | 1.8352 | 0.0000 | 0.1566 | 0.04 | 0.10 | 0.00 | 2.86 |
| DSJ23-5-C3-line009 | 3.0062 | 0.00 | 0.00 | 0.0000 | 1.8505 | 0.0010 | 0.1362 | 0.06 | 0.10 | 0.00 | 2.83 |
| DSJ23-5-C3-line010 | 3.0177 | 0.00 | 0.00 | 0.0001 | 1.8371 | 0.0000 | 0.1273 | 0.06 | 0.08 | 0.00 | 2.87 |
| End-Member | Uva | Pyr | Spe | And | Gro | Alm | Ski | Other | |
|---|---|---|---|---|---|---|---|---|---|
| Points | |||||||||
| DSJ23-4-C3-line001 | 0.00 | 0.19 | 3.48 | 6.04 | 89.21 | 0.41 | 0.00 | 0.67 | |
| DSJ23-4-C3-line002 | 0.00 | 0.31 | 3.37 | 6.13 | 88.97 | 1.00 | 0.00 | 0.22 | |
| DSJ23-4-C3-line003 | 0.00 | 0.22 | 3.36 | 6.15 | 89.43 | 0.46 | 0.00 | 0.37 | |
| DSJ23-4-C3-line004 | 0.01 | 0.18 | 3.33 | 6.28 | 88.84 | 1.30 | 0.00 | 0.07 | |
| DSJ23-4-C3-line005 | 0.00 | 0.24 | 3.33 | 7.32 | 88.48 | 0.00 | 0.00 | 0.63 | |
| DSJ23-4-C3-line006 | 0.01 | 0.15 | 4.12 | 8.58 | 85.47 | 1.31 | 0.00 | 0.36 | |
| DSJ23-4-C3-line007 | 0.03 | 0.18 | 3.52 | 5.78 | 89.01 | 1.22 | 0.00 | 0.25 | |
| DSJ23-4-C3-line008 | 0.00 | 0.13 | 3.34 | 8.48 | 85.17 | 1.77 | 0.00 | 1.11 | |
| DSJ23-4-C3-line009 | 0.00 | 0.13 | 3.84 | 9.91 | 84.34 | 1.58 | 0.00 | 0.20 | |
| DSJ23-4-C3-line010 | 0.00 | 0.08 | 2.86 | 7.86 | 87.93 | 1.25 | 0.00 | 0.02 | |
| DSJ23-5-C3-line001 | 0.02 | 0.12 | 3.59 | 6.89 | 88.20 | 1.16 | 0.00 | 0.01 | |
| DSJ23-5-C3-line002 | 0.00 | 0.36 | 3.01 | 6.86 | 89.16 | 0.36 | 0.00 | 0.25 | |
| DSJ23-5-C3-line003 | 0.00 | 0.16 | 4.09 | 7.26 | 84.87 | 2.55 | 0.00 | 1.07 | |
| DSJ23-5-C3-line004 | 0.00 | 0.32 | 3.01 | 6.54 | 89.34 | 0.60 | 0.00 | 0.20 | |
| DSJ23-5-C3-line005 | 0.00 | 0.19 | 2.91 | 6.19 | 88.73 | 1.42 | 0.00 | 0.55 | |
| DSJ23-5-C3-line006 | 0.00 | 0.13 | 3.31 | 4.85 | 87.79 | 2.40 | 0.00 | 1.51 | |
| DSJ23-5-C3-line007 | 0.00 | 0.09 | 3.18 | 10.77 | 84.64 | 1.11 | 0.00 | 0.20 | |
| DSJ23-5-C3-line008 | 0.00 | 0.10 | 3.30 | 7.84 | 86.95 | 1.48 | 0.00 | 0.33 | |
| DSJ23-5-C3-line009 | 0.05 | 0.15 | 3.45 | 6.82 | 86.90 | 2.14 | 0.00 | 0.49 | |
| DSJ23-5-C3-line010 | 0.00 | 0.11 | 2.84 | 6.39 | 87.11 | 2.13 | 0.00 | 1.43 | |
| Points | SiO2 | TiO2 | Al2O3 | Cr2O3 | FeO | MnO | MgO | CaO | Na2O | K2O | H2O | F | Cl | Total |
|---|---|---|---|---|---|---|---|---|---|---|---|---|---|---|
| DSJ-B1-C1 | 57.2671 | 0.0593 | 0.0023 | 0.0223 | 10.7479 | 0.0278 | 18.0524 | 11.4794 | 0.0028 | 0.008 | 1.710 | 0.020 | 0.309 | 99.7083 |
| DSJ-B2-C1 | 55.557 | 0.0691 | 0.1802 | 0.0102 | 11.7553 | 0 | 18.2106 | 11.2193 | 0.0272 | 0.0407 | 1.819 | 0 | 0.253 | 99.1416 |
| DSJ-B2-C2 | 56.973 | 0.0901 | 0.0765 | 0.1666 | 12.3796 | 0 | 17.4873 | 10.6217 | 0.0929 | 0.0071 | 1.832 | 0 | 0.261 | 99.9878 |
| Points | T | C | B | A | ||||||||||||||
|---|---|---|---|---|---|---|---|---|---|---|---|---|---|---|---|---|---|---|
| Si | Al | Ti | Fe3+ | Al | Ti | Cr3+ | Fe3+ | Mg | Fe | Fe | Mn | Ca | Na | K | OH | F | Cl | |
| DSJ-B1-C1 | 8 | 0 | 0 | 0 | 0 | 0.006 | 0.002 | 0.573 | 3.759 | 0.658 | 0.024 | 0.003 | 1.718 | 0.001 | 0.001 | 1.489 | 0.009 | 0.073 |
| DSJ-B2-C1 | 7.866 | 0.03 | 0.007 | 0.097 | 0 | 0 | 0.001 | 0.473 | 3.844 | 0.682 | 0.14 | 0 | 1.702 | 0.007 | 0.007 | 1.615 | 0 | 0.046 |
| DSJ-B2-C2 | 8 | 0 | 0 | 0 | 0.013 | 0.01 | 0.018 | 0.469 | 3.661 | 0.829 | 0.155 | 0 | 1.598 | 0.025 | 0.001 | 1.62 | 0 | 0.052 |
| Points | Si | Li | Na | Mg | Al | K | Ca | Rb | Ti | V | Cr | Mn | Fe | Cs |
|---|---|---|---|---|---|---|---|---|---|---|---|---|---|---|
| DSJ23-5-1 | 4,495,000 | 1.72 | bdl | 360.4 | 111,000 | bdl | 234,500 | bdl | 105.2 | 0.58 | bdl | 13,500 | 17,510 | bdl |
| DSJ23-5-2 | 4,607,000 | 1.104 | 3.08 | 335.9 | 112,300 | bdl | 234,500 | 0.0024 | 99.4 | 0.373 | bdl | 13,370 | 17,290 | bdl |
| DSJ23-5-3 | 4,589,000 | 1.164 | 3.71 | 319.1 | 111,500 | bdl | 233,500 | bdl | 144.6 | 0.381 | bdl | 14,150 | 17,550 | bdl |
| DSJ23-5-4 | 4,401,000 | 0.28 | 4.59 | 85.6 | 115,800 | 5.1 | 238,400 | 0.097 | 411.3 | 1.068 | bdl | 14,890 | 10,480 | 0.197 |
| DSJ23-5-5 | 4,566,000 | 1.46 | 3.62 | 240.2 | 109,800 | bdl | 232,300 | bdl | 216.4 | 1.173 | bdl | 15,110 | 18,050 | bdl |
| DSJ23-5-6 | 4,552,000 | 3.42 | 3.12 | 428.7 | 111,500 | bdl | 231,400 | bdl | 183.4 | 1.399 | bdl | 14,020 | 17,940 | bdl |
| DSJ23-5-7 | 4,683,000 | 0.688 | 5.7 | 209.3 | 106,800 | 1.7 | 233,500 | 0.094 | 64.6 | 1.084 | bdl | 14,380 | 25,970 | 0.15 |
| DSJ23-5-8 | 4,644,000 | 1.66 | 48 | 186.4 | 109,900 | 75 | 235,300 | 1.59 | 171.9 | 2.47 | 40 | 13,800 | 25,150 | 2.13 |
| DSJ23-5-9 | 4,595,000 | 1.2 | bdl | 198.6 | 110,900 | bdl | 234,200 | 0.0084 | 19.2 | 0.293 | bdl | 13,520 | 21,900 | 0.0078 |
| DSJ23-5-10 | 4,730,000 | 0.614 | 4.01 | 207.4 | 106,600 | 1.8 | 231,900 | bdl | 56.2 | 0.963 | bdl | 13,960 | 26,680 | 0.0033 |
| DSJ23-5-11 | 4,437,000 | 5.39 | 10.17 | 434.4 | 110,300 | bdl | 232,700 | bdl | 2516 | 2.3 | bdl | 13,120 | 17,660 | bdl |
| DSJ23-5-12 | 4,523,000 | 2.62 | 7.96 | 455.6 | 110,600 | 2.41 | 234,100 | bdl | 1212 | 1.072 | bdl | 11,920 | 20,070 | bdl |
| DSJ23-5-13 | 4,527,000 | 1.81 | 5.45 | 408.3 | 112,100 | 2.71 | 237,600 | 0.053 | 276.6 | 0.363 | bdl | 12,700 | 20,040 | 0.083 |
| DSJ23-5-14 | 4,591,000 | 1.64 | 4.91 | 386.4 | 112,000 | 1.14 | 238,700 | 0.044 | 202.6 | 0.309 | bdl | 12,590 | 20,540 | 0.075 |
| DSJ23-5-15 | 4,603,000 | 1.62 | 5.46 | 352.4 | 112,000 | bdl | 236,100 | 0.047 | 55 | 0.192 | bdl | 12,860 | 20,730 | 0.111 |
| DSJ23-5-16 | 4,482,000 | 1.75 | 3.41 | 382.9 | 111,500 | bdl | 235,900 | bdl | 533 | 0.454 | bdl | 12,410 | 19,460 | bdl |
| DSJ23-5-17 | 4,615,000 | 10.49 | 18.92 | 406.2 | 108,700 | bdl | 231,800 | 0.0208 | 3976 | 4.08 | bdl | 13,390 | 17,560 | bdl |
| DSJ23-5-18 | 4,566,000 | 2.42 | 5.33 | 455 | 112,200 | bdl | 236,700 | 0.0101 | 773 | 0.956 | bdl | 12,990 | 20,030 | 0.0226 |
| DSJ23-5-19 | 4,578,000 | 1.94 | 8.89 | 422.7 | 111,600 | 5.7 | 235,600 | 0.096 | 457 | 0.527 | 0.86 | 11,810 | 19,810 | 0.209 |
| DSJ23-5-20 | 4,628,000 | 1.74 | 4.33 | 401 | 114,200 | bdl | 238,400 | bdl | 122 | 0.277 | bdl | 13,490 | 20,320 | bdl |
Disclaimer/Publisher’s Note: The statements, opinions and data contained in all publications are solely those of the individual author(s) and contributor(s) and not of MDPI and/or the editor(s). MDPI and/or the editor(s) disclaim responsibility for any injury to people or property resulting from any ideas, methods, instructions or products referred to in the content. |
© 2025 by the authors. Licensee MDPI, Basel, Switzerland. This article is an open access article distributed under the terms and conditions of the Creative Commons Attribution (CC BY) license (https://creativecommons.org/licenses/by/4.0/).
Share and Cite
Chen, L.-R.-X.; Song, Q.-Y.; Yang, X.-Q.; Chen, X.-C.; Zuo, R.-H.; Liu, X.-L.; Zhang, S.-T.; Gui, L.-F.; Zhou, J.-H.; Lu, B.-D. Gemological Characteristics and Spectral Characteristics of Grossular from Mt. Bozhushan in Southeast Yunnan Province. Crystals 2025, 15, 317. https://doi.org/10.3390/cryst15040317
Chen L-R-X, Song Q-Y, Yang X-Q, Chen X-C, Zuo R-H, Liu X-L, Zhang S-T, Gui L-F, Zhou J-H, Lu B-D. Gemological Characteristics and Spectral Characteristics of Grossular from Mt. Bozhushan in Southeast Yunnan Province. Crystals. 2025; 15(4):317. https://doi.org/10.3390/cryst15040317
Chicago/Turabian StyleChen, Liu-Run-Xuan, Qiu-Yun Song, Xiao-Qi Yang, Xian-Chao Chen, Ruo-Han Zuo, Xue-Long Liu, Shi-Tao Zhang, Long-Fei Gui, Jie-Hu Zhou, and Bo-De Lu. 2025. "Gemological Characteristics and Spectral Characteristics of Grossular from Mt. Bozhushan in Southeast Yunnan Province" Crystals 15, no. 4: 317. https://doi.org/10.3390/cryst15040317
APA StyleChen, L.-R.-X., Song, Q.-Y., Yang, X.-Q., Chen, X.-C., Zuo, R.-H., Liu, X.-L., Zhang, S.-T., Gui, L.-F., Zhou, J.-H., & Lu, B.-D. (2025). Gemological Characteristics and Spectral Characteristics of Grossular from Mt. Bozhushan in Southeast Yunnan Province. Crystals, 15(4), 317. https://doi.org/10.3390/cryst15040317