Article

Particle Size Grading Strategy for Enhanced Performance of Lithium Iron Phosphate Cathode Materials

1
College of Chemistry and Chemical Engineering, Central South University, Changsha 410083, China
2
Hunan Provincial Key Laboratory of Chemical Power Sources, College of Chemistry and Chemical Engineering, Central South University, Changsha 410083, China
3
Beijing Institute of Spacecraft System Engineering, Beijing 100094, China
4
College of Chemistry and Chemical Engineering, Hunan University of Science & Technology, Xiangtan 410082, China
*
Authors to whom correspondence should be addressed.
Crystals 2025, 15(4), 308; https://doi.org/10.3390/cryst15040308
Submission received: 3 March 2025 / Revised: 13 March 2025 / Accepted: 24 March 2025 / Published: 26 March 2025
(This article belongs to the Section Materials for Energy Applications)

Abstract

:
Lithium iron phosphate (LiFePO4) is a promising cathode material for lithium-ion batteries (LIBs), but its low conductivity and poor rate performance limit its application in high-power devices. In this study, we employed a particle size grading strategy to enhance the electrochemical performance of LiFePO4. By mixing small and large particles in different ratios (3:1, 2:1, 1:1, 1:2, and 1:3), we synthesized graded iron phosphate precursors, which were then used to prepare LiFePO4 cathode materials. The effects of particle size distribution on the material’s structural properties and electrochemical performance were systematically investigated. SEM images revealed that the morphology of LiFePO4 changed with varying precursor ratios, with the 3:1 ratio resulting in a more uniform particle distribution. The results showed that the 3:1 ratio exhibited the highest discharge capacity of 159.4 mAh/g, while larger particle ratios (2:1 and 1:1) led to decreased capacity due to the increased proportion of larger particles. Additionally, the LiFePO4 materials prepared from non-in situ mixed precursors exhibited higher tap densities, with the 2:1 ratio achieving the highest tap density of 2.545 g/cm3. This study demonstrates the effectiveness of the particle size grading approach in improving the electrochemical properties of LiFePO4 and provides insights into the design of high-performance cathode materials for advanced lithium-ion batteries.

1. Introduction

The development of high-performance energy storage materials has become a key focus in the quest for sustainable energy solutions [1,2,3]. With the growing demand for renewable energy sources and the increasing need for efficient energy storage systems, lithium-ion batteries (LIBs) have emerged as one of the most promising technologies [4,5,6,7]. However, there are still challenges to be addressed, such as improving the capacity, rate performance, and stability of the materials used, particularly in cathodes [8,9,10].
Among the various cathode materials studied for LIBs, lithium iron phosphate (LiFePO4) has garnered widespread attention due to its inherent advantages, such as low cost, excellent thermal stability, and environmental friendliness [11,12,13,14]. Despite these benefits, the relatively low conductivity and poor rate performance of LiFePO4 have hindered its widespread application, particularly in high-power devices [15,16]. Existing research indicates that smaller particles can shorten the Li+ diffusion path and enhance rate performance [17,18,19]. Meanwhile, rational particle size distribution (such as filling larger particle gaps with smaller particles) can improve the packing density of the electrode while maintaining sufficient porosity to facilitate electrolyte wetting [20,21,22]. For example, Yand et al. investigated LiFePO4/C particles with varying particle sizes (LFP-1, LFP-2, and LFP-3) and found that their initial discharge specific capacities at a rate of 0.1 C were 154.82, 143.2, and 102.4 mAh g−1, respectively [23]. However, these studies have primarily focused on optimizing single particle sizes or simple mixing techniques, and systematic investigations into different particle size ratios (such as 3:1, 2:1, etc.) are still lacking. And the synergistic effects of particle grading on the stoichiometry of iron phosphate, packing density, and electrochemical kinetics have not been clearly revealed [24,25].
This study emphasizes the synthesis of LiFePO4 cathode materials using a novel particle size combination approach, proposing a non-in situ mixing strategy (stepwise synthesis of small and large particles followed by mixing) to address the insufficient pore filling issues associated with traditional in situ mixing methods. By controlling the proportion of small and large particles in the precursor material, our goal is to optimize the structural properties and electrochemical performance of the material. Through this approach, we investigate the effects of particle size grading on the electrochemical characteristics of LiFePO4, including capacity, tap density, and impedance. The findings indicate that the LiFePO4 synthesized with a 3:1 ratio of small particles to large particles achieves a capacity of up to 159.4 mAh/g and a tapped density of 2.483 g/cm3. This work represents a significant step forward in enhancing the performance of LiFePO4 as a high-density, high-rate, and long-lasting cathode material for future energy storage technologies.

2. Experimental

2.1. Material Synthesis

Materials were synthesized through a particle size grading strategy to prepare LiFePO4 cathode materials. The synthesis process involved the preparation of small- and large-particle-sized iron phosphate precursors, which were then mixed in various ratios to obtain graded precursor materials.
Small-particle iron phosphate synthesis: A 1 L solution of iron sulfate (FeSO4·7H2O) was placed in a flask and stirred in a constant temperature water bath at 60 °C with a stirring speed of 500 rpm. The phosphorus source, ammonium dihydrogen phosphate (NH4H2PO4), was added to the iron solution over 100 min. After addition, the temperature was raised to 92 °C and kept here for 2 h, followed by filtration, washing, and aging at 92 °C for 2 h. The solid content of the precursor was controlled at 20%.
Large-particle iron phosphate synthesis: The procedure was similar to small-particle synthesis, except that the stirring speed was reduced to 200 rpm, and the temperature was maintained at 40 °C during the addition of the phosphorus source, which took 200 min. The same aging process was applied as for small-particle synthesis.
For the synthesis of graded precursor materials, small- and large-particle iron phosphates were mixed in different ratios (3:1, 2:1, 1:1, 1:2, and 1:3) and stirred at 92 °C for 60 min. The slurry was then filtered and dried at 105 °C for 12 h. Afterward, the dried material was calcined in a muffle furnace at 560 °C for 4 h to obtain the final iron phosphate precursor.
LiFePO4 synthesis: The prepared graded iron phosphate precursors, lithium carbonate (Li2CO3) as the lithium source, glucose as the carbon source, and titanium dioxide (TiO2) as the titanium source, were used for the synthesis of LiFePO4. The molar ratio of Li/Fe was maintained at 1.04, with glucose accounting for 10% of the total mass of FePO4 and Li2CO3, and Ti doping at 1500 ppm. The precursor slurry was prepared by ball milling the ingredients with a solid content of 45% in deionized water to achieve a particle size (D50) of 0.34–0.38 µm. The slurry was then spray-dried to form a powder. The powder was calcined in a quartz crucible under nitrogen protection at 745 °C for 8 h to obtain the final LiFePO4 cathode material.

2.2. Materials Characterization

X-ray diffraction (XRD) patterns were acquired using a Bruker Advance-D8 diffractometer, employing Cu Kα radiation as the source. XRD patterns were collected from 10° to 80° (2θ), with a step size of 0.02° to identify phase compositions and crystalline structure. Scanning Electron Microscopy (SEM) (KYKY Technology, Beijing, China) was employed to analyze the morphology of the synthesized iron phosphate precursors and LiFePO4 cathode materials. BET Surface Area Measurement was performed to measure the specific surface area of the materials using the Brunauer–Emmett–Teller (BET) method. A nitrogen adsorption apparatus (Micromeritics ASAP 2020) (Micromeritics China, Shanghai, China) was used to collect adsorption–desorption isotherms, from which the pore structure, specific surface area, and pore volume were calculated.

2.3. Electrochemical Measurements

The electrochemical performance of the LiFePO4 cathode materials was evaluated using a variety of electrochemical tests. The tests were performed in a CR2032 coin cell configuration with a lithium metal anode, and the electrolyte was a 1 M LiPF6 solution in a mixture of ethylene carbonate and diethyl carbonate (EC/DEC = 1:1, v/v). Galvanostatic Charge–Discharge Measurements were carried out using a battery testing system (LAND CT2001A) (LAND Electronics, Wuhan, China). Cyclic Voltammetry (CV) was conducted using a potentiostat (CHI660E) (CH Instruments, Inc., Shanghai, China) to evaluate the electrochemical kinetics of the cathode materials. Electrochemical Impedance Spectroscopy (EIS) was performed to investigate the impedance characteristics of the cells and evaluate the internal resistance and charge transfer resistance. The frequency range for the EIS measurements was from 100 kHz to 0.1 Hz, with an AC voltage perturbation of 5 mV. All data were obtained through multiple replicates.

3. Results and Discussion

First, we prepared the precursors by mixing small and large particles in different ratios. The mixing ratio significantly affects precursor characteristics. As shown in Figure 1, the morphology of the precursors varies with the different ratios. SEM images clearly indicate that in the FePO4 precursor with a 1:3 ratio (small particles: large particles), the larger particles are much more prevalent, suggesting the formation of a morphology with a graded particle size distribution. Additionally, although the precursors in all ratios exhibit spherical-like agglomerates aggregation, the precursor with a higher proportion of small particles forms more secondary agglomerates, which are also more uniform.
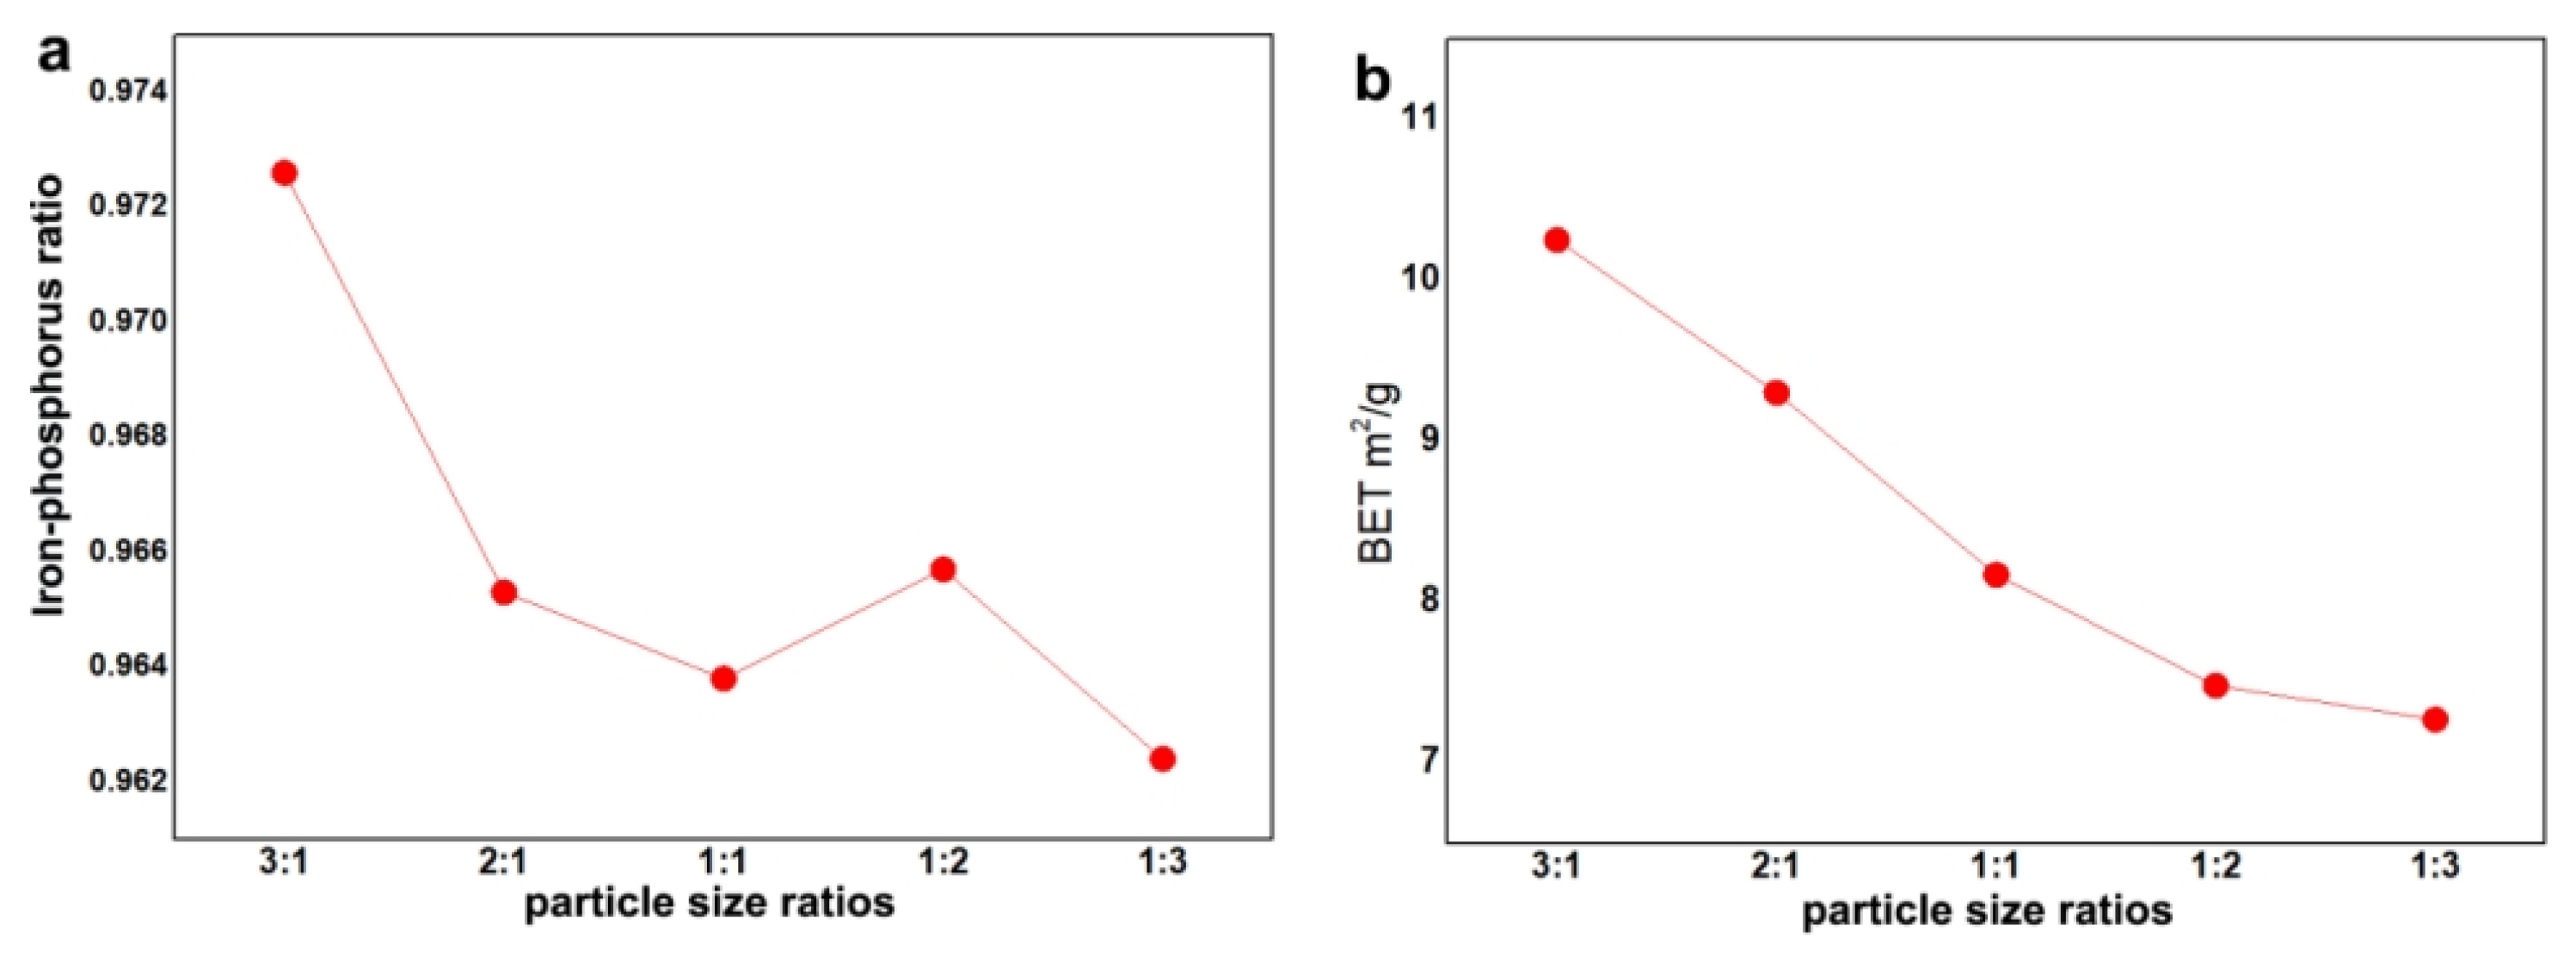
Moreover, the performance of the precursors is influenced by the different ratio combinations. Figure 2 presents the trends of the iron-to-phosphorus ratio and the specific surface area of precursors with varying particle size ratios. In terms of the iron-to-phosphorus ratio, there is an overall trend where a higher proportion of larger particles results in a lower iron-to-phosphorus ratio. This is because precursors with larger particles tend to have a lower iron-to-phosphorus ratio. Therefore, increasing the proportion of larger particles leads to a reduction in the iron-to-phosphorus ratio. Regarding the specific surface area, a higher proportion of larger particles corresponds to a lower specific surface area. This is likely due to the fact that as the proportion of larger particles increases, smaller particles fill more of the pores between the particles, thereby reducing the porosity of iron phosphate and consequently lowering the specific surface area of the material.
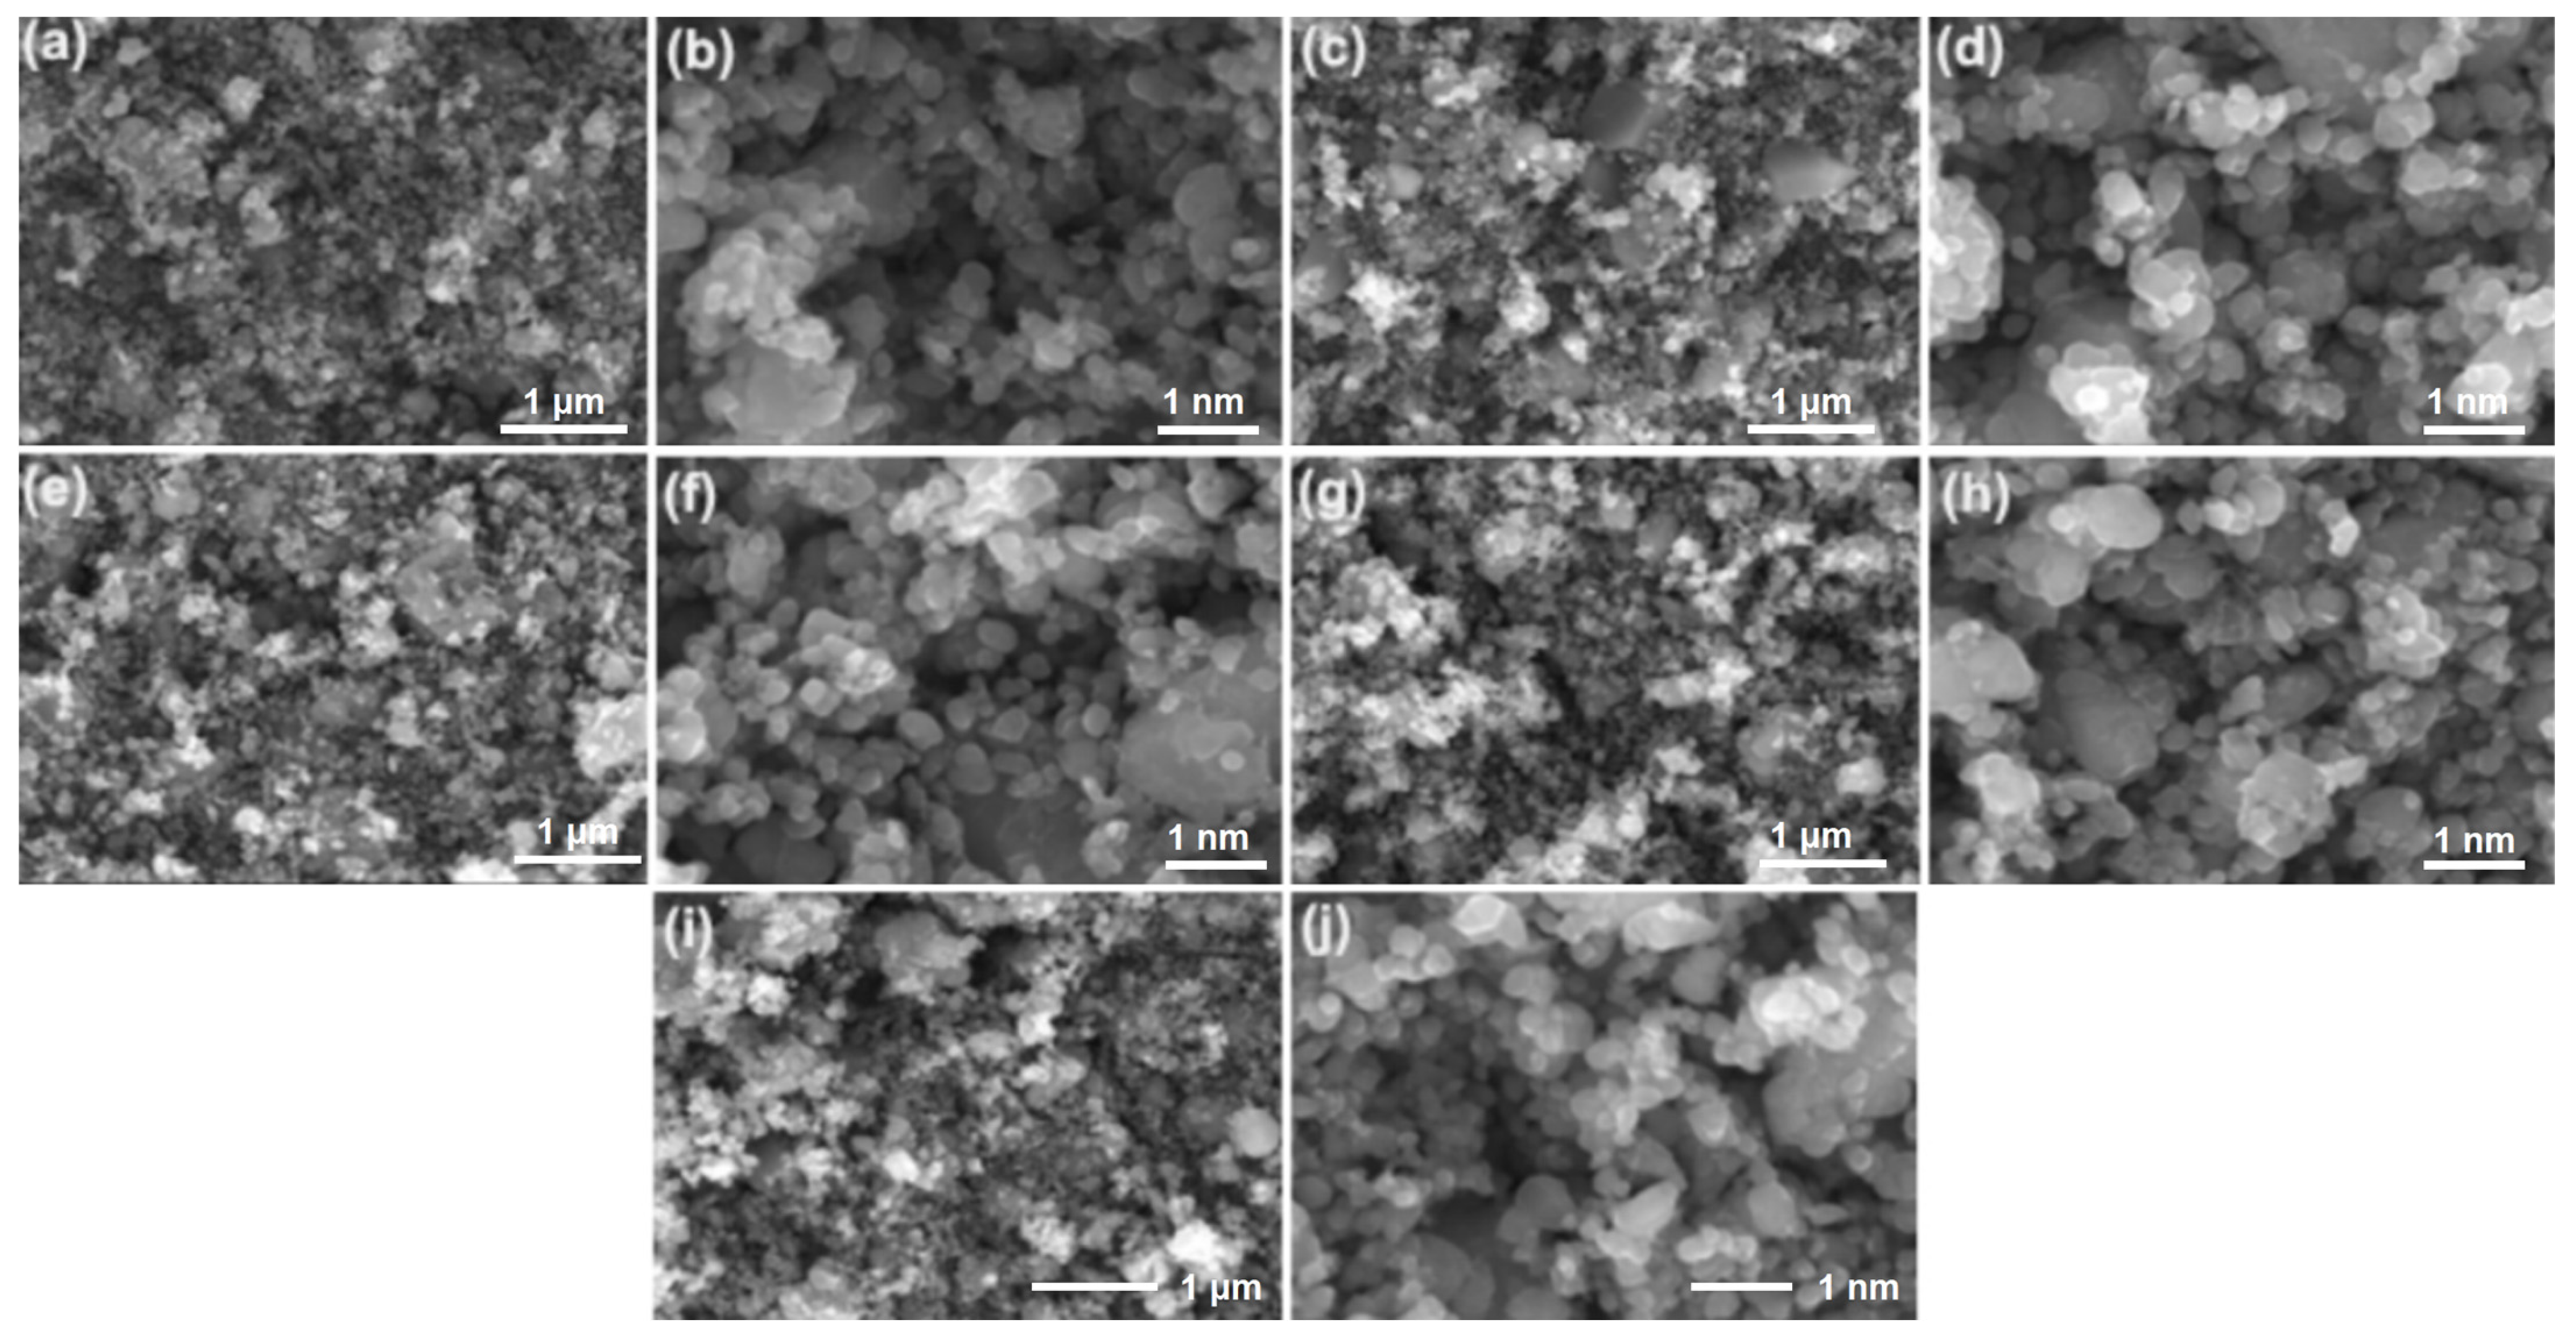
The iron source and phosphorus source were provided by precursors with different particle size ratios, the lithium source by lithium carbonate, and the carbon source by glucose to synthesize lithium iron phosphate. Figure 3 shows the morphology of LiFePO4 products prepared with different precursor particle size ratios. From the SEM images, after sintering, LiFePO4 exhibits slight agglomeration, with a morphology consisting of particles arranged in a stepwise size distribution. LiFePO4 prepared at the 3:1, 1:2, and 1:3 ratios shows a more uniform particle distribution after sintering, with fewer large particles, while those prepared at the 2:1 and 1:1 ratios show a significantly higher number of larger particles.
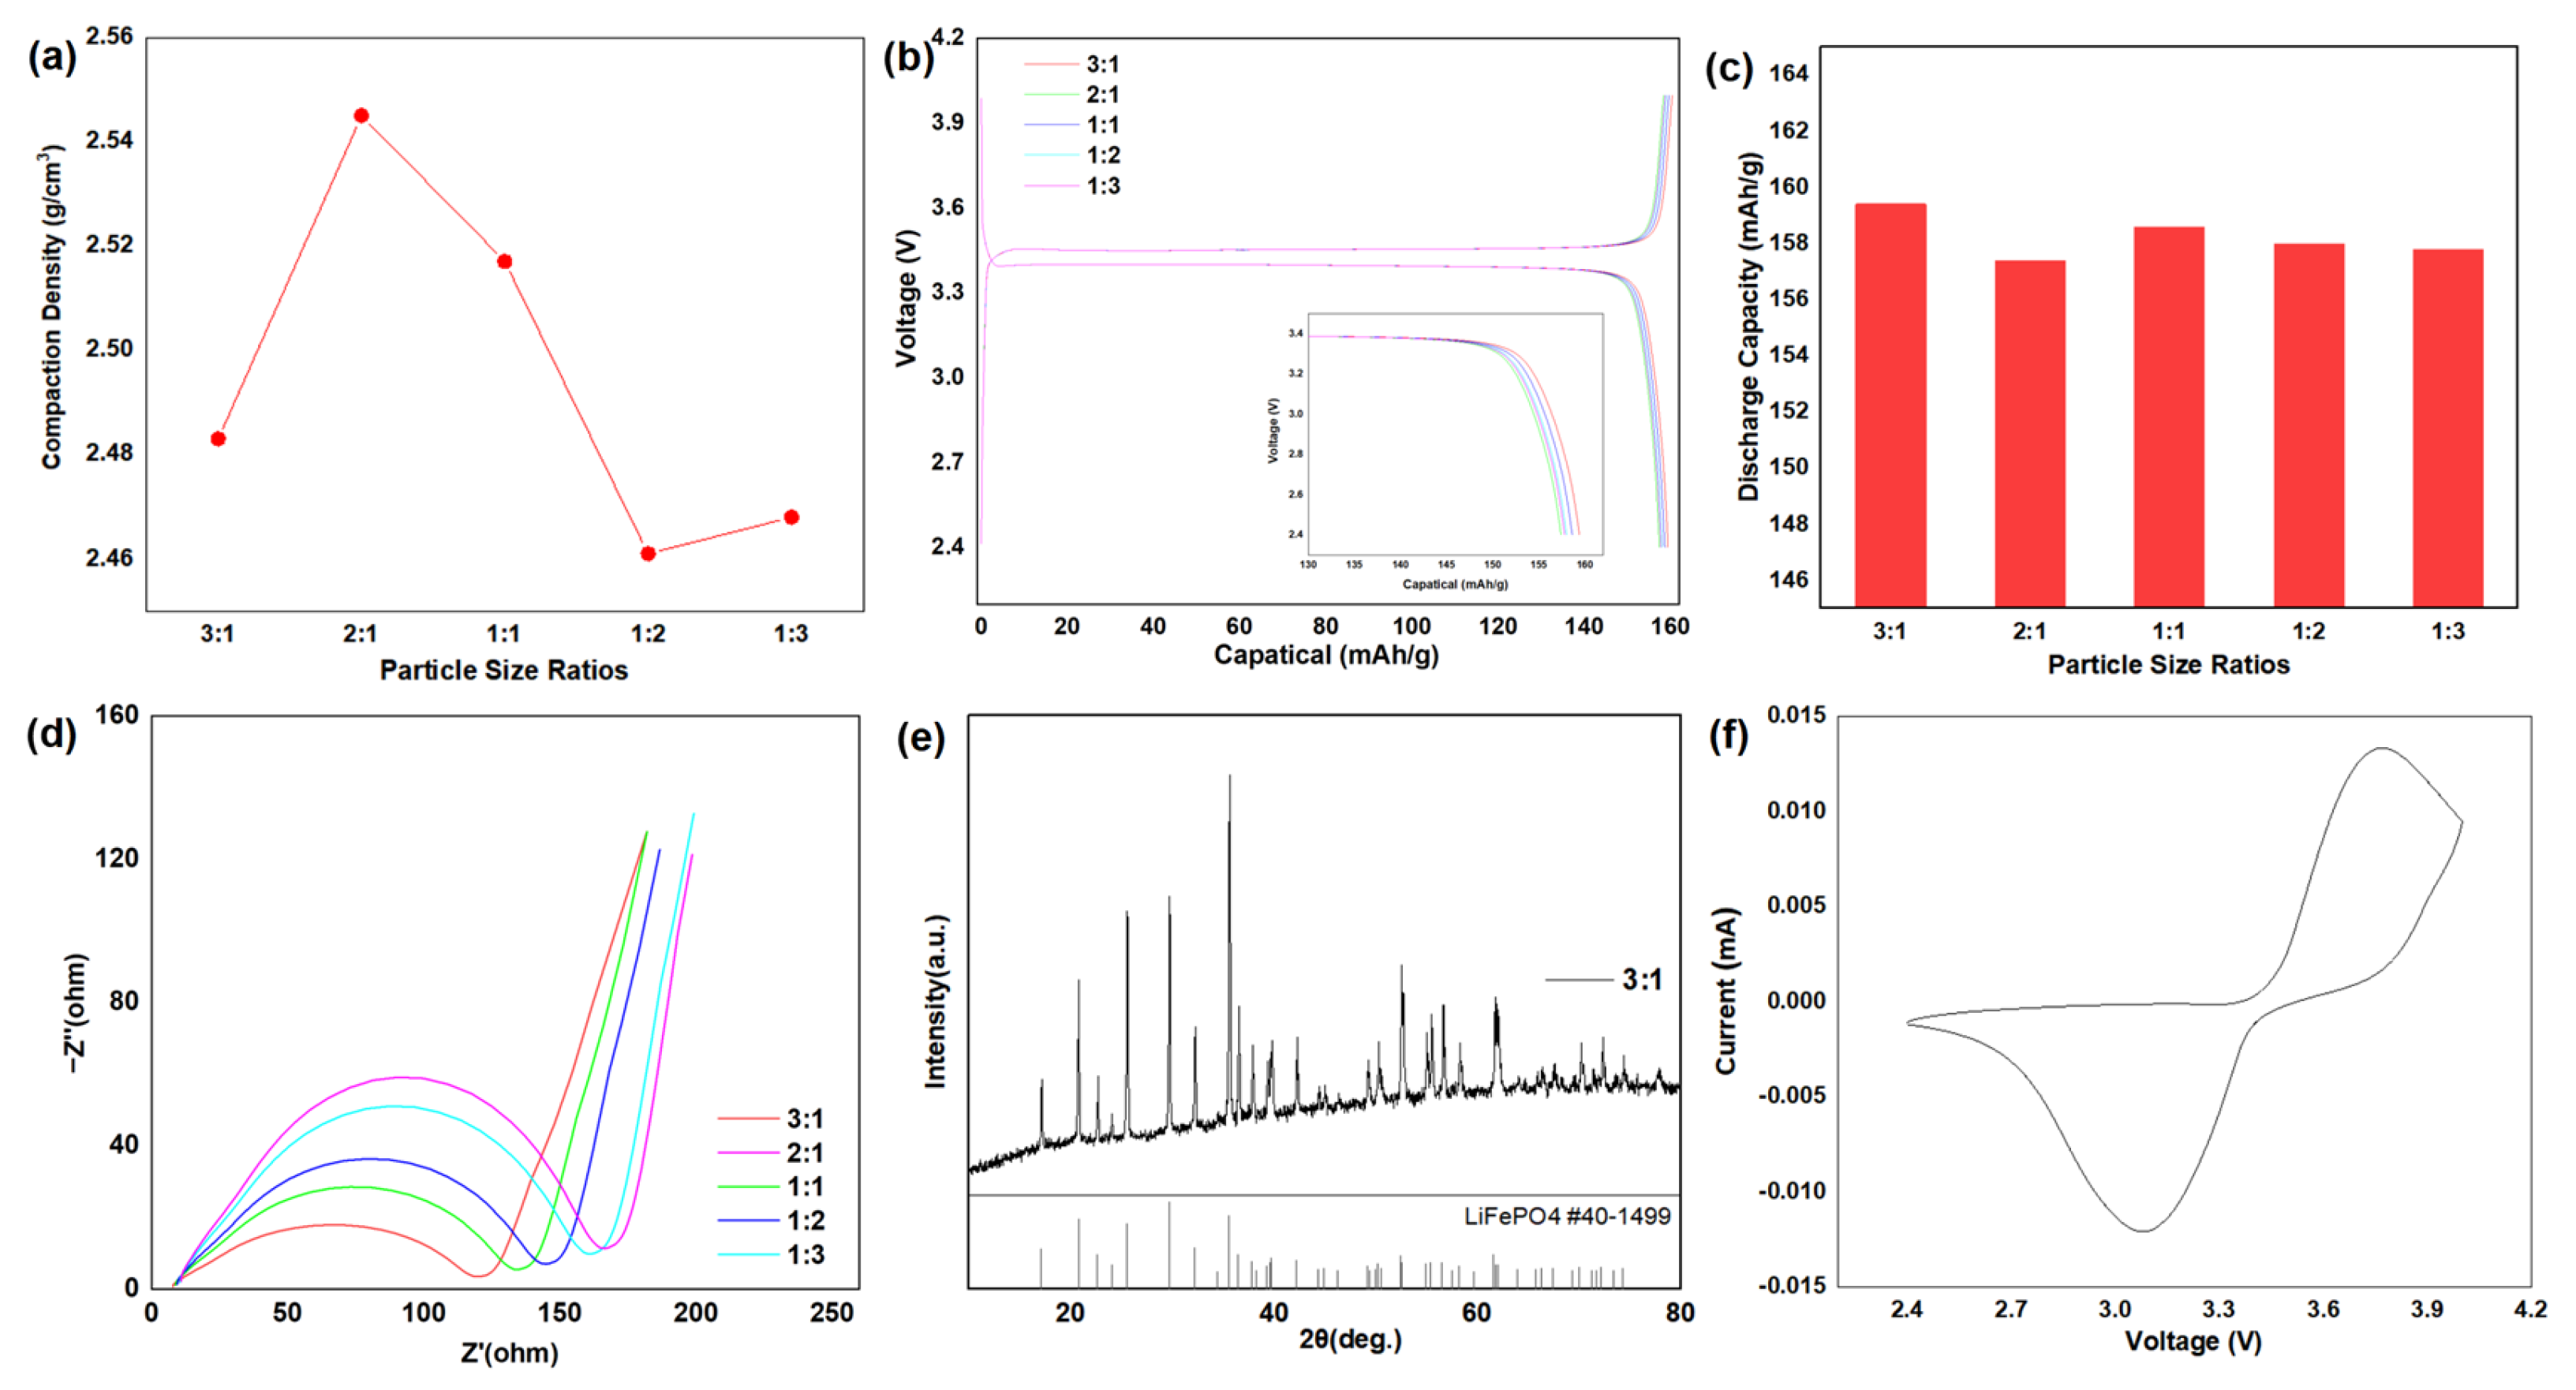
On the other hand, LiFePO4 synthesized from non-in situ mixed precursors exhibits a higher tap density. As shown in Figure 4a, the tap densities of all samples are above 2.47 g/cm3, with the highest tap density of 2.545 g/cm3 observed at a 2:1 precursor ratio. The 1:1 ratio condition follows with a tap density of 2.517 g/cm3. This is consistent with the SEM morphological structure, where the 2:1 ratio results in the largest number of enlarged particles, with smaller particles filling the voids between the larger ones. Under these conditions, LiFePO4 tends to form a well-graded morphology of particles with varying sizes, leading to a higher tap density. The tap densities at the 3:1, 1:2, and 1:3 ratios are 2.483 g/cm3, 2.461 g/cm3, and 2.468 g/cm3, respectively.
Moreover, as shown in Figure 4b,c, different precursor mixing ratios also have a certain impact on capacity. Under the 3:1 mixing ratio, the discharge specific capacity reaches its highest value of 159.4 mAh/g, while the discharge specific capacities at the 2:1, 1:1, 1:2, and 1:3 ratios are observed to be 157.4 mAh/g, 158.6 mAh/g, 158.0 mAh/g, and 157.8 mAh/g, respectively. This indicates that particle size significantly affects the discharge performance of LiFePO4 cathode materials. Smaller particles possess a higher specific surface area, effectively filling the gaps between larger particles and thereby reducing resistance to ionic transport. This is evidenced by the impedance spectrum in Figure 4d, where the slope of the low-frequency region increases with a higher proportion of large particles. The corresponding Nyquist plots (Figure 4d) further indicate that charge transfer resistance (Rct) increases with the presence of larger particles. This rise in resistance correlates with the gradual capacity decline observed in Figure 4c, suggesting that larger particles contribute to higher interfacial resistance, which hinders Li+ diffusion and limits the accessibility of the active material. Furthermore, the uniform distribution depicted in Figure 3a,b reinforces this notion, demonstrating that this particle combination can significantly enhance ionic transport efficiency. Therefore, under the 3:1 ratio, the proportion of large particles is relatively low, resulting in a more uniform distribution of LiFePO4 particles, which is advantageous for discharge performance. Figure 4e shows the XRD spectrum of LiFePO4 under the 3:1 condition. From the spectrum, it can be observed that the lithium iron phosphate sample matches the standard card 29-0715. Additionally, as shown in Figure 4f, the CV of LiFePO4 at a scan rate of 0.8 mV/s under the 3:1 condition corresponds to the charge–discharge curve in Figure 4b.

4. Conclusions

In this study, a novel particle size grading approach was used to synthesize LiFePO4 cathode materials with enhanced electrochemical performance. By adjusting the ratios of small and large particles in the precursor materials, the structural and electrochemical properties of LiFePO4 were optimized. The results indicate that the precursor mixing ratio significantly affects the morphology, tap density, and discharge capacity of the final cathode material. Specifically, the 3:1 ratio of small to large particles led to the highest discharge capacity and a more uniform particle distribution, which is favorable for improved discharge performance. Conversely, increasing the proportion of large particles (2:1 and 1:1 ratios) resulted in larger particles and reduced discharge capacity. These findings underscore the critical importance of particle size distribution in optimizing the electrochemical properties of LiFePO4 and provide valuable insights for future investigations into a broader range of particle size ratios, the impact of particle grading on material lifespan, and understanding of the microscopic mechanisms governing Li+ diffusion pathways influenced by particle size distribution. Such insights will be essential for advancing the development of high-performance cathode materials for lithium-ion battery applications.

Author Contributions

P.L.: formal analysis, validation, writing—original draft, data curation, formal analysis, investigation. Y.W.: data curation, validation. L.Z.: validation, project administration. K.Z.: validation. W.L.: project administration, supervision. T.C.: writing—review and editing, project administration. K.L.: project administration, supervision. All authors have read and agreed to the published version of the manuscript.

Funding

This research was funded by the National Natural Science Foundation of China (No. 22272204), the Hunan Provincial Natural Science Foundation Project (No.2023JJ40276), the Beijing Nova Program (No. 20220484153), and the Hunan Provincial Natural Science Foundation Project (No. 2025JJ60355).

Data Availability Statement

Data will be made available on request.

Conflicts of Interest

The authors declare that they have no known competing financial interests or personal relationships that could have appeared to influence the work reported in this paper.

References

  1. Wang, J.; Shao, Z.; Ru, H. Influence of carbon sources on LiFePO4/C composites synthesized by the high-temperature high-energy ball milling method. Ceram. Int. 2014, 40, 6979–6985. [Google Scholar] [CrossRef]
  2. Ma, Y.; Shen, W.; Yao, Y. Preparation of Nanoscale Iron (III) Phosphate by Using FerroPhosphorus as Raw Material. IOP Conf. Ser. Earth Environ. Sci. Technol. 2019, 252, 022032. [Google Scholar]
  3. Yang, X.-G.; Liu, T.; Wang, C.-Y. Thermally modulated lithium iron phosphate batteries for mass-market electric vehicles. Nat. Energy 2021, 6, 176–185. [Google Scholar] [CrossRef]
  4. Zhao, T.; Zhang, X.-J.; Li, X.; Lu, S.-G. Crystallinity dependence of electrochemical properties for LiFePO4. Rare Met. 2014, 34, 334–337. [Google Scholar] [CrossRef]
  5. Cao, Z.; Zhu, G.; Zhang, R.; Chen, S.; Sang, M.; Jia, J.; Yang, M.; Li, X.; Yang, S. Biological phytic acid guided formation of monodisperse large-sized carbon@LiFePO4/graphene composite microspheres for high-performance lithium-ion battery cathodes. Chem. Eng. J. 2018, 351, 382–390. [Google Scholar] [CrossRef]
  6. Lai, X.; Huang, Y.; Gu, H.; Deng, C.; Han, X.; Feng, X.; Zheng, Y. Turning waste into wealth: A systematic review on echelon utilization and material recycling of retired lithium-ion batteries. Energy Storage Mater. 2021, 40, 96–123. [Google Scholar] [CrossRef]
  7. Shentu, H.; Xiang, B.; Cheng, Y.-J.; Dong, T.; Gao, J.; Xia, Y. A fast and efficient method for selective extraction of lithium from spent lithium iron phosphate battery. Environ. Technol. Innov. 2021, 23, 101569. [Google Scholar] [CrossRef]
  8. Zhang, L.; Zhang, Y.; Xu, Z.; Zhu, P. The Foreseeable Future of Spent Lithium-Ion Batteries: Advanced Upcycling for Toxic Electrolyte, Cathode, and Anode from Environmental and Technological Perspectives. Environ. Sci. Technol. 2023, 57, 13270–13291. [Google Scholar] [CrossRef]
  9. Gou, Y.; Zhang, J.; Liu, X.; Zhou, Z.; Zhang, M.; Song, L.; Jin, Y. A Highly Efficient Additive for Direct Reactivation of Waste LiFePO4 with Practical Electrochemical Performance. Energy Fuel 2024, 38, 6518–6527. [Google Scholar] [CrossRef]
  10. Qu, X.; Ma, J.; Zhang, B.; Zhao, J.; Qiu, B.; Chen, X.; Zhou, F.; Li, X.; Gao, S.; Wang, D.; et al. Fast ammonium sulfate salt assisted roasting for selectively recycling degraded LiFePO4 cathode. J. Clean. Prod. 2024, 435, 140428. [Google Scholar] [CrossRef]
  11. Kumar, J.; Neiber, R.R.; Park, J.; Ali Soomro, R.; Greene, G.W.; Ali Mazari, S.; Young Seo, H.; Hong Lee, J.; Shon, M.; Wook Chang, D.; et al. Recent progress in sustainable recycling of LiFePO4-type lithium-ion batteries: Strategies for highly selective lithium recovery. Chem. Eng. J. 2022, 431, 133993. [Google Scholar] [CrossRef]
  12. Wu, L.; Zhang, F.-S.; Zhang, Z.-Y.; Zhang, C.-C. An environmentally friendly process for selective recovery of lithium and simultaneous synthesis of LiFe5O8 from spent LiFePO4 battery by mechanochemical. J. Clean. Prod. 2023, 396, 136504. [Google Scholar] [CrossRef]
  13. Shan, M.; Dang, C.; Meng, K.; Cao, Y.; Zhu, X.; Zhang, J.; Xu, G.; Zhu, M. Recycling of LiFePO4 cathode materials: From laboratory scale to industrial production. Mater. Today 2024, 73, 130–150. [Google Scholar] [CrossRef]
  14. Zhang, Y.; Zhang, W.; Kong, W. Numerical and experimental study on thermal behavior of prismatic lithium-ion battery for large-capacity energy storage. J. Energy Storage 2024, 83, 110620. [Google Scholar] [CrossRef]
  15. Zhao, L.; Zhang, X.-Y.; Lu, Y.-Y.; Jiang, H.; Huang, Y.-Q.; Xu, M.-X.; Lu, Q. Recovery of Electrode Materials from a Spent Lithium-Ion Battery through a Pyrolysis-Coupled Mechanical Milling Method. Energy Fuel 2024, 38, 1310–1318. [Google Scholar] [CrossRef]
  16. Zhu, P.; Hu, J.; Hu, J.; Yang, Y.; Sun, W.; Yang, Y.; Zou, G.; Hou, H.; Ji, X. Redox-Mediated Recycling of Spent Lithium-Ion Batteries Coupled with Low-Energy Consumption Hydrogen Production. ACS Energy Lett. 2024, 9, 569–577. [Google Scholar] [CrossRef]
  17. Zhang, J.; Qiao, J.; Sun, K.; Wang, Z. Balancing particle properties for practical lithium-ion batteries. Particuology 2022, 61, 18–29. [Google Scholar] [CrossRef]
  18. Zhang, Y.; Yin, C.; Qiu, B.; Chen, G.; Shang, Y.; Liu, Z. Revealing Li-ion diffusion kinetic limitations in micron-sized Li-rich layered oxides. Energy Storage Mater. 2022, 53, 763–773. [Google Scholar] [CrossRef]
  19. Yin, R.; Zhao, Z.; Xu, W.; He, L. LiMn2O4 submicronization: Shorten Li+ diffusion pathway for enhancing electrochemical lithium extraction and cycle performance. Sep. Purif. Technol. 2025, 359, 130394. [Google Scholar] [CrossRef]
  20. Jeon, D.H. Enhancing electrode wettability in lithium-ion battery via particle-size ratio control. Appl. Mater. Today 2021, 22, 100976. [Google Scholar] [CrossRef]
  21. Hong, J.; Wei, W.; He, G. Optimizing the particle-size distribution and tap density of LiFePO4/C composites containing excess lithium. Ionics 2018, 25, 2035–2039. [Google Scholar] [CrossRef]
  22. Wang, X.; Wen, L.; Zheng, Y.; Liu, H.; Liang, G. Facile synthesis and electrochemical properties of high tap density LiFePO4/C. Ionics 2019, 25, 4589–4596. [Google Scholar] [CrossRef]
  23. Yan, X.; Li, Y.; Li, C.; Wang, H.; Wang, T.; Ma, Y.; Zhang, S.; Zhang, X.; He, W. Control and influence of morphology, particle size and structure of LiFePO4 on its properties. Solid State Ion. 2024, 410, 116535. [Google Scholar] [CrossRef]
  24. Hu, J.; Li, W.; Duan, Y.; Cui, S.; Song, X.; Liu, Y.; Zheng, J.; Lin, Y.; Pan, F. Single-Particle Performances and Properties of LiFePO4 Nanocrystals for Li-Ion Batteries. Adv. Energy Mater. 2016, 7, 1601894. [Google Scholar] [CrossRef]
  25. Logan, E.R.; Eldesoky, A.; Liu, Y.; Lei, M.; Yang, X.; Hebecker, H.; Luscombe, A.; Johnson, M.B.; Dahn, J.R. The Effect of LiFePO4 Particle Size and Surface Area on the Performance of LiFePO4/Graphite Cells. J. Electrochem. Soc. 2022, 169, 050524. [Google Scholar] [CrossRef]
Figure 1. SEM images of FePO4 precursors with particle size ratios of (a,b) 3:1, (c,d) 2:1, (e,f) 1:1, (g,h) 1:2, and (i,j) 1:3 (small particles: large particles).
Crystals 15 00308 g001
Figure 2. (a) Iron-to-phosphorus ratio and (b) BET specific surface area of precursors with different particle size ratio combinations.
Crystals 15 00308 g002
Figure 3. SEM images of LiFePO4 with FePO4 particle size ratios of (a,b) 3:1, (c,d) 2:1, (e,f) 1:1, (g,h) 1:2, and (i,j) 1:3 (small particles: large particles).
Crystals 15 00308 g003
Figure 4. (a) Compaction density of LiFePO4 with different particle size ratio combinations; the LiFePO4 cathode materials prepared from precursors with different mixing ratios: (b) 0.1 C discharge curves, (c) discharge capacity statistics, and (d) EIS; LiFePO4 with FePO4 particle size ratios of 3:1: (e) XRD and (f) CV plot with a scan rate of 0.8 mV/s.
Crystals 15 00308 g004
Disclaimer/Publisher’s Note: The statements, opinions and data contained in all publications are solely those of the individual author(s) and contributor(s) and not of MDPI and/or the editor(s). MDPI and/or the editor(s) disclaim responsibility for any injury to people or property resulting from any ideas, methods, instructions or products referred to in the content.