Article

Study on the Chromogenic Mechanism of Blue Kyanite from Coronel Murta, Minas Gerais, Brazil

School of Gemmology, China University of Geosciences (Beijing), Beijing 100083, China
*
Author to whom correspondence should be addressed.
Crystals 2025, 15(4), 302; https://doi.org/10.3390/cryst15040302
Submission received: 12 February 2025 / Revised: 17 March 2025 / Accepted: 24 March 2025 / Published: 25 March 2025
(This article belongs to the Collection Topic Collection: Mineralogical Crystallography)

Abstract

:
This study explores the factors influencing the body color of kyanites and the chromogenic mechanism from a novel perspective of gemstone chromaticity. The gemological properties of 20 samples from Coronel Murta, Minas Gerais, Brazil, were characterized using a color spectrophotometer, Fourier-transform infrared spectroscopy (FTIR), and ultraviolet-visible spectroscopy (UV–Vis). The results indicate that the Fe content in kyanites significantly affects the hue angle , chroma C*, and colorimetric coordinate b*, with higher Fe concentrations resulting in a deeper blue hue. Additionally, the Cr and Ti contents influence the body color of kyanites. As the Ti content increases, the lightness L* of kyanites decreases. In the UV–Vis spectrum, the lightness L* of natural samples is significantly related to the wavelength corresponding to the first peak in the orange-red region, and the absorption band at 600 nm also influences the hue angle .

1. Introduction

Kyanite is one of the anhydrous minerals of significant geological interest [1]. Deep blue kyanites, which exhibit excellent optical quality and sometimes form large, attractive crystals, are often used to imitate blue sapphires [2]. Kyanite is an insular aluminosilicate mineral with the chemical composition of Al2[SiO4]O, in which Al ions are coordinated in a hexagonal arrangement, commonly denoted as AlVIAVI[SiO4]O. Kyanite crystallizes in the triclinic crystal system, which can be approximated to a cubic, closest-packing arrangement based on oxygen [3]. Within the molecule, all silicon atoms are tetrahedrally coordinated, while aluminum atoms are hexagonally coordinated, forming the [AlO6] octahedron [4].
A long-standing debate has centered on the chromogenic mechanism of kyanite, with two prevailing theories currently dominating the discussion. Al3+ ions, located outside the tetrahedral [SiO4] framework, occupy the octahedral voids, forming four non-equivalent octahedral sites. Because different impurity elements occupy these sites through isomorphic substitution, kyanite exhibits a range of colors, including blue, green, orange, and brown [5]. Robbins and Manfred propose that the blue coloration of kyanite arises from Fe occupying the octahedral void in the tetrahedral skeleton of [SiO4] in the form of isomorphism, leading to an electron transition between Fe2+ and Fe3+, thereby causing the crystal to absorb the red region of the visible light spectrum, which imparts the mineral with a dark blue hue [5]. On the other hand, Platonov and Pradat suggest that the blue coloration of kyanite is due to charge transfer transitions between adjacent Fe2+ and Ti4+ ions within the lattice [6,7]. As research progresses, a variety of opinions have emerged, including the notion that electronic transitions involving Cr3+ may render kyanite a blue-green color [5,7].
In recent years, the rapid advancement of gemstone colorimetry has enabled researchers to conduct quantitative characterization and non-destructive quality assessments. Currently, gemstone colorimetry is applied in the transparency analysis, color grading, and synthetic identification of gemstones, including tanzanite [8], jade [9], and sapphire [10], thereby demonstrating its feasibility and theoretical research potential.
In this study, a batch of blue kyanite samples (30) from Barra do Salinas District, Coronel Murta, Minas Gerais, Brazil, were used as research objects. Based on gemological colorimetry, we combined the spectroscopic characteristics with the elemental composition of kyanite to elucidate the chromogenic mechanism of blue kyanite from Brazil in detail. Additionally, the CIE 1976 L*a*b* uniform color space, recommended by the International Lighting Commission (ILC) [11], effectively characterizes the colorimetric properties of blue kyanite.

2. Materials and Methods
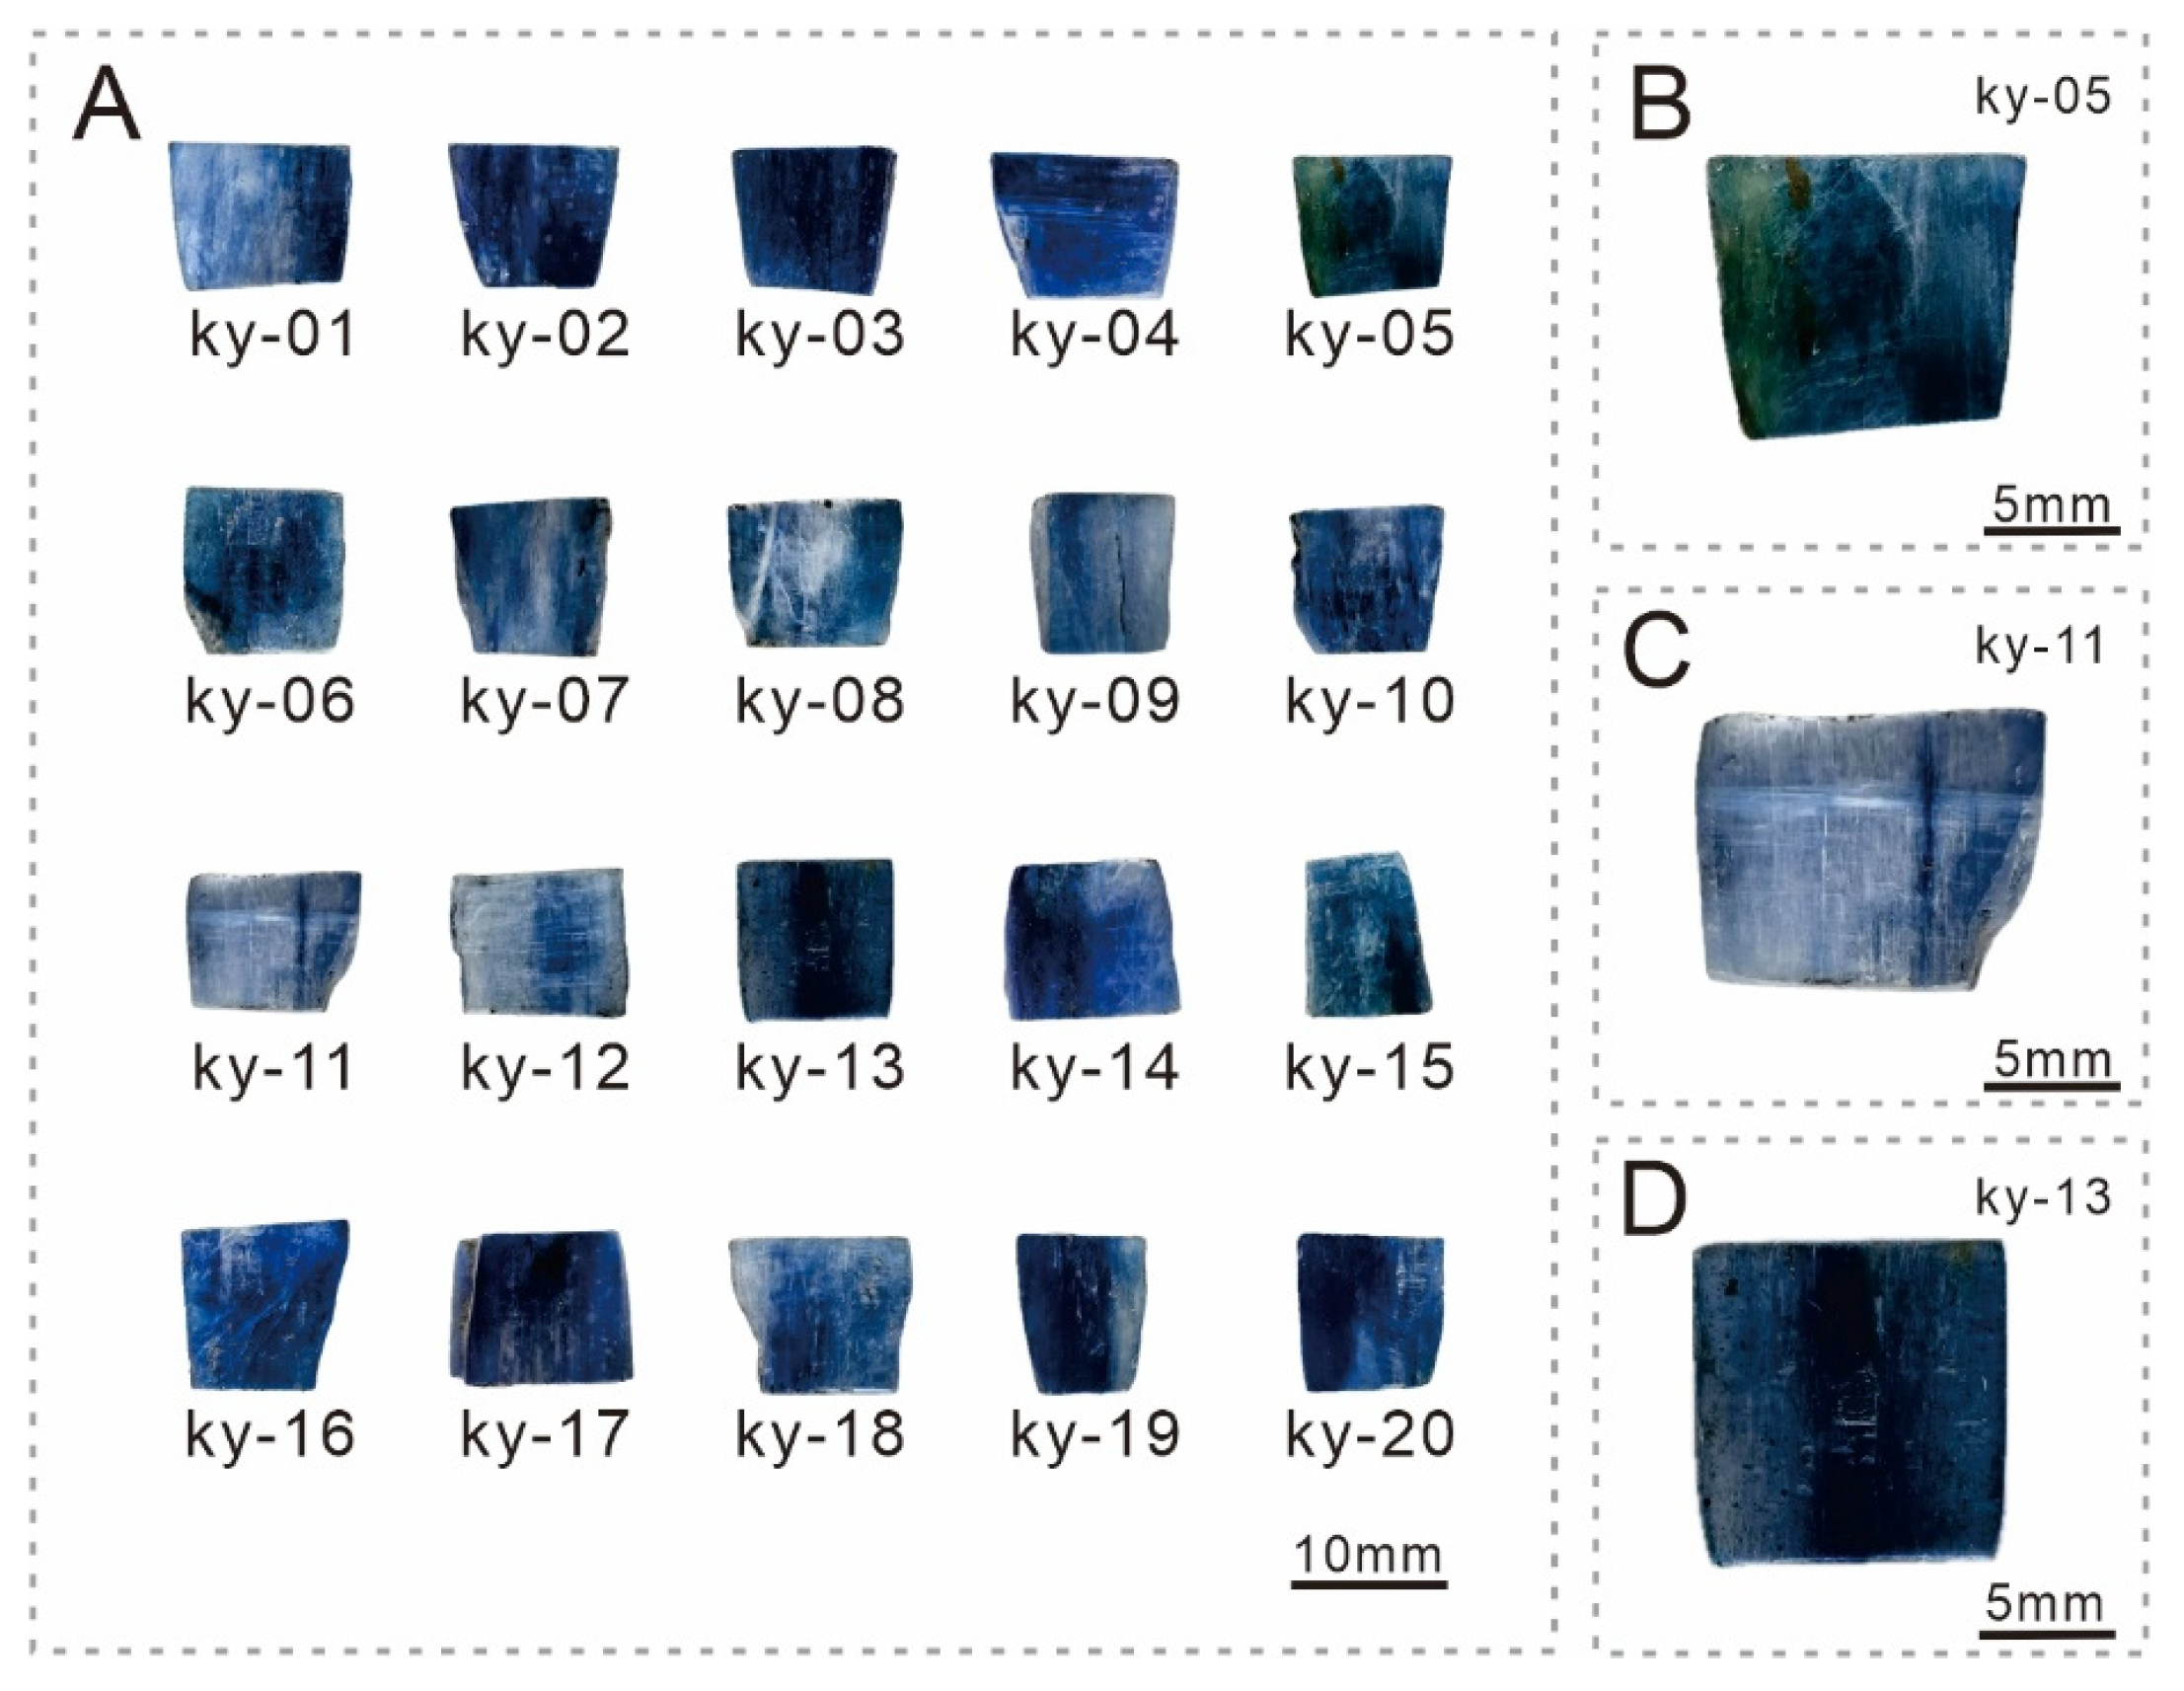
2.1. Samples

In this study, thirty blue kyanite samples from Brazil were analyzed. Each sample was cut along the c-axis and fashioned into a square shape measuring approximately 9.0 mm × 9.0 mm with a uniform thickness of 2.0 mm. Then, each sample was polished on one facet to achieve a flat and smooth surface. Only 20 natural samples (numbered Ky-01 to Ky-20) exhibiting uniform coloration and bright color were chosen for further compositional and colorimetric analysis. Figure 1 shows the natural sample illuminated under a D65 light source.

2.2. X-Rite SP62

A portable X-Rite SP62 color spectrophotometer (X-Rite, Grand Rapids, MI, USA) was utilized to determine the color parameters of natural blue kyanite. Measurements were taken at uniform and clean locations in the center of the polished surface of the sample, with the final color values derived from the average of three repeated tests. The test conditions can be summarized as follows: reflection mode (excluding specular reflection); CIE standard illumination, D65 (6504 K) light source; background, N9.25 Munsell Neutral Gray background; observer view, 10°; spectral wavelength spacing, 10 nm; measurement range, 400~700 nm.

2.3. CIE 1976 L*a*b* Uniform Color Space

The CIE 1976 L*a*b* uniform color space is a three-dimensional system, which is composed of the colorimetric coordinates a* and b* and a lightness L*. The axe L* is used to represent the brightness of the color, with a value range of 0 to 100, indicating pure black to pure white. The color coordinate a* indicates the degree of redness or greenness, and its value range is (−128, 127). Color coordinate b* represents the degree of yellow and blue, with a value range of (−128, 127). In addition, this system includes two additional chromaticity parameters: Chroma C* and hue angle . Chroma C* indicates the variation in saturation of individual colors, with higher values corresponding to brighter and more intense colors. The hue angle is often used to describe the hue of the color, with values ranging from 0° to 360°. Chroma C* and the hue angle can be calculated from a* and b* as follows:
C * = a * 2 + b * 2
h ° = arctan   b * a *

2.4. X-Ray Fluorescence Spectrometer

An EDX-7000 energy dispersive X-ray fluorescence spectrometer (SHIMADZU, Kyoto, Japan) was selected to measure the chemical composition of the kyanite. The primary operating parameters were set as follows: atmosphere, vacuum; voltage, 50 kV; detector, Si (Li); collimator, 5 mm; all the measurement results were converted to their corresponding elemental forms using standard conversion factors.

2.5. UV–Vis Spectrum

A Gem-3000 fiber optic spectrometer (Biaoqi Optoelectronics Technology Development Co., Ltd., Guangzhou, China) was used to indicate the UV–Vis absorption spectra of kyanite. The measurement parameters included the following: transmission method; wavelength range, 400–1000 nm; integral time, 170 s; average scan turns, 8; boxcar width, 2; scanning speed, medium; scanning mode, single.

2.6. Fourier-Transform Infrared Spectroscopy

A Bruker Tensor 27 Fourier-transform infrared spectrometer (BRUKER, Billerica, MA, USA) was employed to obtain the infrared spectra (IR) of the kyanite samples. The measurement parameters were as follows: reflection method; resolution, 4 cm−1; scanning time, 50–100; wavelength range, 400–2000 cm−1.

3. Results

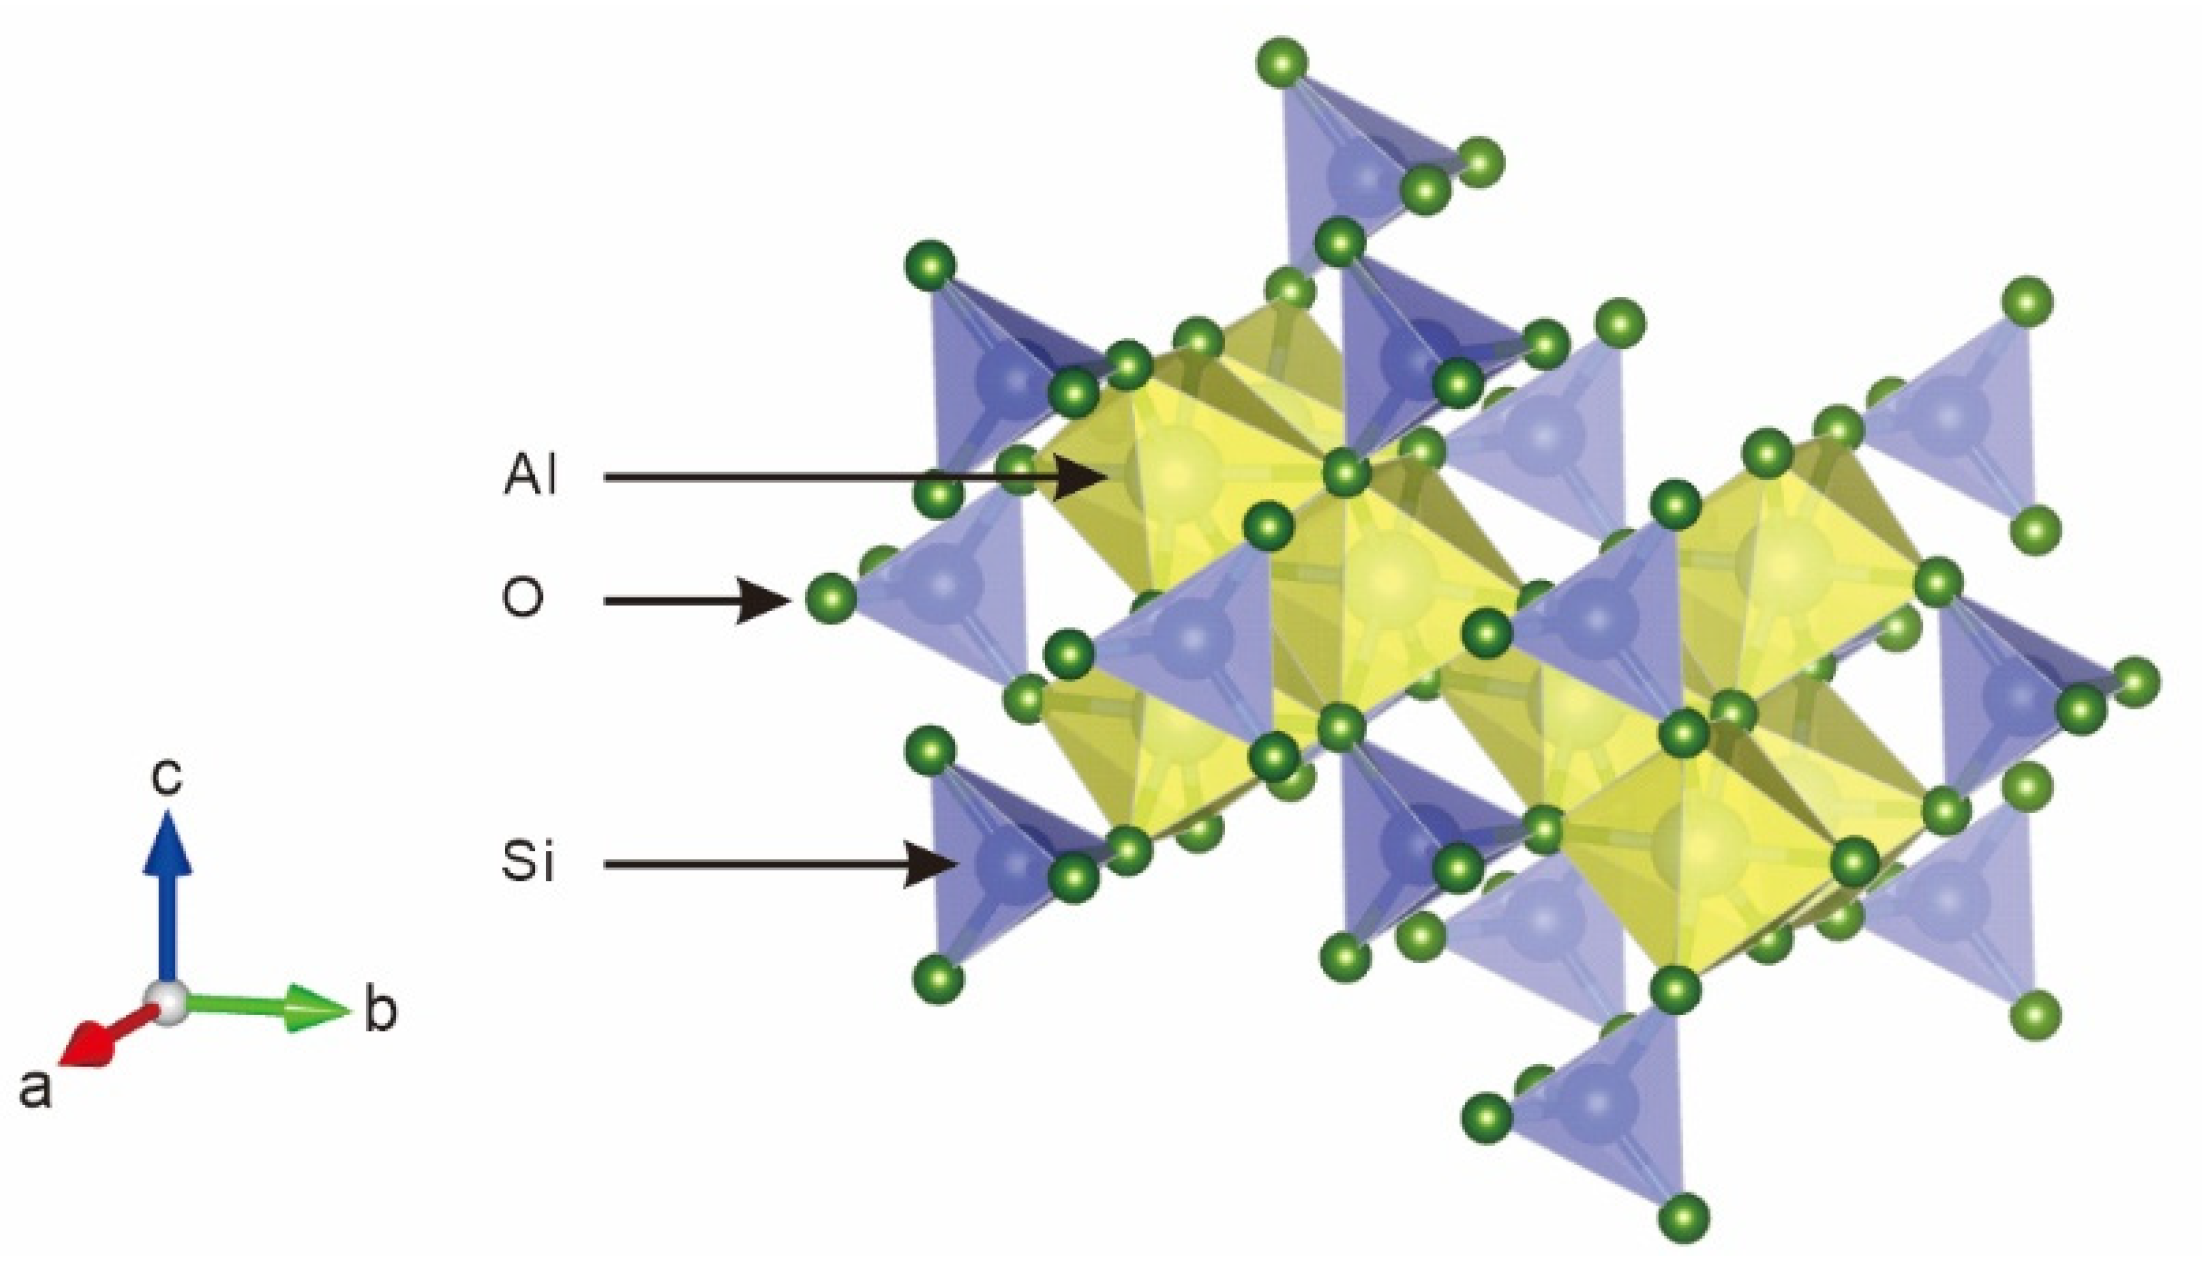
3.1. Gemological Characteristics
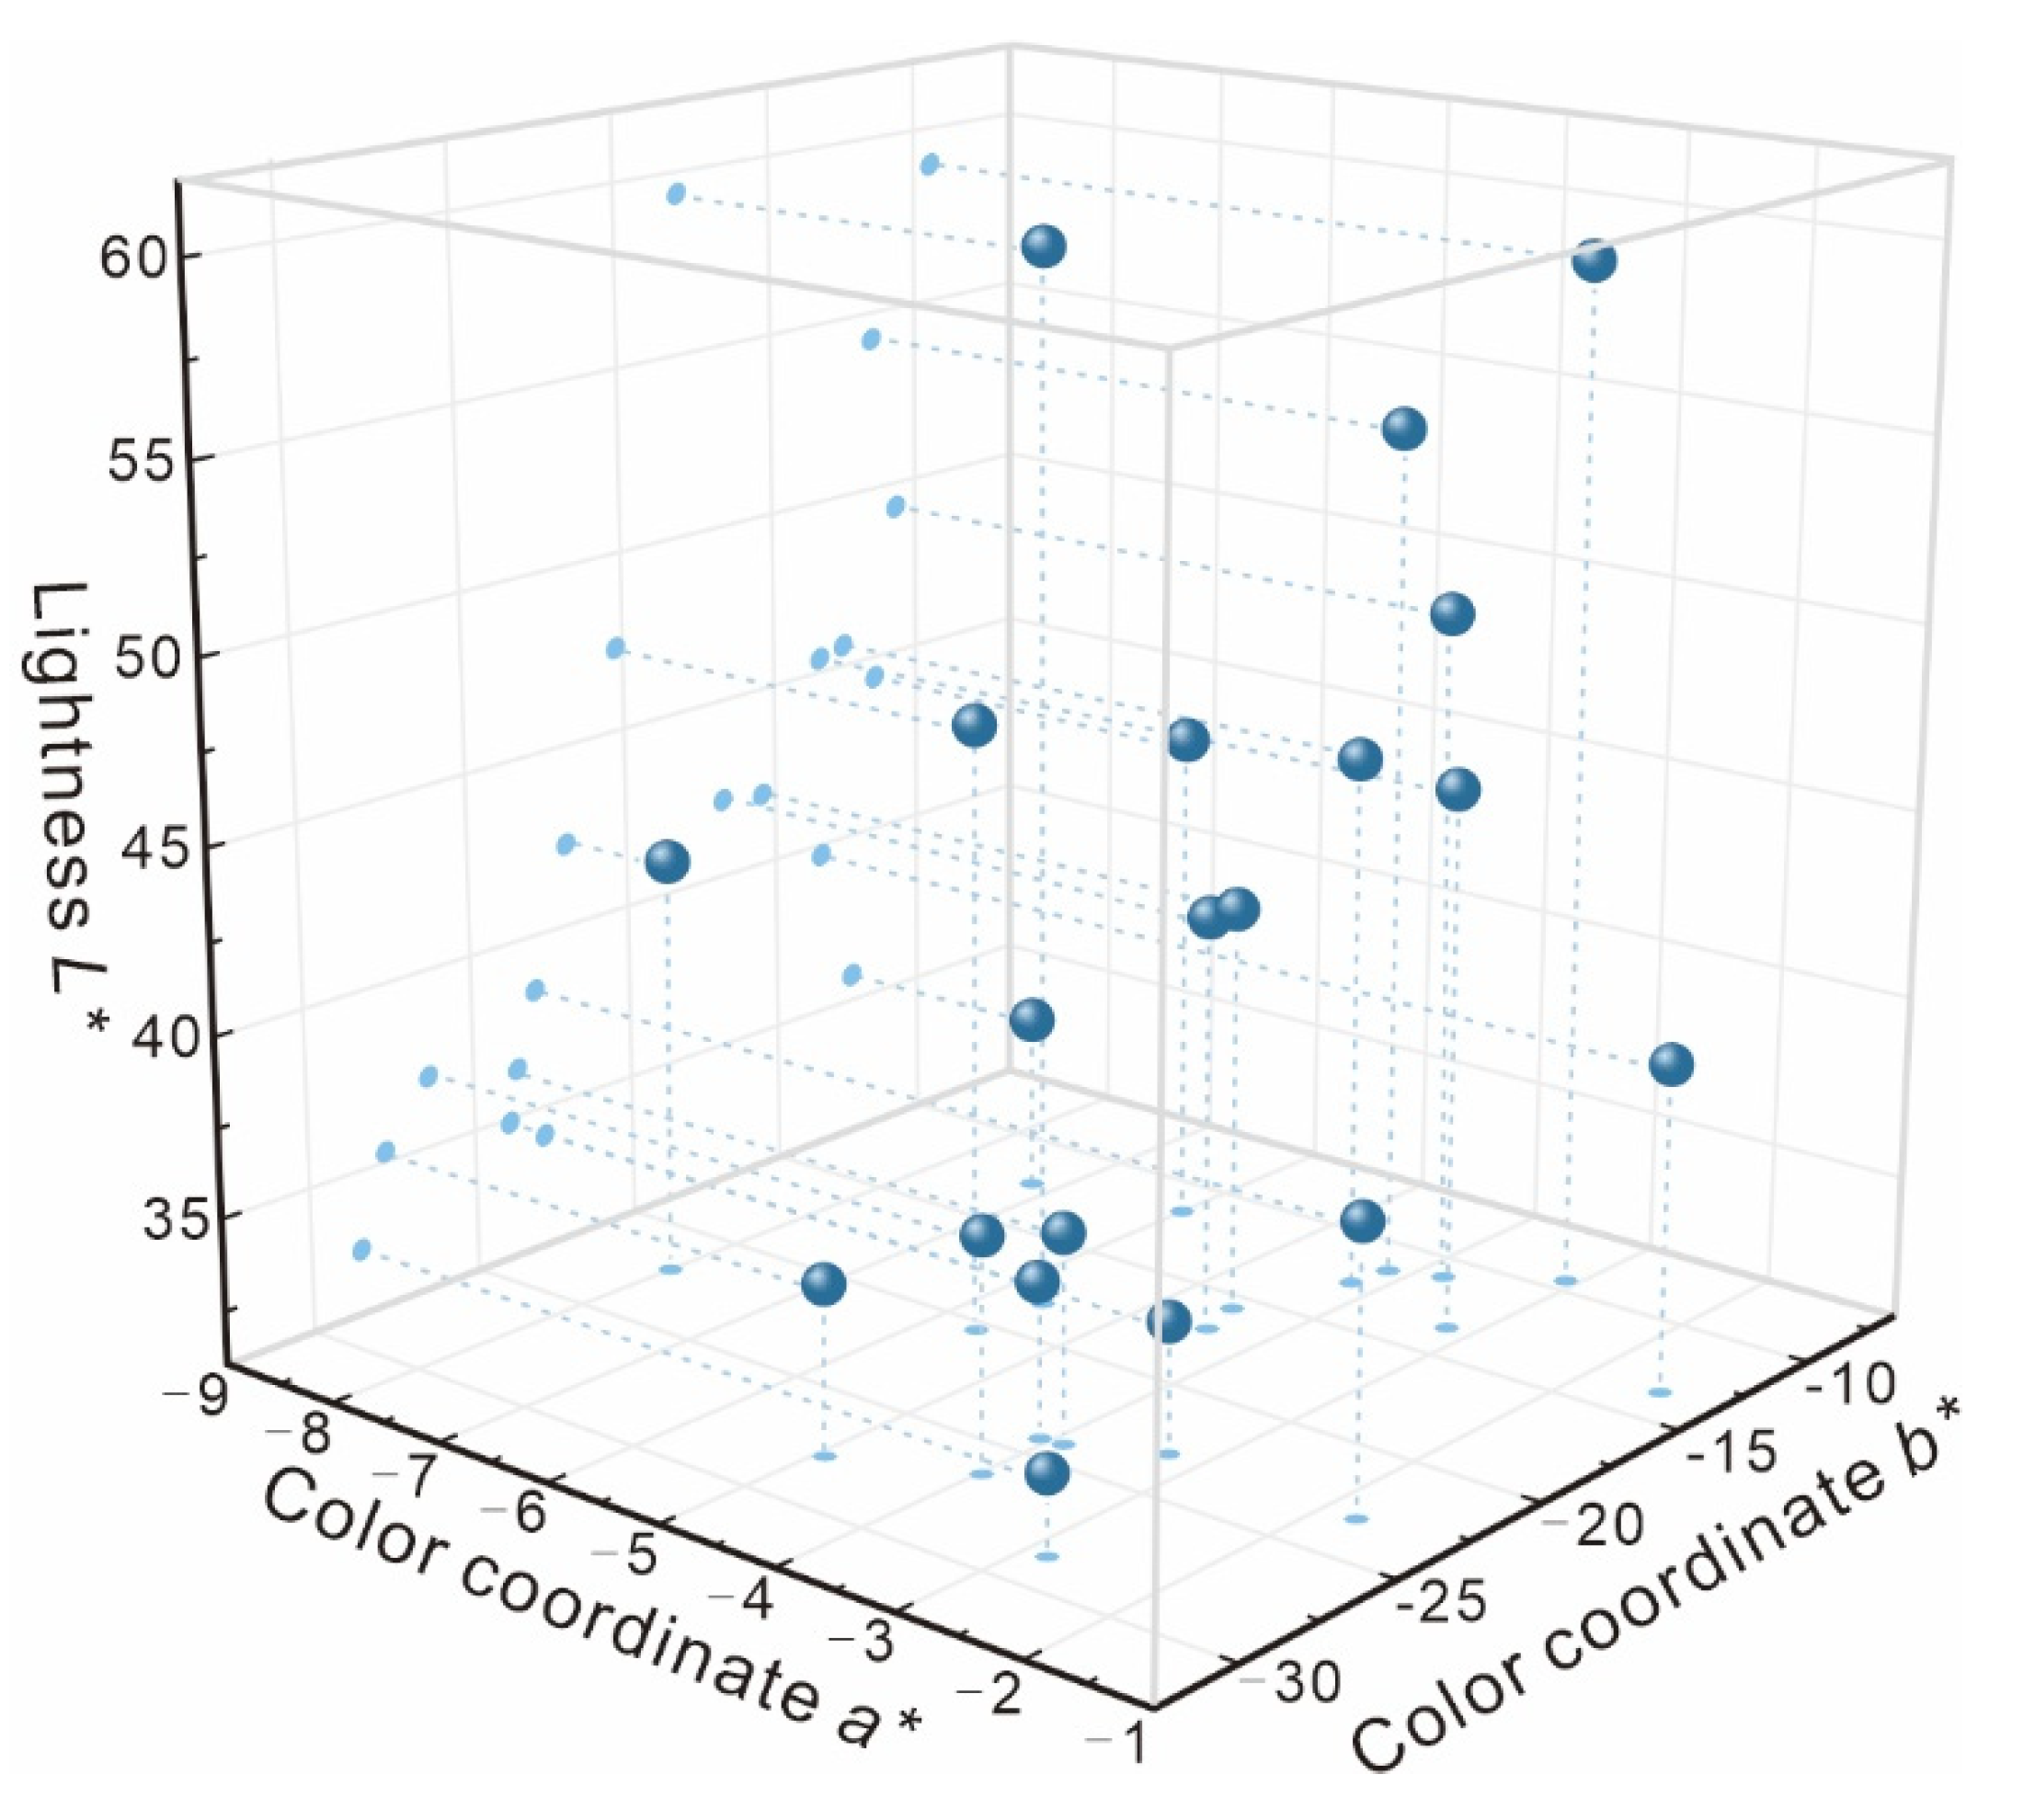
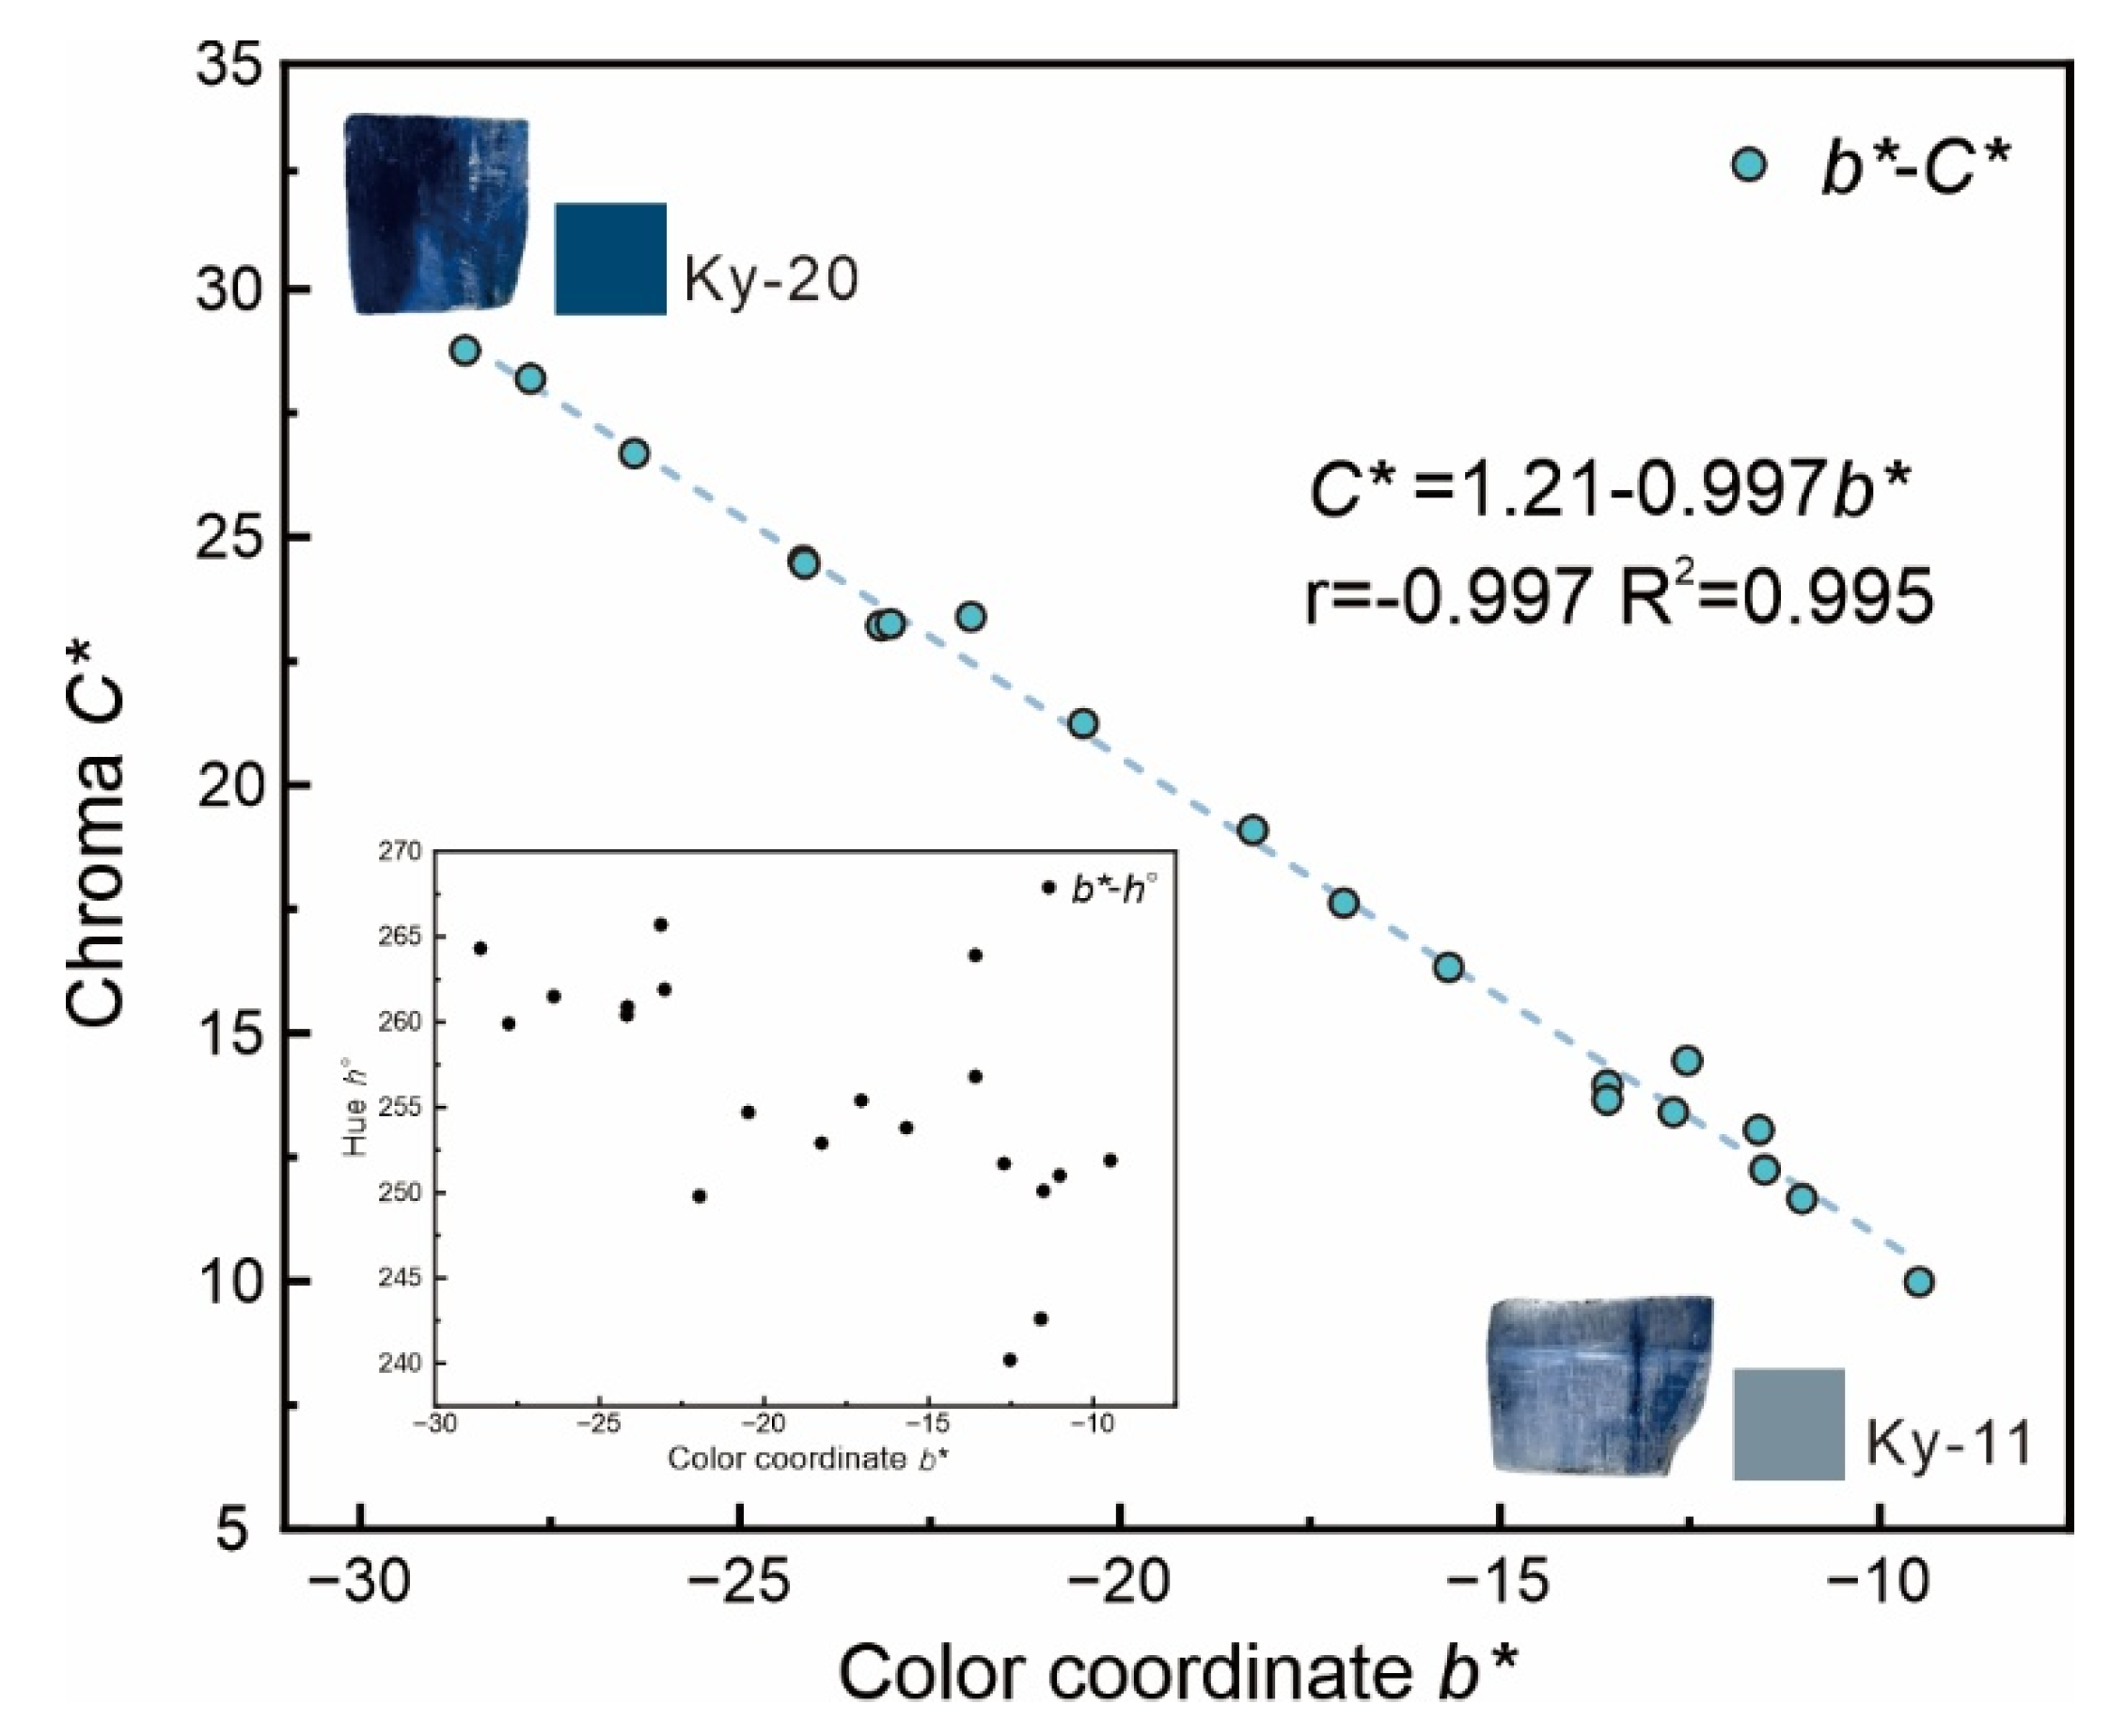
The gemological properties of natural blue kyanite are detailed in Table 1. All natural samples, sourced from the Barra do Salinas District, Coronel Murta, Minas Gerais, Brazil, exhibited a predominantly bright, glassy luster. The intensity of the blue color in kyanite ranged from light to strong, and the transparency varied from translucent to opaque. The weight of the samples ranged from 3.26 to 6.02 carats, and the specific gravity (SG) varied between 3.62 and 3.70 g/cm3. The refractive index (RI) of the natural samples fell within the range of 1.706 to 1.732, and the birefringence values ranged from 0.012 to 0.016. And all samples were negative crystals. There are few inclusions in natural samples, and the types of inclusions are simple. Very small subhedral inclusions and small, ball-shaped inclusions formed by pigmentation were observed in only a few samples. Most samples were non-fluorescent under the UV lamp.
It can be observed that the natural samples exhibit a uniform band of dark blue or light blue parallel to the c-axis (Figure 2a), with pronounced intensity in the key-13 sample, suggesting that the original crystal habit of kyanite is likely to be plate-like or columnar. Some samples, such as key-05 (Figure 2b), contain granular, dark brown matrix minerals that exhibit a silky sheen in reflected light and are thus classified as mica deposits [12]. Certain samples exhibit fractures along the c-axis direction, with elements accumulated within these fractures, leading to localized pigmentation and darkening of the overall hue of kyanite at these fractures (Figure 2c). Furthermore, the majority of natural samples exhibit two sets of perpendicular cleavage: one with complete cleavage along the {100} plane and the other with moderately complete cleavage along the {010} plane. These cleavages exhibit a distinct stepped pattern, which significantly influences the transparency of the samples (Figure 2d).

3.2. Color Analysis

Using the CIE 1976 L*a*b* color system, we employed a portable X-Rite SP62 spectrophotometer under D65 illumination with a Munsell N9.25 background to measure the color parameters of 20 natural blue kyanite samples. In this study, the color parameters of each sample were measured with the polished surface facing upward, and the final values were obtained by averaging three measurements (Table S1).
The results show that the color range of natural kyanite is characterized by the following parameters: lightness L* ∈ (33.1~59.6), colorimetric coordinates a* ∈ (−8.06~−1.45), colorimetric coordinates b* ∈ (−28.62~−9.48), chroma C* ∈ (9.98~28.76), and hue angle ∈ (240.2~265.7). And the measured color values align well with the visual characteristics of the natural specimens.
To better visualize the general color distribution across the samples, the three-dimensional color data for the 20 samples were plotted as a scatter diagram in three-dimensional space, as shown in Figure 3, where the X-, Y-, and Z-axes represent a*, b*, and L*, respectively. The scatter plot indicates that the natural samples exhibit high lightness and have a blue hue.
Having determined the color parameters of the samples, the relationships among color coordinates, chroma, and hue angle in the 20 samples were examined using bivariate correlation analysis. The Pearson correlation coefficient (r) was employed to evaluate the strength of the relationship between two variables [13]. The values of r range from −1 to 1, with positive values indicating positive correlations and negative values indicating negative correlations. A higher absolute value of r indicates a stronger correlation. R2, or the coefficient of determination, indicates the goodness of fit, measuring how well the regression line aligns with the data. The closer the R2 value is to 1, the better the fit between the regression line and the data points [14].
A correlation analysis was performed on the color parameters of twenty natural kyanite samples, revealing no significant relationship between the colorimetric coordinates a* and b*, or with the hue angle . This suggests that the colorimetric coordinates a* and b* are not the primary factors influencing the hue angle of natural kyanite samples. Moreover, a strong negative correlation was observed between the colorimetric coordinate b* and its chroma C*, with a Pearson correlation coefficient r of −0.997. Curve fitting the relationship between the colorimetric coordinate b* and its chroma C* yielded a coefficient of determination R2 of 0.995, as depicted in Figure 4.
The color coordinate b* of natural kyanite samples is predominantly negative, indicating a blue hue. The chroma C* decreases nearly linearly with an increase in the color coordinate b*, suggesting that the blue hue is a primary determinant of kyanite’s chroma. However, the correlation between the chromaticity coordinate a* and chroma C* is weaker than the correlation between the chromaticity coordinate b* and chroma C*, indicating the chroma of kyanite is predominantly influenced by b*.

3.3. Chemical Analysis

ED-XRF is widely employed in gemology for the rapid and non-destructive determination of most elements in minerals and rocks [15], enabling qualitative and semi-quantitative elemental analysis of gemstones with complex compositions, such as kyanite. XRF analysis was performed on the polished surfaces of 20 natural kyanite samples, with the selected areas consistent with those described in the preceding section.
The original data of the samples indicate that the main components of the samples are SiO2 and Al2O3, with a total content ranging from 96.465 wt% to 99.610 wt%, SiO2 from 34.309 wt% to 38.792 wt%, and Al2O3 from 59.091 wt% to 63.123 wt% (Table S1). Unless otherwise specified, all percentage values mentioned hereafter refer to weight percentages (wt%). The ratio of Al2O3 to SiO2 ranges from 1.593 to 1.811, which aligns with theoretical values [16]. Other detected elements include w (S)% ∈ (0.288, 1.287), w (V)% ∈ (0.008, 0.012), w (Fe)% ∈ (0.060, 0.222), w (Cr)% ∈ (0.006, 0.131), and w (Ti)% ∈ (0.005, 0.042). The experimental data were initially reported as oxides for conventional representation, but for consistency with the discussion of color centers, the oxide values were converted to their corresponding elemental forms using standard conversion factors, as seen in Table 2. Based on the chemical composition analysis, it is evident that only a limited number of impurities enter the kyanite enter the crystal structure, and its composition is relatively pure.
As shown in Figure 5, the divalent oxygen ions in kyanite are densely packed in a cubic arrangement in three-dimensional space, forming tetrahedral and octahedral voids [3]. Aluminum (Al) occupies 2/5 of the octahedral sites, while silicon (Si) occupies 1/10 of the tetrahedral sites. In an ideal cubic, close-packed structure, Al3+ ions, located outside the tetrahedral [SiO4] framework, occupy the octahedral voids, forming four distinct sites (labeled as Al1, Al2, Al3, and Al4 in Figure 6) [5]. Due to the occupation of various octahedral sites by different impurity elements like Fe and Ti through isomorphic substitution, kyanite demonstrates a variety of colors.
Given that the Fe content in natural kyanite samples is the highest among trace elements, it is hypothesized that Fe contributes significantly to kyanite’s blue color. Owing to the isomorphous substitution in kyanite, Fe can replace Al at the cation site, thereby altering the chemical composition of kyanite [16]. Moreover, given that iron is the most abundant transition metal ion in the Earth’s crust, it is almost invariably present in the parent medium during the crystallization of natural kyanite [17]. Consequently, iron is the principal chromogenic impurity in natural kyanite and in many other minerals, often imparting a blue or green hue due to its oxidation states (Fe2⁺ and Fe3⁺) and their interactions within the crystal lattice [18].
Previous studies have shown that Fe3+ ions are more readily incorporated into the kyanite lattice under conditions of high oxygen fugacity and temperature [19], leading to a significant increase in the iron content within kyanite and enhancing the propensity for Fe3+ to replace Al3+ in octahedral sites.
Additionally, temperature fluctuations and variable external environmental conditions during the crystallization of kyanite enable other trace elements with properties similar to Al [20], such as titanium (Ti) and chromium (Cr), which have the same ion type or similar radii, to occupy portions of the octahedral sites within the kyanite crystal structure, thereby substituting for Al3+ ions. As we have observed, trace elements like Ti and Cr were detected in kyanite; thus, the possibility of charge transfer between Ti4+ and Fe2+, as well as the influence of Cr3+ on the blue color of kyanite, cannot be discounted [21].

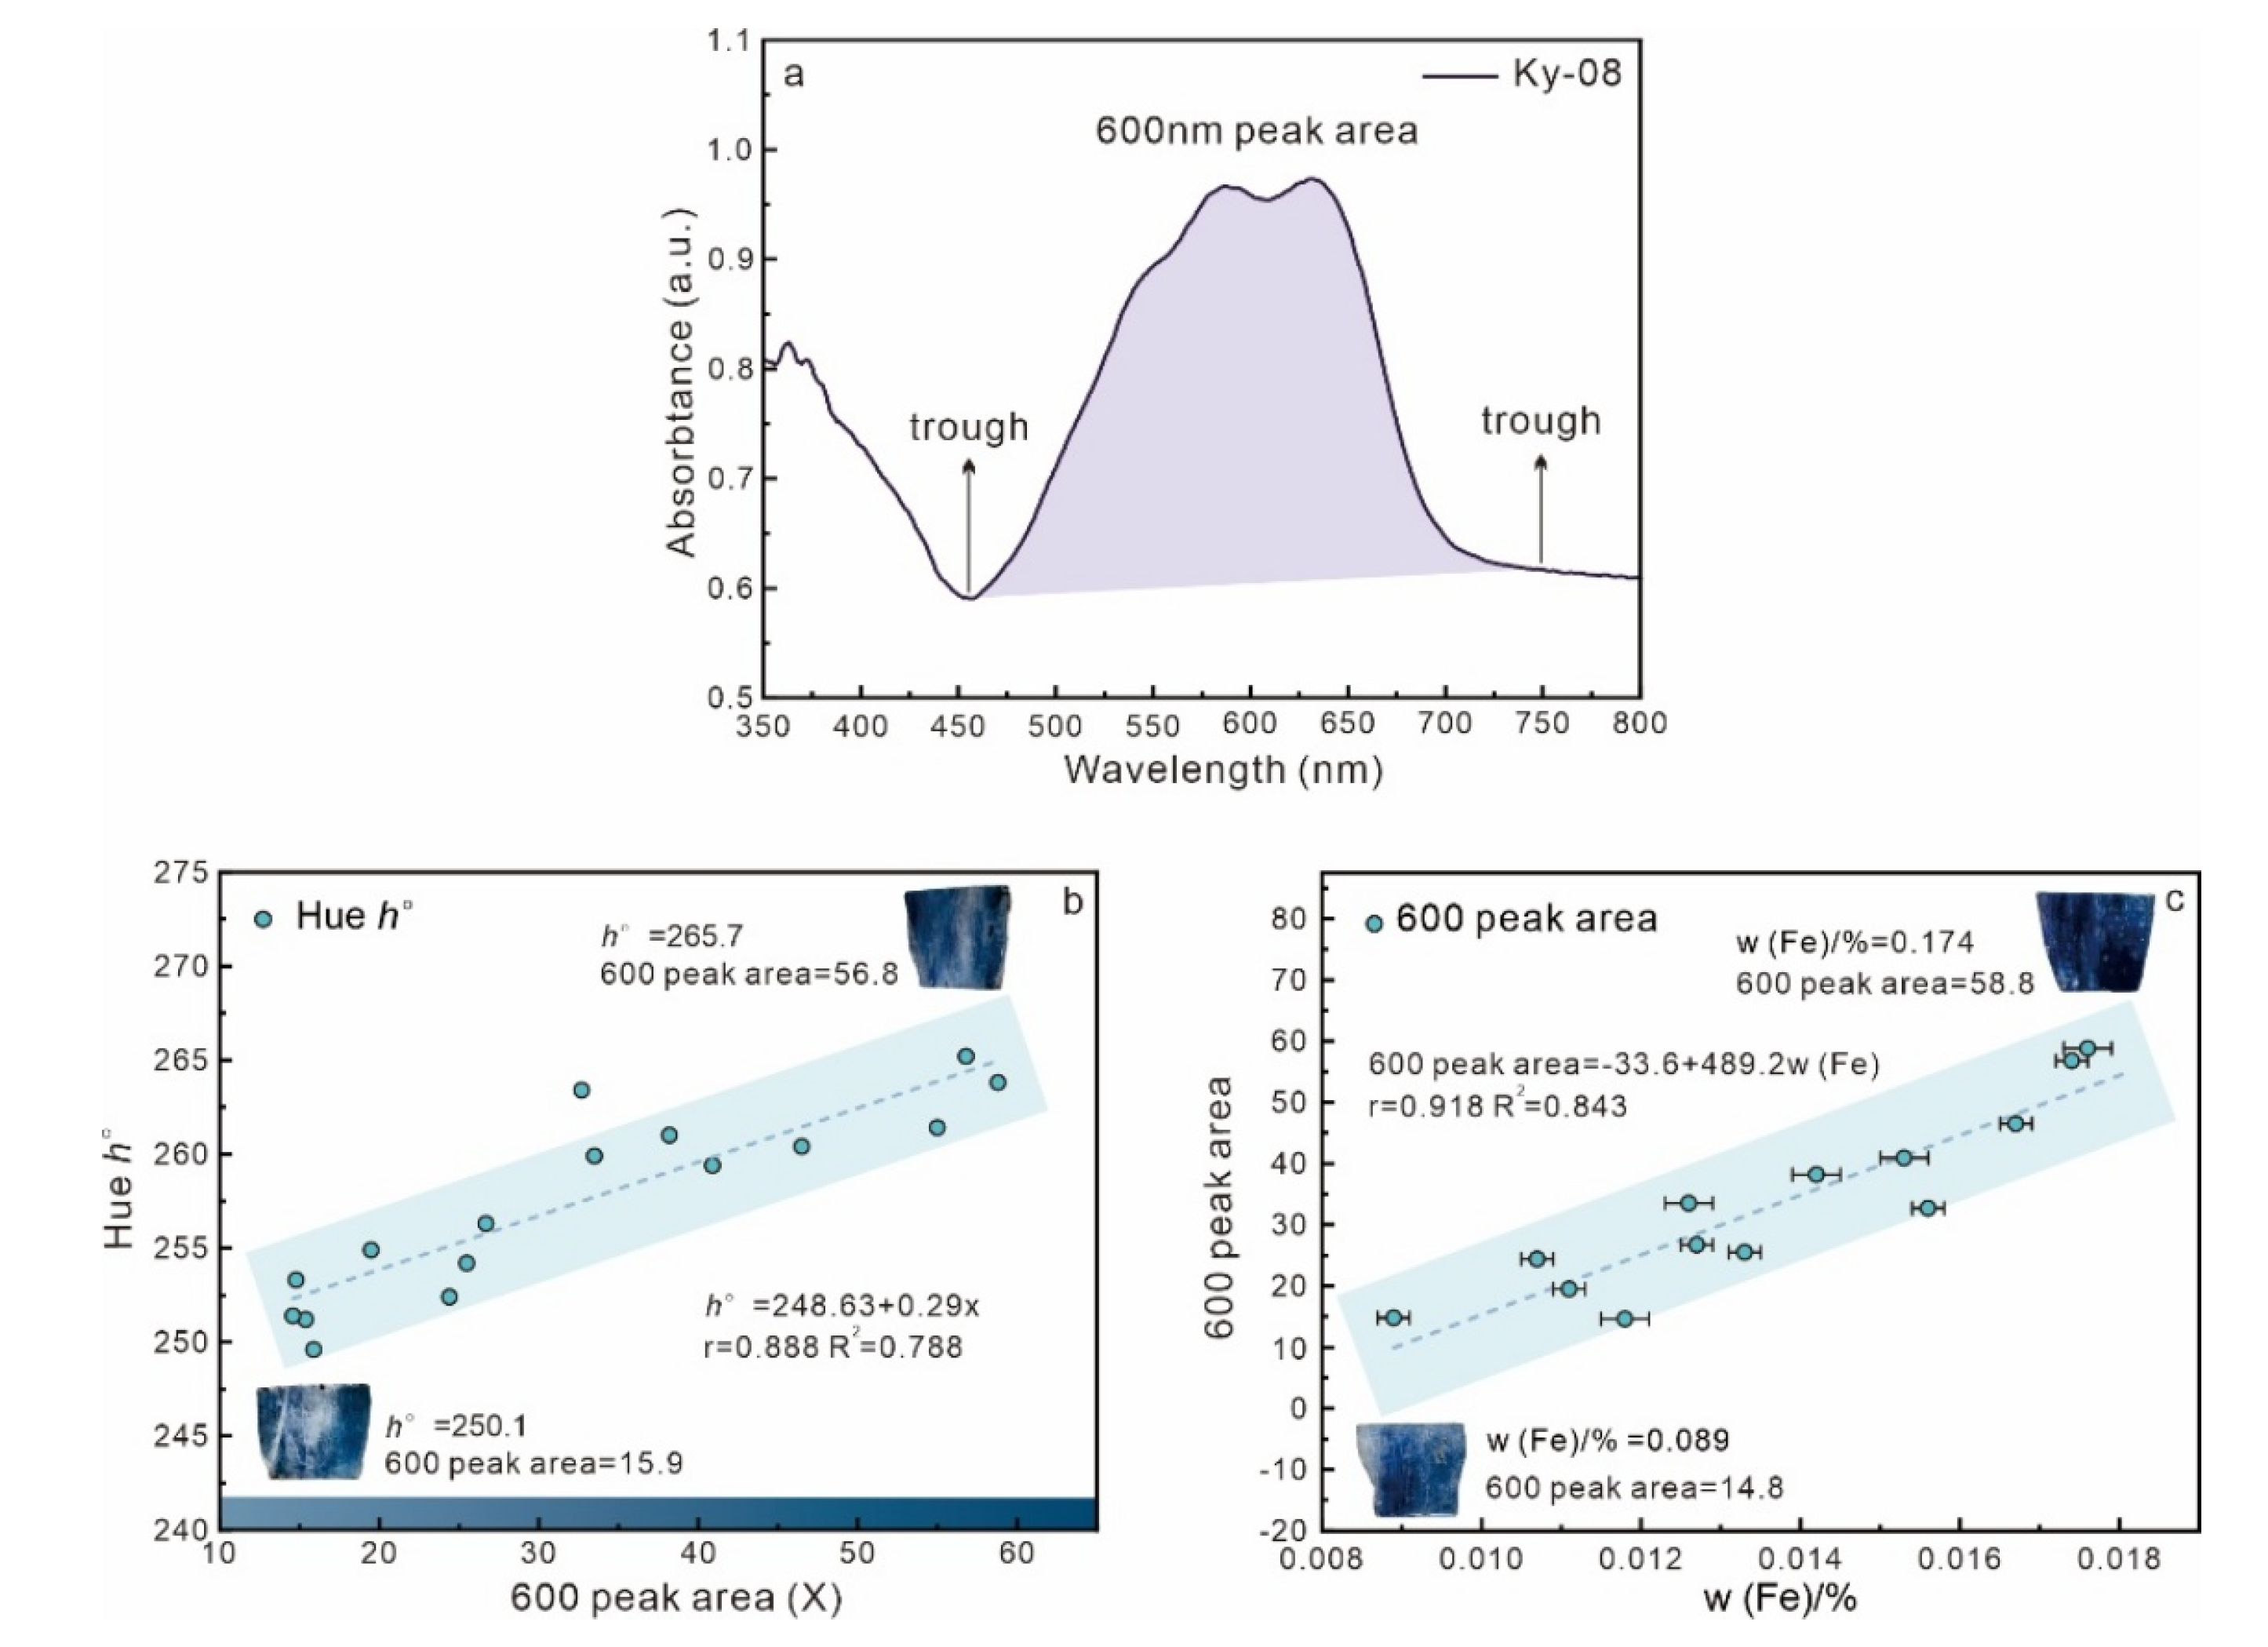
3.4. UV–Vis Spectrum Analysis

To further investigate the influence of transition metal elements on the body color of natural blue kyanite samples, UV–visible spectroscopy was conducted on all samples. This analysis examined the characteristic absorption features of various transition metal ions within the UV–Vis spectra using the transmission method to determine the impact of these ions on the color of kyanite. The UV–Vis absorption spectral bands for the kyanite samples spanned from 350 to 800 nm.
The UV–visible absorption spectrum of natural kyanite, as illustrated in Figure 7, demonstrates multiple absorption regions within the range of 350–800 nm: Within the range of 350 to 400 nm, distinct absorption peaks are observed at 365 nm, 375 nm, and 395 nm, varying in intensity. Additionally, two prominent absorption bands centered at 590 nm and 630 nm are present in the range of 580 to 660 nm. Furthermore, the intensity of these broad bands increases progressively with the deepening color of the kyanite samples. It is worth noting that some samples exhibit two strong absorption peaks in the orange-red region, at wavelengths of 600 nm and 650 nm, which are higher than those observed in most samples. These samples are characterized by lower titanium content and a lighter body color. Therefore, we hypothesize that this phenomenon is related to the titanium concentration, which has a significant impact on the body color of kyanite.
As the most abundant trace element in kyanite, Fe occurs in various forms, including as isolated Fe3+ ions, Fe3+-Fe3+ coupled ion pairs, and via Fe3+-Fe2+ charge transfer [22]. According to crystal field theory [23], the absorption peaks at 375 nm and 395 nm may be attributed to the d-d orbital spin-forbidden transition of isolated Fe3+ within the octahedral field (6A14E and 6A14T2) [24,25]. These peaks, situated in the purple-blue region of the spectrum, absorb a portion of the purple-blue light in the visible range, thereby imparting a yellowish hue to kyanite [26]. While previous studies have demonstrated the presence of Fe3+-Fe3+ coupled ion pairs in kyanite, particularly in samples with high iron content. Many researchers like Nikolskaya and Maisch proposed that the transition of these coupled ion pairs is the fundamental cause of the yellow coloration in kyanite. They argue that the absorption peaks at 375 nm and 395 nm in the absorption spectrum of kyanite are due to the Fe3+-Fe3+ ion pair transitions, rather than isolated Fe3⁺ transitions [27]. However, the absorption intensity and half-width of the UV–Vis absorption spectrum observed at 600 nm in this experiment are significantly larger; thus, it can be speculated that the absorption peaks at 395 nm and 375 nm have negligible effects on the sample’s body color.
According to research findings, the absorption peaks near 590 nm and 630 nm were found to exhibit similar properties, and both arise from a spin-allowed crystal field (CF) transition of Ti3+ (2T22E) [23]. When Fe2+ and Ti4+ ions are situated in two octahedral sites sharing a common face (similar to Al1 and Al2 in Figure 6), the d orbitals of these ions overlap with the optical axis, and upon photoexcitation, the Fe2+-Ti4+ pair undergo charge transfer, resulting in the transformation Fe2+ + Ti4+→Fe3+ + Ti3+ [28]. Simultaneously with this process, a broad absorption band centered at approximately 590 nm is formed, appearing blue in color when viewed perpendicular to the optical axis of kyanite [29]. Furthermore, when Fe2+ and Ti4+ ions are located in two octahedral sites sharing a common prism (similar to Al2 and Al3, or Al3 and Al4 in Figure 6), a wide absorption band centered around 630 nm is generated, stemming from the variable absorption energies of the visible spectrum, which imparts a blue-green color to the samples [29].
In addition to the electronic transition between Fe2+ and Ti4+, there is an electronic transition between Fe2+ and Fe3+ [30]. Both forms of electronic transitions mentioned above occur within the kyanite crystal, and the selection rule ΔS = 0 is applicable to the pair in both cases [31]. In the kyanite structure, Fe2+ and Fe3+ can both substitute for Al3+ through isomorphic substitution. When adjacent octahedral centers are occupied by Fe2+ and Fe3+, their 3d orbitals overlap, facilitating charge transfer between Fe2+ and Fe3+. When the crystal absorbs visible light and subsequently gains energy, an electron within the lattice undergoes a specific transition from Fe2+ to Ti4+ and back to Fe3+, and the essence of this process is F e a 2 + + F e   b 3 +   +E(energy)→ F e b 2 + + F e a 3 + [32]. Researchers such as Fritsch and Rossman have concluded that the charge transfer absorption peak energy of Fe2+-Fe3+ is reflected in the broad absorption band of kyanite from 580 nm to 660 nm. And this band is likely associated with the 6A14T1 (G) or 6A14T2 (G) transitions of Fe3+ [33].

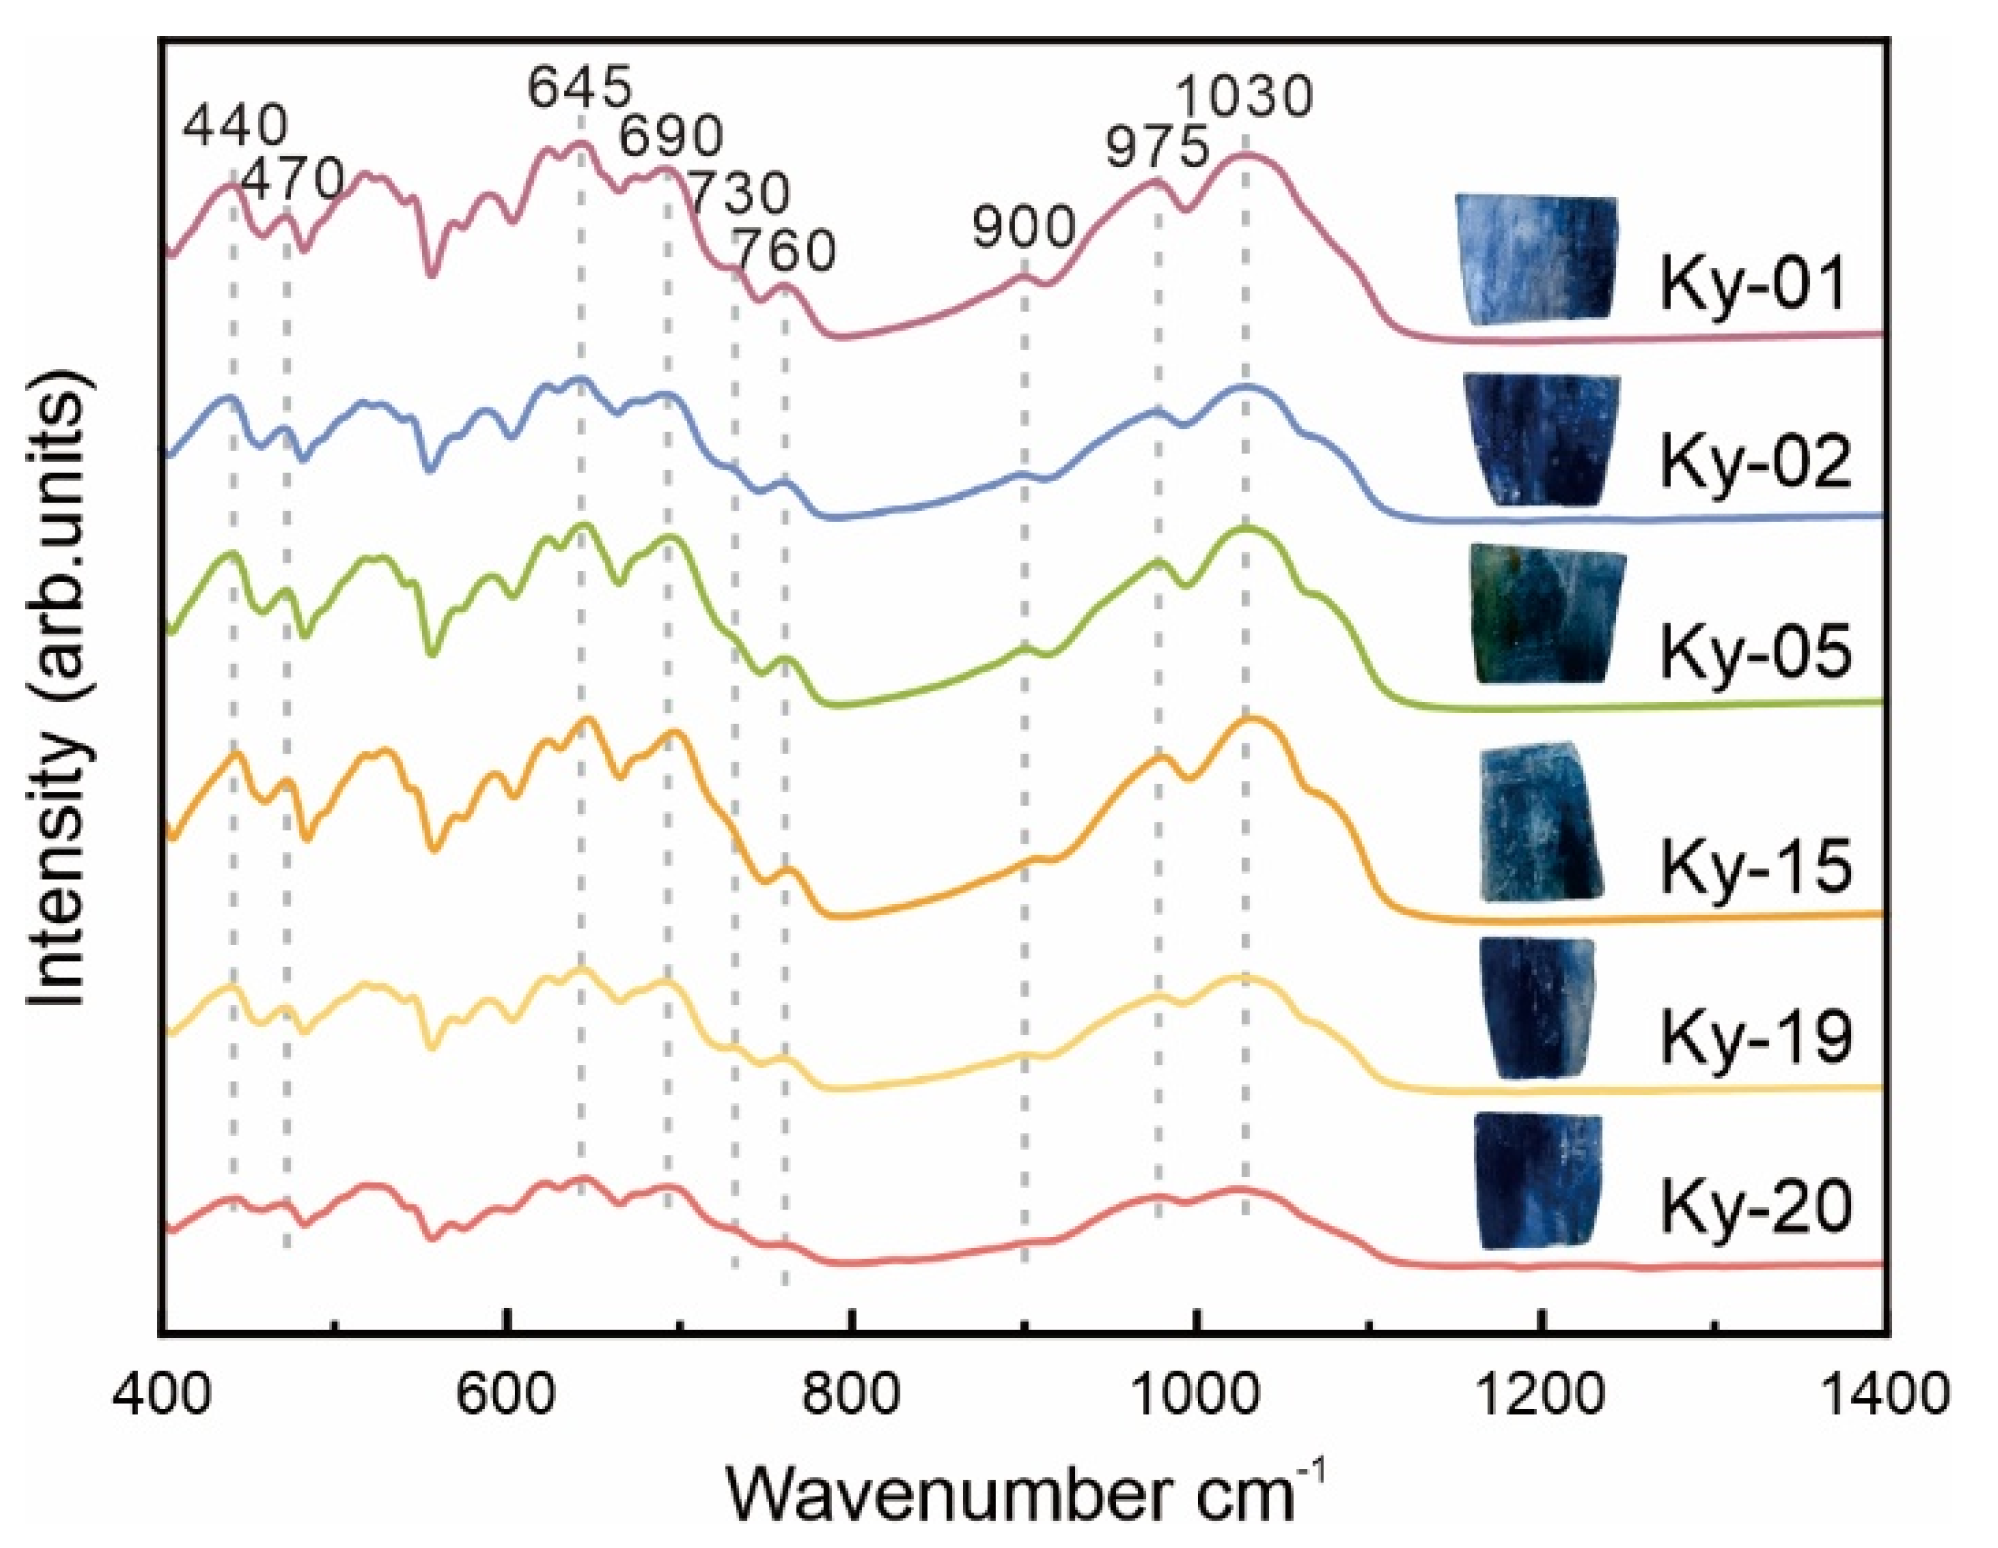
3.5. Infrared Spectral

The infrared spectrometer is one of the most commonly used and effective instruments for the identification of gemstones [14]. In this experiment, the infrared reflectance spectrum was measured in the 400 to 2000 cm−1 range, commonly referred to as the fingerprint region, which is characterized by the stretching and bending vibrations within the kyanite structure.
To explore the vibrational characteristics of functional groups in kyanite and explore the relationship between its crystal structure and body color, twenty natural kyanite specimens were analyzed via infrared spectroscopy along the c-axis direction. The infrared spectra of these samples exhibit a main peak position in the fingerprint region consistent with typical blue kyanite, which is indicative of molecular structures characteristic of nesosilicates [5]. As depicted in Figure 8, the absorptions in the fingerprint region are primarily in the range of 400–1200 cm−1.
The infrared spectroscopy reveals that vibrations below or around 400 cm−1 generally correspond to the vibrations of metal cations. Weak absorptions at 440 cm−1 and 470 cm−1, which are close to the frequencies associated with the [FeO6] and [MgO6] coordination polyhedrons, are observed in natural blue kyanite samples, suggesting a potential relationship with these structures [14]. The peaks at 440–470 cm−1 and 515–545 cm−1 are attributed to the asymmetric stretching vibrations of Al-O, which are induced by the bending of Si-O-Si bonds [34]. The bending vibrations of O-Si-O are responsible for the absorptions around 570–590 cm−1, 625–645 cm−1, and 670–760 cm−1 [34]. Three absorption peaks in the ranges of 900–980 cm−1 and 1025–1030 cm−1 are attributed to the stretching vibrations of Si-O [35]. Among these, the vibrations in the 400–800 cm−1 and 950–1150 cm−1 ranges are the most intense.
The deformation vibration frequencies of most silicates typically fall below 650 cm−1, whereas those of most natural kyanite samples extend beyond 720 cm−1, with strong infrared absorption peaks observed between 600 cm−1 and 770 cm−1. Given the small bond angle of Si-O-Al in kyanite, the bending vibrations of O-Si-O induce additional stretching vibrations of Al-O, which account for this phenomenon [36]. Additionally, the short distance of Al-O, the presence of tetrahedrally coordinated oxide ions in the kyanite structure, and the partial local covalency of non-silicate Al-O bonds collectively contributes to this phenomenon, which constitutes a significant structural characteristic of kyanite.
It is noteworthy that in Figure 8, the vibrational intensities of samples Ky-02, Ky-19, and Ky-20 are significantly lower compared to those of the other samples. These samples share a common characteristic: a higher Fe content and a deeper blue body color. This observation aligns with the earlier discussion on the influence of the Fe content on the coloration mechanism of kyanite, further supporting the proposed relationship between Fe incorporation and the vibrational properties of the crystal lattice.
In the crystal structure of kyanite, Al3+ occupies the octahedral sites, while Si4+ resides in the tetrahedral sites. Impurity elements, such as Fe, Ti, and Cr, can enter the octahedral positions through isomorphic substitution, leading to alterations in the vibrational frequency of the Al-O bonds [37]. Since the ionic radii of Fe3+ and Fe2+ differ from that of Al3+, their substitution causes local distortions in the crystal structure. In the infrared spectrum, Fe substitution is manifested as a decrease in the vibrational frequency of the Al-O bonds [38]. These structural changes enhance the absorption of red and orange light in the visible spectrum, contributing to the blue coloration of kyanite. In addition, the presence of Ti4⁺ and Cr3⁺ can lead to shifts in the vibrational frequencies of Si-O and Al-O bonds in the IR spectra [39,40]. However, such shifts were not significantly observed in the samples analyzed in this study.
Although the reduction in the infrared spectral frequency is not as easily quantifiable as peak shifts, it serves as a complementary tool to provide indirect evidence of the influence of iron on the body color of kyanite, thereby contributing to the understanding of its coloration mechanism. These findings are consistent with the results obtained from ED-XRF and UV–Vis spectroscopic analyses, further supporting our overall conclusions and reinforcing the significant role of these impurity elements in the coloration of kyanite.

4. Discussion

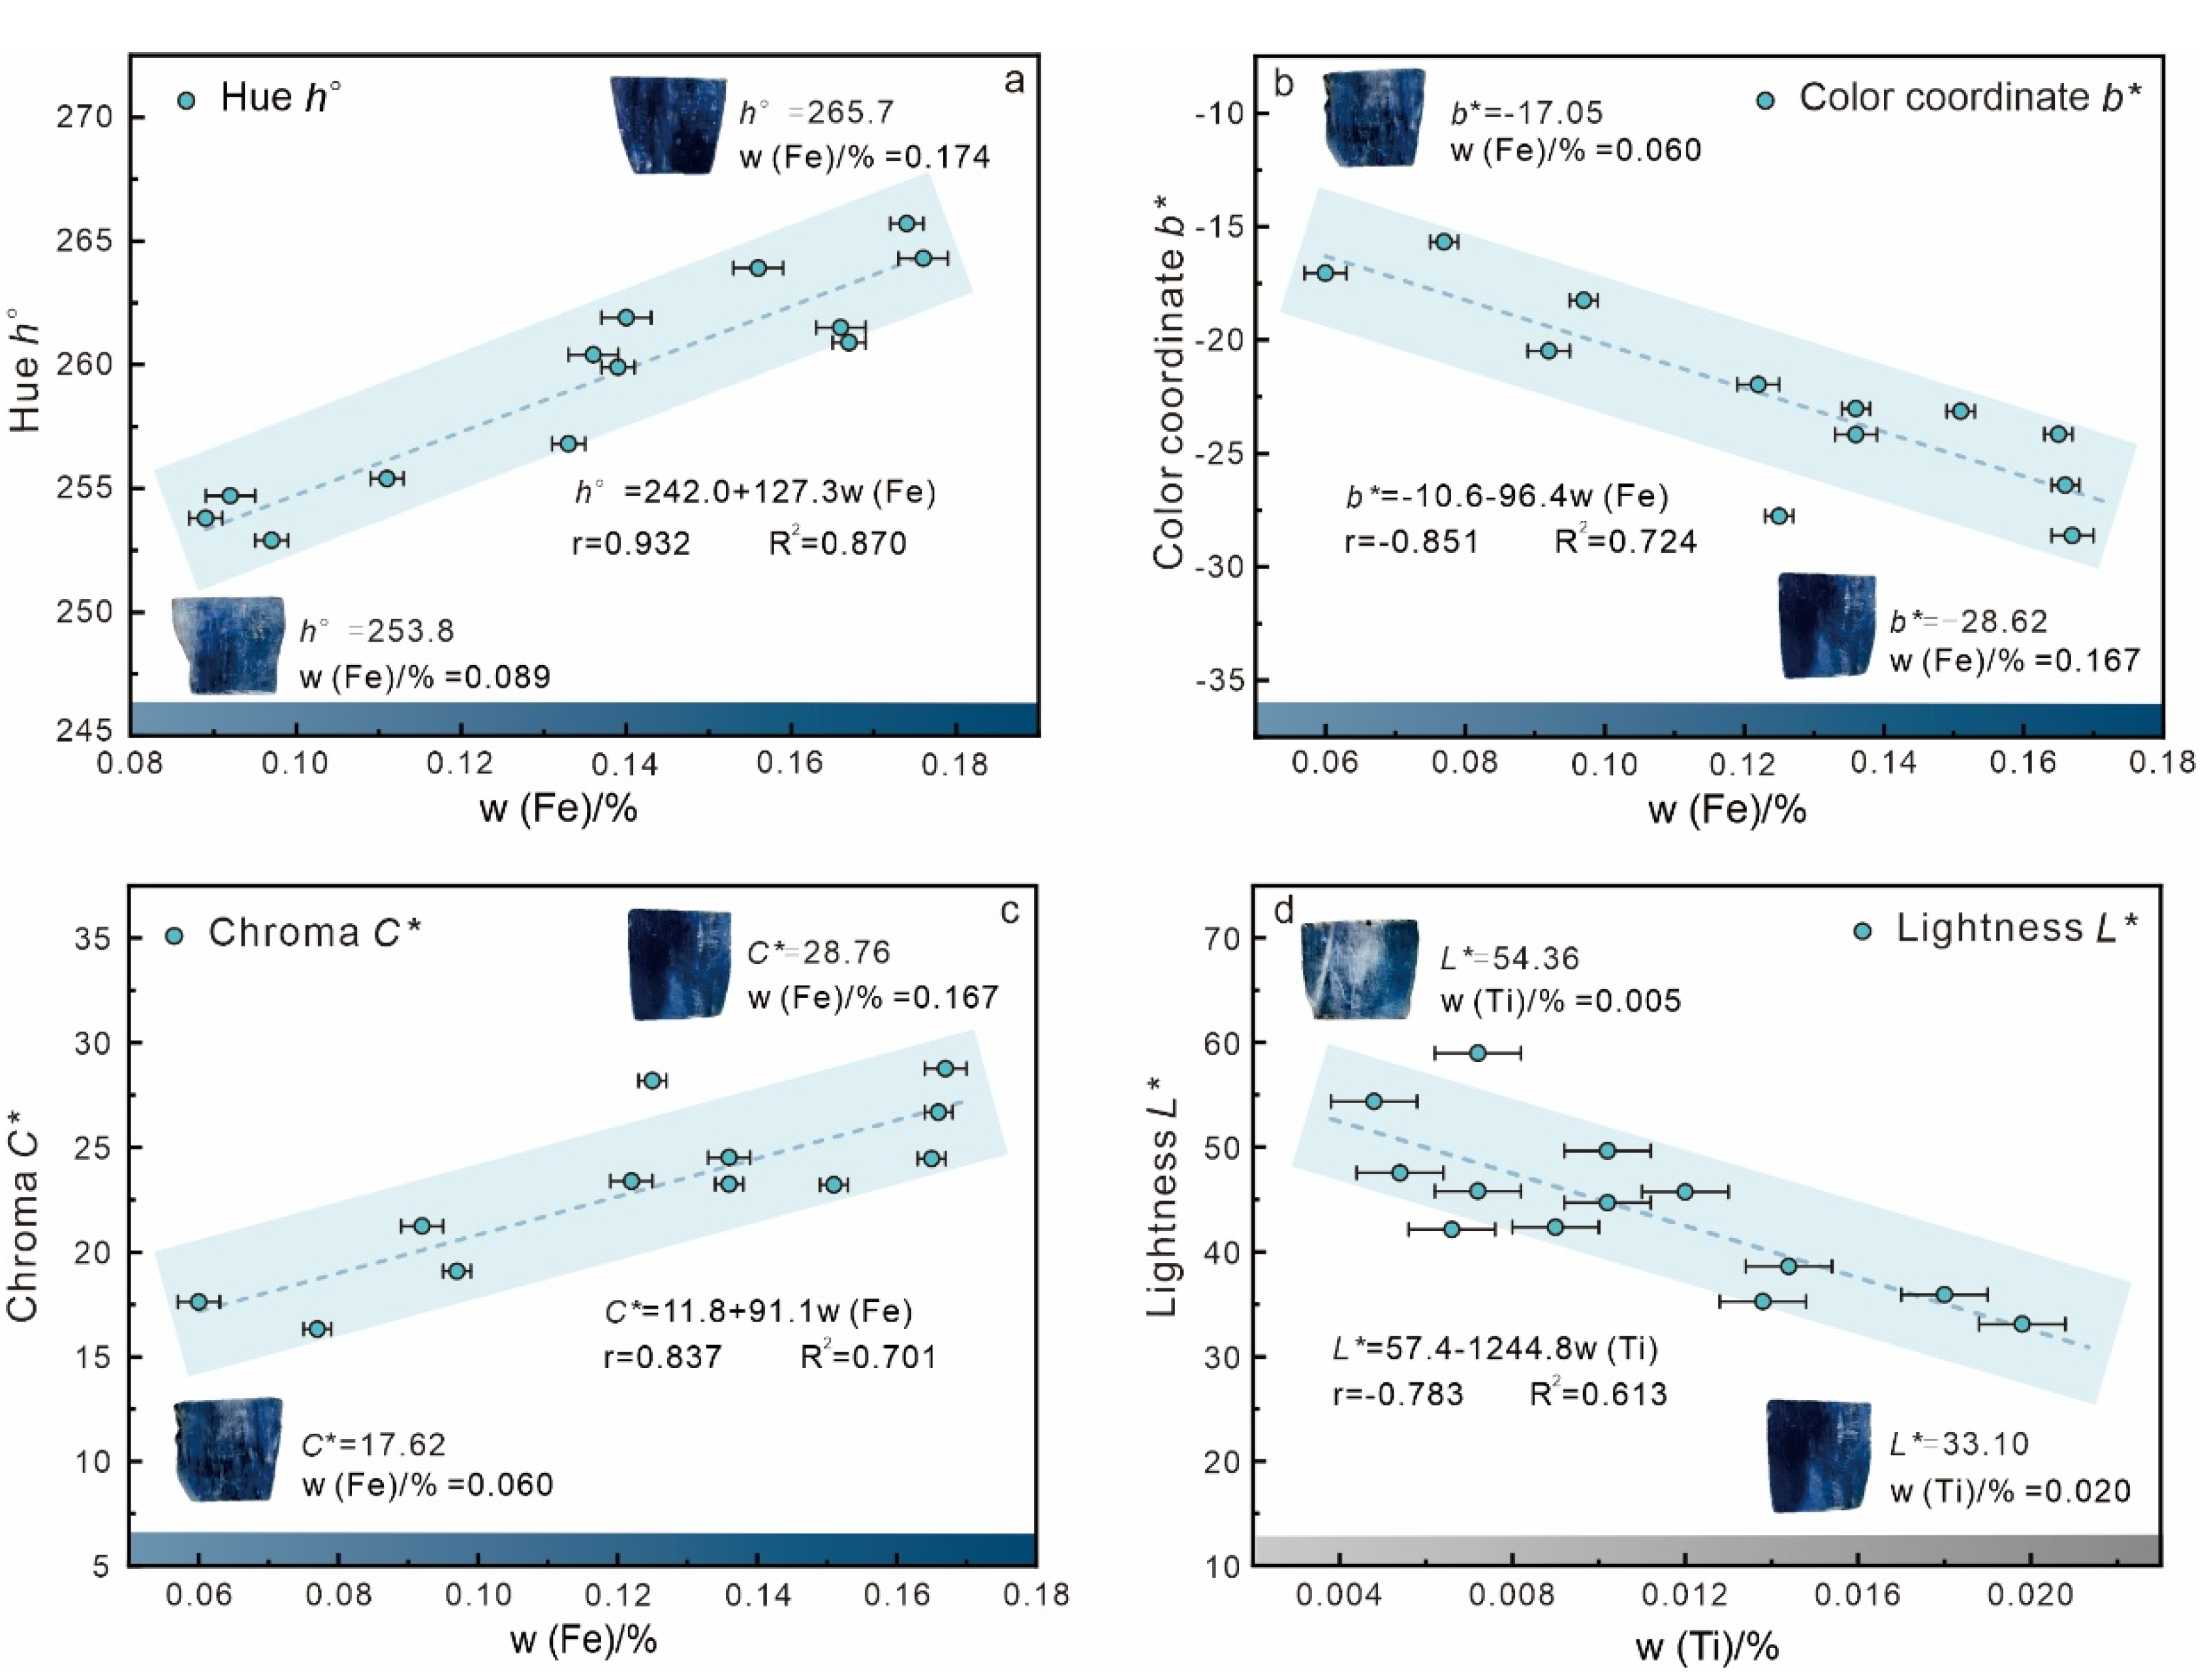
4.1. Relationship Between Composition and Color

Previous ED-XRF and UV–Vis analyses revealed that the coloration of kyanite is primarily attributed to transition metal ions, particularly Fe, Cr, and Ti. To explore the correlation between the trace element composition of kyanite and its color parameters, a bivariate correlation analysis was performed. The analysis employed a two-tailed test and utilized the Pearson correlation coefficient (r) to assess the linearity between the datasets. The correlation is classified as weak or absent (|r| < 0.3), low (0.3 ≤ |r| < 0.5), medium (0.5 ≤ |r| < 0.8), or strong (|r| ≥ 0.8) [41]. The results are summarized in Table 3.
The outcomes demonstrate that the content of Fe in natural kyanite samples is significantly positively correlated with the hue angle (r = 0.932 **) and shows a negative correlation with color coordinate b* (r = −0.852 **). Furthermore, the content of Fe is strongly positively correlated with the chroma C* of the kyanite samples (r = 0.837 **). As illustrated in Figure 9a, an increase in the Fe content is associated with a linear increase in the hue angle of the kyanite samples, resulting in a shift towards bluer hues. Figure 9b,c further illustrate that increasing the Fe content corresponds to a linear decrease in color coordinate b* and a linear increase in chroma C*, accompanied by heightened saturation. These findings are consistent with previous conclusions that color coordinate b* is inversely related to chroma C*. To further investigate whether other elements influence the body color of the kyanite samples, we conducted a bivariate correlation analysis between chromaticity parameters and the concentrations of Ti, Fe + Ti, Fe + Cr and Fe/Ti.
The study reveals that the Ti content also affects the body color of blue kyanite samples. Table 3 and Figure 9d demonstrate that the content of Ti exhibits no significant correlation with chroma C* or hue angle (rC*= −0.101, r= 0.469), yet it shows a marked negative correlation with lightness L* (rL*= −0.783 **). As the Ti content increases, the lightness L* decreases linearly, transitioning from bright blue to dark blue. Likewise, the lightness of the kyanite samples is also influenced by the Cr content. As shown in Table 3, the combined content of Fe + Cr is moderately negatively correlated with lightness L* (rL* = −0.632 *).
Based on the presented analysis, as the Fe content increases in the kyanite samples, the hue shifts towards blue, and the chroma increases, whereas as the Ti content increases, the lightness decreases, resulting in a darker appearance. Additionally, the combined content of Fe and Cr influences the chromaticity parameters of the kyanite samples.

4.2. Causes of the Color of Blue Kyanite

To further investigate the effects of the Fe and Ti contents on the color of blue kyanite, we conducted an analysis of the relationship between trace elemental concentrations and the wavelengths corresponding to absorption peaks in the orange-red region of the UV–Vis spectrum.
As shown in Figure 10a, the UV–Vis absorption peak centered at 590 nm in natural kyanite samples significantly influences their lightness L*. The UV–Vis spectrum of the kyanite samples displays two peaks in the orange-red region, with the first peak located between 580 and 620 nm. The lightness L* of the kyanite samples is influenced by the wavelength which corresponds to the first peak in the orange-red region of the UV–Vis spectrum. As illustrated in Figure 10b, with the increase in wavelength, the lightness L* increases almost linearly, resulting in a brighter body color. There is a significant positive correlation between the wavelength corresponding to the first peak and the lightness L* (r = 0.830). As indicated in Figure 10c, with the decrease in the Ti content, the first peak shifts towards longer wavelengths, resulting in a change in body color from dark blue to light blue. There is a significant negative correlation between the Ti content and the wavelength of the first peak (r = 0.906). This finding confirms the previous conjecture that the shift in the absorption band is related to the concentration of Ti and that the Ti content affects the body color of kyanite.
This phenomenon is attributed to the electronic charge transfer between Fe2+-Ti4+ ion pairs in natural kyanite. According to valence band theory, when Ti4+, Fe2+, and Fe3+ coexist in kyanite, Fe2+ preferentially pairs with Ti4+ to form Fe2+-Ti4+ ion pairs, and electron transfer occurs preferentially from Fe2+ to Ti4+, leading to the dark blue coloration of kyanite [14,23]. Therefore, with the decrease in the Ti content in the sample, the absorption peak in the 580–620 nm range shifts to a larger wavelength direction, which in turn results in a darker blue hue of kyanite. Moreover, these findings are consistent with previous ED-XRF analysis, which has indicated that the coloration of kyanite is related to the Ti content, significantly influencing the lightness L* of natural kyanite. The Ti content exhibits a negative correlation with lightness L*: the lower the Ti content, the higher the lightness (L*), leading to a brighter color.
As is well known, the area of absorption peaks in UV–Vis absorption spectra is typically correlated with the concentration of absorbing species in the sample. According to the Lambert–Beer Law [42], the peak area represents the integral of absorbance over a specific wavelength range, directly reflecting the concentration of the target substance in the sample. Furthermore, the peak area is closely related to the absorption intensity: a larger peak area indicates a stronger electronic transition or charge transfer process associated with the absorption band [43]. Therefore, we conducted a correlation analysis between the peak area around 600 nm in the UV–Vis spectra of kyanite and its color parameters to explore the chromogenic mechanism of kyanite.
In natural blue kyanite, as shown in Figure 11a,b, the area of the absorption peak at 600 nm exerts substantial influence on the coloration of natural kyanite: the hue angle of kyanite increases with the absorption peak area at 600 nm, indicating a strong positive correlation (r = 0.888). The broad absorption band at 600 nm correlates with the charge transfer of Fe ions, as shown in Figure 11c. An increase in Fe ion concentration leads to a corresponding increase in the absorption peak area at 600 nm, resulting in color changes in the natural samples. This demonstrates a strong positive correlation between the content of Fe and the absorption peak area (r = 0.918), which is consistent with the conclusion that the Fe content is strongly positively correlated with the hue angle of natural kyanite samples, as determined by ED-XRF.
The coloration of kyanite primarily originates from the presence of impurity elements within its crystal lattice. Structural disorder facilitates the accommodation of more impurities, thereby affecting the hue of kyanite [33]. As illustrated in Figure 11, the hue angle of kyanite is strongly positively correlated with the intensity of the broad absorption band observed in the spectrum. An increase in the concentration of impurities within the kyanite crystal lattice corresponds to an increase in the intensity of this broad absorption band. Based on the analysis, the broad absorption band at 600 nm in the UV–Vis absorption spectrum is likely attributed to both Fe2+ and Ti4+ ions, consistent with the hypothesis that Fe3+, Fe2+, and Ti4+ are the primary factors influencing the color of kyanite [44]. Previous studies have shown that the blue color of kyanite is due to the intervalence charge transfer (IVCT) between two impurities present in two adjacent octahedral sites [28]. When kyanite is exposed to visible light, electronic transitions occur within the crystal lattice, involving electronic transitions between Fe2+ and Fe3+, and charge transfer transitions between neighboring Fe2+ and Ti4+ ions [23,45]. Through the superposition of these two electron transitions, kyanite absorbs red, orange, yellow, and portions of green light within the visible spectrum, resulting in the preferential transmission and reflection of blue light, which leads to the coloration of kyanite shifting towards blue and results in an increased hue angle [5].

5. Conclusions

The sample was preliminarily identified as kyanite. The chroma C* of blue kyanite is predominantly influenced by variations in the color coordinate b*. Based on the analysis of ED-XRF and UV–Vis results, Fe3+, Fe2+, and Ti4+ are confirmed as the primary factors influencing the color of kyanite, with Fe playing a dominant role in determining the color. The hue angle and chroma C* of kyanite were found to be strongly positively correlated with the Fe content, whereas the color coordinate b* exhibited a strong negative correlation with the Fe content. An increase in the Fe content led to a rise in the hue angle, which subsequently caused a shift towards a more pronounced blue hue. Additionally, the lightness L* exhibited a negative correlation with Ti content; as the Ti content increased, the lightness decreased, resulting in a darker appearance. Moreover, the influence of Cr on the body color of kyanite cannot be ignored. The UV–Vis spectra of the kyanite samples reveal a prominent absorption band at approximately 600 nm, attributed to Fe3+ and Ti4+. The wavelength corresponding to the first peak significantly correlates with the lightness L* of natural samples; as the wavelength increases, so does the lightness, resulting in a brighter body color. Additionally, an increase in the Fe content leads to a more pronounced absorption peak at 600 nm and is significantly positively correlated with an increase in the hue angle.

Supplementary Materials

The following supporting information can be downloaded at: https://www.mdpi.com/article/10.3390/cryst15040302/s1, Table S1: Color parameters and composition of kyanite samples.

Author Contributions

Conceptualization, X.C.; methodology, X.C. and Y.G.; validation, Y.G.; formal analysis, X.C.; investigation, X.C. and M.G.; resources, X.C. and Y.G.; data curation, X.C.; writing—original draft preparation and editing, X.C.; supervision, Y.G.; project administration, Y.G. All authors have read and agreed to the published version of the manuscript.

Funding

This research received no external funding.

Data Availability Statement

Data are contained within the article.

Acknowledgments

This research was supported by the Undergraduate Innovation and Entrepreneurship Training Program at China University of Geosciences (Beijing). We sincerely appreciate the valuable opportunity provided by our institution. The experiments in this article were conducted in the Gemological Laboratory of the China University of Geoscience, Beijing. We are grateful to Yu Han for providing the samples and to Ying Guo, Lianyi Cui, and Zheyi Zhao for their valuable assistance in completing this study.

Conflicts of Interest

The authors declare no conflicts of interest.

References

  1. Sui, Y. Geological characteristics and genetic analysis of Tongbai kyanite deposit in Henan province. Sichuan Build. Mater. 2011, 37, 175–176. [Google Scholar]
  2. Chadwick, K.M.; Rossman, G.R. Orange kyanite from Tanzania. Gems Gemol. 2009, 45, 146–147. [Google Scholar]
  3. Zhang, J.; Hao, Y.; Xuan, Z. Study on crystal chemistry characteristics and flotation behavior of kyanite mineral. China Min. Mag. 2016, 25, 139–143. [Google Scholar]
  4. Jin, J.; Gao, H.; Ren, Z.; Chen, Z. The Flotation of Kyanite and Sillimanite with Sodium Oleate as the Collector. Minerals 2016, 6, 90. [Google Scholar] [CrossRef]
  5. Wildner, M.; Beran, A.; Koller, F. Spectroscopic characterisation and crystal field calculations of varicoloured kyanites from Loliondo, Tanzania. Mineral. Petrol. 2012, 107, 289–310. [Google Scholar] [CrossRef]
  6. Pradat, T.; Choudhary, G. Gem-quality Cr-rich kyanite from India. Gems Gemol. 2014, 50, 87–88. [Google Scholar]
  7. Platonov, A.N.; Tarashchan, A.N.; Langer, K.; Andrut, M.; Partzsch, G.; Matsyuk, S.S. Electronic absorption and luminescence spectroscopic studies of kyanite single crystals: Differentiation between excitation of FeTi charge transfer and Cr3+ dd transitions. Phys. Chem. Miner. 1998, 25, 203–212. [Google Scholar]
  8. Qiu, L.; Guo, Y.; Yuan, B.; Su, Y.-S.; Qi, Y.-H. Chromatographic Study of Blue-Violet Tanzanite’s Color Appearance. Sci. Adv. Mater. 2022, 14, 1032–1040. [Google Scholar] [CrossRef]
  9. Deng, S.; Guo, Y. Investigation of Factors Affecting the Color of Serpentine Jade from Shandong, China. Crystals 2023, 13, 431. [Google Scholar] [CrossRef]
  10. Yuan, B.; Guo, Y.; Chen, J.; Liu, Z. Study of Natural and Synthetic Yellow–Orange Sapphires Based on the CIE 1976 L*a*b* Uniform Colour Space. Sci. Adv. Mater. 2022, 14, 1570–1581. [Google Scholar] [CrossRef]
  11. Kirillova, N.P.; Vodyanitskii, Y.N.; Sileva, T.M. Conversion of soil color parameters from the Munsell system to the CIE-L*a*b* system. Eurasian Soil Sci. 2015, 48, 468–475. [Google Scholar]
  12. Araujo, N.J.F.; Barreto, S.B.; Carrino, T.A.; Souza, I.; Santos, G.L. Geochemical and reflectance spectroscopy data integration to characterize emerald deposits: The case of the Parana deposit, Brazil. Acad. Bras. Cienc. 2021, 93, e20200236. [Google Scholar] [CrossRef] [PubMed]
  13. Ly, A.; Marsman, M.; Wagenmakers, E.J. Analytic posteriors for Pearson’s correlation coefficient. Stat. Neerl. 2017, 72, 4–13. [Google Scholar] [CrossRef] [PubMed]
  14. Cui, L.; Guo, Y.; Tang, J.; Yang, Y. Spectroscopy Characteristics and Color-Influencing Factors of Green Iron-Bearing Elbaite. Crystals 2023, 13, 1461. [Google Scholar] [CrossRef]
  15. Fiamegos, Y.; Calle, G.; Maria, B. Validation strategy for an ED-XRF method to determine trace elements in a wide range of organic and inorganic matrices based on fulfilment of performance criteria. Spectrochim. Acta Part B At. Spectrosc. 2018, 150, 59–66. [Google Scholar] [CrossRef]
  16. Phillips, S.E.; Argles, T.W.; Warren, C.J.; Harris, N.B.W.; Kunz, B.E. Kyanite petrogenesis in migmatites: Resolving melting and metamorphic signatures. Contrib. Mineral. Petrol. 2023, 178, 10. [Google Scholar] [CrossRef]
  17. Deng, M.; Liao, C.; Wang, X.; Chen, S.; Qi, F.; Zhao, X.; Yu, P. A paper-based colorimetric microfluidic sensor fabricated by a novel spray painting prototyping process for iron analysis. Can. J. Chem. 2019, 97, 373–377. [Google Scholar] [CrossRef]
  18. Dong, J.; Huang, F.; Wang, D. Geochemical characteristics and geological significance of beryl in different types of berylium deposits. Acta Petrol. Sin. 2023, 39, 2153–2166. [Google Scholar] [CrossRef]
  19. Harte, B. Kyanite and Cordierite-Andalusite occurrences in parts of Barrow’s Staurolite zones—The effects of high ferric iron. J. Metamorph. Geol. 2024, 42, 1131–1158. [Google Scholar] [CrossRef]
  20. Filiz, G. Study of Geobarometers in Pelitic Schists from The Pütürge Metamorphites. Earth Environ. Sci. 2016, 44, 042010. [Google Scholar] [CrossRef]
  21. O’Bannon, E.F., III; Williams, Q. High-pressure Cr3+ R-line luminescence of zoisite andkyanite: A probe ofoctahedral site distortion. Phys. Chem. Miner. 2022, 49, 35. [Google Scholar]
  22. Ruihua, W.; Qionglin, L. Study on the role of Fe3+ in sapphire. J. Chang. Univ. Sci. Technol. 2000, 30, 38–41. [Google Scholar]
  23. Niamjan, N.; T-Thienprasert, J.; Kim, H.-S.; Na-Phattalung, S. Intervalence charge transfer of Ti and Fe defects in blue kyanite. J. Korean Phys. Soc. 2021, 78, 671–678. [Google Scholar] [CrossRef]
  24. Zhang, L.; Gao, X.; Liu, Y. Gem characteristics and color genesis of orange kyanite. China Sci. 2018, 13, 2442–2446. [Google Scholar]
  25. Guo, K.; Zhou, Z.; Zhong, Q.; Lai, M.; Wang, H.; Li, Y.; Qiao, X.; Nong, P. A comparative study of element content and UV-Vis spectroscopy characteristics of rubies from Burma and Mozambique. Acta Petrol. Sin. 2018, 37, 1002–1010. [Google Scholar]
  26. Chen, X. Gemological Properties and Color Mechanism of Green Kyanite. Master’s Thesis, University of Geosciences, Beijing, China, 2019; pp. 31–50. [Google Scholar]
  27. Blereau, E.; Piazolo, S.; Trimby, P.; Skrzypek, E. Kyanite microstructural and microchemical characteristics reveal differences in growth, deformation and chemical modification: A case study from the Paleoproterozoic suture zone of South Harris, NW Scotland. Lithos 2024, 484–485, 107748. [Google Scholar] [CrossRef]
  28. Taran, M.N. Electronic intervalence Fe2+ + Ti4+ → Fe3+ + Ti3+ charge-transfer transition in ilmenite. Phys. Chem. Miner. 2019, 46, 839–843. [Google Scholar] [CrossRef]
  29. Kalita, J.M.; Wary, G. Trap spectroscopy and dosimetric aspects of natural kyanite mineral. Appl. Phys. A Mater. Sci. Process. 2015, 119, 1555–1560. [Google Scholar]
  30. Xiaolian, H. The chromatics of Fe and Ti in Shandong Changle blue sapphire. J. Ceram. 2018, 46, 1483–1488. [Google Scholar] [CrossRef]
  31. Gao, J.; Wu, W.; Jia, L.; Wang, C.P.; Liu, Y.; Xu, C.; Chen, F.; Fei, C.; Su, W. Raman and infrared spectra to monitor the phase transition of natural kyanite under static compression. J. Raman Spectrosc. 2020, 51, 2102–2111. [Google Scholar] [CrossRef]
  32. Xunhai, M. Study on color genesis of Hanshan cyanite in Jiangsu Province. J. Xi ’an Min. Inst. 1991, 9, 34–37. [Google Scholar]
  33. Somakumar, A.K.; Bulyk, L.-l.; Tsiumra, V.; Barzowska, J.; Xiong, P.; Lysak, A.; Zhydachevskyy, Y.; Suchocki, A. High-Pressure Near-Infrared Luminescence Studies of Fe3+-ActivatediGaO2. Inorg. Chem. 2023, 62, 12434–12444. [Google Scholar] [CrossRef] [PubMed]
  34. Zhu, Y.; Li, Y.; Ding, H.; Lu, A.; Li, Y.; Ji, X.; Zhang, Y.; Wang, C. Vibrational and structural insight into silicate minerals by mid-infrared absorption and emission spectroscopies. Phys. Chem. Miner. 2022, 49, 6. [Google Scholar] [CrossRef]
  35. Makreski, P.; Jovanovski, G.; Stojanceska, S. Minerals from Macedonia XIII: Vibrational spectra of some commonly appearing nesosilicate minerals. J. Mol. Struct. 2005, 744, 79–92. [Google Scholar]
  36. Keqin, W.; Mingkai, L.; Guozhi, Y.; Huimin, F. Study on the typomorphic characteristics of kyanite in the kyanite deposits in the Yu and Su areas. Geol. Prospect. Agent 1994, 30, 37–42. [Google Scholar]
  37. Frost, R.L.; Xi, Y.; Scholz, R.; Lima, R.M.F.; Horta, L.F.C.; Lopez, A. Thermal analysis and vibrational spectroscopic characterization of the boro silicate mineral datolite—CaBSiO4(OH). Spectrochim. Acta Part A Mol. Biomol. Spectrosc. 2013, 115, 376–381. [Google Scholar] [CrossRef]
  38. Dyar, M.D.; Sklute, E.C.; Post, J.E. Infrared Spectroscopy of Fe-Bearing Minerals: Insights into Crystal Chemistry and Environmental Applications. Am. Mineral. 2009, 94, 1–17. [Google Scholar] [CrossRef]
  39. Karabulut, M.; Metwalli, E.; Brow, R.K. Influence of Cr³⁺ ions on the infrared spectra of phosphate glasses. J. Non Cryst. Solids 2001, 283, 211–219. [Google Scholar]
  40. Mekki, A.; Khattak, G.D.; Wenger, L.E. Effect of TiO₂ on the structural, thermal, and optical properties of phosphate glasses. J. Non Cryst. Solids 2004, 344, 128–134. [Google Scholar]
  41. Yan, C.; Wang, L.; Lin, J.; Xu, J.; Zhang, T.; Qi, J.; Li, X.; Ni, W.; Wu, G.; Huang, J.; et al. A Fully Automatic AI-based CT Image Analysis System for Accurate Detection, Diagnosis, and Quantitative Severity Evaluation of Pulmonary Tuberculosis. Res. Sq. 2021, 1–17. [Google Scholar] [CrossRef]
  42. Jiménez, J.R.; Rodríguez-Marín, F.; Anera, R.G.; Barco, L.J.d. Deviations of Lambert-Beer’s law affect corneal refractive parameters after refractive surgery. Opt. Express 2006, 14, 5411–5417. [Google Scholar] [PubMed]
  43. Zobel-Roos, S.; Mouellef, M.; Siemers, C.; Strube, J. Process Analytical Approach towards Quality Controlled Process Automation for the Downstream of Protein Mixtures by Inline Concentration Measurements Based on Ultraviolet/Visible Light (UV/VIS) Spectral Analysis. Antibodies 2017, 6, 24. [Google Scholar] [CrossRef] [PubMed]
  44. Zhong, Y.; Liang, X.; Zhong, Y.; Zhu, J.; Zhu, S.; Yuan, P.; He, H.; Zhang, J. Heterogeneous UV/Fenton degradation of TBBPA catalyzed by titanomagnetite: Catalyst characterization, performance and degradation products. Water Res. 2012, 46, 4633–4644. [Google Scholar] [CrossRef] [PubMed]
  45. Fortes, A.D. Thermal expansion of the Al2SiO5 polymorphs, kyanite, andalusite and sillimanite, between 10 and 1573 K determined using time-of-flight neutron powder diffraction. Phys. Chem. Miner. 2019, 46, 687–704. [Google Scholar] [CrossRef]
Figure 1. (A) The twenty natural samples selected and analyzed in this research; (BD) representative samples for magnified photography.
Crystals 15 00302 g001
Figure 2. Samples under reflected light (a) Ky-13; (b) Ky-05; (c) Ky-11; (d) Ky-06.
Crystals 15 00302 g002
Figure 3. 20 kyanites represented in CIE 1976 L*a*b* uniform color space.
Crystals 15 00302 g003
Figure 4. The chromaticity coordinate b* exhibits a significant negative correlation with chroma C*.
Crystals 15 00302 g004
Figure 5. The crystal structure of kyanite.
Crystals 15 00302 g005
Figure 6. The projection of the kyanite structure on the (100) plane [5].
Crystals 15 00302 g006
Figure 7. Ultraviolet absorption spectrum of natural kyanite.
Crystals 15 00302 g007
Figure 8. IR spectra of blue kyanite.
Crystals 15 00302 g008
Figure 9. Correlation between color parameters and transition metal elements in natural kyanites. (a) w (Fe) is highly positively correlated with the hue angle (r = 0.932 **); (b) w (Fe) is highly negatively correlated with color coordinate b* (r = −0.851 **); (c) w (Fe) is highly positively correlated with chroma C* (r = 0.837 **); (d) the increase in the Ti content correlates with a decrease in lightness L*, indicating a significant negative correlation (r = −0.783 **).
Crystals 15 00302 g009
Figure 10. Correlation between body color of kyanite and wavelength corresponding to the first UV–Vis absorption peak. (a) The wavelength corresponding to the first peak determines the lightness L* of kyanite; (b) the wavelength is significantly positively correlated with the lightness L*; (c) with the decrease in w (Ti)/%, a bathochromic shift occurred.
Crystals 15 00302 g010
Figure 11. Correlation between body color of kyanite and 600 nm absorption peak area. (a) 600 nm absorption peak area in natural kyanite; (b) the hue angle of kyanite correlates positively with the 600 nm absorption peak area; (c) relationship between 600 nm absorption peak area and Fe content.
Crystals 15 00302 g011
Table 1. Gemological properties of natural blue kyanite.
CharacteristicsResults
ColorDark blue-light blue
Weight3.26~6.02 ct
SG3.62~3.70
RI1.706~1.732
Birefringence0.012~0.016
DiaphaneityTranslucent to opaque
InclusionsSmall subhedral inclusions
Table 2. The ED-XRF data of kyanite.
SamplesKy-05Ky-01Ky-14Ky-08Ky-18Ky-13Ky-11Ky-02
Simulated
Color
Crystals 15 00302 i001Crystals 15 00302 i002Crystals 15 00302 i003Crystals 15 00302 i004Crystals 15 00302 i005Crystals 15 00302 i006Crystals 15 00302 i007Crystals 15 00302 i008
Al33.07 (±0.199)33.1 1(±0.200)33.03 (±0.201)32.25 (±0.202)33.39 (±0.202)32.09 (±0.209)32.09 (±0.201)32.04 (±0.111)
Si16.84 (±0.110)16.95 (±0.111)16.96 (±0.112)17.64 (±0.112)17.04 (±0.111) 17.64 (±0.115)17.64 (±0.111)17.71 (±0.026)
S0.38 (±0.015)0.28 (±0.026)0.35 (±0.014)0.30 (±0.015)0.00 (+0.017)0.39 (±0.008)0.39 (±0.027)0.43 (±0.001)
Fe0.12 (±0.002)0.10 (±0.002)0.13 (±0.003)0.17 (±0.003)0.09 (±0.002)0.14 (±0.003)0.14 (±0.003)0.18 (±0.003)
K0.04 (±0.003)0.09 (±0.003)0.10 (±0.003)0.02 (±0.003)0.13 (±0.003)0.05 (±0.003)0.000.03(±0.002)
Ca0.06 (±0.002)0.03 (±0.002)0.02 (±0.002)0.01 (±0.003)0.02 (±0.002)0.03 (±0.002)0.03 (±0.002)0.01 (±0.002)
Ti0.01 (±0.001)0.01 (±0.001)0.01 (±0.001)0.01 (±0.001)0.01 (±0.001)0.01 (±0.001)0.01 (±0.001)0.01 (±0.001)
V0.01 (±0.001)0.01 (±0.001)0.01 (±0.001)0.000.000.01 (±0.001)0.01 (±0.001)0.01 (±0.001)
Cr0.000.01 (±0.001)0.000.000.000.13 (±0.001)0.000.02 (±0.001)
O49.3449.3349.3749.3949.2649.4549.4549.50
Other0.120.080.050.220.060.060.060.06
Total100100100100100100100100
Table 3. Results of bivariate correlation analysis.
Oxides (wt.%) L*C*b*a*
FePearson’s r−0.4200.837 **0.932 **−0.832 **0.338
Sig. 0.3000.0140.0070.0110.321
TiPearson’s r −0.783 **−0.1010.4670.0490.449
Sig.0.0230.6790.2430.7240.287
Fe+ TiPearson’s r−0.149−0.2480.555−0.5890.553
Sig.0.7250.5540.3300.2600.279
Fe+ CrPearson’s r−0.632 *0.4530.225−0.6070.139
Sig.0.1890.2600.3400.2130.789
Fe/TiPearson’s r0.280−0.132−0.227−0.137−0.157
Sig0.2320.5790.3370.5650.508
** At level 0.01 (double tail), the correlation was significant. * At level 0.05 (double tail), the correlation was significant.
Disclaimer/Publisher’s Note: The statements, opinions and data contained in all publications are solely those of the individual author(s) and contributor(s) and not of MDPI and/or the editor(s). MDPI and/or the editor(s) disclaim responsibility for any injury to people or property resulting from any ideas, methods, instructions or products referred to in the content.

