Article

The Stirring Effect on the Crystal Morphology of p-Acetamidobenzoic Acid Solution Crystallization

1
National Engineering Research Center of Industrial Crystallization Technology, School of Chemical Engineering and Technology, Tianjin University, Tianjin 300072, China
2
The Co-Innovation Center of Chemistry and Chemical Engineering of Tianjin, Tianjin University, Tianjin 300072, China
3
Asymchem Life Science (Tianjin) Co., Ltd., Tianjin 300072, China
4
School of Environmental Science and Engineering, Tianjin University, Tianjin 300350, China
*
Authors to whom correspondence should be addressed.
Crystals 2025, 15(3), 284; https://doi.org/10.3390/cryst15030284
Submission received: 4 March 2025 / Revised: 17 March 2025 / Accepted: 18 March 2025 / Published: 20 March 2025
(This article belongs to the Section Crystal Engineering)

Abstract

:
This work investigates the stirring effect on p-Acetamidobenzoic Acid (p -AABA) crystal morphology through single crystal cultivation, crystal face growth rate, and nucleation supersaturation measurements, molecular simulation (MS), and computational fluid dynamics (CFD). Results show that stirring rate influences nucleation supersaturation, boundary layer thickness on the {101} and {010} faces, and shear stress applied on these two faces. This leads to changes in nucleation rate, nucleus size, and relative growth rates between the {101} and {010} faces, thus affecting crystal morphology. Under low-rate stirring (150 rpm), crystals exhibit a small size, a low aspect ratio, and a clear aggregation phenomenon. Appropriately increasing stirring rate can prevent aggregation and improve particle size and crystal aspect ratio. High-rate stirring leads to a higher shear stress at the corner points of the {101} face, causing crystal fragmentation, which leads to a significant decrease in crystal size and a slow decrease in aspect ratio. Moreover, the growth rates of the {101} and {010} faces exhibit an exponential dependence on supersaturation. The {101} face grows faster than the {010} face, and this growth rate difference widens with the increasing supersaturation. This study provides a theoretical basis and practical guidance for optimizing crystal morphology in stirred solution crystallization.

1. Introduction

For pharmaceuticals, good crystal morphology not only has a decisive influence on the filtration and flowability of crystalline product, as well as subsequent operations like packaging, processing, transportation, and storage, but also affects stability and bioavailability of the substance [1,2]. Crystal morphology is mainly influenced by various factors such as solvents, additives, and process parameters. Among these, the hydrodynamic environment has been extensively studied as an important factor [3,4,5]. Stirring, an important way to regulate the hydrodynamic environment, can control the induction time [6,7], enhance heat and mass transfer [8], and homogenize products. Abundant literature reports that increasing the stirring rate initially improves nucleation and growth rates [9,10], but excessive stirring can have a negative impact on crystal growth [11]. Zi et al. [12] optimized stirring rate, seed crystal concentration, and pH value to change the crystal morphology from needle- and flake-like crystals to cubes. Wang et al. [13] obtained spherical particles with good roundness and size distribution by optimizing factors such as stirring rate, initial concentration, and the flow rate of antisolvent addition, increasing the product mobility by 55%.
Studying the stirring effect on the crystallization process through experimental methods often encounters challenges such as large experimental workload, low efficiency, and high costs [14]. With the rapid advancement of computer science and fluid mechanics theory, computational fluid dynamics (CFD) simulations have been widely applied in the crystallization field [15]. Firstly, CFD can simulate the crystallization environment and provide a theoretical foundation for research. Offiler et al. [16] performed CFD to simulate the flow field and concentration distribution in a flow cell and found that flow-induced localized concentration differences and changes in the mass-transfer rate were the main causes of crystal defects (hollows). Secondly, coupled CFD–Particle Balance Equation (PBE) simulations of processes such as cooling crystallization and antisolvent crystallization can effectively optimize crystal size distribution and enhance product quality [17,18,19]. Sun et al. [20] simulated the liquid flow around particles of different sizes in a Couette flow using CFD and found that the local shear rate near particles increased with the increase of the particle size, providing a basis for explaining the mechanism of preferential growth of large crystals in the presence of polymer. In addition, utilizing CFD simulation to control crystal morphology during the scale-up process of crystallization is of great significance for industrial production. Dong et al. [21] simulated the suspension crystallization process and successfully derived the process scale-up law for parylene crystallization. Janbon et al. [22] used CFD to simulate the shear rate and mixing time in the crystallizer and proposed a method to minimize agglomerate formation in the scale-up production of active pharmaceutical ingredients. Despite the remarkable achievements of CFD in crystallization, several problems remain that require urgent solutions. Crystal morphology is primarily influenced by growth processes from a microscopic perspective and secondary processes such as breakage from a macroscopic perspective. However, current CFD models are mainly based on macroscopic physical quantities, making it difficult to gain insights into the microscopic essence of crystallization.
In recent years, the widespread application of molecular simulation (MS) technology has provided researchers with new points for studying crystal morphology. By examining atomic-level interactions within and between molecules, MS can predict crystal structures and behaviors during crystallization using molecular models and simulate various physical and chemical properties of the system [23]. In order to predict the crystal morphology, many theoretical methods have been proposed, such as the Bravais–Friedel–Donnay–Harker (BFDH) rule [24], the periodic bond chain (PBC) theory [25], and the attachment energy (AE) model [26]. Considering the interactions between solvent and crystal faces, a modified attachment energy model (MAE) was proposed [27]. MS reveals the fundamental mechanisms of crystal structure and morphological evolution through atomic-scale simulations, while CFD deciphers the dynamic regulation of crystallization processes through macroscopic analysis of fluid flow, mass transfer, and heat transport. Therefore, we believe that the combination of MS and CFD can provide a groundbreaking approach for crystal morphology research. This macro–micro integrated approach overcomes the limitations of single techniques, enabling a more in-depth and comprehensive analysis of how stirring affects crystal morphology.
p-Acetamidobenzoic acid (p-AABA), an antiviral and immunomodulatory drug, has demonstrated application value in the treatment of various viral infections and has certain efficacy in improving immune system diseases. Meanwhile, as an important intermediate for the organic compound synthesis, p-AABA can be used to prepare fluorescent whitening and anti-asthmatic agents [28]. In addition, due to its multidentate structure, it shows significant potential for application in the field of functional materials [29]. But p-AABA crystals commonly exist in needle-like and flake-like forms. Crystals in these forms inevitably lead to uneven mixing and reduced processing efficiency due to poor fluidity and low packing density, while increasing the risk of equipment clogging and mechanical wear, with a consequent impact on downstream process stability. Current research on this substance mostly focuses on the synthetic processes study, the functional aspect development, and the solubility data determination, while research on the crystallization process is extremely scarce [28,30,31]. Thus, further experimental and simulation investigations on p-AABA crystal morphology are needed to assist in the enhancement of product quality.
In this paper, p-AABA was chosen as the research object, and an innovative combination of experiments, MS, and CFD numerical simulation was adopted, which helped to comprehensively investigate the stirring effect during solution crystallization on the crystal morphology of p-AABA and the underlying causes at both macroscopic and microscopic levels. The study aimed to (1) unravel the intrinsic correlations between hydrodynamic behavior and morphological evolution during crystallization, and (2) provide experimental cases and research methods for the improvement of product quality and the optimization of crystallization process.

2. Experiments

2.1. Experimental Materials

The p-Acetamidobenzoic acid (the mass purities ≥ 99%) used in this experiment was provided by Tianjin Heowns Biochem Technologies, LLC (Tianjin, China). Analytical reagent grade methanol (the mass purities ≥ 99.5%) was supplied by Tianjin Kermel Chemical Reagent Co., Ltd. (Tianjin, China).

2.2. Crystallization Experiments

Cooling Crystallization. A solution of p-AABA at an initial concentration of 0.315 mol/L was first placed in a 100 mL jacketed kettle glass crystallizer (Tianjin EPCA Technology Co., Ltd., Tianjin, China). The temperature in the crystallizer was kept at 323.15 K using a Julabo DYNEO DS refrigerated circulator (JULABO Technology [Beijing] Co., Ltd., Beijing, China) with ±0.01 K temperature accuracy for 30 min to ensure complete solute dissolution. Notably, the temperature in the crystallizer was calibrated using a mercury-in-glass thermometer with a precision of ±0.1 K. Subsequently, the temperature was gradually decreased to 293.15 K using different stirring rates (150, 200, 250, 300, 350, and 400 rpm) with a cooling rate of 0.5 K·min−1. The crystal slurry was filtered, washed, and dried after 40 min of crystallization to obtain p-AABA crystals. Stirring rate was controlled using a digital-display overhead stirrer (RWD50, Shanghai HUXI Industrial Co., Ltd., Shanghai, China) with a rotational rate accuracy of ±1 rpm. Importantly, three replicate experiments were performed under each experimental condition to minimize experimental errors and enhance the reliability of experimental data. In addition, the nucleation moment during the cooling crystallization of p-AABA was monitored using an Easyviewer 100 online image analyzer (Mettler Toledo Technology [China] Co., Ltd., Shanghai, China), and the nucleation temperature was recorded to calculate the system’s supersaturation at this moment. The average of the data obtained from three replicate experiments under the same stirring rate was taken as the final result.
Evaporative Crystallization. A certain amount of methanol and the excess p-AABA solid raw material were added into a screw-neck bottle. The resulting solution was then transferred to a temperature-controlled rotary shaker set at 250 rpm and 298.15 K. The temperature was kept at 298.15 K for 24 h to achieve solid–liquid equilibrium. Then the shaking was stopped, and the solution was kept at a constant temperature for two hours to ensure that any undissolved solids in the solution sank to the bottom. After that, the upper saturated solution was extracted with a preheated syringe and filtered through an organic microporous filtration membrane into a Petri dish. The Petri dish was sealed with cling film, and holes were made on it, and then the Petri dish was placed at room temperature to naturally evaporate the solvent. The single crystal products were collected and dried for further characterization when the single crystal size reached the requirements.
Single-Crystal Growth. The measurement device and method for crystal growth rate reported in reference [32] were employed to measure the growth rates of the {101} and {010} faces of p-AABA in methanol solutions with different supersaturation (σ = 1.01, 1.03, 1.05, and 1.07). Supersaturation was defined as σ = x/x1, where x and x1 represented the actual mole fraction and the mole fraction solubility of p-AABA at a certain temperature, respectively, at a constant temperature of 298.15 K. The experimental temperature was controlled by a Julabo DYNEO DS refrigerated circulator (JULABO Technology [Beijing] Co., Ltd., Beijing, China), and the temperature in the crystallizer was calibrated using a mercury-in-glass thermometer with a precision of ±0.1 K. Three experiments with similar sizes of seeds were conducted to obtain the average growth rate of p-AABA crystals for each experiment.

2.3. Single-Crystal Structure Analysis and Crystal Face Indexing

Single-crystal X-ray diffraction (SCXRD) data of p-AABA was collected using a single X-ray crystal diffractometer (Rigaku MM007 Saturn944+, Tokyo, Japan) under the radiation of Mo Kα palladium (λ = 0.71073 Å) at 113.15 K. Furthermore, the molecular arrangement of p-AABA was explored in detail with Olex2 1.2.7 software. The structure was analyzed by applying the SHELXT structure solver program (using the intrinsic phase method) and refined using the SHELXL refinement package (using the least squares method). Crystallographic data were uploaded to the Cambridge Crystallographic Data Centre (CCDC) under data No. 2416953.
SCXRD was used for crystal face indexing of a single crystal with a particle size of less than 600 μm. The crystal structure information was obtained using a single X-ray crystal diffractometer (Rigaku XtaLAB FR-X, Japan) under the radiation of Mo Kα palladium (λ = 0.71073 Å) at room temperature. The data were collected and used to determine the crystal space group. The videos were captured by CrysAlis Pro 171.43 software along different directions of the crystal, and data reduction and empirical absorption correction were performed to finally obtain the crystal face index.

2.4. Crystal Morphology Analysis

The optical microscope (Olympus U-CMAD3, Olympus Co., Ltd., Tokyo, Japan) was used to observe the crystal morphology of p-AABA by intermittent sampling during the cooling crystallization process.

2.5. Crystal Aspect Ratio Measurement

The aspect ratio (AR) of p-AABA crystals was characterized using the Pixact Crystallography Measurement (PCM) system (Beijing Hafelg Technology Co., Ltd., Beijing, China). The products were dispersed in a saturated solution of p-AABA-methanol, and the image analysis system of the PCM was used to obtain the aspect ratio data of the crystal products. The AR was calculated as shown in Equation (1):
A R = b a
where a is the long side of the crystal, and b is the short side of the crystal.

2.6. Crystal Size Measurement

The Malvern Laser Particle Sizer (MASTER SIZER 3000, Malvern Instruments Ltd., Malvern, UK) was used to determine the particle size of p-AABA crystals. The dispersant of choice for the determination was water.

2.7. Molecular Simulation

All molecular simulations were conducted using Materials Studio 7.0 software, based on the resolved single-crystal data for the simulation. First, the Forcite module was used to perform the Geometry Optimization task, and the COMPASS II force field was selected for primary optimization of the crystal cells by the steepest descent method and secondary optimization by the conjugate gradient method. The theoretical crystal morphology of p-AABA crystals was then predicted using the Growth Morphology model (AE model) in the Morphology module. The molecular arrangement of crystal faces was obtained by using the Cleave Surface function in the Build module. The parameter S was introduced to quantitatively analyze the roughness of crystal faces, and the formula for S is as follows:
S = A a c c A h k l
Here, Aacc is the accessible solvent surface of an {h k l} slice, and Ahkl is the corresponding area of an {h k l} slice. The accessible solvent surface was calculated by Connolly surface modeling.

3. CFD Numerical Simulations

3.1. Physical Model

The three-dimensional (3D) crystallizer model had an inner diameter of 60 mm and a height of 60 mm, the diameter of half-moon paddle was 40 mm, and the distance between the bottom of the paddle and bottom surface of the crystallizer was 10 mm, as depicted in Figure 1a,b. The model of an approximately rectangular two-dimensional (2D) crystal of a single p-AABA in the flow field is shown in Figure 1c. The long side was denoted as a and the short side as b. When the short side was the upstream side, L1 = 15b, L2 = 200a, and L3 = L4 = 15b. When the long side is the upstream side, L1 = 15a, L2 = 200b, and L3 = L4 = 15a. The crystal remained stationary in the flow field while the fluid was in motion. Combined with the experimentally obtained crystal aspect ratios, the crystal aspect ratio was set to 0.350 in simulation.

3.2. Grid Generation for the Models

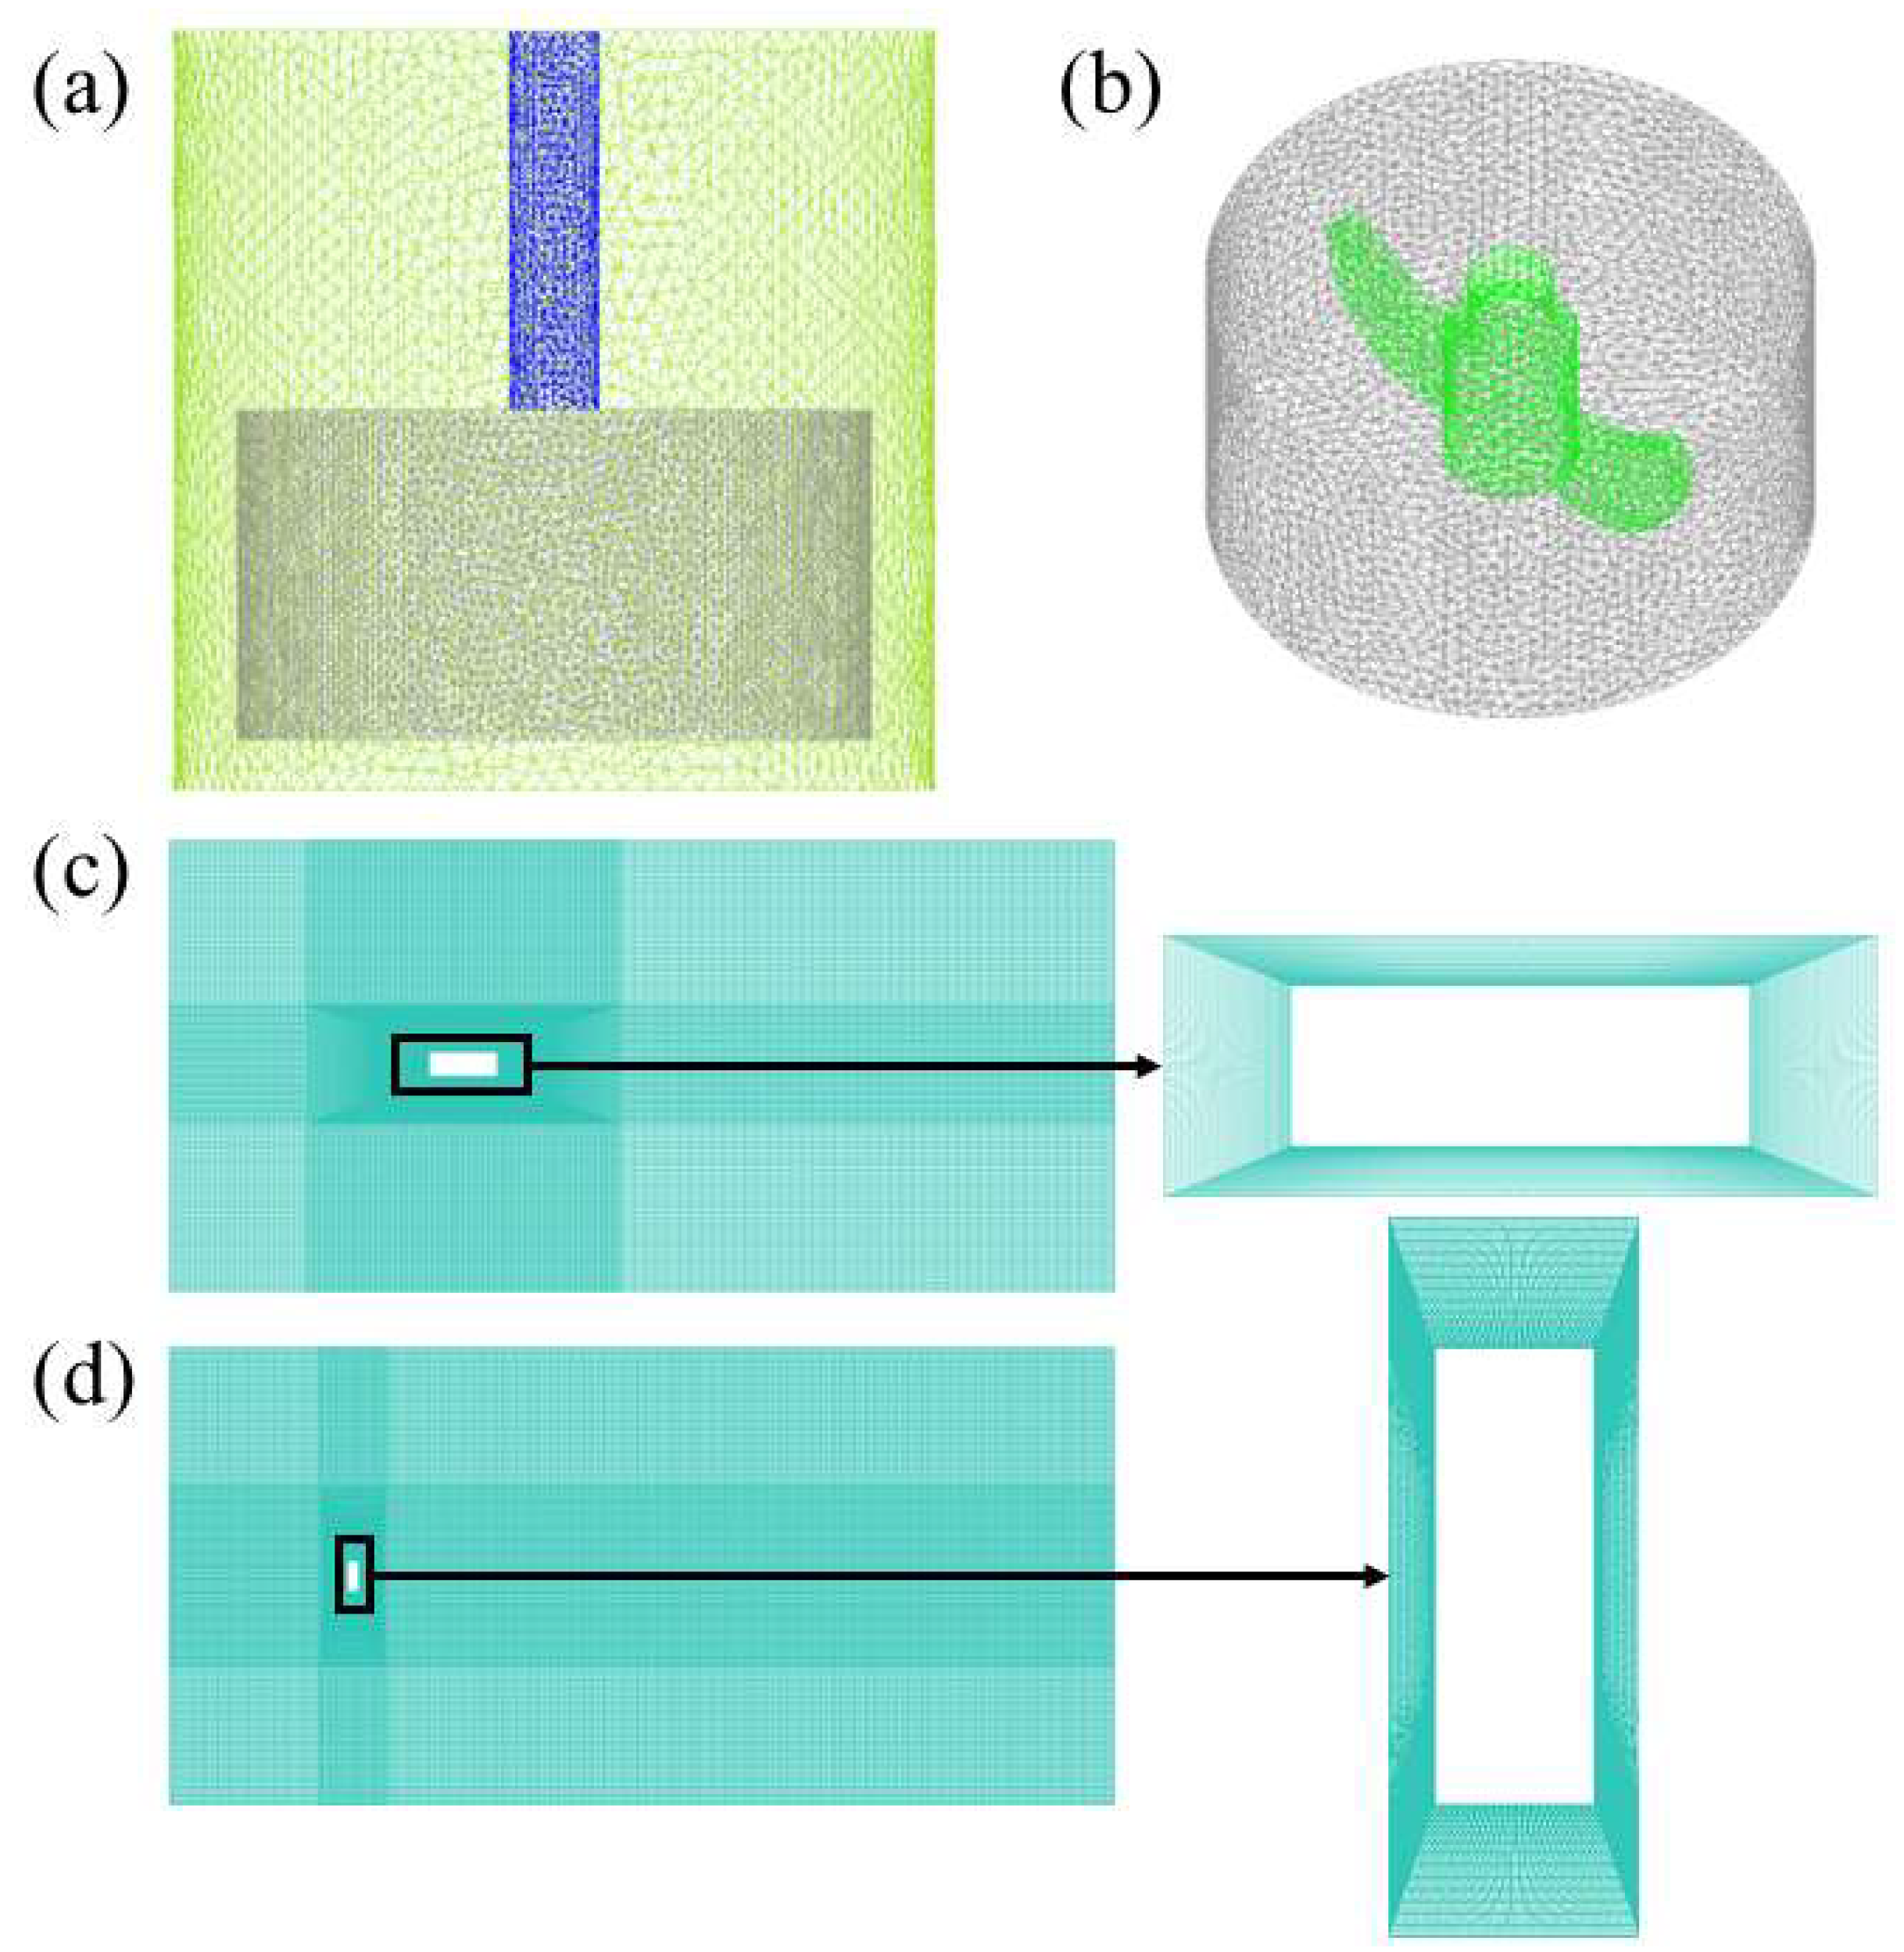
The computational grids shown in Figure 2 were generated by ICEM CFD 15.0 software. For the crystallizer model, unstructured grids were used to delineate both the static and rotational domains. The division effects are shown in Figure 2a,b. A total of five sets of grids were generated for this model, with the number of grids being 510,222, 795,867, 1,077,267, 1,473,638, and 2,071,744, respectively. For all grid sets, the grid quality surpassed 0.41. The velocity distribution at different heights simulated in different grids are shown in Figure S1 (Supporting Information). The simulation results demonstrated that once the number of grids attained 1,077,267, the velocity distribution within the flow field remained substantially invariant, and the grid number had little effect on the flow-field simulation. Considering computational accuracy and computational cost, 1,077,267 grids were selected for subsequent simulations.
In the 2D model, structured grids were employed, and grid refinement was conducted around the crystal. Specifically, the grid size exhibited a gradual transition from a small scale on the crystal surface to a larger scale in the region distant from the crystal. The 2D model was categorized into two scenarios: the case where the short side faced the incoming flow and the case where the long side faced the flow (as depicted in Figure 2c,d). For each scenario, five sets of grids were generated. When the short side faced the flow, the numbers of structured grids were 304,024, 478,200, 660,342, 808,410, and 1,083,955, respectively. In contrast, when the long side faced the flow, the grid numbers were 690,860, 1,034,364, 1,569,600, 2,004,874, and 2,439,184, respectively. The grid quality of all ten sets of grids exceeded 0.90. Based on the variation trend of the velocity distribution’s variation coefficient (CVV) and shear stress with the number of grids, the appropriate number of grids was ultimately determined to be 808,410 when the short side faced the flow and 2,004,874 when the long side faced the flow. The specific content of grid independence validation can be found in Table S3 (Supporting Information).

3.3. Numerical Simulation Settings

3.3.1. Physical Parameters

The physical property parameters are shown in Table 1.
Here, the solution density was measured by the weighing method, and the solution viscosity was determined by an MCR 302 rheometer (Anton Paar Shanghai Trading Co., Ltd., Shanghai, China).

3.3.2. Boundary Conditions

Boundary settings for the 3D numerical simulation of the crystallizer: The bottom surface, wall surface, stirring paddle, and stirring shaft of the crystallizer were defined as Wall. All walls were no-slip walls. The liquid surface was defined as Symmetry. The surface between the static domain and the rotational domain was defined as Interface.
Boundary settings for the 2D model simulation: The basin was set with Velocity Inlet and Pressure Outlet. The upper and lower boundaries were defined as Symmetry. The crystal particle boundary was defined as Wall.

3.3.3. Simulation Methods

The CFD simulation was conducted using ANSYS FLUENT 15.0. Three-dimensional multiphase flow simulations were performed using the Eulerian model, where the primary phase is solution, and the secondary phase is crystalline particles. The particle size was 100 μm. For the turbulence models, the RNG k-ε model and the dispersed model were selected. The Syamlal–O’Brien model and the Lun et al. model were employed to calculate the granular viscosity and the granular bulk viscosity, respectively. Regarding the interphase drag force model, the Syamlal–O’Brien model was adopted. The effect of the gravitational field was considered, where the Y-axis was designated as the positive direction, and the gravitational acceleration was set to −9.81 m·s−2. For the coupling of velocity and pressure, the Coupled algorithm was utilized. Meanwhile, the First Order Upwind scheme was applied to the momentum, volume fraction, turbulent kinetic energy, and turbulent dissipation rate.
The Reynolds number (Re) of crystal particles in the flow field was calculated using Equation (3).
R e = ρ d V μ
Here, ρ is the fluid density, μ is the fluid viscosity, d is the characteristic length of the crystal, and V is the relative velocity between the crystal and the fluid.
The Reynolds number of crystal particles in the 2D flow field ranged from 1.4 to 65.5. Based on the criteria for determining the Reynolds number of particle motion, a flow is regarded as laminar when the Reynolds number is less than 2, turbulent when it exceeds 500, and transitional when it falls within the range of 2 to 500 [33]. Consequently, in this work, the laminar flow model was employed when Re < 2. When 2 < Re < 500, the Standard k-omega turbulence model was adopted, with the low-Re-corrections activated. For the coupling strategy between velocity and pressure, the SIMPLEC algorithm was selected.

3.4. Calculation Method of Boundary Layer Thickness

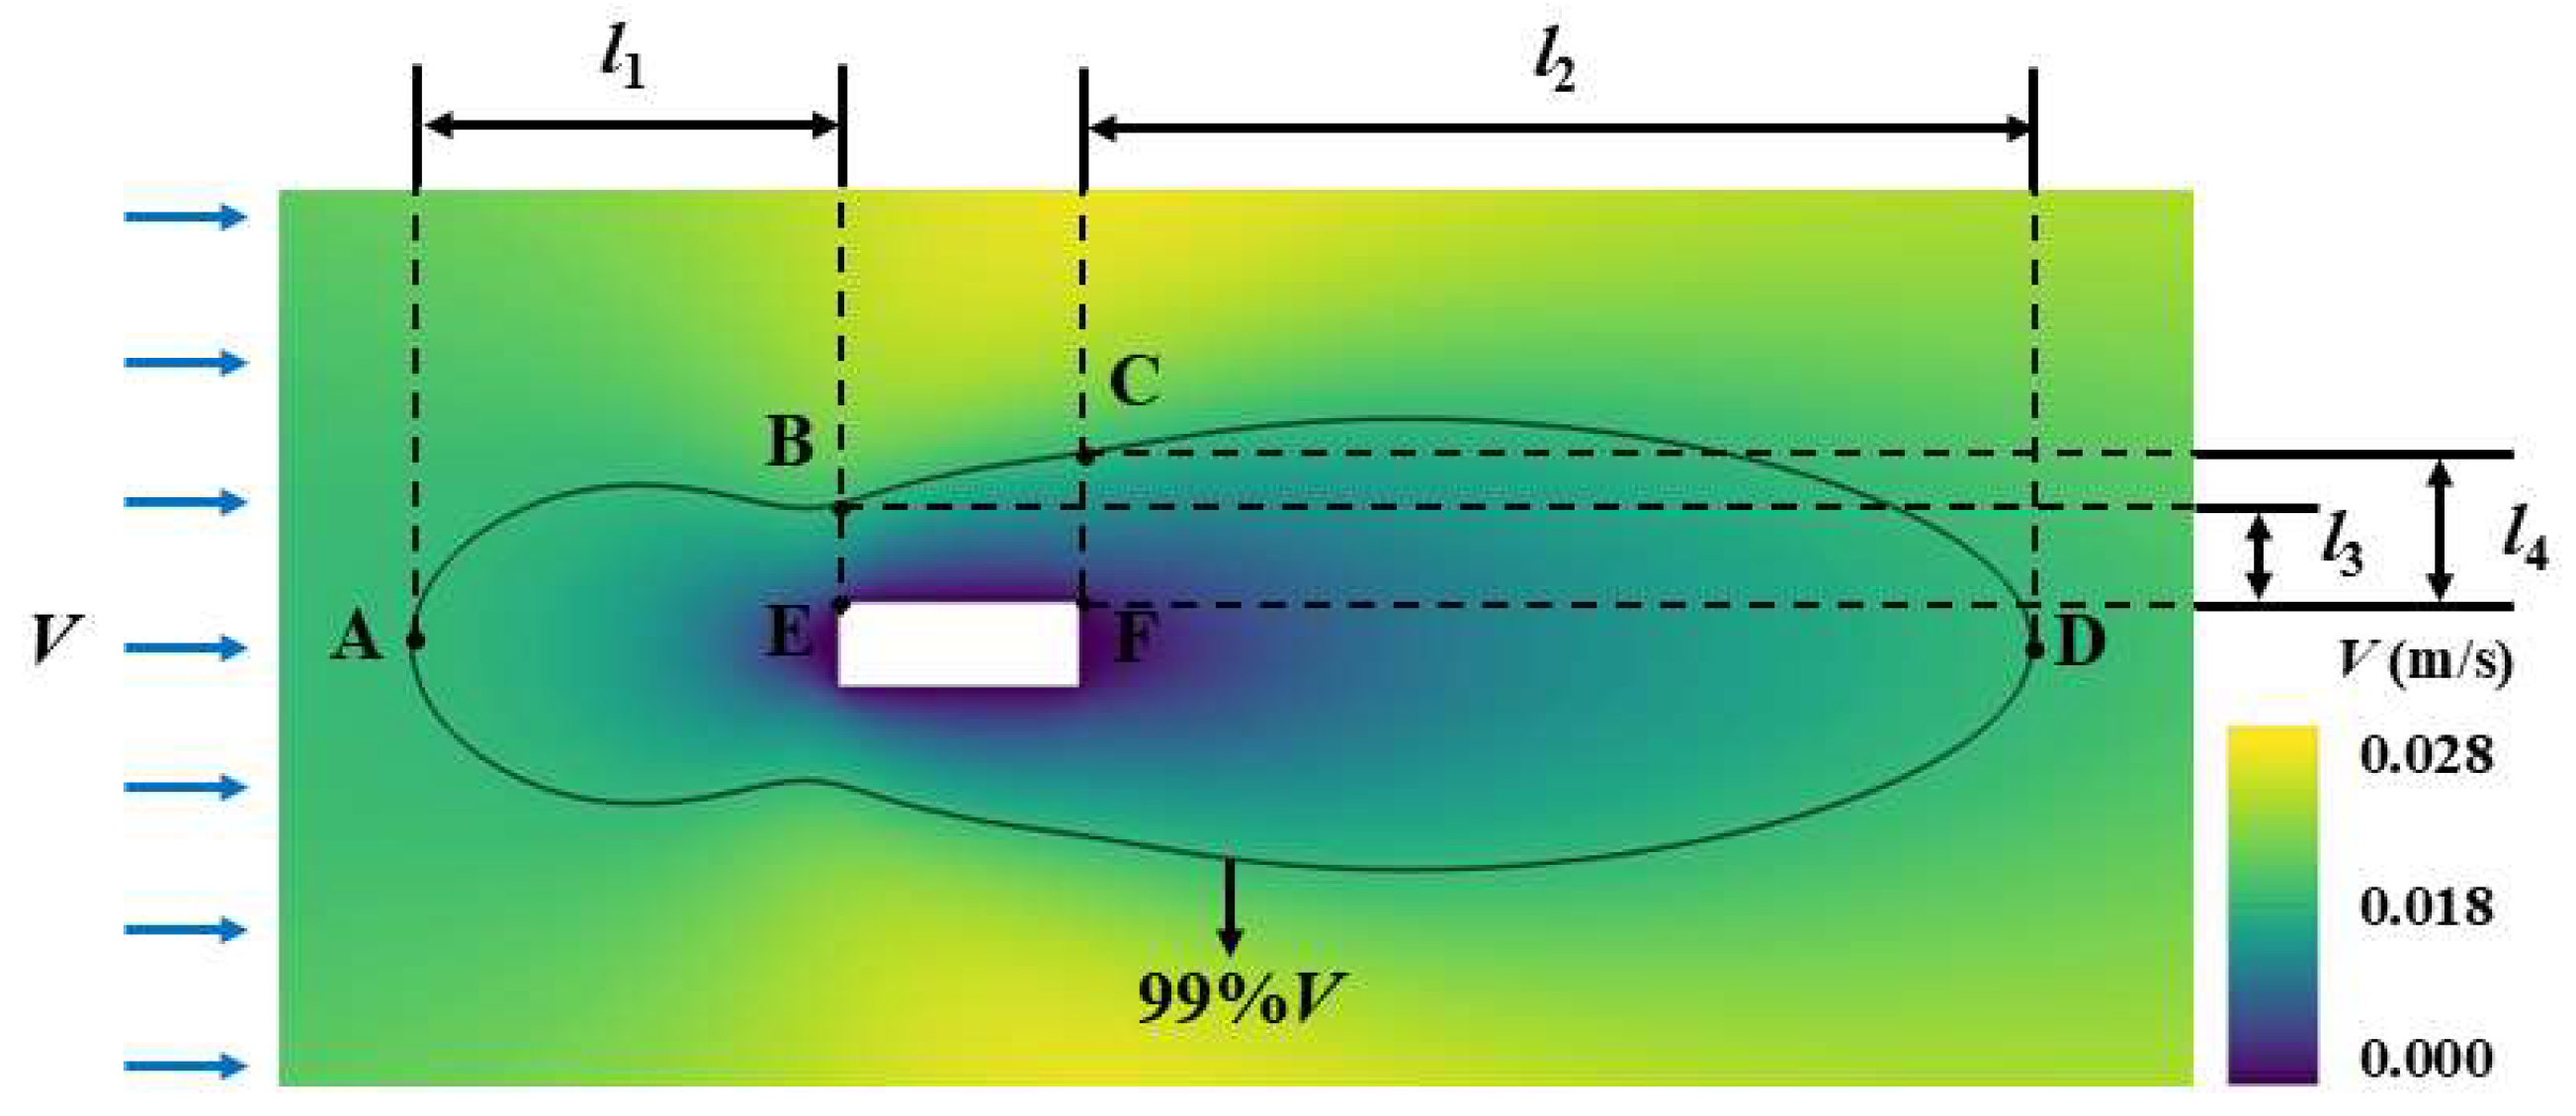
The flow boundary layer thickness (δ) around the crystal in the 2D simulation was measured using the post-processing software Tecplot 360. The Contour module was set to display the velocity contour lines within the flow field, and the 99% contour line of the free-stream velocity was precisely determined. On this velocity contour line, the coordinates of points A, B, C, and D, as well as the crystal corner points E and F, were accurately identified. Thereafter, the lengths of l1, l2, l3, and l4 were calculated (as illustrated in Figure 3). The average boundary layer thickness (δ1) on the upstream edge (UE) and downstream edge (DE) was approximately calculated as (l1 + l2)/2. Meanwhile, the boundary layer thickness (δ2) on the along-stream edge (AE) was approximated as (l3 + l4)/2.

4. Results and Discussion

4.1. Crystal Face Indexing and Crystal Habit Simulation

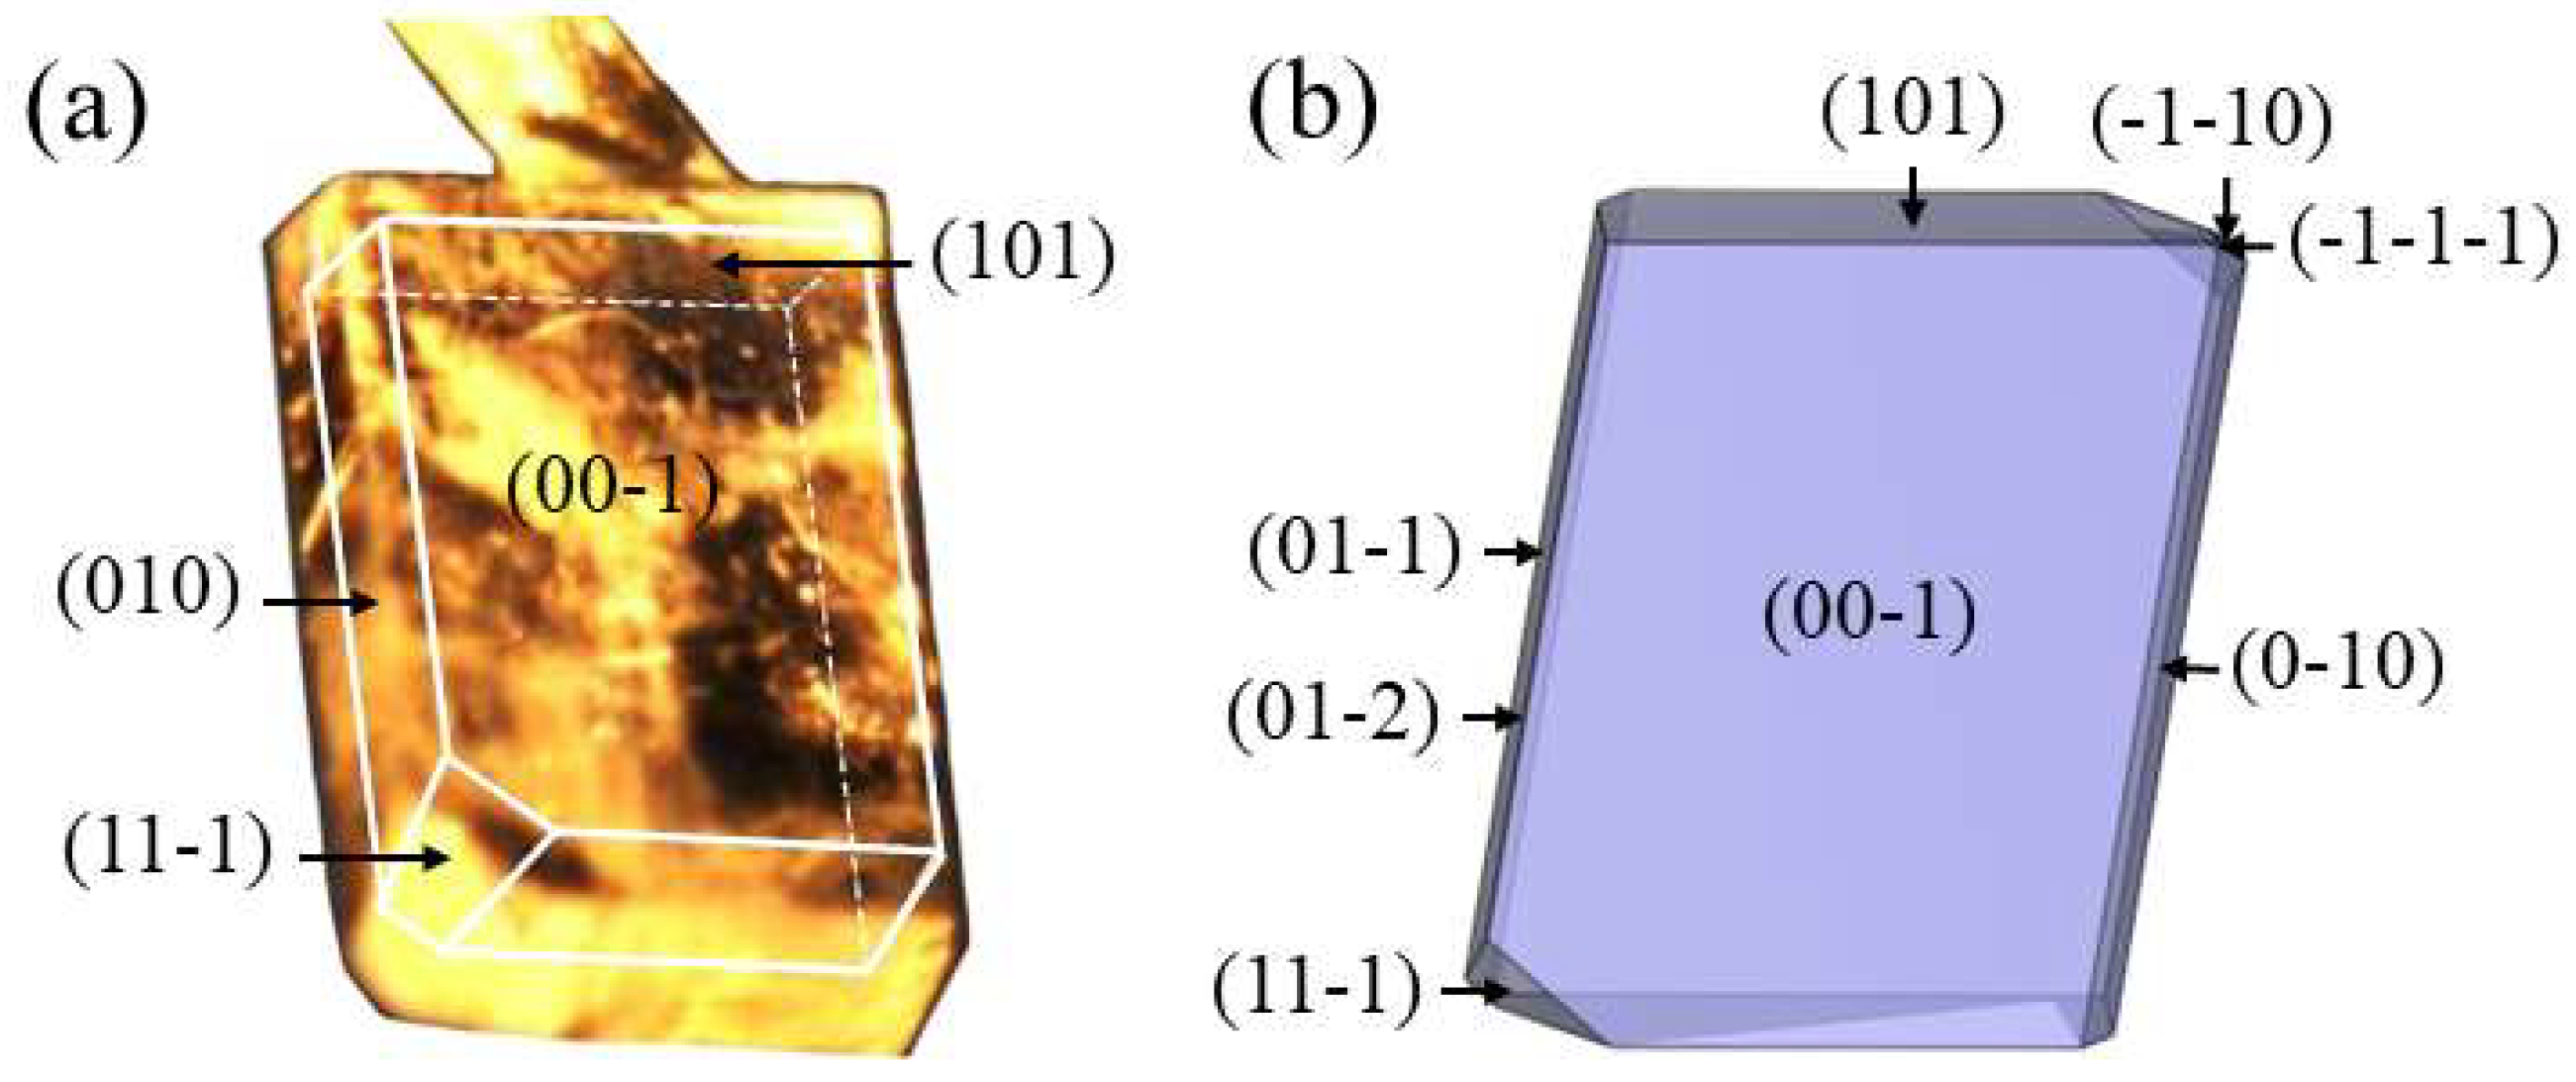
The p-AABA single crystal obtained from experimental cultivation and the crystal face indices are shown in Figure 4a. The results of single-crystal analysis show that the p-AABA crystal belongs to the triclinic crystal system with the space group of P-1 and lattice parameters a = 5.0225 Å, b = 6.8406 Å, c = 12.2434 Å, α = 89.438°, β = 80.288°, and γ = 79.242°. The specific content of p-AABA crystal structure data can be found in Table S1 (Supporting Information).
Based on the single-crystal structure data, the crystal morphology of p-AABA was predicted by the AE model, as presented in Figure 4b. A comparison reveals that the morphology of the experimentally cultivated single crystal is similar to that predicted by the MS simulation, with the crystal exhibiting a plate-like rectangle. However, the {01-1}, {01-2}, {110}, and {111} faces in the simulated morphology were absent in the actual crystal. This can be ascribed to the differences between the theoretical simulation and the actual process. Among the crystal faces, the growth of the {101} and {010} faces was found to determine the aspect ratio of p-AABA, rendering these two faces the focal points of this study.
The {101} and {010} faces were cleaved to analyze the molecular arrangements on these faces. Table S2 lists the calculated S values by the Connolly surface model (depicted in blue grid in Figure S2), and the crystal structures of the {101} and {010} faces are also shown in Figure S2 (Supporting Information). The results indicated that the {010} face exhibited a higher roughness compared to the {101} face owing to the disparity in molecular arrangement. The exposure of polar carboxyl groups on the {010} face facilitated the adsorption of polar solvent molecules. With the adsorption sites being occupied, solute molecules encountered difficulties in adsorbing to the {010} face. Consequently, the growth rate of the {010} face was lower than that of the {101} face. N-H…O and C-H…O hydrogen bonds, in concert with van der Waals interactions, jointly contributed to the growth of p-AABA crystals along the [101] direction. Simultaneously, O-H…O and C-H…O hydrogen bonds, together with van der Waals forces, dominated the crystal growth along the [010] direction. The adsorption energies of the {101} and {010} faces were calculated to be −3.789 × 101 kcal·mol−1 and −3.767 × 101 kcal·mol−1, respectively, and the interplanar spacings dhkl were 4.722 Å and 7.009 Å, respectively. The stronger solute molecular adsorption on the {101} face and the closer molecular arrangement in the [101] direction theoretically resulted in the growth rate of the {101} face being higher than that of the {010} face. Hence, during the formation of long plate-like p-AABA crystals, the {101} face, which had a faster growth rate, became the short-side face, while the {010} face corresponded to the long-side face.

4.2. Stirring Effect on Crystal Morphology

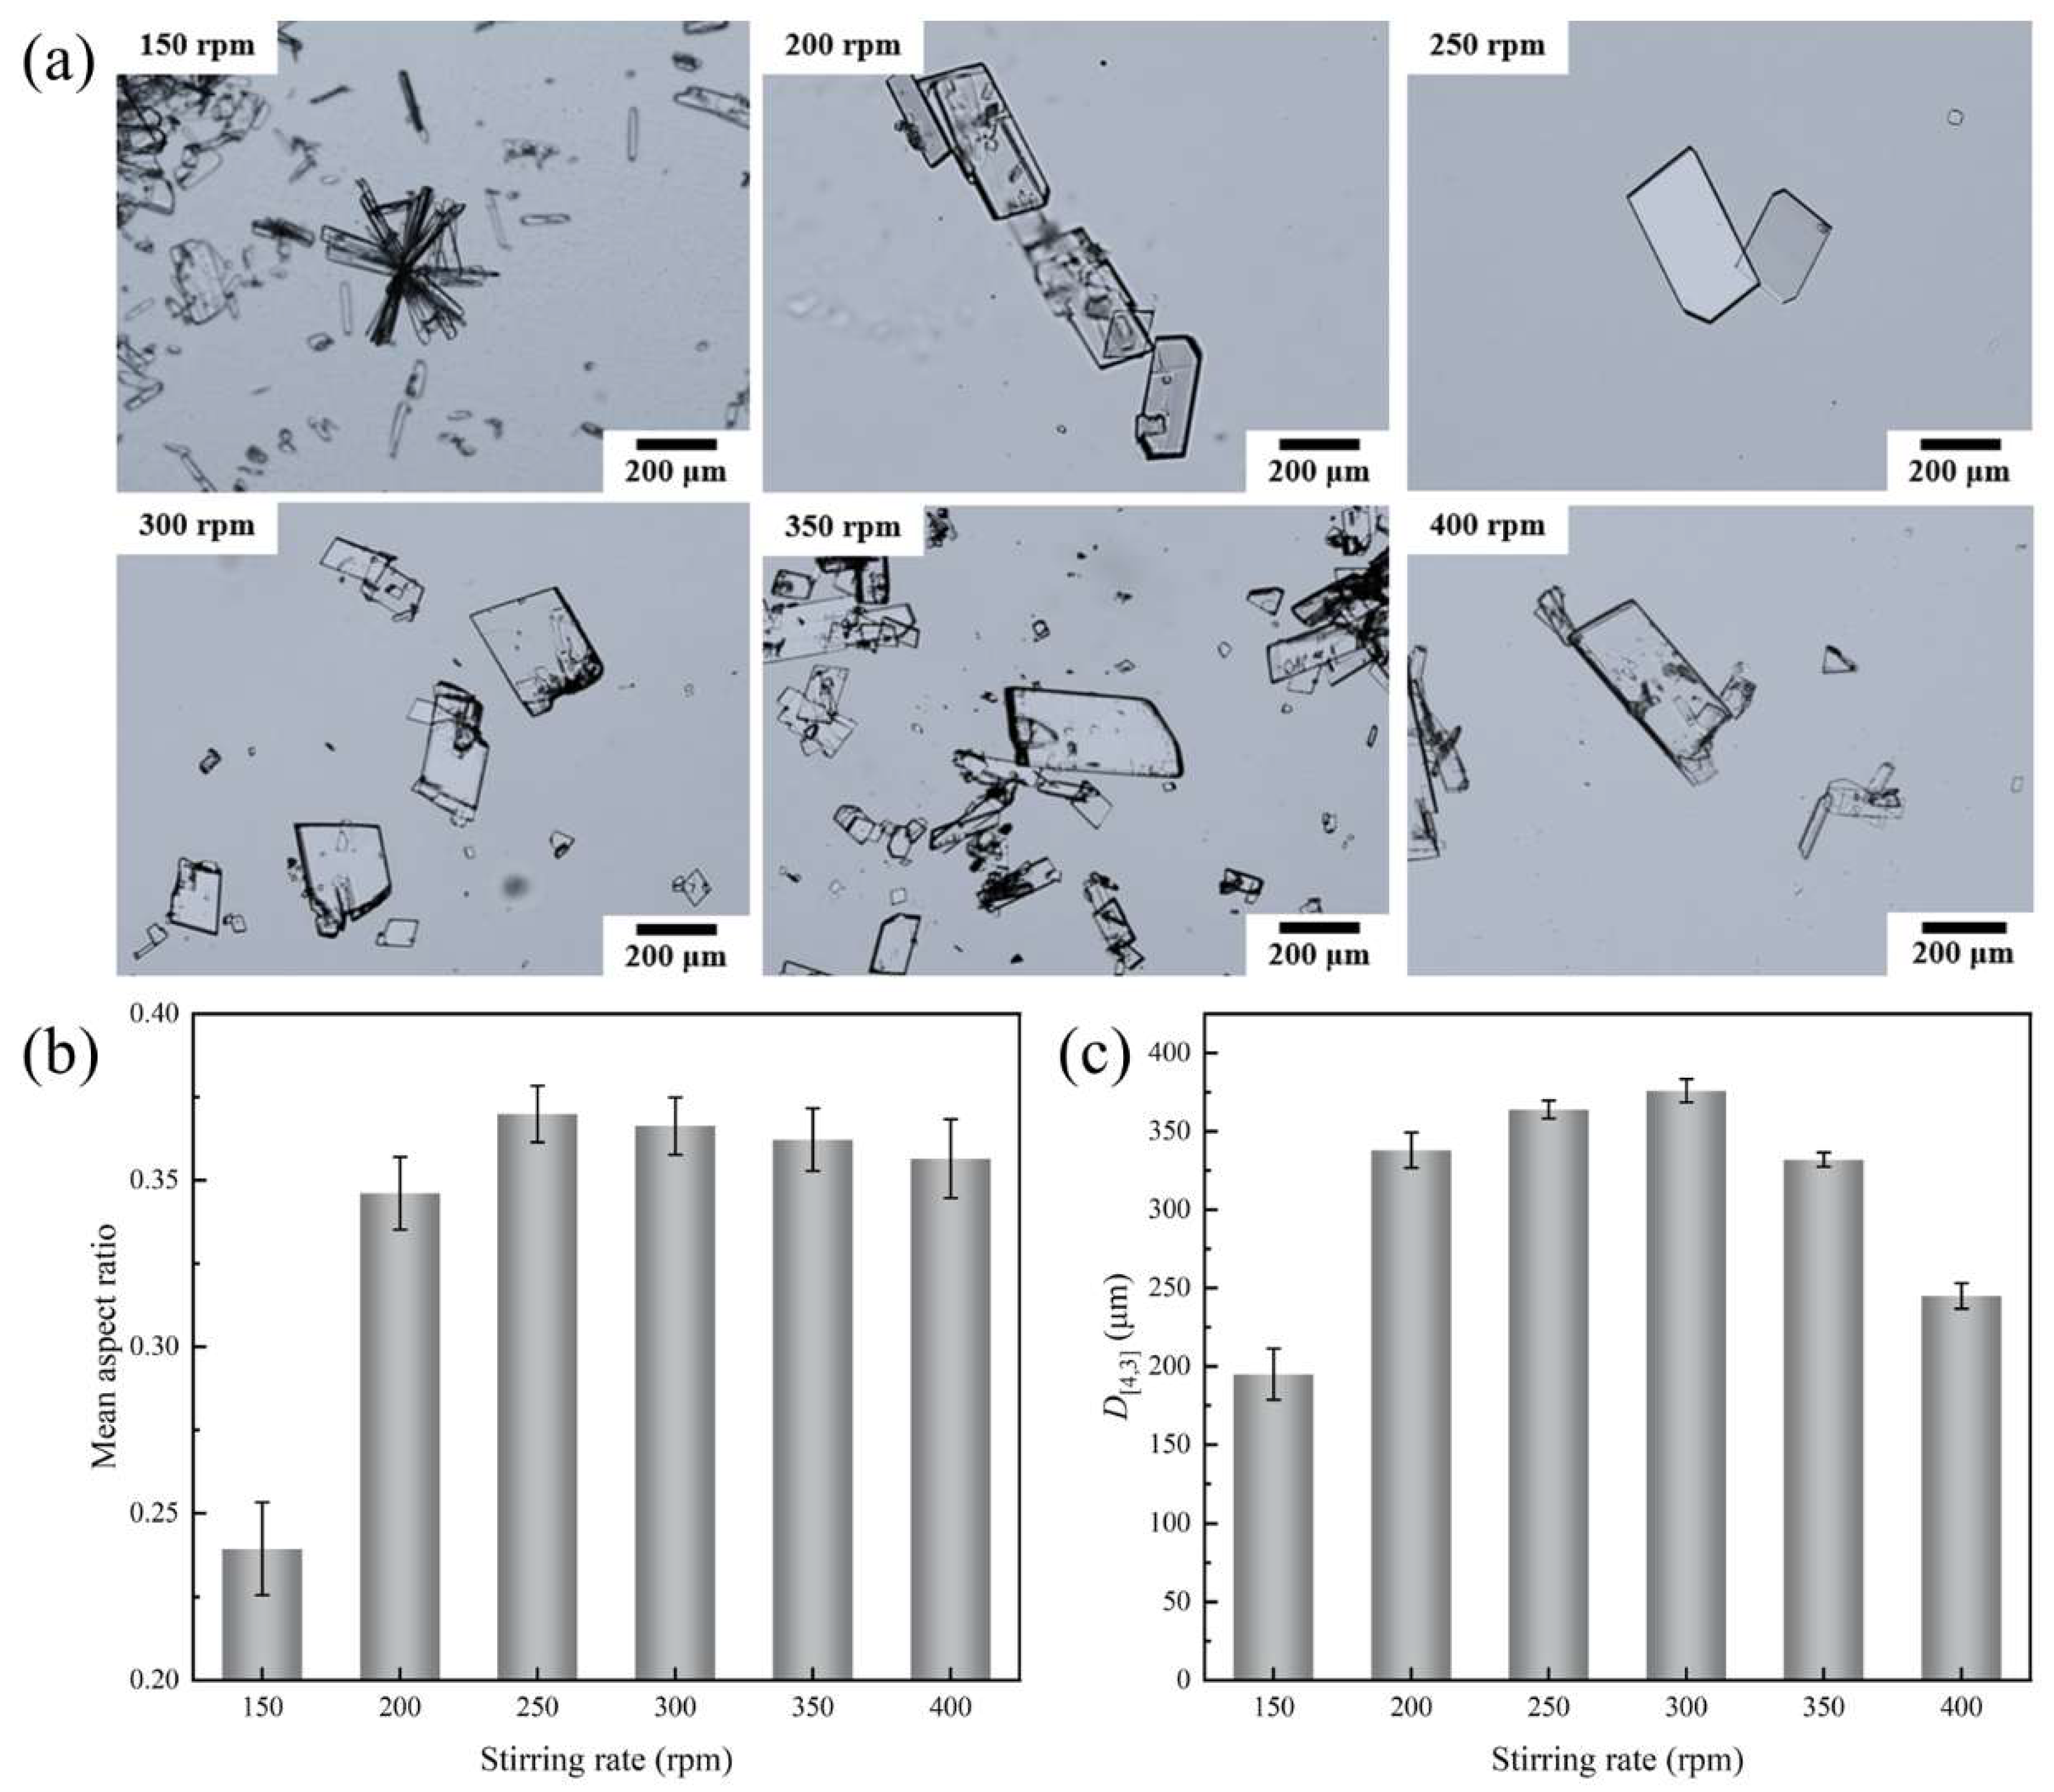
Optical microscopy images of p-AABA crystals obtained from cooling crystallization (Figure 5a) show that the stirring rate significantly affects the crystal morphology. When the stirring rate was 150 rpm, the crystals were long-plate form, and obvious aggregation was observed. At 200 rpm and 250 rpm, the aspect ratio of the crystals increased to some extent, and the aggregation phenomenon basically disappeared. At 300 rpm, 350 rpm, and 400 rpm, there was no crystal aggregation, but obvious crystal fragments appeared. It can be seen that a too-low stirring rate led to crystal aggregation and a relatively small aspect ratio. Although a too-high stirring rate could increase the aspect ratio, it caused crystal fragmentation, and the crystal fragmentation mainly occurred on the short-side faces.
The crystal aspect ratios at different stirring rates were statistically analyzed using the PCM, and the results are shown in Figure 5b. The corresponding crystal aspect ratios were 0.239, 0.346, 0.370, 0.366, 0.362, and 0.357 at stirring rates of 150 rpm, 200 rpm, 250 rpm, 300 rpm, 350 rpm, and 400 rpm, respectively. It can be observed that the crystal aspect ratios initially increased rapidly as the stirring rate increased, and then decreased gradually, reaching a peak at 250 rpm. This trend of first increasing and then decreasing differed from the trend reported in the literature [34], where the aspect ratio decreased with an increase in the stirring rate.
As can be observed from Figure 5c, the average particle size of the crystals (D [4,3]) exhibited a trend of first increasing and then decreasing with the increase in the stirring rate. Specifically, when the stirring rate increased from 150 rpm to 300 rpm, D[4,3] increased from 195 μm to 376 μm. Subsequently, when the stirring rate exceeded 300 rpm, the average particle size started to decline. When the stirring rate was raised to 400 rpm, D[4,3] decreased to 245 μm. The particle size distribution (PSD) and coefficient of variation (CVPSD) at different stirring rates are shown in Figure S3 and Table S4 (Supporting Information). At 150 rpm, crystal aggregation led to a narrow PSD with a low CVPSD of 5.819 × 10⁻¹. Increasing stirring rates enhanced fluid flow, dispersed crystal aggregation, and broadened PSD. Further increasing the stirring rate to 300–400 rpm exacerbated shear-induced fragmentation, resulting in a significantly broader PSD with CVPSD up to 8.213 × 10⁻¹.
In conclusion, the stirring process exerted a significant effect on the morphology of p-AABA crystals, including aspects such as aggregation, fragmentation, aspect ratio, particle size, and PSD.

4.3. Reasons for the Stirring Effect on Crystal Morphology

4.3.1. Stirring Effect on Crystal Nucleation and Growth

The effect of stirring on crystal morphology is determined by a combination of mechanisms. At the microscopic level, stirring impacts crystal nucleation and the growth of crystals [35,36]. At the macroscopic level, it affects the crystal fragmentation process within the flow field where the crystals are located [37,38]. In this section, we focus on analyzing the effect of the stirring rate on crystal nucleation and growth to elucidate its effect on crystal aggregation and the crystal aspect ratio.
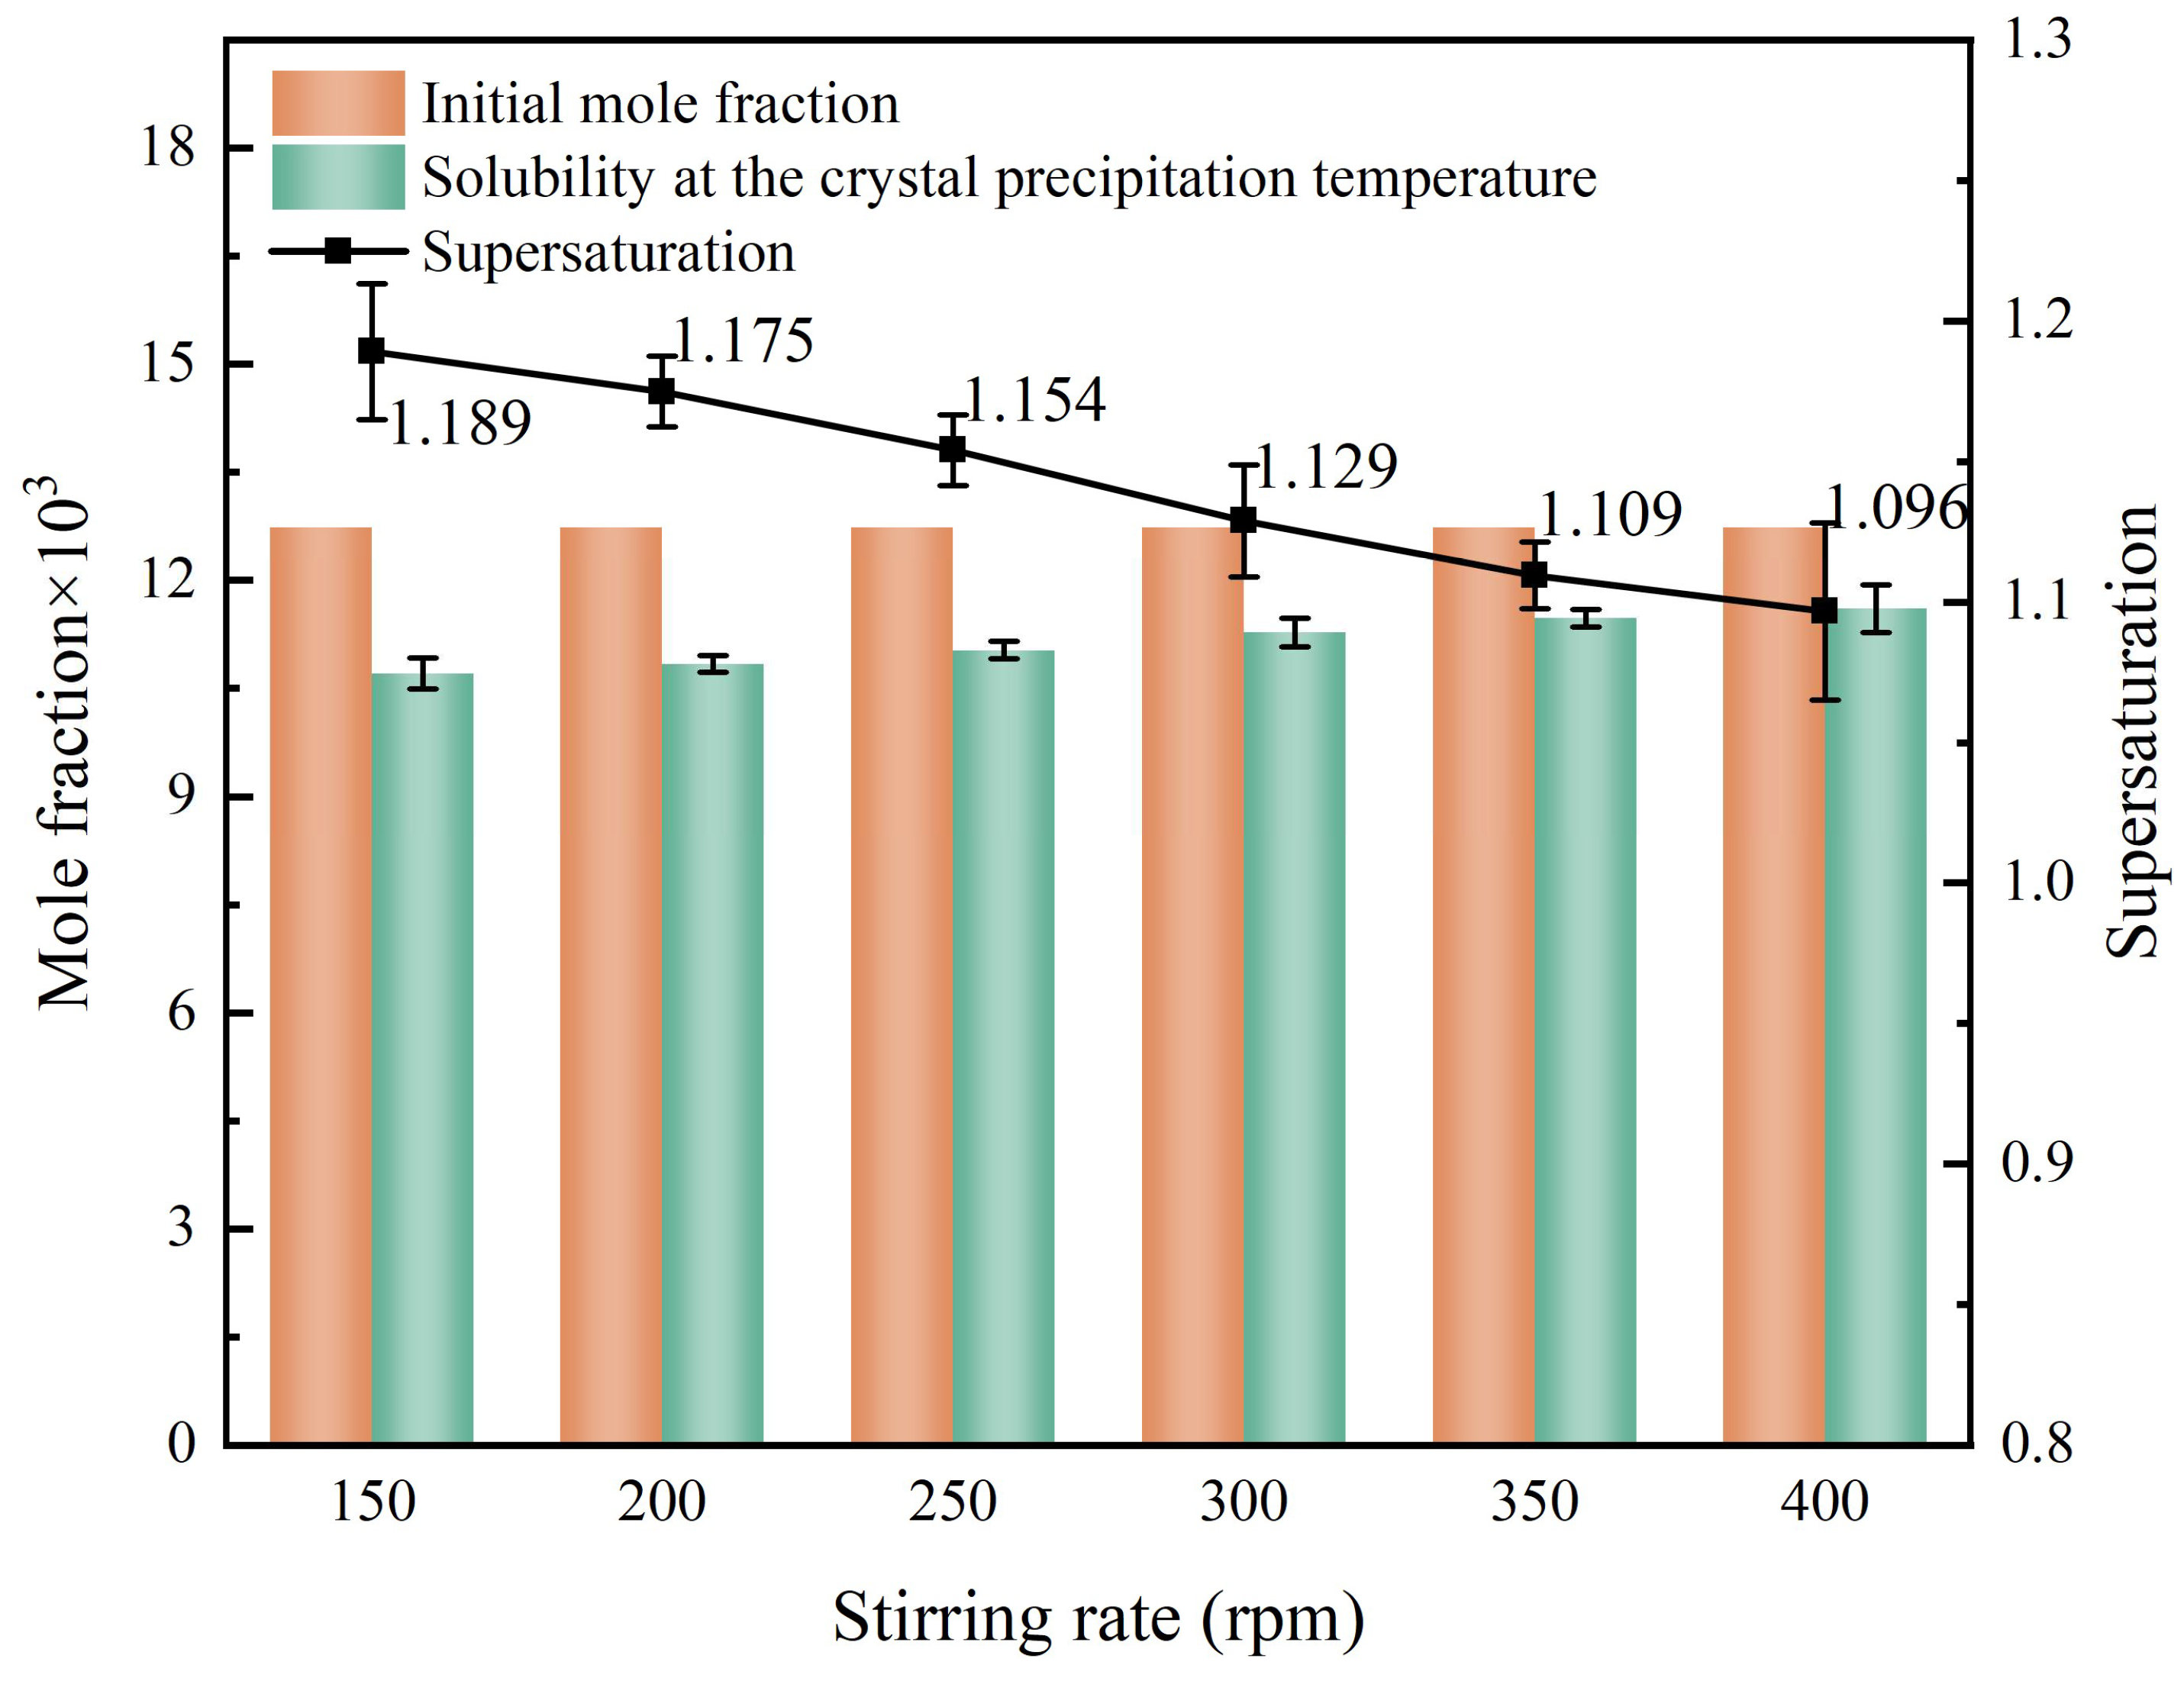
The solution supersaturation at the nucleation moment under different stirring rates is shown in Figure 6. The results indicated that the nucleation supersaturation decreased from 1.189 to 1.096 with the rising stirring rate. As the stirring rate rises, the collision probability among solute molecules in the solution increases. This phenomenon facilitates the formation of crystal nuclei by a greater number of cluster molecules [39]. Simultaneously, the increased stirring rate enhances the heat-transfer process, effectively promoting the diffusion of heat generated during the crystallization phase transition [40]. Therefore, a higher stirring rate corresponds to a lower supersaturation at the nucleation moment.
According to the classical nucleation theory [41], during the crystallization process, both the nucleation rate and the size of the nuclei are closely related to the supersaturation. A higher supersaturation corresponds to a higher nucleation rate and a smaller nucleus size; conversely, a lower supersaturation leads to a lower nucleation rate and a larger nucleus size. In this study, when the stirring rate was 150 rpm, the supersaturation at the moment of nucleation reached 1.189. This relatively high supersaturation gave rise to a higher nucleation rate and a smaller nucleus size. As a result, fine crystals tended to adhere to each other due to their large specific surface area and high surface energy, which, in turn, led to particle aggregation [42]. When the stirring rate was greater than or equal to 200 rpm, the supersaturation at the nucleation moment decreased compared with that at 150 rpm. As a result, the nucleation rate decreased, the nucleus size increased, and the crystal aggregation phenomenon basically disappeared.
The crystal nuclei can further grow in the supersaturated solution. In order to analyze the variation of the aspect ratio of p-AABA crystals with respect to the stirring rate, the growth rates of the {101} and {010} faces of p-AABA in different unstirred supersaturated solutions were determined. The fitted relationship between the normal distance along the crystal surface and time is plotted in Figure S4 (Supporting Information), and the fitted results showed a good linear relationship. The relationship between the supersaturation and the crystal growth rate is shown in Figure 7. Experiments indicated that the growth rates of the {101} and {010} faces (G101 and G010) exhibited a good exponential relationship with the supersaturation, and the regression coefficients (R2) exceeded 0.99. At the same supersaturation, the growth rate of the {101} face was significantly higher than that of the {010} face, and the ratio of the two growth rates (G101/G010) increased as the supersaturation increased. Under the experimental conditions, when σ = 1.01, the G101/G010 value exceeded 4.4. This suggested that in the absence of stirring, a higher supersaturation corresponded to higher growth rates for both the {101} and {010} faces. Moreover, the growth rate of the {101} face increased significantly more than that of the {010} face. This phenomenon led to an increase in the ratio of the length corresponding to the short-side face {101} to the width corresponding to the long-side face {010}. In other words, the aspect ratio increased as the supersaturation during the crystallization process decreased. This conclusion aligned with the trend observed in Figure 5b and Figure 6, where, under a low stirring rate (≤250 rpm), the crystal aspect ratio increased as the supersaturation at the nucleation moment decreased. The aspect ratio of single crystals obtained through static culture was approximately 0.730, and the supersaturation during single crystal cultivation was close to 1. In summary, it was evident that under non-stirring conditions, the lower the supersaturation, the higher the aspect ratio of p-AABA crystals.
However, as illustrated in Figure 5b, when the stirring rate attained or surpassed 300 rpm, the actual crystal aspect ratio gradually exhibited a slow decreasing trend. This situation transpired notwithstanding the decrease in the supersaturation at the nucleation moment with the increase in the stirring rate. This phenomenon deviated from the theoretically postulated trend of the kinetic modeling for crystal growth under unstirred conditions. The principal reason for this lay in the fact that stirring modified the crystal face growth rate and exposed the face to fluid shear, which is further discussed in Section 4.3.2.
The results shown in Figure 5c indicated that the average crystal size initially increased and subsequently decreased as the stirring rate rose. This phenomenon was primarily associated with the crystal nucleus size at nucleation, crystal growth, and stirring-induced fragmentation. When the extent of agitation-induced crystal fragmentation was relatively small (stirring rate ≤ 300 rpm), the supersaturation at the nucleation moment decreased as the stirring rate increased (Figure 6). This corresponded to a reduction in the nucleation rate and an increase in the size of the crystal nuclei. At this stage, the number of nuclei was limited, and the particle size was large. As a result, more solutes in the crystallization solution were available for crystal growth. Consequently, the average particle size of the crystals increased with the rising stirring rate. Conversely, when the stirring rate was excessively high (>300 rpm), crystal fragmentation became pronounced, leading to a substantial decrease in it. The detailed effect of stirring on crystal fragmentation is elaborated in Section 4.3.3.

4.3.2. Stirring Effect on Crystal Boundary

In the local flow field of a 3D crystallizer, a velocity difference between crystals and fluid can change the crystal boundary layer thickness and the flow field shear on crystals, thus influencing crystal morphology. Macroscopically, the trajectories of crystals and fluid in the stirred solution are complex. As we focus on the effect of the stirring rate on the crystal aspect ratio, the relative motion between p-AABA crystals and fluid can be simplified to a 2D flow between a rectangular p-AABA crystal and a planar fluid within the p-AABA crystal size range.
The crystal face indices obtained from the experiments and crystal habit results from MS showed that in CFD simulations, the short edge of the rectangular crystal model corresponded to the {101} face, and the long edge corresponded to the {010} face. In 2D space, there are diverse scenarios for the relative motion between p-AABA crystals and planar fluids. It means that there are various angles between the edges of the 2D rectangular crystals and the incoming flow lines. To investigate the variation of the p-AABA crystal aspect ratio, we considered only two cases: the {010} face facing the incoming flow and the {101} face facing the incoming flow.
Hydrodynamics in a 3D crystallizer is highly complex with notable spatial variations, especially near stirring paddles. Intense turbulence and stirring lead to high fluid velocities. Solid-particle motion is affected by forces like gravitational settling and shear stresses, which causes velocity disparities between solid and liquid phases. Consequently, in this study, the free-coming velocity in the 2D simulation was defined as the mathematical average of velocity differences within the range of 0.2 to 1 times the maximum velocity difference between solid and liquid phases. The 2D simulated liquid velocities at different stirring rates are shown in Table 2.
The results of impact force, shear stress, and rotational moment on the crystals at the same stirring rate for the {010} and {101} faces facing the incoming flow are shown in Table 3. At three selected stirring rates, the impact force on the crystals, the shear stress on AEs, and the rotational moments of the crystals were significantly greater when the {010} face faced the incoming flow than when the {101} face did. Previous studies [43] have shown that the rotation and orientation behavior of particles in the flow field depend on the particle shape. The rod-shaped particles with a smaller aspect ratio are more likely to align their long axes with the flow direction. When the {101} face faced the incoming flow, the crystals underwent less resistance from the fluid and were subjected to fewer rotational moments and smaller shear stresses. Based on these findings, subsequent in-depth analysis focused solely on the crystal boundary conditions under the scenario where the {101} face faced the incoming flow.
The diagrams of the flow boundary layer under different stirring rates are shown in Figure S5 (Supporting Information), and the specific values of the boundary layer thickness are listed in Table 2. It can be observed that when the {101} face was oriented towards the flow, as the stirring rate increased from 150 rpm to 400 rpm, the flow boundary layer (δ1) of the {101} face gradually increased from 2.145 mm to 4.697 mm. Meanwhile, the flow boundary layer (δ2) of the {010} face gradually decreased from 1.393 × 10⁻¹ mm to 2.934 × 10⁻² mm. The crystal growth process is typically divided into two stages: the transfer of solute from the bulk of the crystallization solution to the crystal face, and the reaction of solute molecules on the crystal face [44]. Among these, the solute transfer rate, affecting the crystal growth rate, is closely associated with the thickness of the concentration boundary layer on the crystal face.
Generally, the concentration and flow boundary layers change in the same trend as the fluid flow changes, and for most liquids, the size of the concentration boundary layer is smaller than that of the flow boundary layer [45,46]. Based on the intrinsic connection between the flow and concentration boundary layers, 2D simulations of p-AABA crystals demonstrated that the stirring rate affected the concentration boundary layer thickness on the {101} and {010} faces, thereby influencing their relative growth rates. From the simulated flow boundary layer thickness data, we inferred the following: As the stirring rate increased, the concentration boundary layer of the {101} face thickened, causing the solute mass-transfer rate on the crystal face to slow down. In contrast, the concentration boundary layer of the {010} face thinned, which accelerated the solute mass-transfer rate. Theoretically, this stirring-induced growth rate trend increased the aspect ratio of p-AABA crystals as the stirring rate increased, which was consistent with the aspect ratio trend at a stirring rate ≤ 250 rpm in Figure 5b.
However, at an excessively high stirring rate, the situation changes. The shearing force exerted by the fluid on the crystal faces generates a driving force that repels solute molecules from the faces, and the excessive stirring may make this force exceed the solute-crystal adhesion force, reducing the crystal growth rate. Table 2 presents the average shear stress data of the {101} and {010} faces at different stirring rates. The data indicated that as the stirring rate increased, the average shear stress on both faces tended to rise. Under the simulation conditions, the {010} face generally had a higher average shear stress than the {101} face. Combined with the MS simulation results (detailed in Section 4.1), the {010} face had lower adsorption energy, a significantly larger interplanar spacing, and higher surface roughness (S = 2.191) than the {101} face (S = 1.230). Taking these factors into consideration, at higher stirring rates, the adsorption of solute molecules on the {010} face was more severely impeded, and the growth rate of the {010} face decreased, accounting for the slow decrease in the aspect ratio of p-AABA crystals at high stirring rates, as shown in Figure 5b.

4.3.3. Stirring Effect on Crystal Fragmentation

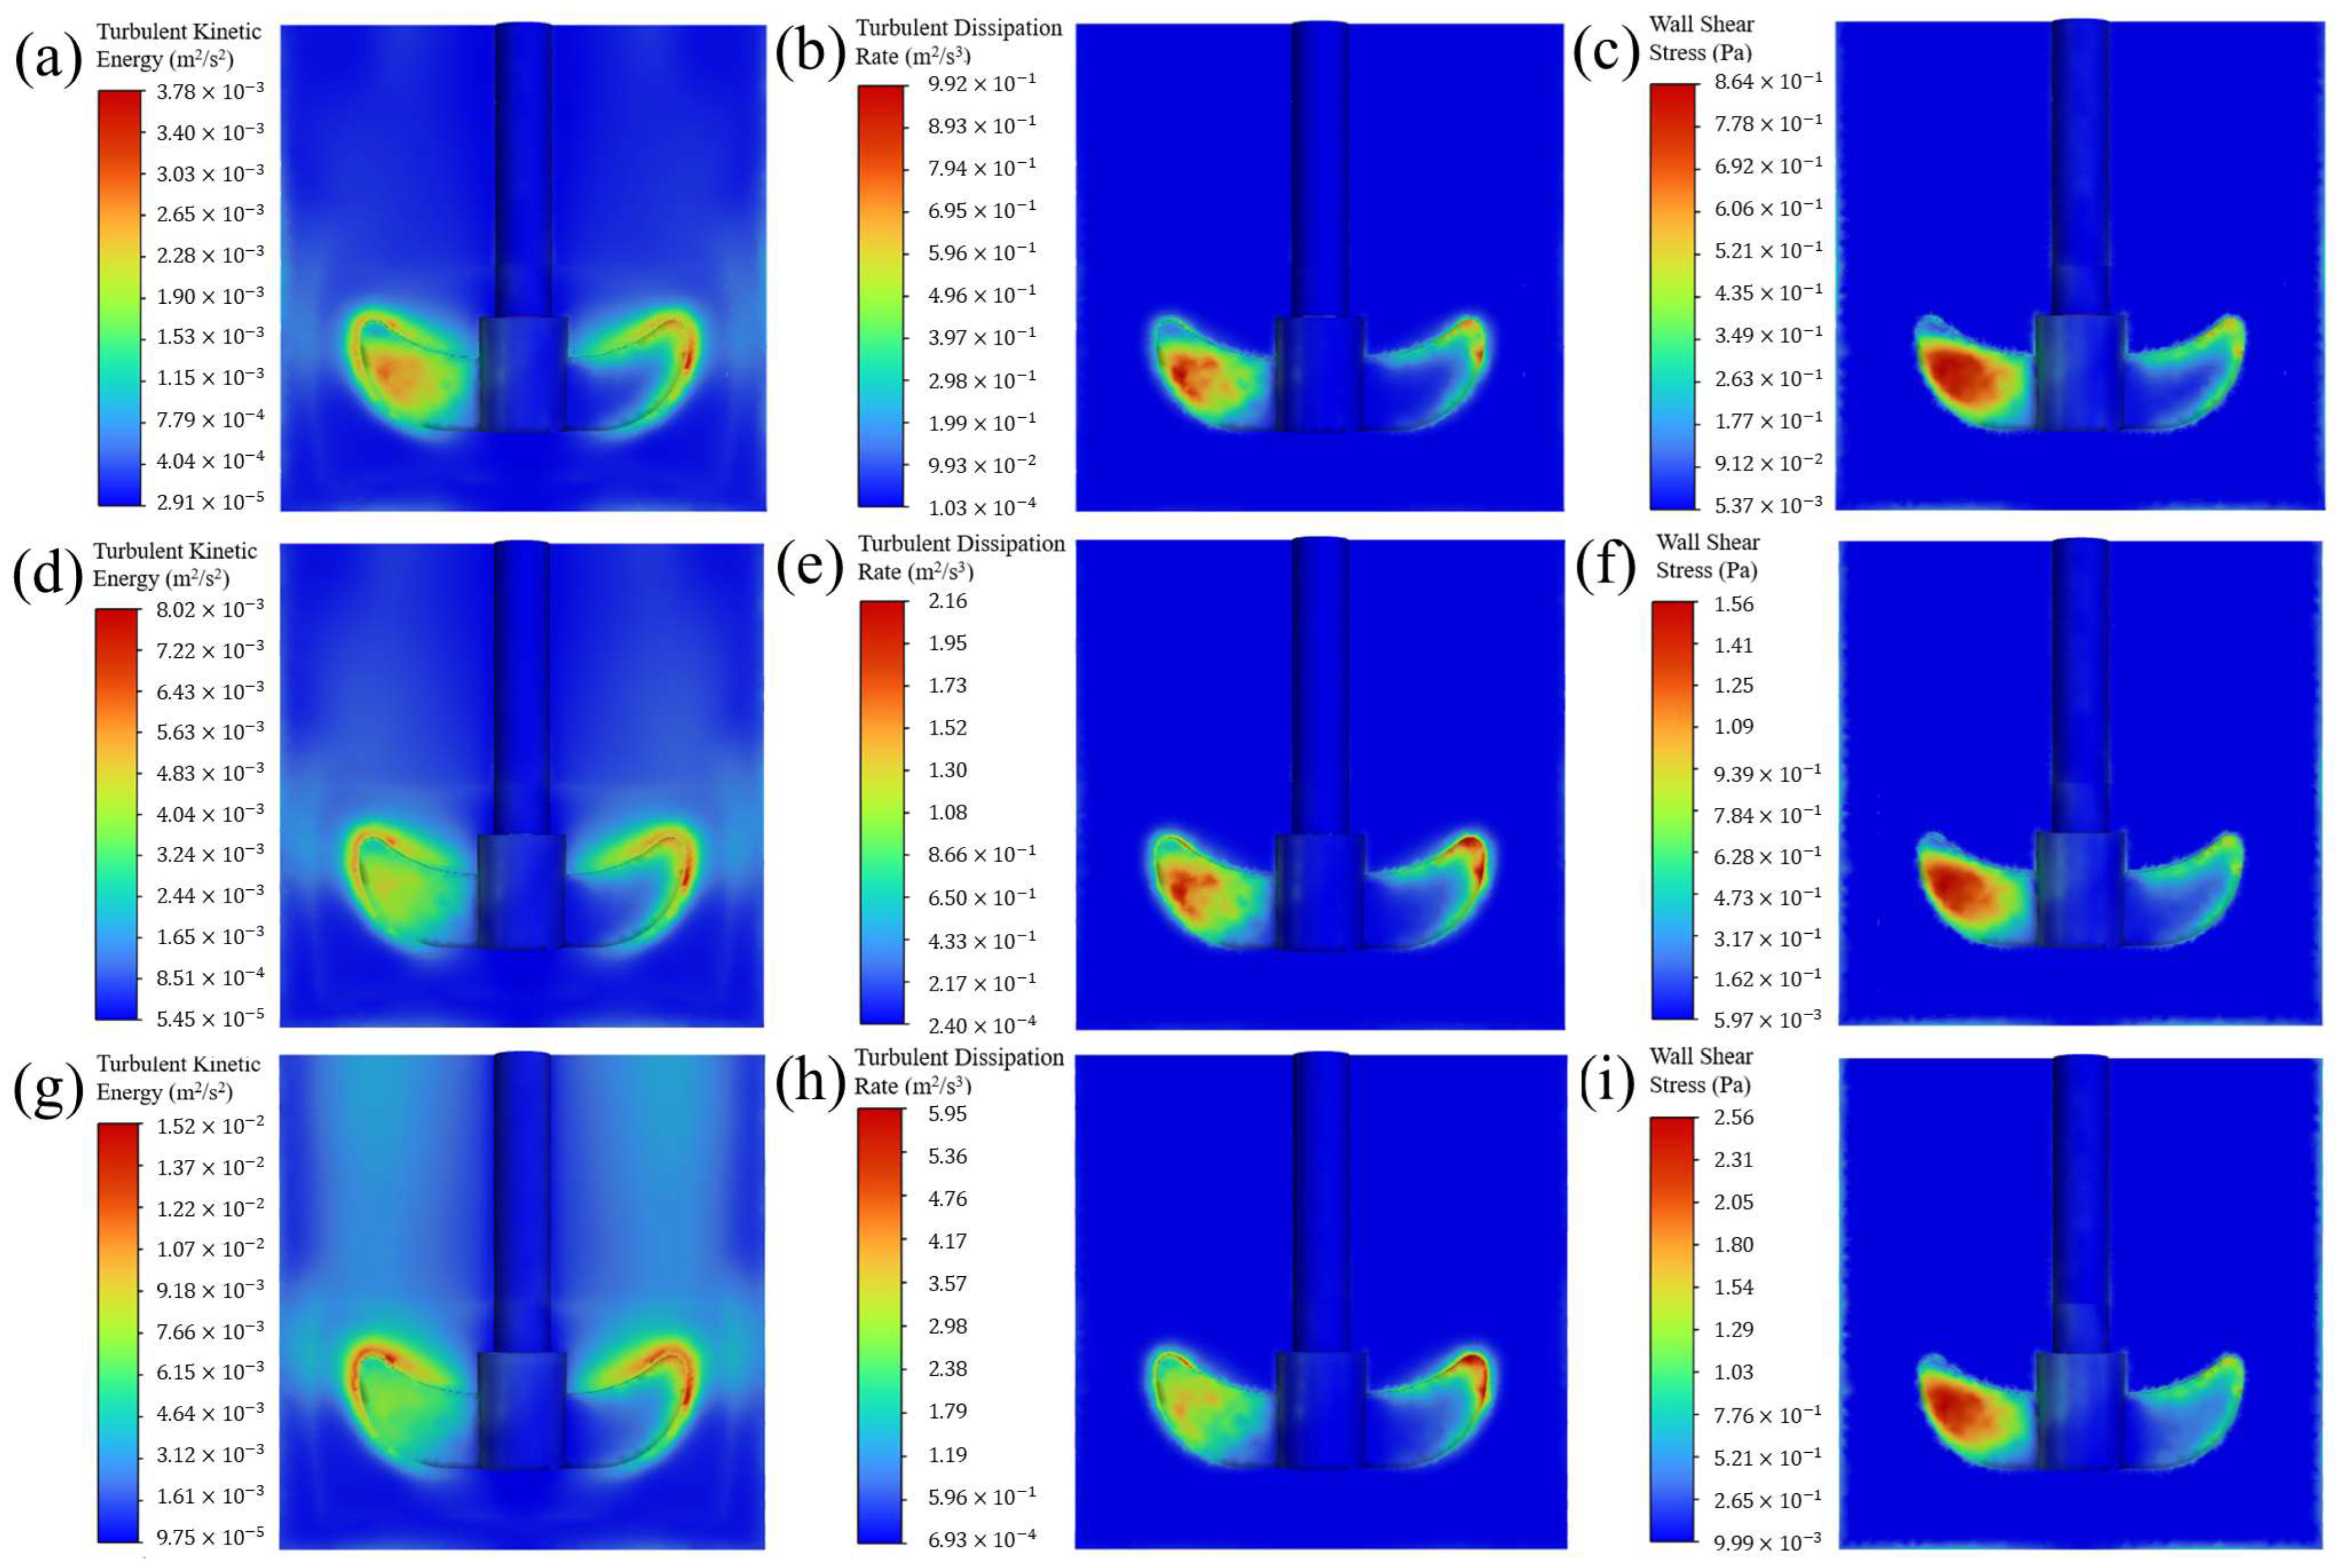
At high stirring rates, crystal fragmentation-triggered secondary growth can significantly impact crystal morphology [38,47], which is consistent with the experimental phenomenon in this study (Figure 5a). Figure 8 shows the distribution of turbulent kinetic energy (k), turbulent dissipation rate (ε), and wall shear stress (WSS) in the 3D crystallizer at three stirring rates. Table 4 presents the average values of k, ε, and WSS in the paddle region. It is evident from the graphical data that k, ε, and WSS in the paddle region tended to increase as the stirring rate increased. This indicated that an increase in the stirring rate would lead to more collisions and fragmentation of p-AABA crystals in the stirring paddle region, which was consistent with the experimental results in Figure 5a. Meanwhile, an excessively high stirring rate led to more crystal breakage, which, in turn, caused a decrease in the average crystal size. This phenomenon was consistent with the trend of the average size change at high stirring rates (350 rpm and 400 rpm) in Figure 5c.
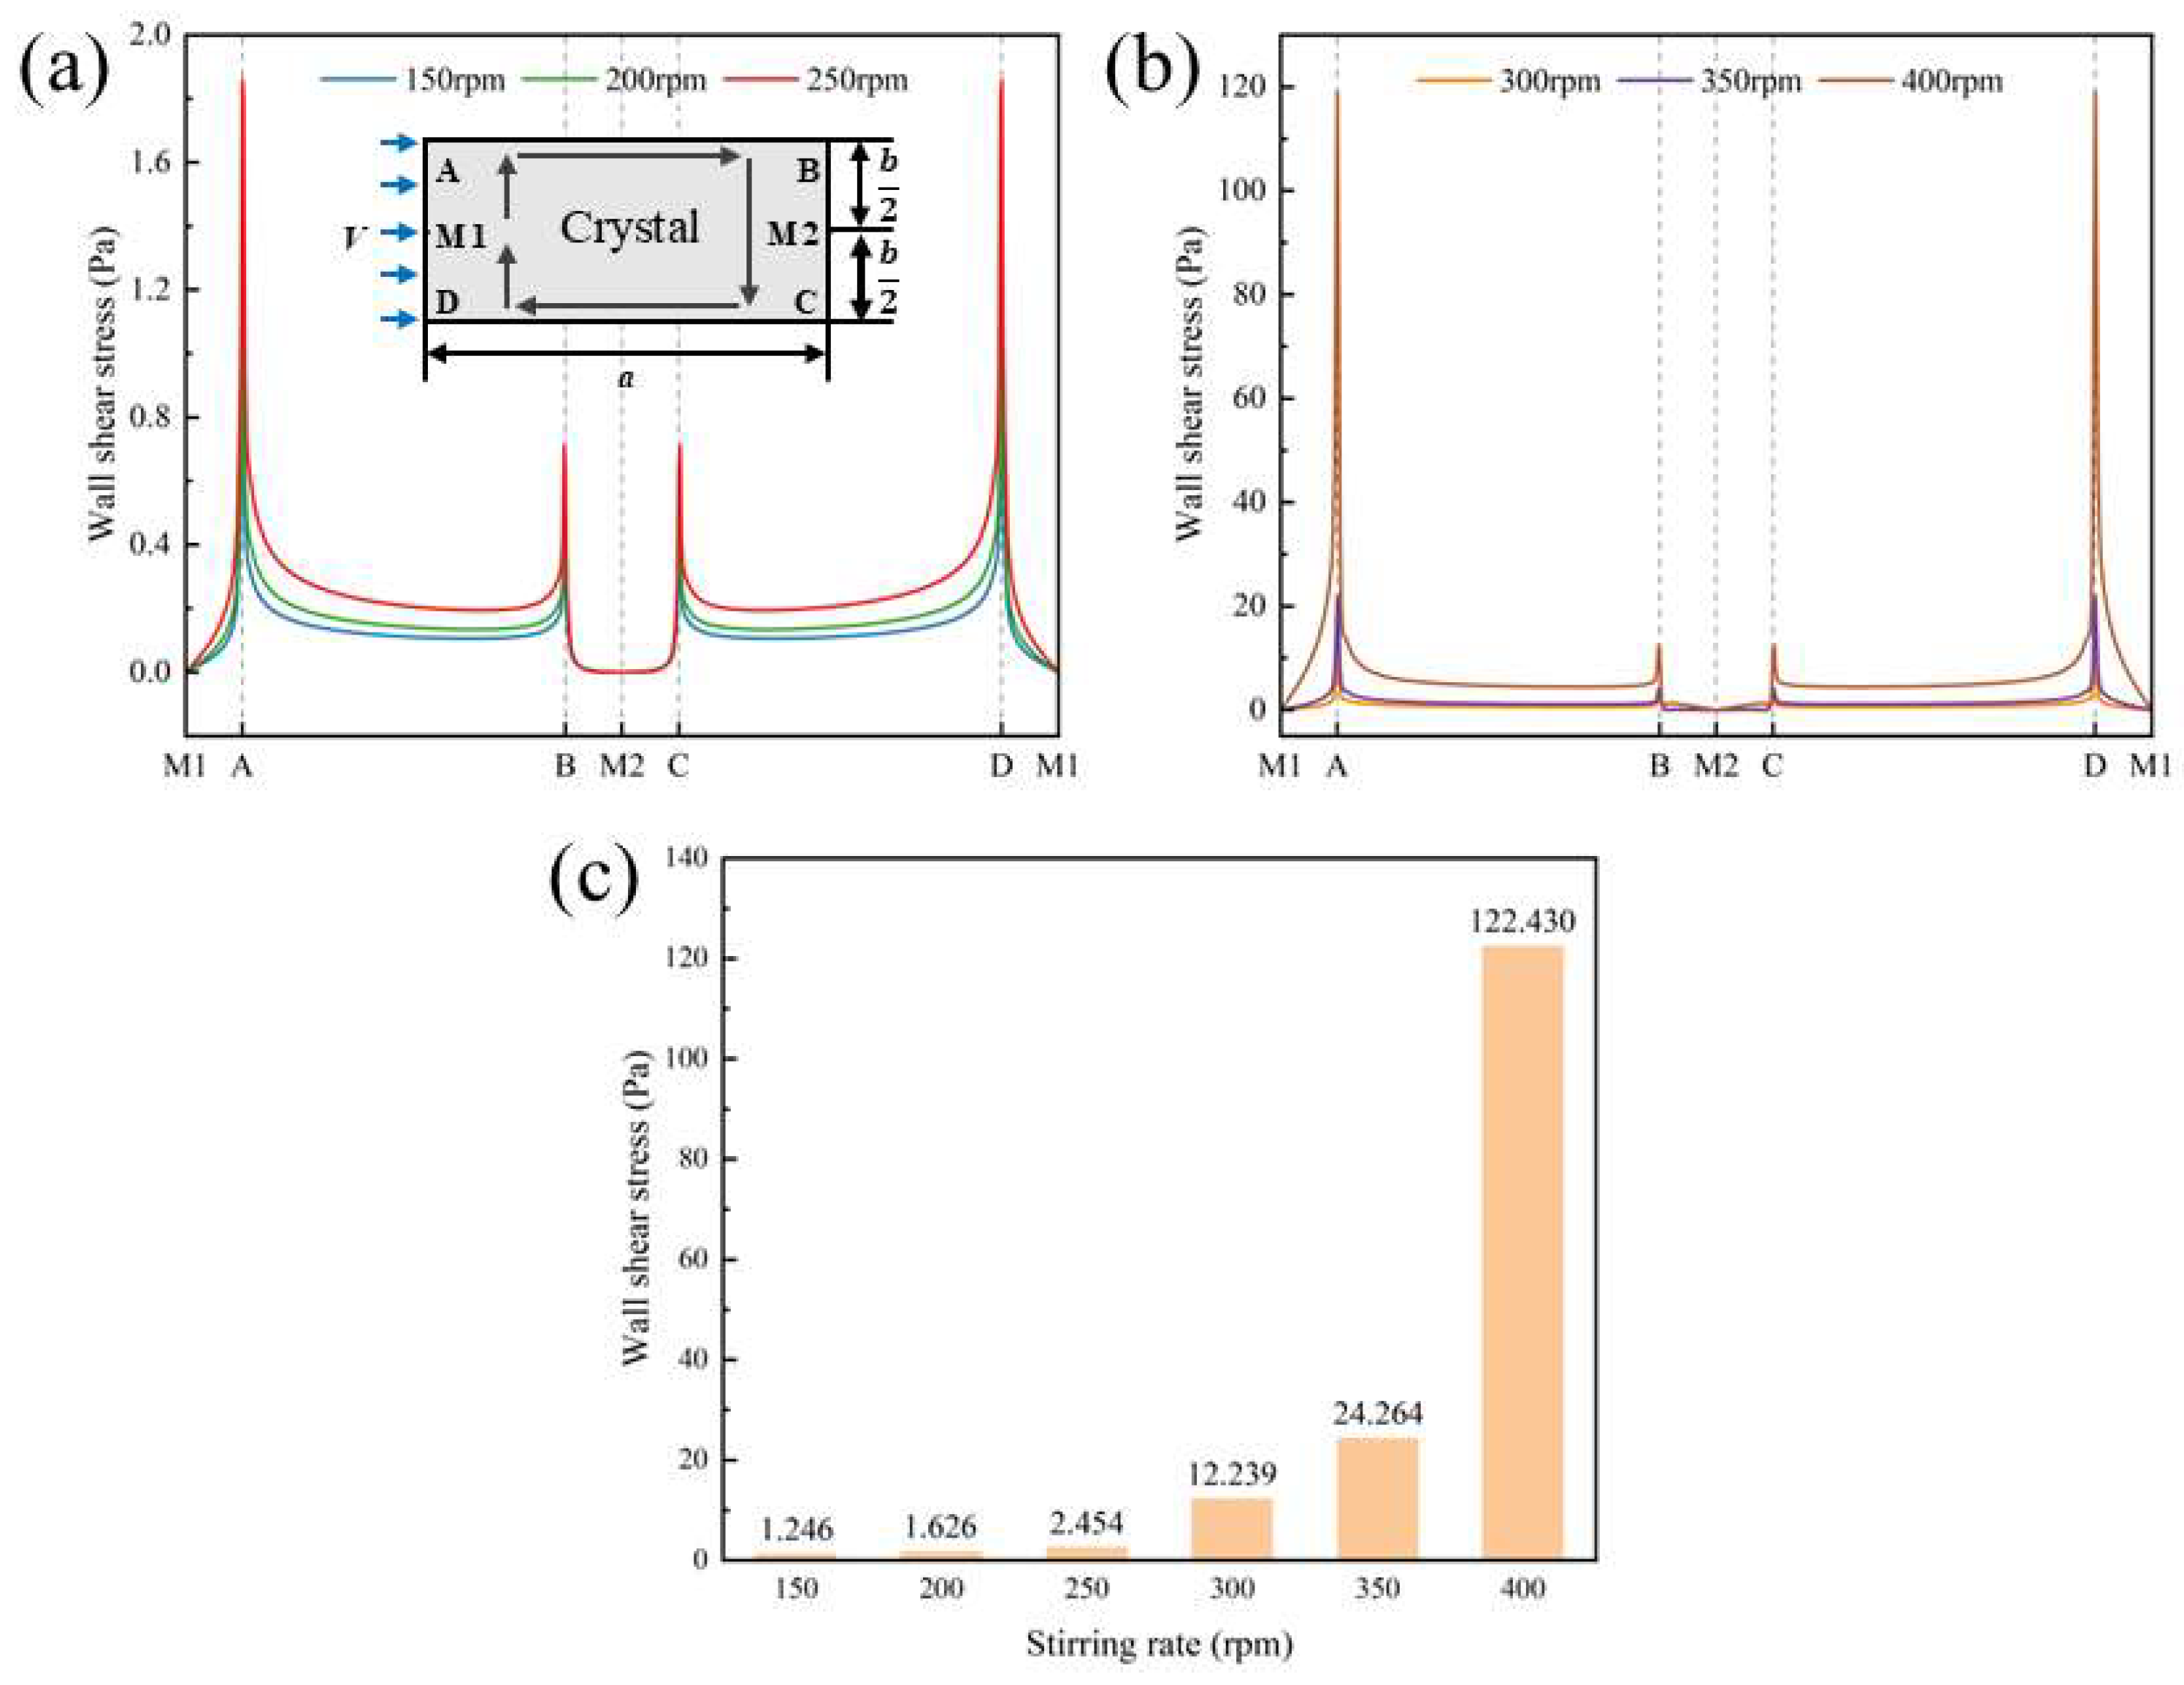
Figure 9a,b show that, for each stirring rate, the highest shear stresses occurred at the two front corner points A and D of the crystals. Figure 9c presents the variation of shear stresses at points A and D with the stirring rate, along with the specific values. At low stirring rates, the shear stress at corner points A and D was negligible, and the crystal did not break. When the stirring rate reached or exceeded 300 rpm, the shear stress at these points was at least 1.224 × 101 Pa, and at 400 rpm, it reached 1.224 × 10² Pa. The strong shear stress at the crystal corners caused rupture at these points, leading to further breakage along the {101} face. This was consistent with the high-stirring-rate fragmentation in Figure 5a and the literature [48], which reported that crystals with small aspect ratios tended to rupture first at the smallest plane perpendicular to the largest size. Consequently, cracks at the corner points preferentially propagated along the [010] direction, resulting in crystal fragmentation.
In summary, stirring effect on the crystal morphology during solution crystallization is a complex process involving numerous factors. An appropriate stirring rate can yield p-AABA crystals with a larger aspect ratio, a larger average particle size, and no aggregation.

5. Conclusions

In this study, an in-depth investigation combining experiments and simulations (MS and CFD) was conducted to explore the effect of stirring on the crystal morphology during the cooling crystallization of p-AABA. The following conclusions are drawn.
(1)
The p-AABA crystal belong to the triclinic crystal system with the space group of P-1 and are plate-like rectangles. MS results show that solute molecules have a stronger adsorption ability to the {101} face than to the {010} face, and the theoretical growth rate of the {101} face is higher than that of the {010} face.
(2)
At low stirring rates, crystals have a small aspect ratio and tend to aggregate, while high rates can prevent aggregation, but cause fragmentation. As the rate increases, both the crystal aspect ratio and crystal size first increase and then decrease, while the PSD generally tends to broaden.
(3)
In a static growth environment, the growth rates of the {101} and {010} faces show a good exponential function relationship with supersaturation. At the same supersaturation, the growth rate of the {101} face is greater. Without stirring, theoretically, the smaller the supersaturation, the larger the crystal aspect ratio.
(4)
Stirring rate influences nucleation supersaturation, thereby affecting nucleation rate and nucleus size. At a low stirring rate, high supersaturation at the nucleation moment promotes crystal aggregation. As the rate increases, the supersaturation at the nucleation moment decreases, and the relative growth rates of the {101} and {010} faces change, leading to different crystal aspect ratios.
(5)
By analyzing the impact force, shear stress, and rotational moment acting on the crystals, it is found that the flow resistance of rectangular crystals in a stirred flow field is minimized when the short side faces the flow.
(6)
CFD simulations demonstrate that the stirring rate affects the mass-transfer boundary layer thickness and shear stresses at the {101} and {010} faces, ultimately influencing the aspect ratio of p-AABA crystals. A high stirring rate increases turbulent kinetic energy, turbulent dissipation rate, and shear stress in the paddle region. Meanwhile, it also significantly increases shear stress at the corner points of the {101} face, leading to obvious fragmentation of p-AABA crystals. As a result, the average size of the crystals decreases under high-rate stirring.
In contrast to previous studies, we organically combined the explanations at the microscopic and macroscopic levels to comprehensively analyze the essential causes of the morphological changes of p-AABA crystals under stirring. The findings possess significant theoretical and practical value for optimizing the production process of p-AABA and enhancing product quality. The hydrodynamic mechanism governing stirring-induced crystal morphology modification could be applicable to other compounds exhibiting similar plate-like rectangle morphologies. For other crystal morphologies, this work can provide a reference method for analyzing the relationship between fluid flow and morphological evolution.

Supplementary Materials

The following supporting information can be downloaded at: https://www.mdpi.com/article/10.3390/cryst15030284/s1, The crystal structure data of p-AABA obtained by SCXRD (Table S1); The roughness values of the crystal faces of p-AABA (Table S2); Velocity distribution at different heights in the crystallizer for five grid numbers (Figure S1); Data of 2D grid independence validation (Table S3); The molecular structure of p-AABA crystals (Figure S2); Particle size distribution of p-AABA products obtained at different stirring rates (Figure S3); Coefficient of variation of particle size distribution of p-AABA products obtained at different stirring rates (Table S4); The fitted relationship between the normal distance along the crystal face and time (Figure S4); and The fluid boundary layer in the 2D flow field (Figure S5).

Author Contributions

Conceptualization, R.D. and Y.L.; methodology, R.D.; software, R.D.; validation, R.D. and Y.L.; formal analysis, R.D. and Y.L.; investigation, R.D. and F.W.; data curation, R.D.; writing—original draft preparation, R.D.; writing—review and editing, R.D., F.W., and Y.L.; visualization, R.D., F.W., and Y.L.; supervision, Y.L. and Y.B.; project administration, Y.B. and D.J.; funding acquisition, Y.L. All authors have read and agreed to the published version of the manuscript.

Funding

This research received no external funding.

Data Availability Statement

The crystallographic information file is available from the Cambridge Crystallographic Data Center (CCDC) upon request (http://www.ccdc.cam.ac.uk, CCDC deposition number 2416953).

Acknowledgments

Dong extends heartfelt gratitude to Xiaobin Sun, Zhenkai Cen, and Junxiao Wang for their help with the simulation. Moreover, Dong expresses sincere appreciation to Yuhan Lin and Lixin Hou for their advice on writing.

Conflicts of Interest

D.J. is employed by the company, Asymchem Life Science (Tianjin) Co., Ltd., and the remaining authors declare no conflicts of interest.

References

  1. Ramamoorthy, S.; Kwak, J.H.; Karande, P.; Farmanesh, S.; Rimer, J.D. A high-throughput assay for screening modifiers of calcium oxalate crystallization. AIChE J. 2016, 62, 3538–3546. [Google Scholar] [CrossRef]
  2. Klapwijk, A.R.; Simone, E.; Nagy, Z.K.; Wilson, C.C. Tuning crystal morphology of succinic acid using a polymer additive. Cryst. Growth Des. 2016, 16, 4349–4359. [Google Scholar] [CrossRef]
  3. Chai, S.Y.; Li, E.H.; Zhang, L.; Du, J.; Meng, Q.W. Crystallization solvent design based on a new quantitative prediction model of crystal morphology. AIChE J. 2022, 68, e17499. [Google Scholar] [CrossRef]
  4. Han, G.J.; Chow, P.S.; Tan, R.B.H. Strong additive-surface interaction leads to the unusual revival of growth at solvent-poisoned faces of DL-Alanine crystal. Cryst. Growth Des. 2012, 12, 5555–5560. [Google Scholar] [CrossRef]
  5. Callahan, C.J.; Ni, X.W. Probing into nucleation mechanisms of cooling crystallization of sodium chlorate in a stirred tank crystallizer and an oscillatory baffled crystallizer. Cryst. Growth Des. 2012, 12, 2525–2532. [Google Scholar] [CrossRef]
  6. Liang, K.P.; White, G.; Wilkinson, D.; Ford, L.J.; Roberts, K.J.; Wood, W.M.L. Examination of the process scale dependence of L-Glutamic Acid batch crystallized from supersaturated aqueous solutions in relation to reactor hydrodynamics. Ind. Eng. Chem. Res. 2004, 43, 1227–1234. [Google Scholar] [CrossRef]
  7. Noor, S.Z.M.; Camacho, D.M.; Ma, C.Y.; Mahmud, T. Effect of crystallization conditions on the metastable zone width and nucleation kinetics of p-Aminobenzoic Acid in ethanol. Chem. Eng. Technol. 2020, 43, 1105–1114. [Google Scholar] [CrossRef]
  8. Zhao, X.Z.; Fan, H.A.; Lin, G.B.; Fang, Z.C.; Yang, W.L.; Li, M.; Wang, J.H.; Lu, X.Y.; Li, B.L.; Wu, K.J.; et al. Multi-objective optimization of radially stirred tank based on CFD and machine learning. AIChE J. 2024, 70, e18324. [Google Scholar] [CrossRef]
  9. Tao, T.T.; Li, B.B.; Jia, S.Z.; Chen, M.Y.; Gao, Z.G.; Gong, J.B. Taylor vortex-based protein crystal nucleation enhancement and growth evaluation in batchwise and slug flow crystallizers. Chem. Eng. Res. Des. 2023, 193, 555–564. [Google Scholar] [CrossRef]
  10. Liu, J.; Rasmuson, A.C. Influence of agitation and fluid shear on primary nucleation in solution. Cryst. Growth Des. 2013, 13, 4385–4394. [Google Scholar] [CrossRef]
  11. Shmidt, L.E.V.; Shmidt, J. Mechanism of crystallization in agitated solutions. Chem. Eng. Commun. 1985, 36, 233–250. [Google Scholar] [CrossRef]
  12. Zi, G.Y.; Huang, B.F.; Dai, M.; Shi, Z.; Wen, Z.J.; Li, W.J.; Luo, L.B.; Yang, L.J. Optimization of ammonium sulfate crystallization under ammonium nitrate based on response surface method. Cryst. Res. Technol. 2022, 58, 2200246. [Google Scholar] [CrossRef]
  13. Wang, X.Q.; Li, Z.Q.; Zhang, C.T.; Wen, T.; Zhou, Y.N.; Ouyang, J.B. Designing spherical particles of arbidol hydrochloride via spherical crystallization: Preparation and characterization. Ind. Eng. Chem. Res. 2024, 63, 5249–5260. [Google Scholar] [CrossRef]
  14. Li, J.J.; Tilbury, C.J.; Kim, S.H.; Doherty, M.F. A design aid for crystal growth engineering. Prog. Mater. Sci. 2016, 82, 1–38. [Google Scholar] [CrossRef]
  15. Li, S.M. Application of computational fluid dynamics in industrial crystallization. J. Phys. Conf. Ser. 2018, 1064, 012057. [Google Scholar] [CrossRef]
  16. Offiler, C.A.; Fonte, C.P.; Kras, W.; Neoptolemou, P.; Davey, R.J.; Vetter, T.; Cruz-Cabeza, A.J. Complex growth of benzamide form I: Effect of additives, solution flow, and surface rugosity. Cryst. Growth Des. 2022, 22, 6248–6261. [Google Scholar] [CrossRef]
  17. Fu, X.Y.; Zhang, D.J.; Xu, S.J.; Yu, B.; Zhang, K.K.; Rohani, S.; Gong, J.B. Effect of mixing on the particle size distribution of paracetamol continuous cooling crystallization products using a computational fluid dynamics-population balance equation simulation. Cryst. Growth Des. 2018, 18, 2851–2863. [Google Scholar] [CrossRef]
  18. Zarei, M.; Norouzi, H.R.; Sahlodin, A.M. Computational fluid dynamics simulation of a jet crystallizer for continuous crystallization of lovastatin. Sci. Rep. 2024, 14, 907. [Google Scholar] [CrossRef]
  19. Farias, L.F.I.; de Souza, J.A.; Braatz, R.D.; da Rosa, C.A. Coupling of the population balance equation into a two-phase model for the simulation of combined cooling and antisolvent crystallization using OpenFOAM. Comput. Chem. Eng. 2019, 123, 246–256. [Google Scholar] [CrossRef]
  20. Sun, J.K.; Sobolev, Y.I.; Zhang, W.Y.; Zhuang, Q.; Grzybowski, B.A. Enhancing crystal growth using polyelectrolyte solutions and shear flow. Nature 2020, 579, 73–79. [Google Scholar] [CrossRef]
  21. Dong, J.Y.; Wu, Y.L.; Liu, X.C.; Zhang, C.K.; Wang, S.M.; Wen, J. CFD-PBE simulation of para-Xylene crystallization behavior and process amplification under different operating conditions. Ind. Eng. Chem. Res. 2023, 62, 14657–14670. [Google Scholar] [CrossRef]
  22. Janbon, S.L.M.; Parsons, A.R.; Gavi, E.; Reynolds, G.K. Effects of scale, equipment, and operation on agglomeration during a reactive crystallization. Org. Process Res. Dev. 2019, 23, 302–308. [Google Scholar] [CrossRef]
  23. Li, L.; Ji, X.T.; Cheng, X.W.; Li, D.N.; Wang, T.; Huang, X.; Wang, N.; Yin, Q.X.; Hao, H.X. Effect of the solvent on the morphology of sulfamerazine crystals and its molecular mechanism. CrystEngComm 2022, 24, 5497–5506. [Google Scholar] [CrossRef]
  24. Donnay, J.D.; Harker, D. A new law of crystal morphology extending the law of Bravais. Am. Mineral. 1937, 22, 463. [Google Scholar]
  25. Hartman, P.; Perdok, W.G. On the relations between structure and morphology of crystals. Acta Crystallogr. 1955, 8, 521–524. [Google Scholar] [CrossRef]
  26. Hartman, P.; Bennema, P. The attachment energy as a habit controlling factor: I theoretical considerations. J. Cryst. Growth 1980, 49, 145–156. [Google Scholar] [CrossRef]
  27. Hammond, R.B.; Pencheva, K.; Ramachandran, V.; Roberts, K.J. Application of grid-based molecular methods for modeling solvent-dependent crystal growth morphology: Aspirin crystallized from aqueous ethanolic solution. Cryst. Growth Des. 2007, 7, 1571–1574. [Google Scholar] [CrossRef]
  28. Zhang, J.Y.; Liu, Y.M.; Shang, Z.R.; Wang, K.; Han, J.H.; Wu, S.G. Solubility measurement, correlation and computational analysis of p-Acetamidobenzoic acid in 12 pure solvents. J. Chem. Thermodyn. 2021, 159, 106478. [Google Scholar] [CrossRef]
  29. Yin, X.; Fan, J.; Wang, Z.H.; Zhang, W.G. Synthesis, crystal structures, and photoluminescence of lanthanide coordination polymers with 4-Acetamidobenzoate. Z. Anorg. Allg. Chem. 2011, 637, 773–777. [Google Scholar] [CrossRef]
  30. Wang, Z.H.; Fan, J.; Zhang, W.G. Studies of radii-dependent lanthanide coordination behavior with 4-Acetamidobenzoate and 1,10-Phenanthroline. Z. Anorg. Allg. Chem. 2009, 635, 2333–2339. [Google Scholar] [CrossRef]
  31. Hathwar, V.R.; Thakur, T.S.; Row, T.N.G.; Desiraju, G.R. Transferability of Multipole Charge Density Parameters for Supramolecular Synthons: A New Tool for Quantitative Crystal Engineering. Cryst. Growth Des. 2011, 11, 616–623. [Google Scholar] [CrossRef]
  32. Cen, Z.K.; Wang, L.Y.; Lin, J.W.; Gao, Z.J.; Zhang, Y.B.; Cao, Y.T.; Gong, J.B.; Han, D.D. Non-negligible modulation role of the solvent in the asymmetric growth of α-Resorcinol. Cryst. Growth Des. 2022, 22, 6240–6247. [Google Scholar] [CrossRef]
  33. Chai, C.J.; Zhang, G.L. Principles of Chemical Engineering-Ehemical Fluid Flow and Heat Transfer, 3rd ed.; Chemical Industry Press: Beijing, China, 2020; pp. 152–153. [Google Scholar]
  34. Szilágyi, B.; Lakatos, B.G. Model-based analysis of stirred cooling crystallizer of high aspect ratio crystals with linear and nonlinear breakage. Comput. Chem. Eng. 2017, 98, 180–196. [Google Scholar] [CrossRef]
  35. Zheng, Y.Y.; Shen, Y.Q.; Ma, Y.L.; Wang, J.; Wu, X.P.; Yang, M.H.; Xu, M.L.; Tian, Y.Q. Nucleation, growth, and aggregation kinetics of KCI produced by stirred crystallization. Appl. Phys. A 2023, 129, 651. [Google Scholar] [CrossRef]
  36. Yousuf, M.; Frawley, P.J. Secondary nucleation from nuclei breeding and its quantitative link with fluid shear stress in mixing: A potential approach for precise scale-up in industrial crystallization. Org. Process Res. Dev. 2019, 23, 926–934. [Google Scholar] [CrossRef]
  37. Neil, A.U.; Bridgwater, J. Attrition of particulate solids under shear. Powder Technol. 1994, 80, 207–219. [Google Scholar] [CrossRef]
  38. Tilbury, C.J.; Green, D.A.; Marshall, W.J.; Doherty, M.F. Predicting the effect of solvent on the crystal habit of small organic molecules. Cryst. Growth Des. 2016, 16, 2590–2604. [Google Scholar] [CrossRef]
  39. Sangwal, K. A novel self-consistent Nyvlt-like equation for metastable zone width determined by the polythermal method. Cryst. Res. Technol. 2009, 44, 231–247. [Google Scholar] [CrossRef]
  40. Chen, Z.R.; Zhou, R.F.; Yin, H.; Yuan, S.F. Study on the nucleation kinetics of DL-methionine based on the metastable zone width of unseeded batch crystallization. J. Cryst. Growth 2023, 601, 126941. [Google Scholar] [CrossRef]
  41. Mullin, J.W. Crystallization, 4th ed.; Butterworth-Heinemann: England, UK, 2001; pp. 181–215. [Google Scholar]
  42. Wang, T.F.; Wang, J.F.; Jin, Y. A novel theoretical breakup kernel function for bubbles/droplets in a turbulent flow. Chem. Eng. Sci. 2003, 58, 4629–4637. [Google Scholar] [CrossRef]
  43. Yuan, W.J.; Zhao, L.H.; Andersson, H.I.; Deng, J.Q. Three-dimensional Voronoi analysis of preferential concentration of spheroidal particles in wall turbulence. Phys. Fluids 2018, 30, 063304. [Google Scholar] [CrossRef]
  44. Li, J.J.; Deepak, F.L. In situ kinetic observations on crystal nucleation and growth. Chem. Rev. 2022, 122, 16911–16982. [Google Scholar] [CrossRef] [PubMed]
  45. Stefan-Kharicha, M.; Kharicha, A.; Zaidat, K.; Reiss, G.; Essl, W.; Goodwin, F.; Wu, M.H.; Ludwig, A.; Mugrauer, C. Hydrodynamically driven facet kinetics in crystal growth. J. Cryst. Growth 2022, 584, 126557. [Google Scholar] [CrossRef]
  46. Jousse, F.; Jongen, T.; Agterof, W. A method to dynamically estimate the diffusion boundary layer from local velocity conditions in laminar flows. Int. J. Heat Mass Transf. 2005, 48, 1563–1571. [Google Scholar] [CrossRef]
  47. Radel, B.; Gleiss, M.; Nirschl, H. Crystal breakage due to combined normal and shear loading. Crystals 2022, 12, 644. [Google Scholar] [CrossRef]
  48. Capellades, G.; Joshi, P.U.; Dam-Johansen, K.; Mealy, M.J.; Christensen, T.V.; Kiil, S. Characterization of a multistage continuous MSMPR crystallization process assisted by image analysis of elongated crystals. Cryst. Growth Des. 2018, 18, 6455–6469. [Google Scholar] [CrossRef]
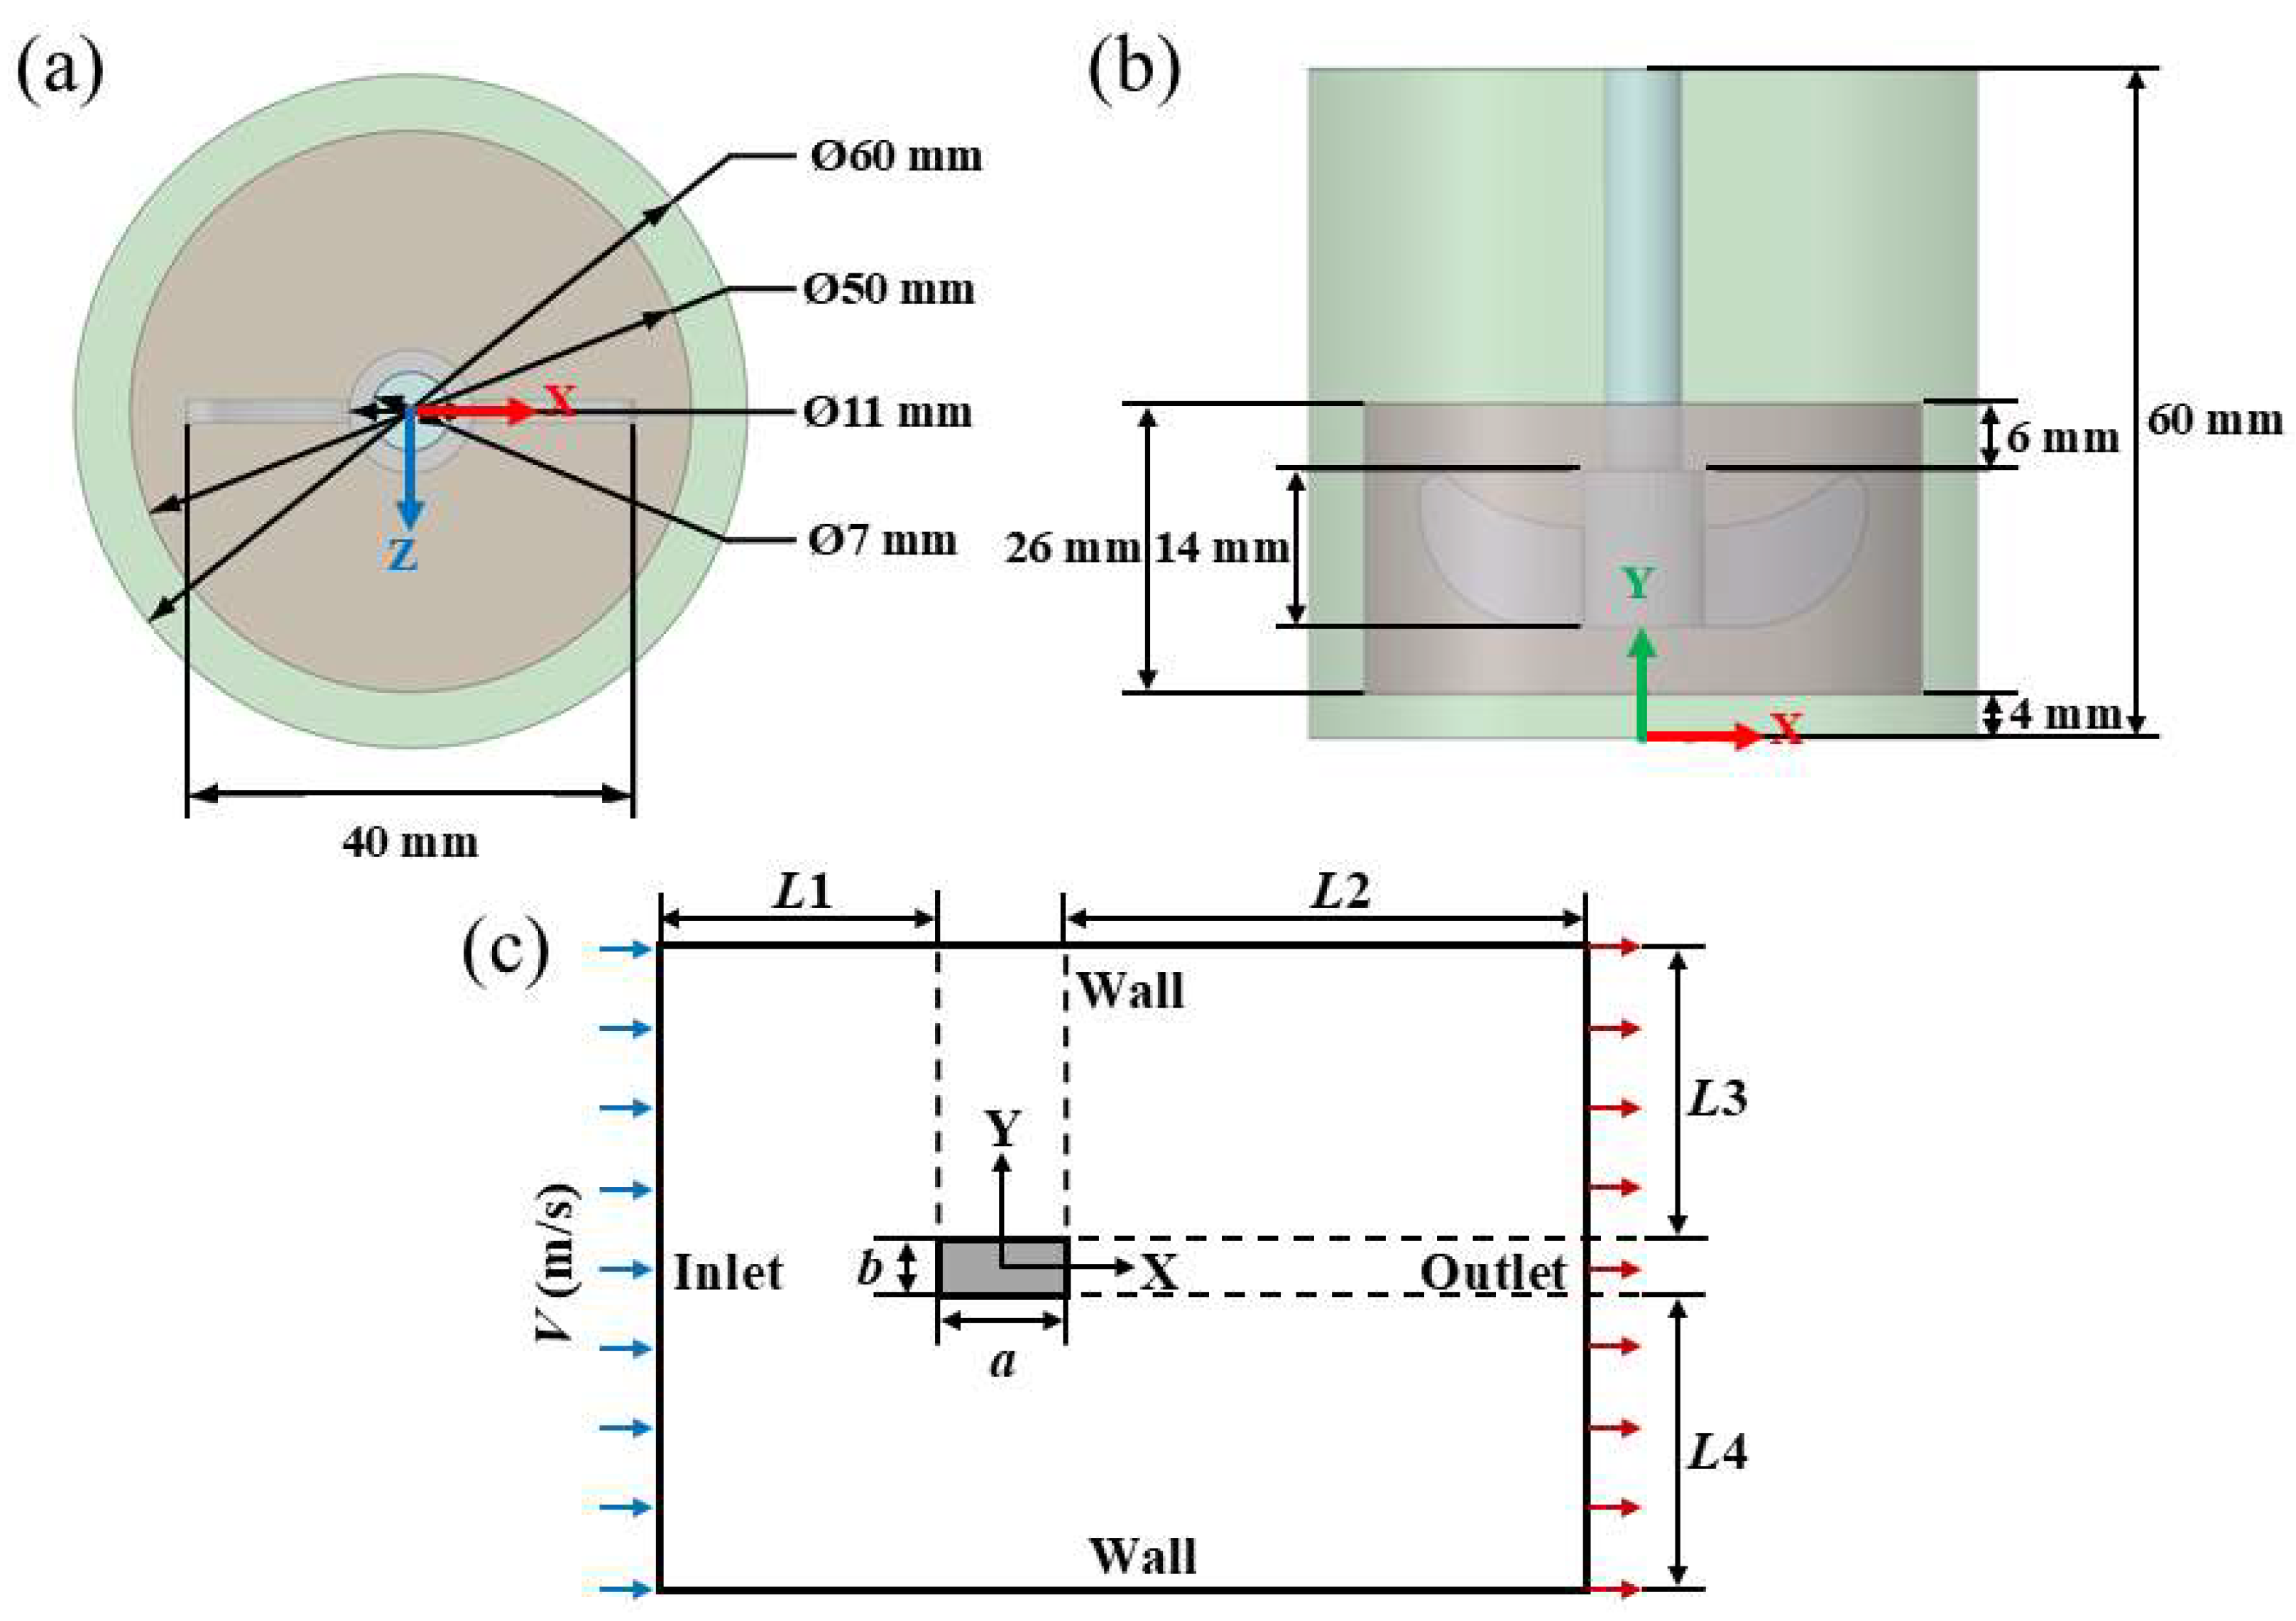
Figure 1. Schematic of the model: (a) 3D top view; (b) 3D front view; and (c) 2D view; the red region represents the rotating domain, while the stationary domain is within the green region but outside the red region.
Crystals 15 00284 g001
Figure 2. Effect of grid division: (a) static domain of the crystallizer; (b) rotational domain of the crystallizer; (c) 2D short side facing the flow; and (d) 2D long side facing the flow.
Crystals 15 00284 g002
Figure 3. Schematic diagram for the calculation of δ.
Crystals 15 00284 g003
Figure 4. (a) Result of crystal face indexing from SCXRD; (b) the crystal morphology and face indices obtained from simulation.
Crystals 15 00284 g004
Figure 5. (a) Optical micrographs of crystals; trends of aspect ratio (b) and average particle size (c) with stirring rate.
Crystals 15 00284 g005
Figure 6. Effect of stirring rate on the supersaturation at the nucleation moment.
Crystals 15 00284 g006
Figure 7. Effect of supersaturation on crystal face growth.
Crystals 15 00284 g007
Figure 8. k, ε, and WSS on the Z = 0 plane of the crystallizer: (ac) k, ε, and WSS at 150 rpm; (df) k, ε, and WSS at 250 rpm; and (gi) k, ε, and WSS at 400 rpm.
Crystals 15 00284 g008
Figure 9. Distribution of wall shear stress on the 2D crystal face: (a) stirring rates from 150 to 250 rpm and (b) stirring rates from 300 to 400 rpm. (c) Variation of shear stress with stirring rates at points A and D.
Crystals 15 00284 g009
Table 1. Physical parameters used in the simulation.
ParameterValueUnit
solution density817kg·m−3
solution viscosity0.0009kg·(m·s)−1
p-AABA size0.1mm
p-AABA density1327kg·m−3
p-AABA molar mass179.17kg·kmol−1
p-AABA particle volume fraction in solution2.19%
Table 2. Dates of boundary layer thickness and shear stresses.
Stirring Rate/rpmLiquid Velocity/(m·s−1)δ1/mmδ2/mmAverage Shear Stress on the {101} Face/PaAverage Shear Stress on the {010} Face/Pa
1501.822 × 10−22.1451.393 × 10−15.707 × 10−21.460 × 10−1
2002.210 × 10−22.5931.281 × 10−17.331 × 10−21.859 × 10−1
2502.958 × 10−22.8881.119 × 10−11.114 × 10−12.714 × 10−1
3006.681 × 10−23.3466.225 × 10−25.240 × 10−18.962 × 10−1
3501.050 × 10−13.8284.807 × 10−21.1491.632
4003.062 × 10−14.6972.934 × 10−26.3466.270
Table 3. 2D simulation data.
Stirring Rate/rpm{101} Face Facing the Flow{010} Face Facing the Flow
Impact Force/NShear Stress/PaRotational Moment/(N·m)Impact Force/NShear Stress/PaRotational Moment/(N·m)
1502.891 × 10−51.630 × 10−12.818 × 10−134.649 × 10−52.121 × 10−17.628 × 10⁻⁹
2505.613 × 10−52.922 × 10−17.310 × 10−139.477 × 10−53.679 × 10−11.483 × 10⁻⁸
3503.742 × 10−41.4142.761 × 10−127.353 × 10−41.5851.042 × 10−7
Table 4. Mean values of k, ε, and WSS within the paddle region at different stirring rates.
Stirring Rate/rpmk/(m2·s−2)ε/(m2·s−3)WSS/Pa
1504.819 × 10−45.507 × 10−31.011 × 10−3
2007.982 × 10−41.116 × 10−21.370 × 10−3
2501.181 × 10−31.930 × 10−21.711 × 10−3
3001.610 × 10−33.003 × 10−22.053 × 10−3
3502.121 × 10−34.428 × 10−22.421 × 10−3
4002.697 × 10−36.281 × 10−22.869 × 10−3
Disclaimer/Publisher’s Note: The statements, opinions and data contained in all publications are solely those of the individual author(s) and contributor(s) and not of MDPI and/or the editor(s). MDPI and/or the editor(s) disclaim responsibility for any injury to people or property resulting from any ideas, methods, instructions or products referred to in the content.