Article

Cotton Swab-Based Surface-Enhanced Raman Spectroscopy Substrate for Ultrasensitive Detection with Year-Long Stability and Multiple Recyclability

Faculty of Materials Technology, Ho Chi Minh City University of Technology–Vietnam National University (HCMUT-VNU), 268 Ly Thuong Kiet Street, District 10, Ho Chi Minh City 700000, Vietnam
*
Author to whom correspondence should be addressed.
These authors contributed equally to this work.
Crystals 2025, 15(3), 240; https://doi.org/10.3390/cryst15030240
Submission received: 31 January 2025 / Revised: 25 February 2025 / Accepted: 26 February 2025 / Published: 28 February 2025
(This article belongs to the Section Hybrid and Composite Crystalline Materials)

Abstract

:
In recent years, the development of surface-enhanced Raman spectroscopy (SERS) substrates has seen significant advancement. In this research, we successfully fabricated cotton swab-based SERS substrates using a facile solution-based method. Our SERS substrates showed not only ultrasensitive detection capability but also impressive long-term stability and multiple recyclability rounds. In particular, we reported a detection limit of 10−12 M RhB and a detectable concentration of thiophanate methyl as low as 10−10 M using our cotton swab-based SERS substrates. The stability of our substrates reached a 12-month mark, and they were recycled as many as five times simply by cleaning them with ozone.

1. Introduction

After almost five decades of research and development, surface-enhanced Raman spectroscopy (SERS) has emerged as one of the most powerful analytical techniques, reliable for several applications in fields including chemistry, food science, security, environmental science, biomedicine, and more [1]. When compared with other conventional analytical techniques, such as high-performance liquid chromatography (HPLC) [2], gas chromatography–mass spectroscopy (GC/MS) [2], capillary electrochromatography (CE) [3], enzyme cycling assays [4], photoluminescence [5], and ion mobility spectrometry [6], which require expensive equipment and maintenance, time-consuming method development, or complicated sample pre-treatment techniques, SERS possesses several advantages. First, SERS is a fast and simple way to analyze samples with only a metallic surface of SERS-active material and a Raman spectrometer system needed. The samples can be in their original forms without or with minimal pre-treatments. The substrates for SERS can be fabricated easily by simple chemical methods or can be manufactured at a large scale using inkjet technology [7]. Then, the time from sample collection onto the substrate to result reading is only a matter of minutes or even less than a minute [8]. Second, SERS is an analytical technique with such a high sensitivity that a decent number of publications have already reported single-molecule detection [9,10]. In addition, the structure of each analyte is associated with a single set of Raman peaks, and thus such identification based on the molecular “fingerprint” is highly specific. Third, with the availability of handheld Raman spectrometers and the development of SERS substrates based on flexible or daily use materials, SERS is becoming more mobile and versatile than ever. The mobility makes on-field detection feasible and the versatility means that it is possible to fabricate specific SERS substrates for different applications. Consequently, the overall cost of the SERS system can be reduced, making SERS a more affordable technique, which is also the fourth advantage. On the other hand, one major disadvantage of SERS is its poor reproducibility. The inhomogeneity of the nanostructures that generate hot spots on the SERS substrates made it difficult to quantify SERS signals for practical applications.
The enhancement of Raman scattering by SERS is dominated by the electromagnetic effect caused by localized surface plasmon resonance (SPR) when laser is irradiated onto a plasmonic surface [11]. Thus, several plasmonic materials have been experimented upon for SERS including Au [12], Ag [13], Cu [12], Pt [14], and Pd [15]. Likewise, a much weaker enhancement mechanism, the chemical mechanism, is believed to occur due to light-induced charge transfer between the analyte and the substrate, leading to the altered geometrical or electronic structure of the analyte [16]. Research on the chemical mechanism has been intensively conducted on several non-plasmonic materials such as graphene and its derivatives [16,17,18], few-layered MoO3 nanosheets [19], GaN microrod arrays [20], and plasma-treated MoS2 nanoflakes [21]. In applications, SERS materials can be fabricated as colloidal substrates [22], but most substrates are fabricated by patterning the surfaces of SERS materials [23,24] or by depositing them on supporting substrates such as glass [8,25] or Si [12,14]. Recently, more interest in flexible substrates to reduce cost and improve versatility and disposal has led to the development of SERS substrates based on plastics [26], textiles [27], paper [7,27], or cotton swabs [28,29]. Regardless of the fabrication technique, in general, SERS substrates showed very impressive sensitivity with significantly high enhancement factors (EFs). For example, 10−7 M methimazole in synthetic urine was detected by colloidal Au nanostar substrates (EF 5.2 × 10⁵) [22]; inkjet-printed Au nanoparticles on paper were made into a dipstick or swab that was capable of detecting 1,2-Bis(4-pyridyl)ethylene at concentrations as low as 1.8 ppb [7], and highly dense sub-10 nm Ag nanogap arrays exhibited a calculated EF up to 109 [23]. Comparably, non-plasmonic SERS substrates such as CVD-grown MoO3 nanosheets on SiO2/Si or monolayer graphene also achieved a limit of detection of 2 × 10⁻⁸ M R6G (EF 2.28 × 10⁴) [19] or 10−8 M protoporphyin IX, respectively [17].
In our most recent publication [29], we utilized cotton swabs as an inexpensive, flexible, and highly versatile supporting substrate for SERS-active Ag nanoparticles (Ag NPs). We proved that such a simple SERS substrate was capable of easily detecting down to 10−10 M RhB, and an impressive EF exceeding 1010 was achieved. Furthermore, we added an overlay of graphene oxide (GO) on top of the cotton swab/Ag substrate to deliberately improve sensitivity by taking advantage of the greater analyte adsorption and the charge transfer mechanism of GO. Indeed, the combination of a plasmonic material with a non-plasmonic material to improve SERS sensitivity has already been studied by several groups. The selection of materials and their architectures has been varied. For example, Au NPs or Ag NPs were grown directly in situ from reduced GO [30,31] or Ag NPs were decorated onto functionalized multiwalled carbon nanotubes [32]. Similarly, plasmonic noble metal was also combined with non-plasmonic metal oxide support such as Au layers sputtered onto ZnO nanoflowers [33], Ag NPs impregnated onto TiO2 nanorods [34,35,36], or Ag film evaporated on top of self-assembled, three-dimensional SiO2 nanosphere lattice [37]. In general, these combinations showed higher sensitivity compared with single noble metals due to synergistic effects from the combined materials as well as the enhanced light scattering and additional hot spots from the surface structures. However, the constant exposure of noble metals to the surrounding media or reagents may cause unwanted degradation. Thus, another scheme in which the plasmonic material was covered by non-plasmonic material was explored. Some typical structures included few-layer-graphene covering Ag NPs [38], Cu@graphene core–shell NPs [39], or Ag@Fe3O4 core–shell nanospheres [40]. As a result, the protected SERS-active materials were able to last for several days to months.
In addition to performance and stability, the recyclability of SERS substrates is another area of active research. For the substrates to be recyclable, the general scheme was to combine the plasmonic metal with another material that was capable of degrading the analyte and prepare the substrate for a new round of detection. The most used supporting materials were semiconductor metal oxides, TiO2 or ZnO in particular, due to their photocatalytic properties under light irradiation. Singh et al. successfully recycled SERS substrate from Ag-decorated TiO2 nanorods six times by irradiating UV light at room temperature for ~150 min to degrade R6G [35]. Similarly, He et al. reported the recyclable detection of R6G and 2,4-D for up to five cycles for Ag-decorated ZnO-nanorod substrate by using UV light irradiation at room temperature for 30 to 500 min [41]. More interestingly, a report by Xu et al. even indicated that irradiating visible light for two hours at room temperature was sufficient to degrade R6G and reuse Ag-decorated TiO2 nanograss for at least three cycles [36], while another report by Weng et al. showed that Fe2O3-Ag hybrid hollow microspheres were reused five times by simply irradiating visible light for 5 min to promote charge transfer between Ag NPs and Fe2O3 [42]. In addition to light, some authors suggested using ethanol to rinse SERS substrates, such as Ag@Fe3O4 core–shell nanospheres [40] or superhydrophobic microball/nanosheet Ag film [24]. In these cases, R6G and 4-ATP were washed away by ethanol, and the like-new substrates were reused several times.
In this paper, we continue our work on the fabrication of cotton swabs covered with Ag NPs and GO (a Ag NP/cotton swab and a GO/Ag NP/cotton swab) as flexible SERS substrates for ultrasensitive detection. In the first part, we describe a few key results of our SERS substrate characterization. Then, we report a detection limit of 10−12 M for RhB and show the applicability of our SERS substrates to detect highly toxic thiophanate methyl fungicide at ultra-low concentrations. Furthermore, the stability of the Ag-covered cotton swab with and without GO, up to 12 months, will also be reported in this work. Last but not least, results from the recyclability of the GO/Ag NP/cotton swab will also be described in this work, as they present a simple way to reuse the substrate. This is our second report about cotton swab-based SERS substrates to update our efforts toward developing a low-cost, high-efficiency, and durable SERS substrate.

2. Materials and Methods

2.1. Materials for SERS Substrate Fabrication

For the synthesis of Ag NPs, silver nitrate (AgNO3, 99.8%) and sodium citrate dihydrate (Na3C6H5O7.2H2O, 99%) were purchased from VWR (Radnor, PA, USA) and Merck (Darmstadt, Germany), respectively, and were used as received. Similarly, for the synthesis of GO, we used chemicals obtained from Merck (Darmstadt, Germany), which included graphite flakes (∼5 μm, 99.8%), sulfuric acid (H2SO4, 98%), phosphoric acid (H3PO4, 85%), potassium permanganate (KMnO4, 98%), hydrochloric acid (HCl, 5%), and hydrogen peroxide (H2O2, 30%) without any further treatment. Cotton swabs, which were purchased from a local supermarket, were used as the supporting substrate after a series of extensive cleaning steps in acetone, ethanol, and DI water. (3-aminopropyl)trimethoxysilane (APTMS, 97%) from Energy Chemical (Zhejiang, China) was used as additive to activate the cotton swabs before the deposition of Ag NPs. Finally, DI water was used to prepare all solutions in this study.

2.2. Characterization

In this paper, some selected characterization methods were used to verify the presence of Ag NPs and GO nanosheets as well as their distribution on the cotton swabs. In particular, scanning electron microscopy (SEM) images were taken by FESEM S4800 instrument (Hitachi, Tokyo, Japan) at 10 kV accelerating voltage to provide morphology, size, and distribution details. Likewise, the structural information of Ag NPs was obtained by X-ray diffraction (XRD) using an LabX XRD-6100 diffractometer (Shimadzu, Kyoto, Japan) equipped with an LYNXEYE XE-T detector, a vertical goniometer, and a sealed Cu tube, while that of GO nanosheets was obtained by Raman spectroscopy using an XploRA Plus Raman Spectrometer (Horiba, Northampton, UK).

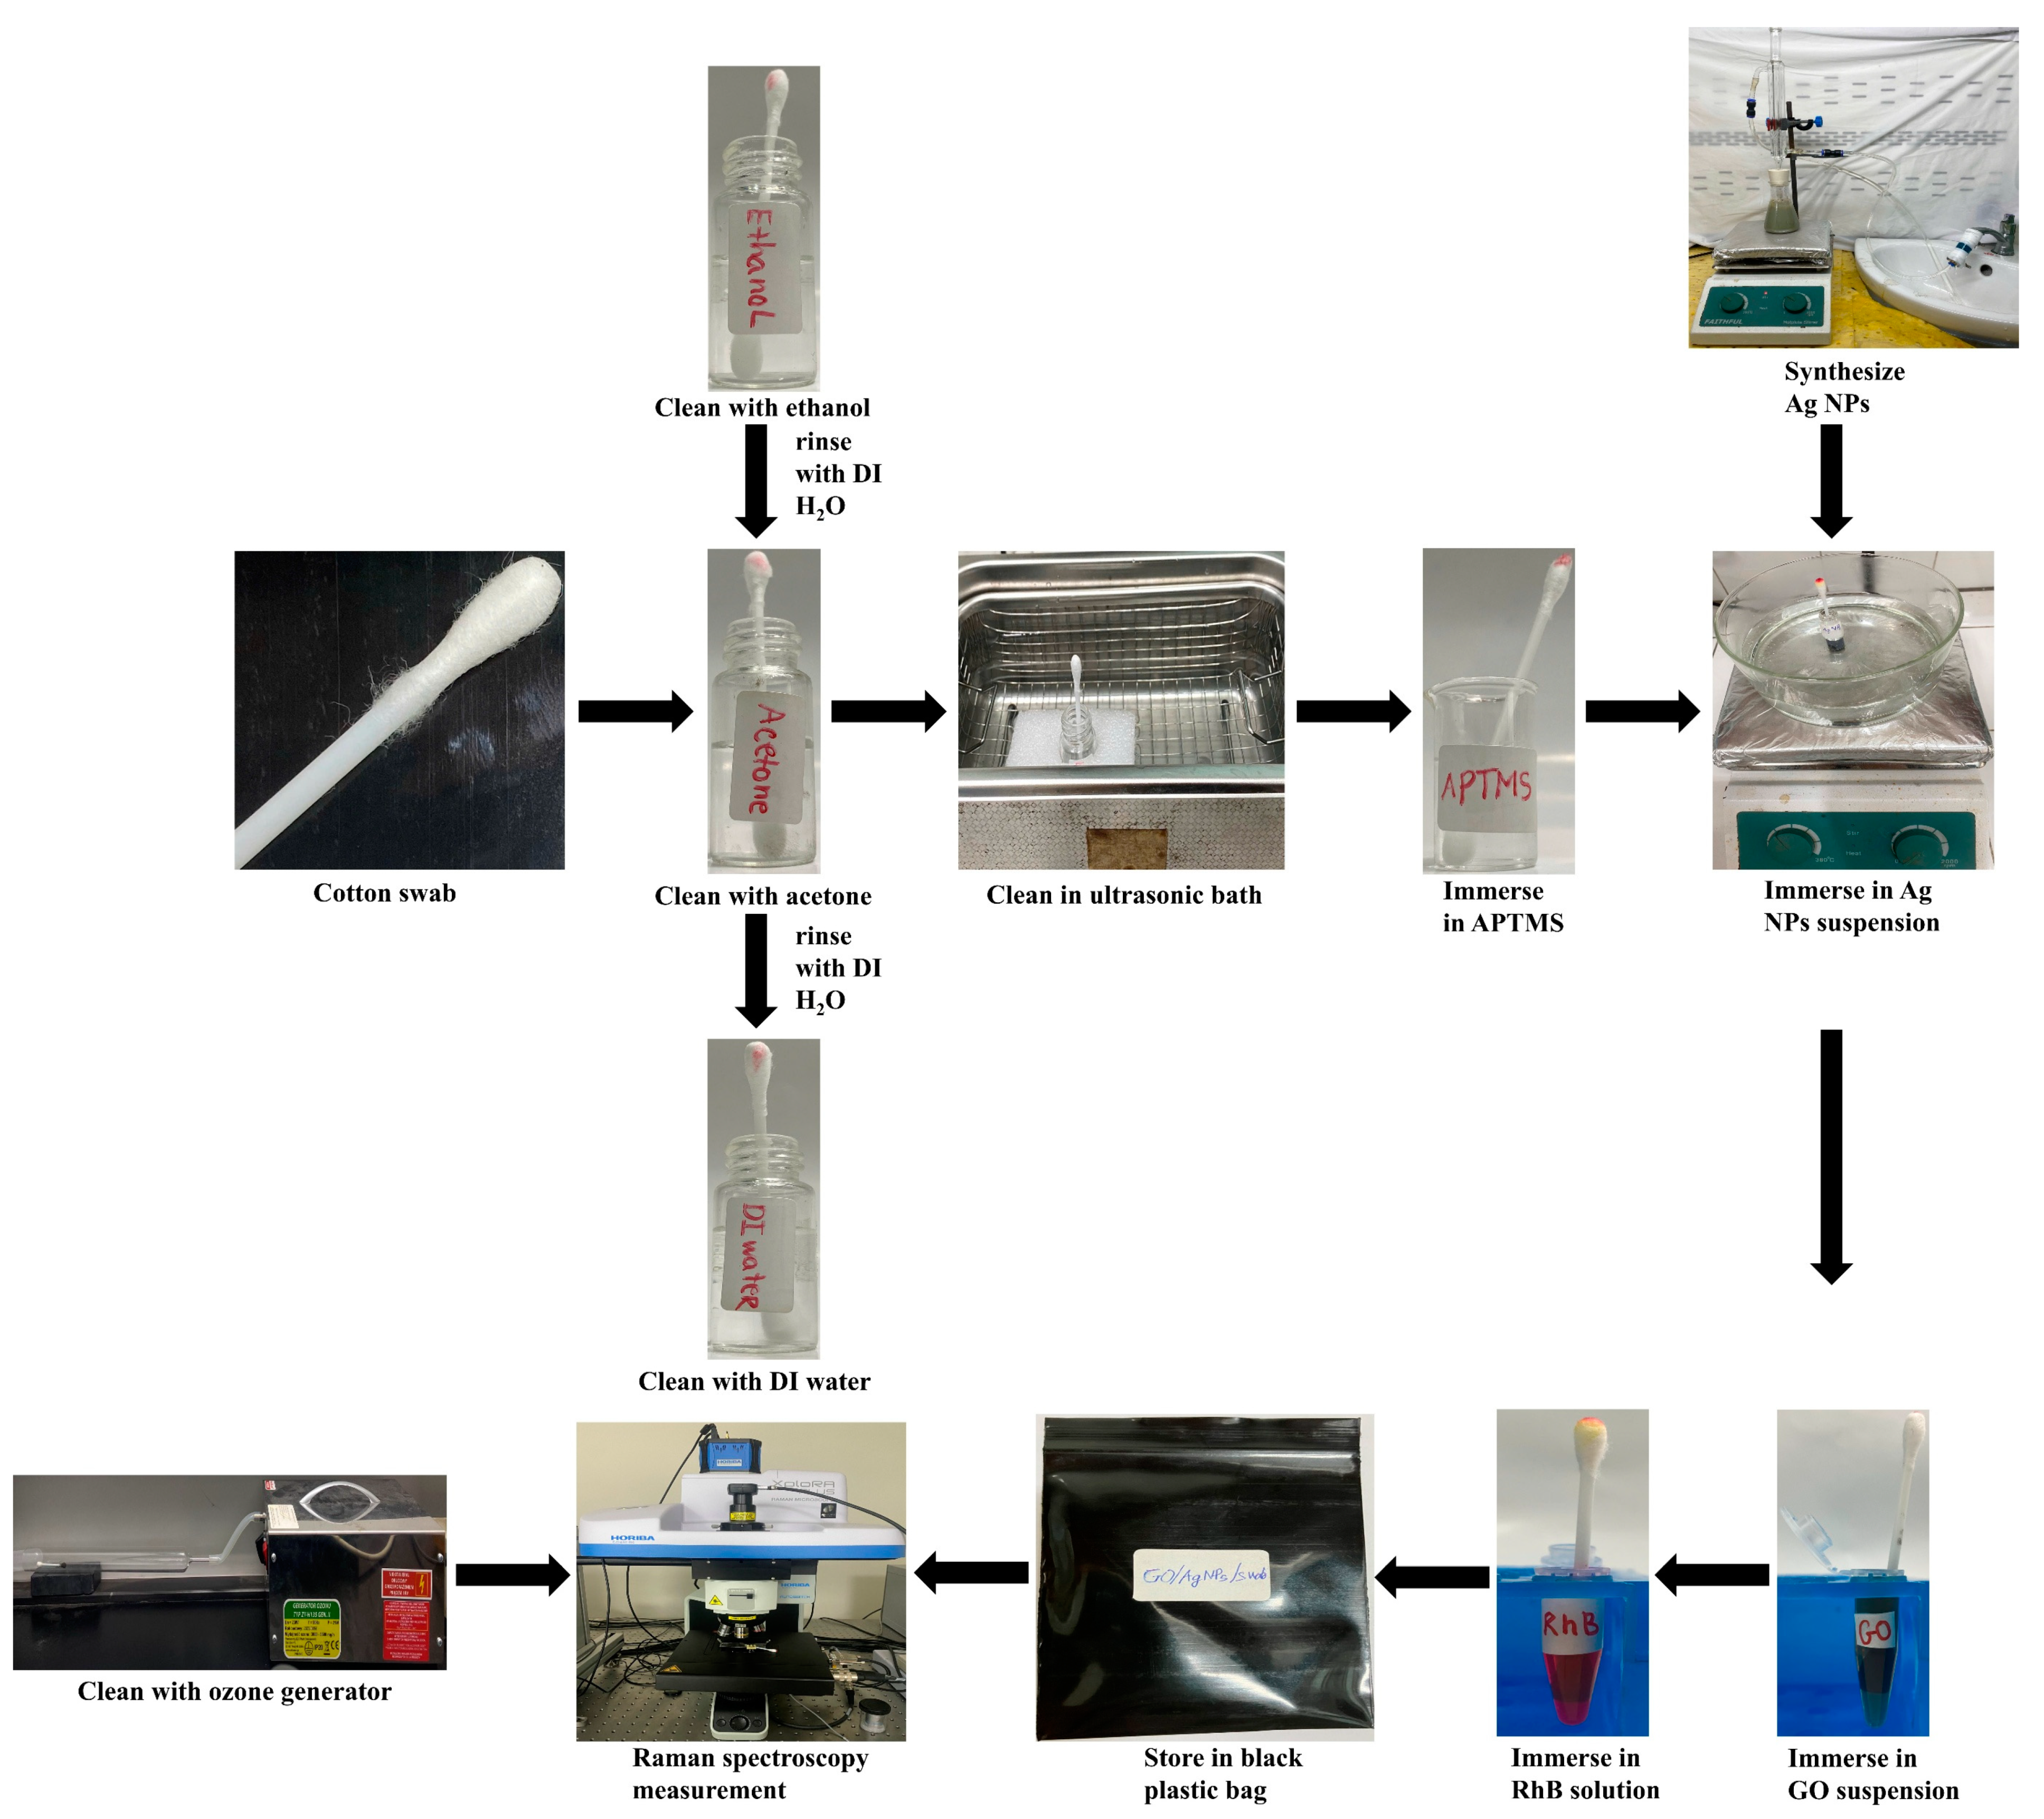
2.3. Methods of SERS Substrate Fabrication

The processes of SERS substrate fabrication and performance tests are described schematically in Figure 1.
For the synthesis of Ag NPs, we followed the reduction method described by Lee and Meisel [43], while GO nanosheets were synthesized according to the modified Hummers’ method [44]. To fabricate SERS substrates, we followed the method recently reported by our group [29].

2.4. Performance Tests of SERS Substrates

For the sensitive detection of Rhodamine B (RhB) and thiophanate methyl (TM), we diluted RhB dye and high-purity thiophanate methyl (C12H14N4O4S2, 98%), purchased from Acros Organics (Waltham, MA, USA) and Merck (Darmstadt, Germany), respectively, in DI water until the desired concentrations were reached. The SERS substrates were then dipped into the RhB and TM solutions and subjected to laser irradiation of a wavelength of 638 nm. SERS spectra were obtained from an XploRA Plus Raman Spectrometer (Horiba, Northampton, UK), using 10× objective lens for three accumulations of 35 s each. Signals from several random locations on each substrate were recorded to confirm homogeneity.
To assess the stability of Ag NP/cotton swab and GO/Ag NP/cotton swab, we placed each substrate in an uncovered container to expose each substrate to the ambient environment for periods of 6, 10, 11, and 12 months. At each specified time interval, the substrates were retrieved, rinsed with DI water, and dried at 120 °C for 30 min, and then they were immersed in RhB at 10−5 M and dried at room temperature for 15 min. This process was repeated four times before the samples were stored in black plastic food bags and subjected to Raman spectroscopy measurements.
To assess the recyclability of the substrate, GO/Ag NP/cotton swab with 10−5 M RhB was placed inside a glass cylinder with one end sealed and the other end connected to an ozone generator nozzle (ZY-H135 GEN II, 3500 mg/h) operating at 230 V, 21 W power consumption, and 50 Hz frequency. The ozone concentration in the glass cylinder was set at 25%. After one hour of exposure to the ozone environment, the GO/Ag NP/cotton swab substrate was removed and analyzed using a Raman spectrometer. Subsequently, the same GO/Ag NP/cotton swab substrate was dipped again in 2 mL of RhB at 10−5 M, then dried at room temperature for 15 min, and subjected to Raman spectroscopy. This recyclability assessment process was repeated until no distinct peaks of RhB were observed.

3. Results and Discussion

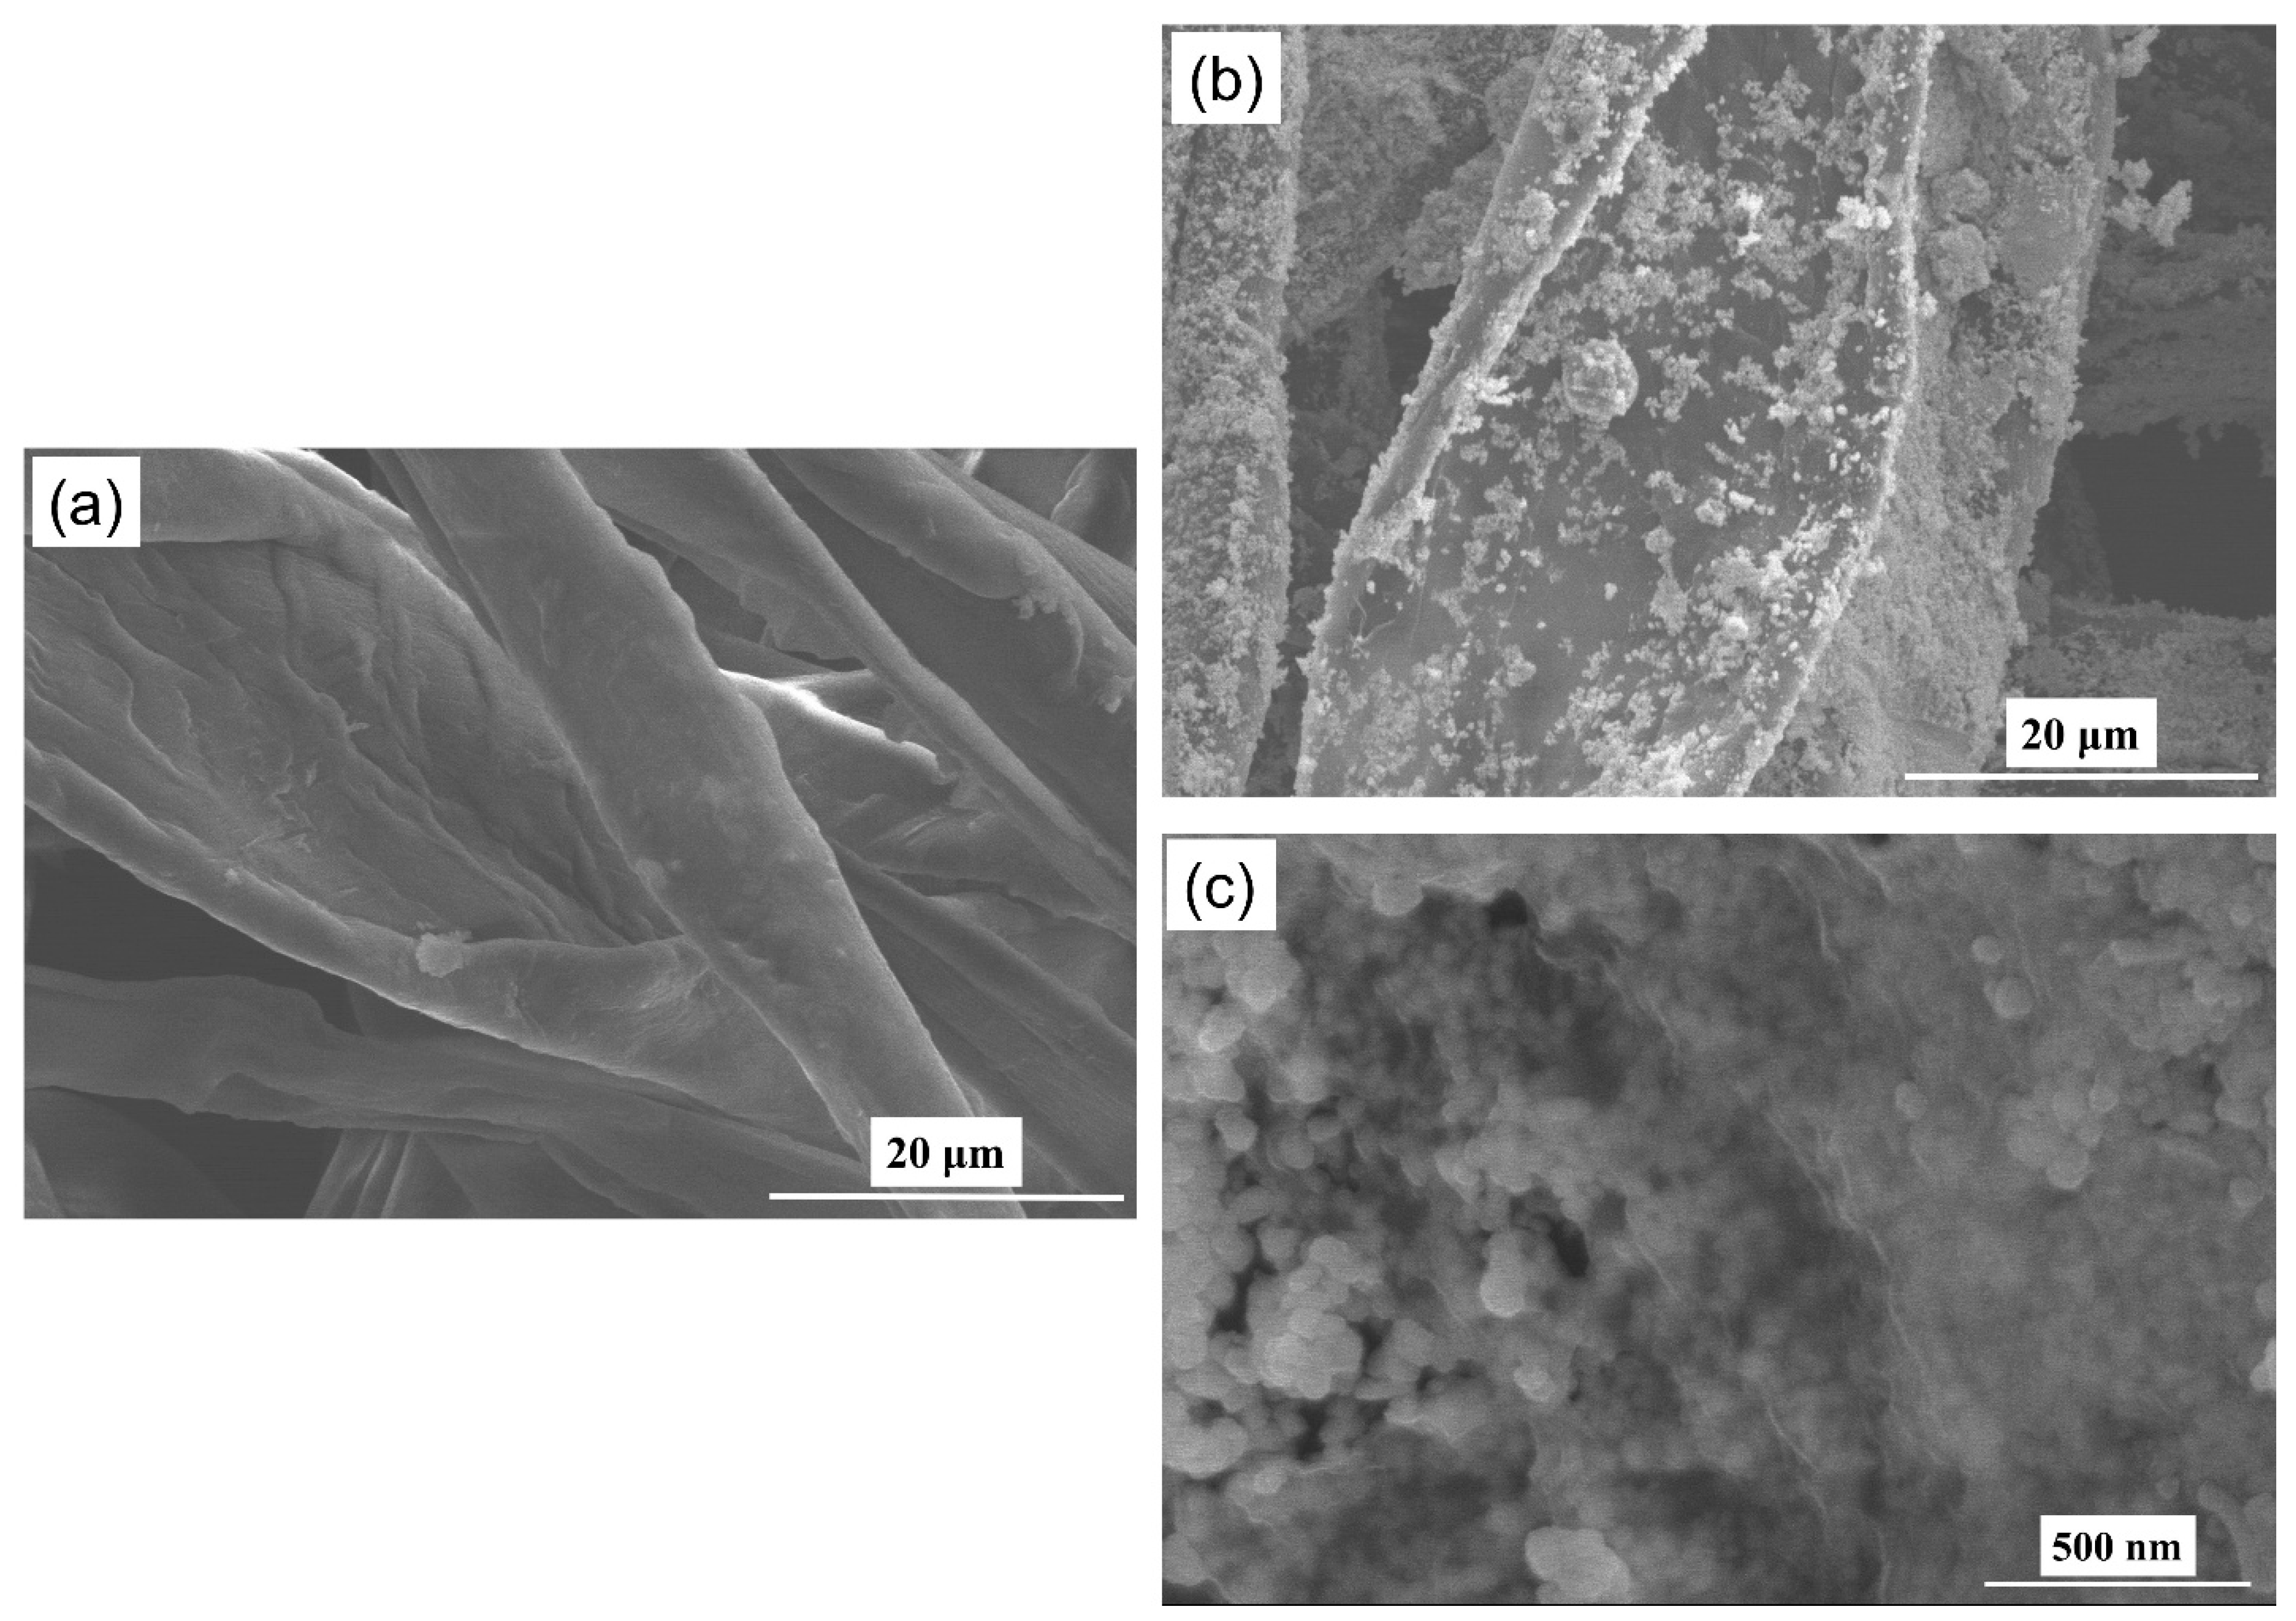
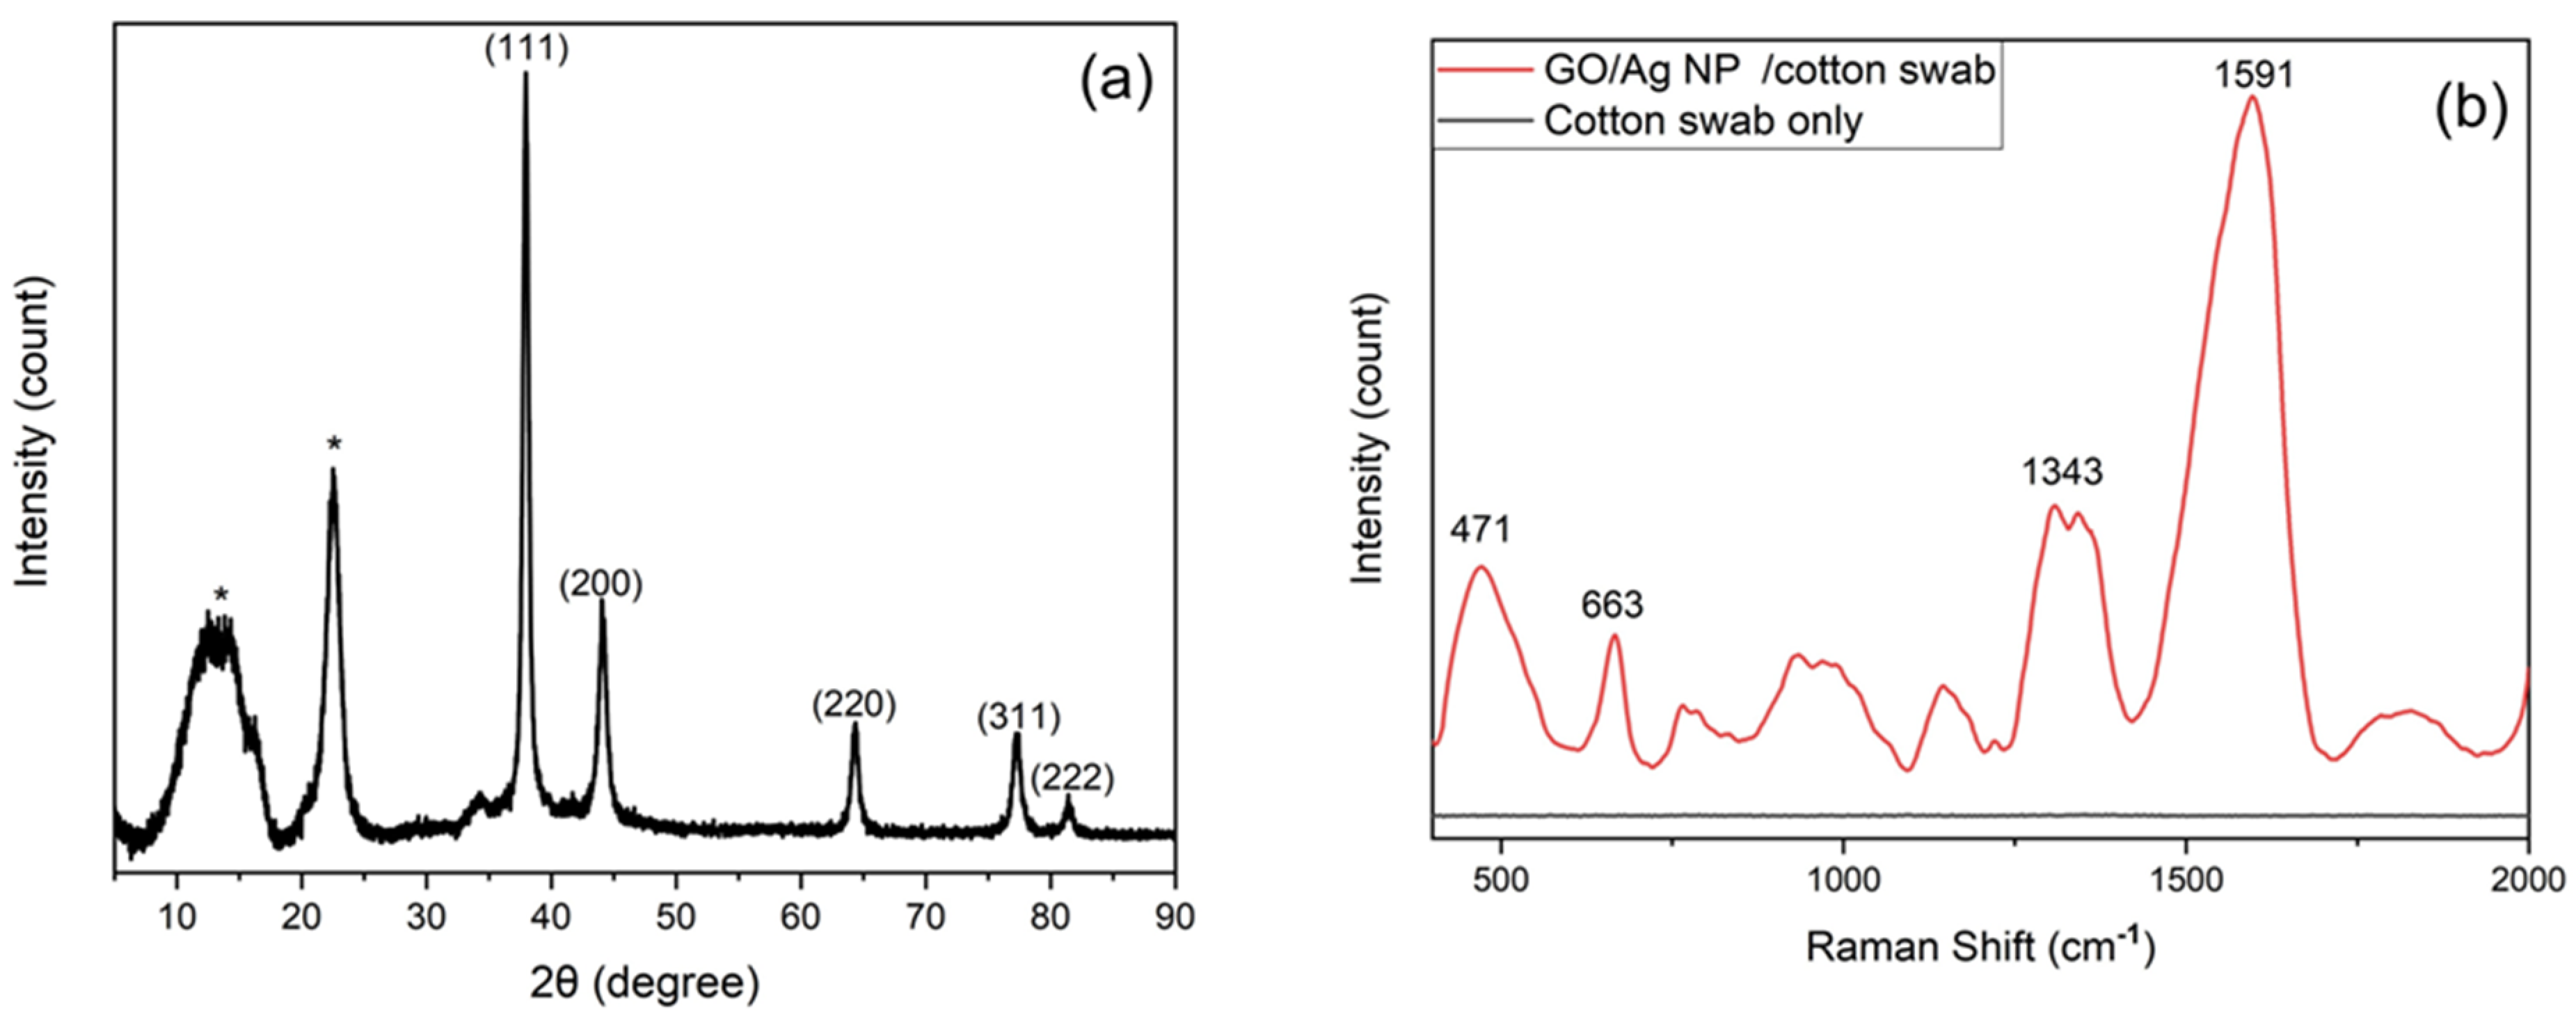
3.1. Characterization of Cotton Swab-Based SERS Substrates

Figure 2 shows the cotton swabs before and after the deposition of Ag NPs and GO nanosheets. Before the deposition, the surface of the cotton swab was smooth (Figure 2a). After the deposition of Ag NPs (Figure 2b), the particles covered most of the surface area of the cotton swab, making it rougher. The Ag NPs were mostly quasi-spherical and their average size was estimated to be 66 ± 12 nm or 66 nm ± 18%. The Ag NPs were well dispersed in DI water but upon deposition on the cotton swab, they tended to agglomerate. The agglomeration assisted the formation of the deposition layer and made it thick and rough, generating more SERS hot spots. Clearly, the coverage was not dense, but Ag NPs were distributed throughout the entire surface of the cotton swab. In Figure 2c, we show a more magnified SEM image of the substrate after GO was added to better observe a thin layer of GO nanosheets covering most of the Ag NPs. Pt was deliberately included as a very thin coating layer to enhance the visibility of GO.
The XRD pattern of Ag NPs was recorded directly on the cotton swab by cutting a small portion of the sample and fixing it on the sample holder. As seen in Figure 3a, the diffraction peaks at 2θ ≈ 38°, 44°, 65°, 78°, and 82° were indexed as the constructive interferences of the reflected x-rays from the (111), (200), (220), (311), and (222) planes of the fcc crystalline Ag NPs. Furthermore, the two non-indexed peaks at 2θ ≈ 14° and 23° were identified as those of the crystalline cellulose of the cotton strands [29]. No other peaks were observed, indicating that the Ag NP/cotton swab substrate was successfully fabricated without any interfering species or variants. We also utilized the available Raman spectrometer to provide further proof of the presence of GO on the surface, as seen in Figure 3b. In particular, two prominent Raman peaks of GO can be easily observed in the figure: one is at 1343 cm−1, assumed to be the D peak, and one is at 1591 cm−1, assumed to be the G peak. Two small peaks at 471 cm−1 and 663 cm−1 could be assigned to the organic remnants on the surfaces of Ag NPs after the synthesis. On the other hand, the Raman spectrum of the plain cotton swab, when compared with the GO/Ag NP/cotton swab, shows no noticeable peaks that could interfere with those of GO.

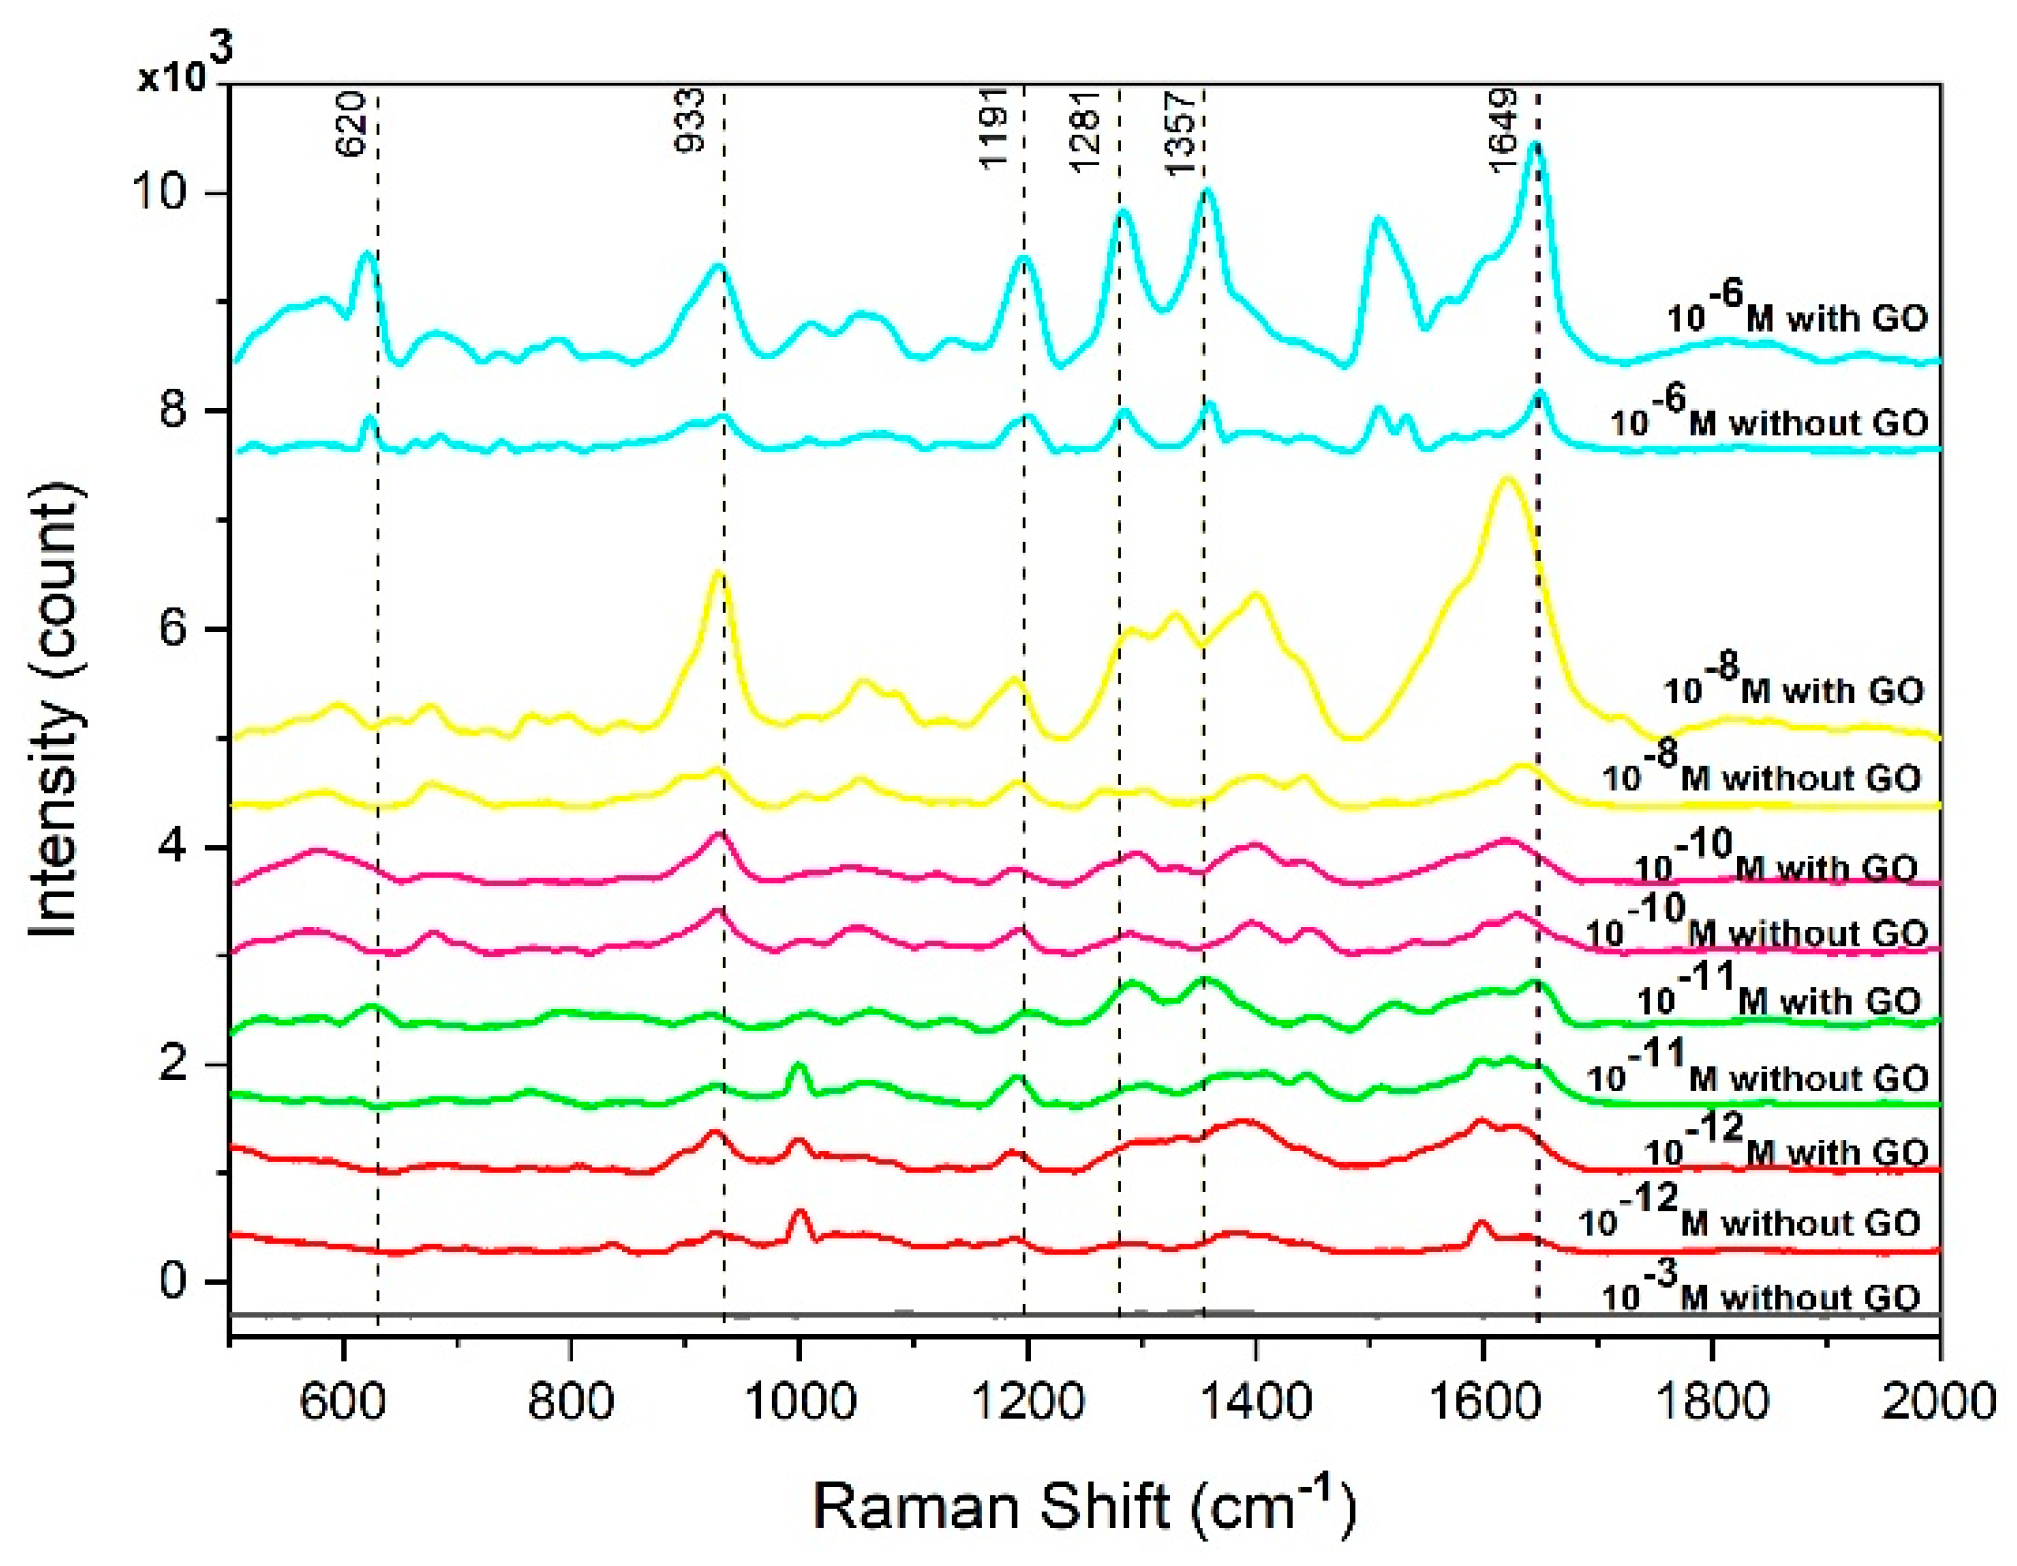
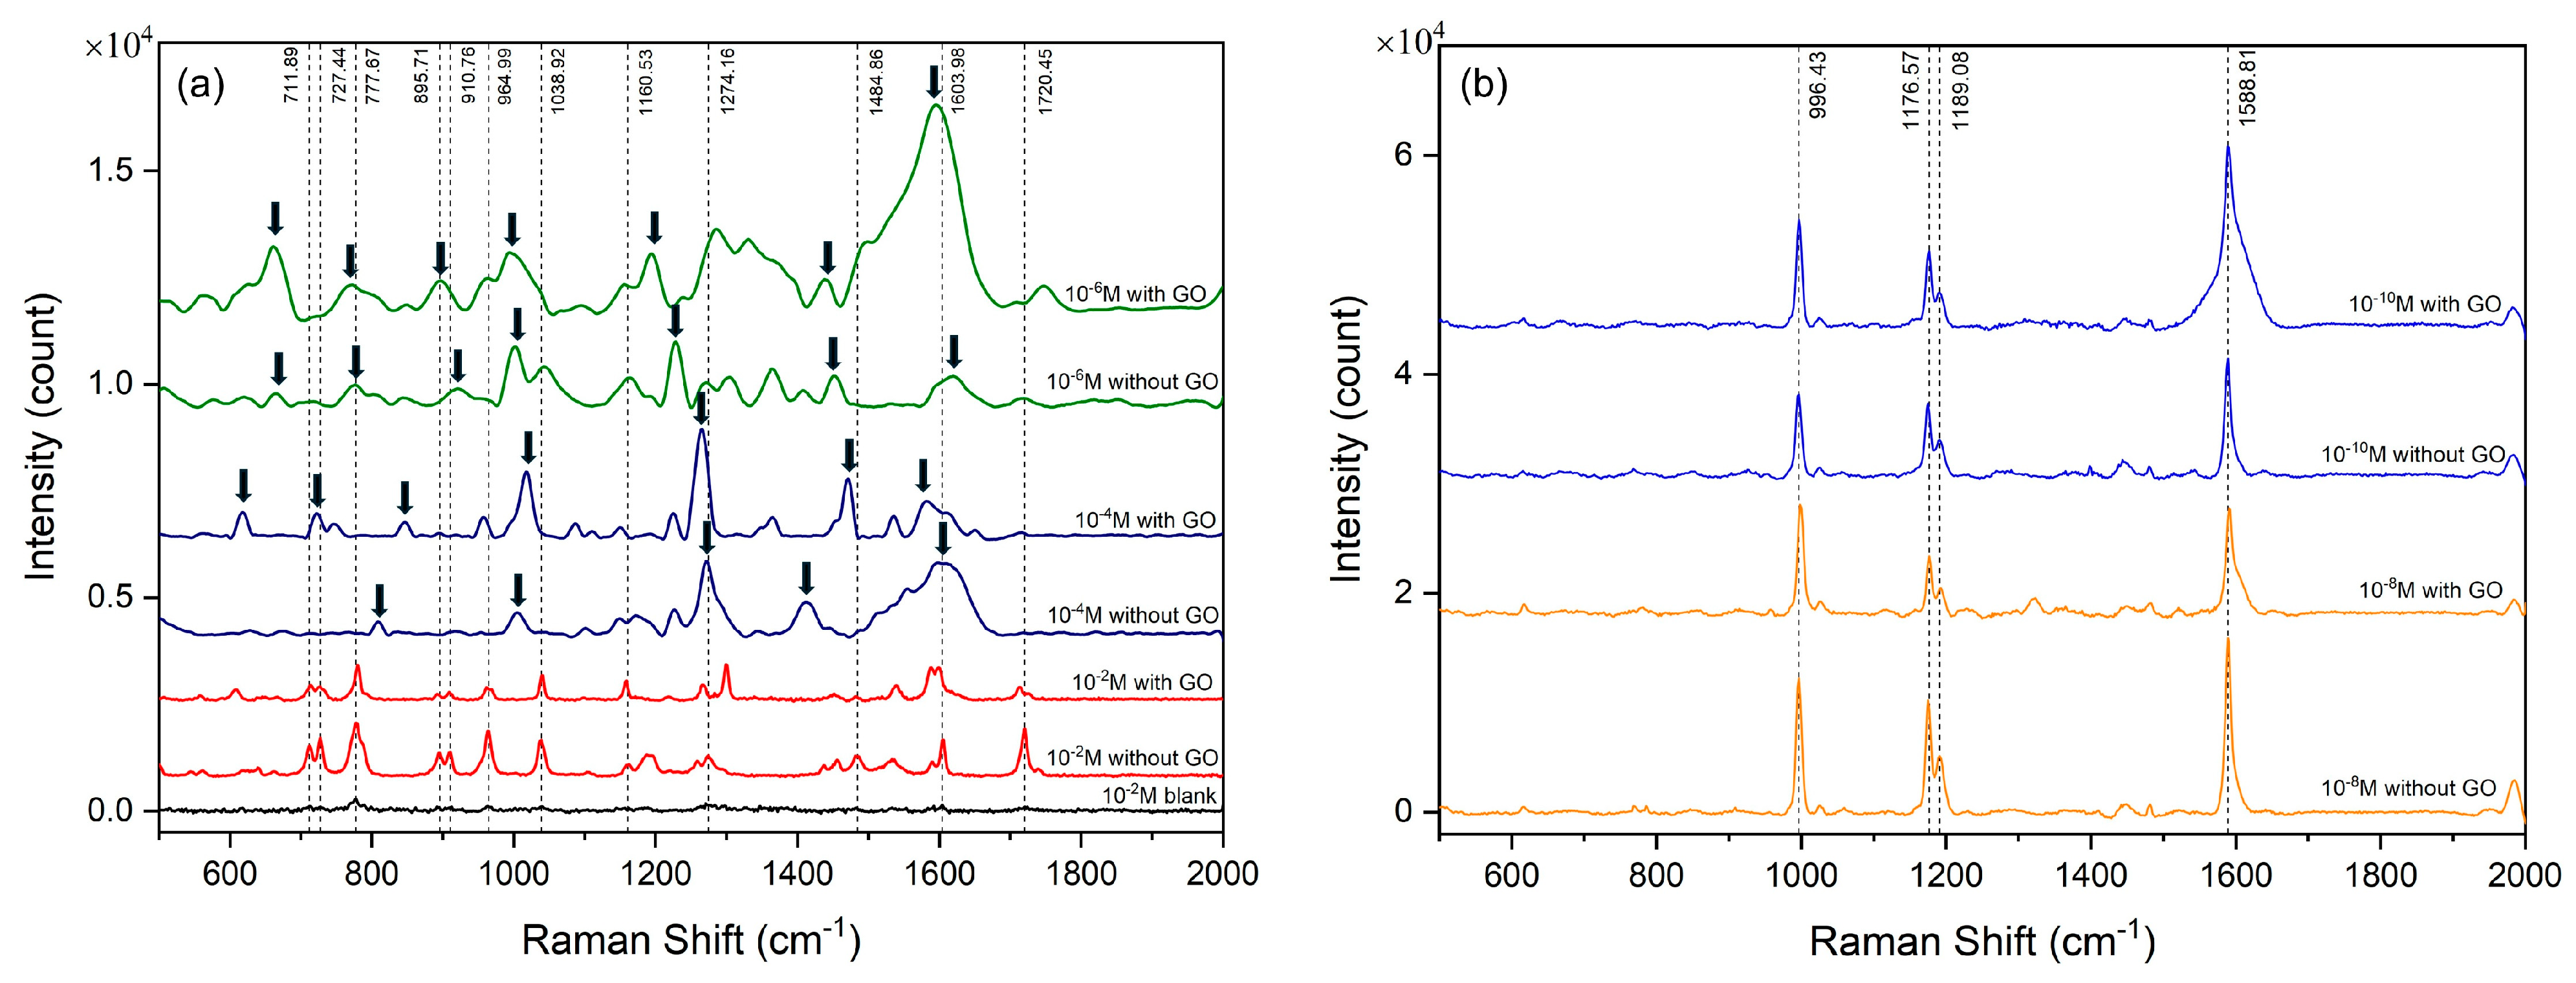
3.2. Performance of Cotton Swab-Based SERS Substrates in Detecting RhB and Thiophanate Methyl

We evaluated the performance of our cotton swab-based SERS substrates by using them to detect Rhodamine B (RhB) and thiophanate methyl (TM). RhB is an organic compound belonging to the xanthene group. While it is widely used as colorant in various industries including textile, paint, paper, glass, plastic, and food, when released to the environment, RhB is a dangerous contaminant due to its stability, developmental toxicity, mutagenicity, and carcinogenic activities [45]. For SERS, RhB is a popular molecular probe due to its well-documented vibrational features. Multiple RhB concentrations ranging from 10−3 down to 10−12 M were prepared by diluting the stock solution multiple times until the desired concentrations were reached. Figure 4 presents our selected results showing an improved detection limit of 10−12 M RhB. Specifically, all eight prominent peaks of RhB at 620 cm−1, 933 cm−1, 1191 cm−1, 1281 cm−1, 1357 cm−1, 1505 cm−1, 1531 cm−1, and 1649 cm−1 were clearly observed for Raman spectra of higher RhB concentrations, from 10−3 M to 10−6 M [29]. The list of major RhB peaks and their associated Raman mode assignments is shown in Table 1. At RhB concentrations of 10−8 M and below, some weaker peaks at 620 cm−1, 1505 cm−1, and 1531 cm−1 started to die down with decreasing concentrations, while other peaks remained visible even at 10−12 M. At these low concentrations, we also observed peak shifting toward either lower or higher wavenumbers, as well as peak intensity fluctuation. We attributed these behaviors to the possible redistribution of charges and the altered electronic molecular structure of the RhB-Ag complex due to changing molecular interactions throughout such a wide range of RhB concentrations [46]. When comparing the performance of the Ag NP/cotton swab and the GO/Ag NP/cotton swab side by side, down to 10−8 M, we consistently observed higher peak intensities with the latter, while other peak features remained unchanged. The addition of GO on top of Ag NPs clearly enhanced the sensitivity of the substrate due to its better adsorption of probe molecules, its supplementary chemical enhancement effect, and perhaps synergistic interactions with Ag NPs. From 10−10 M to 10−12 M, however, there was no noticeable difference in peak intensities with and without GO. At these ultra-low concentrations, the low populations of probe molecules made the contribution of GO surface to sensitivity insignificant. To the contrary, the Raman peaks obtained from the Ag NP/cotton swab substrates appeared sharper than those obtained from the substrates with GO. Likely, the diminishing SPR effect from Ag NPs when GO was laid in between Ag NPs and the probe molecules would dominate those advantages brought about by the GO surface, reducing the overall sensitivity. When a Raman spectrum of 10−3 M RhB was obtained from the plain cotton swab without Ag NPs and GO, no obvious peak was detected, indicating that all the observable Raman peaks were enhanced exclusively by the presence of Ag NPs and GO nanosheets.
Next, we applied the same detection method to thiophanate methyl (TM). TM is a member of the benzimidazole group of fungicides, mainly used to control diseases caused by ascomycota fungal pathogen in vegetables. However, human exposure to TM would cause serious health effects such as skin disease, muscle twitching, and kidney or nervous system damage. Therefore, TM is classified as a toxic agricultural chemical by the World Health Organization (WHO), and its maximum residue limit is set to the range of 0.05–5 mg/kg, depending on food category, by the Food and Agriculture Organization (FAO) [48]. It is, thus, important to be able to detect any TM present in our agricultural products and ecological environment. A series of TM concentrations from 10−2 M to 10−10 M in DI water were prepared as probe molecules. Cotton swab-based SERS substrates were dipped into each concentration, and the corresponding Raman spectra were recorded and are shown in Figure 5. Again, the plain cotton swab substrate without any Ag NPs and GO showed virtually no peak even when 10−2 M TM was used, strongly confirming that the cotton swab alone was a non-active SERS substrate. When Ag NPs and then GO were added to the cotton swab, typical peaks of TM were easily spotted. Specifically, at the highest TM concentration, 10−2 M, nearly all of the reported Raman peaks showed up in our spectra with and without GO (Figure 5a and Table 2). Decreasing the TM concentration reduced the number of TM peaks. In particular, from 10−4 to 10−6 M, the number of TM peaks was slightly reduced to those around 1600 cm−1, 1480 cm−1, 1200–1300 cm−1, 1000 cm−1, 700–900 cm−1, and 650 cm−1 (Figure 5a). Then, from 10−8 M to 10−10 M, the number of TM peaks was reduced to only three peaks at 1589 cm−1, ~1180 cm−1 (double peaks), and 996 cm−1 (Figure 5b). Similarly to RhB, we observed peak shifting, peak intensity fluctuation, and change in peak shape at the high TM concentration range (10−2 M–10−6 M), and we also attributed them to the concentration-dependent molecular interactions. By contrast, at the low concentration range (10−8 M–10−10 M), the peaks appeared uniform with concentrations, perhaps due to the sparse distribution of the TM molecules preventing them from mutual interactions. When comparing TM spectra from the Ag NP/cotton swab and the GO/Ag NP/cotton swab side by side, we observed no difference in peak intensities. It was not quite clear to us why GO did not enhance TM peak intensity as it did with RhB. One possible explanation was the overwhelming electronic interactions between TM molecules that might dwarf the effect of charge transfer between GO and TM and depress peak intensity enhancement by the chemical mechanism. One surprising result from our investigation was the unexpected increase in peak intensity when the TM concentration decreased. According to Stair et al. [49] and Muehlethaler et al. [50], sample self-absorption occurred when the analytes absorbed both the incident radiation and the scattered radiation, resulting in attenuated Raman signal and peak intensity. If self-absorption indeed applied to our samples, it would explain the low peak intensities observed with high TM concentrations when TM molecules were in proximity to each other and could absorb light scattered from their neighbors. When the TM concentration decreased, the effect of self-absorption would also decrease as more distant TM molecules would less likely absorb each other’s signals. This inversely proportional relationship between peak intensity and concentration would be extremely helpful for applications in which a trace amount of analytes needs to be detected.

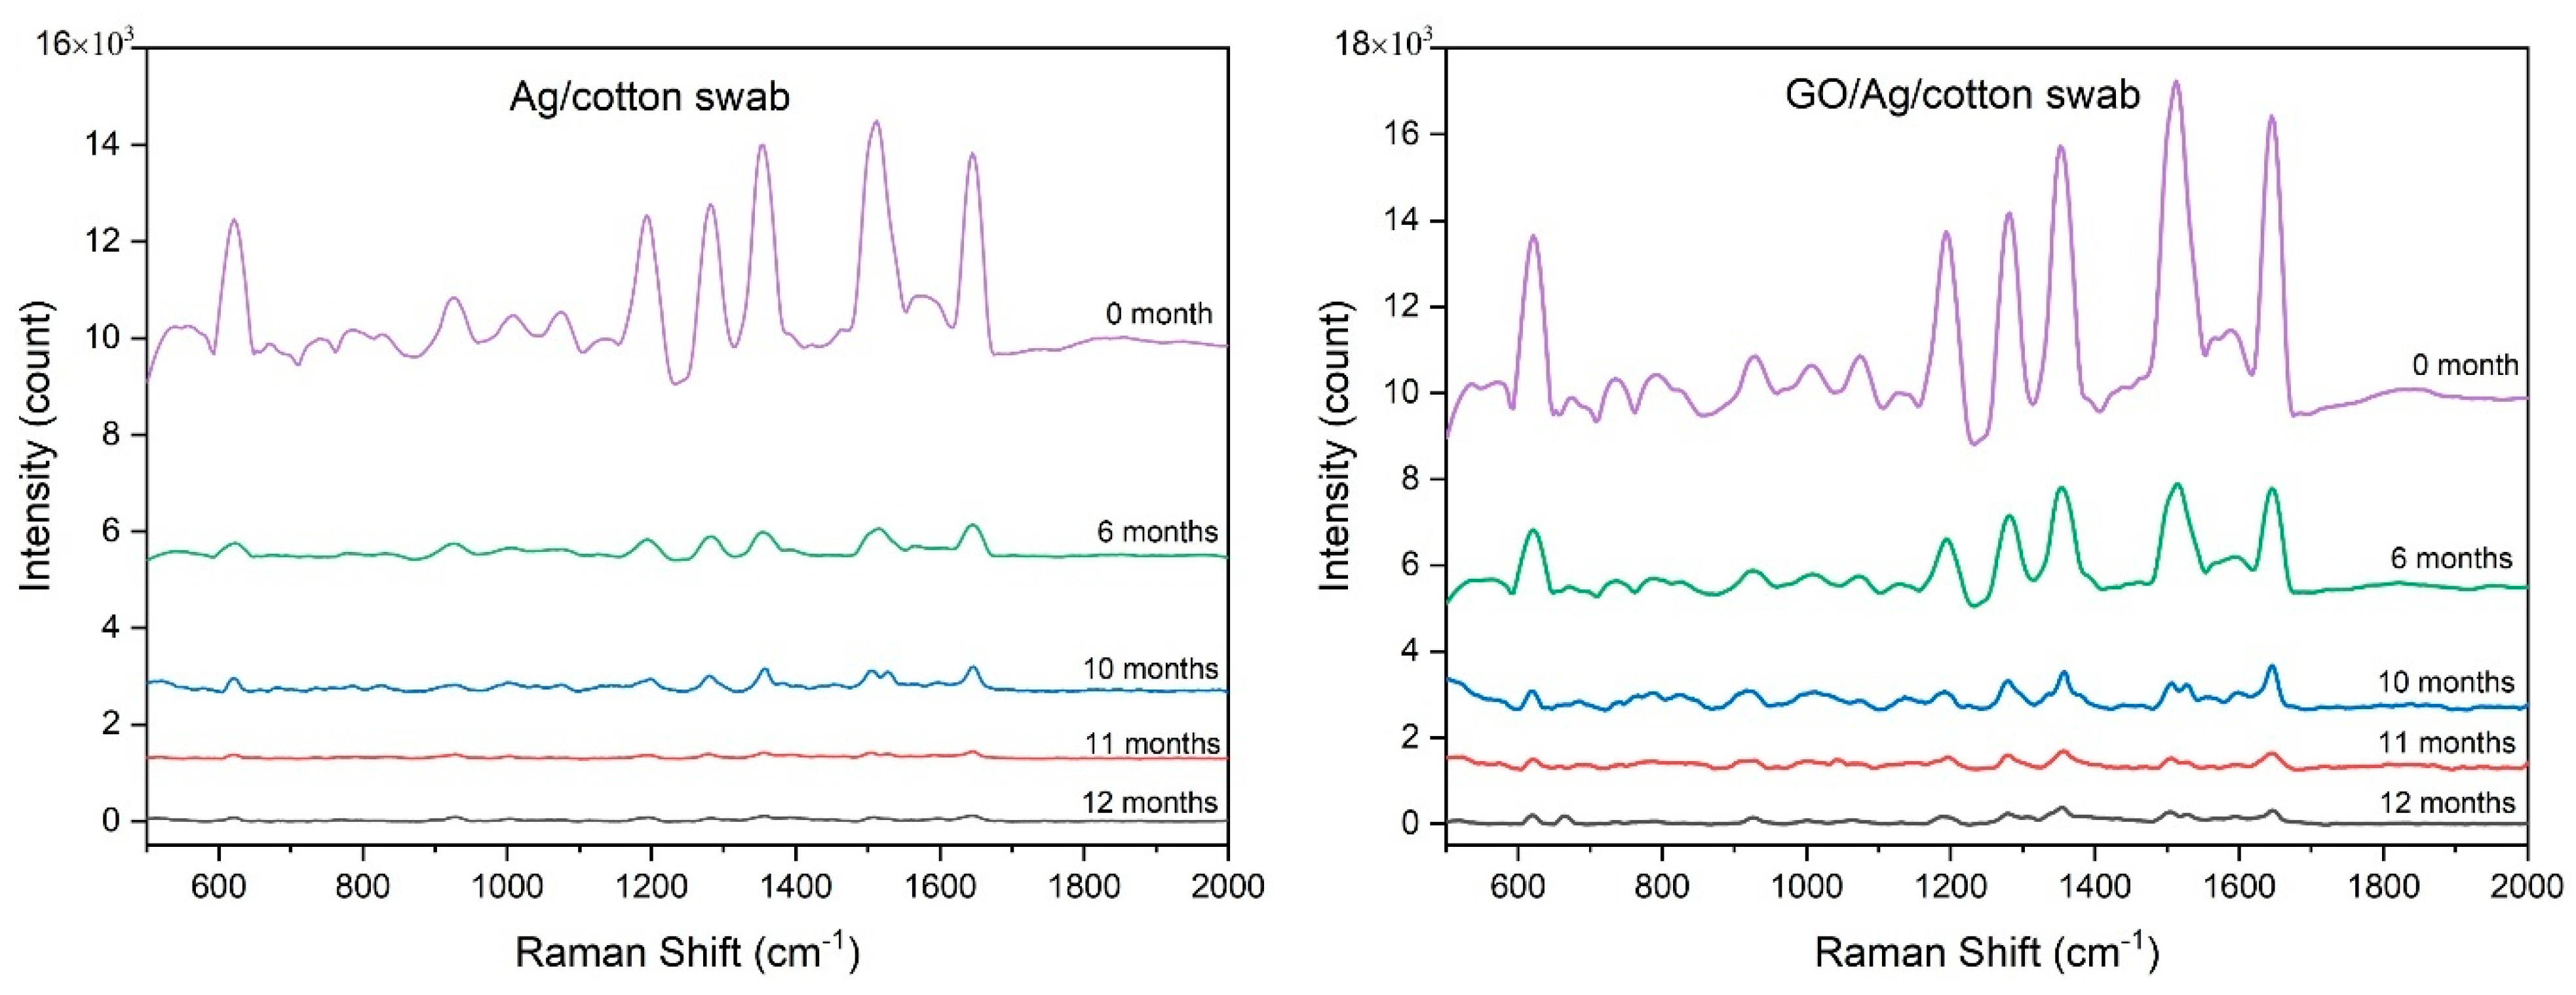
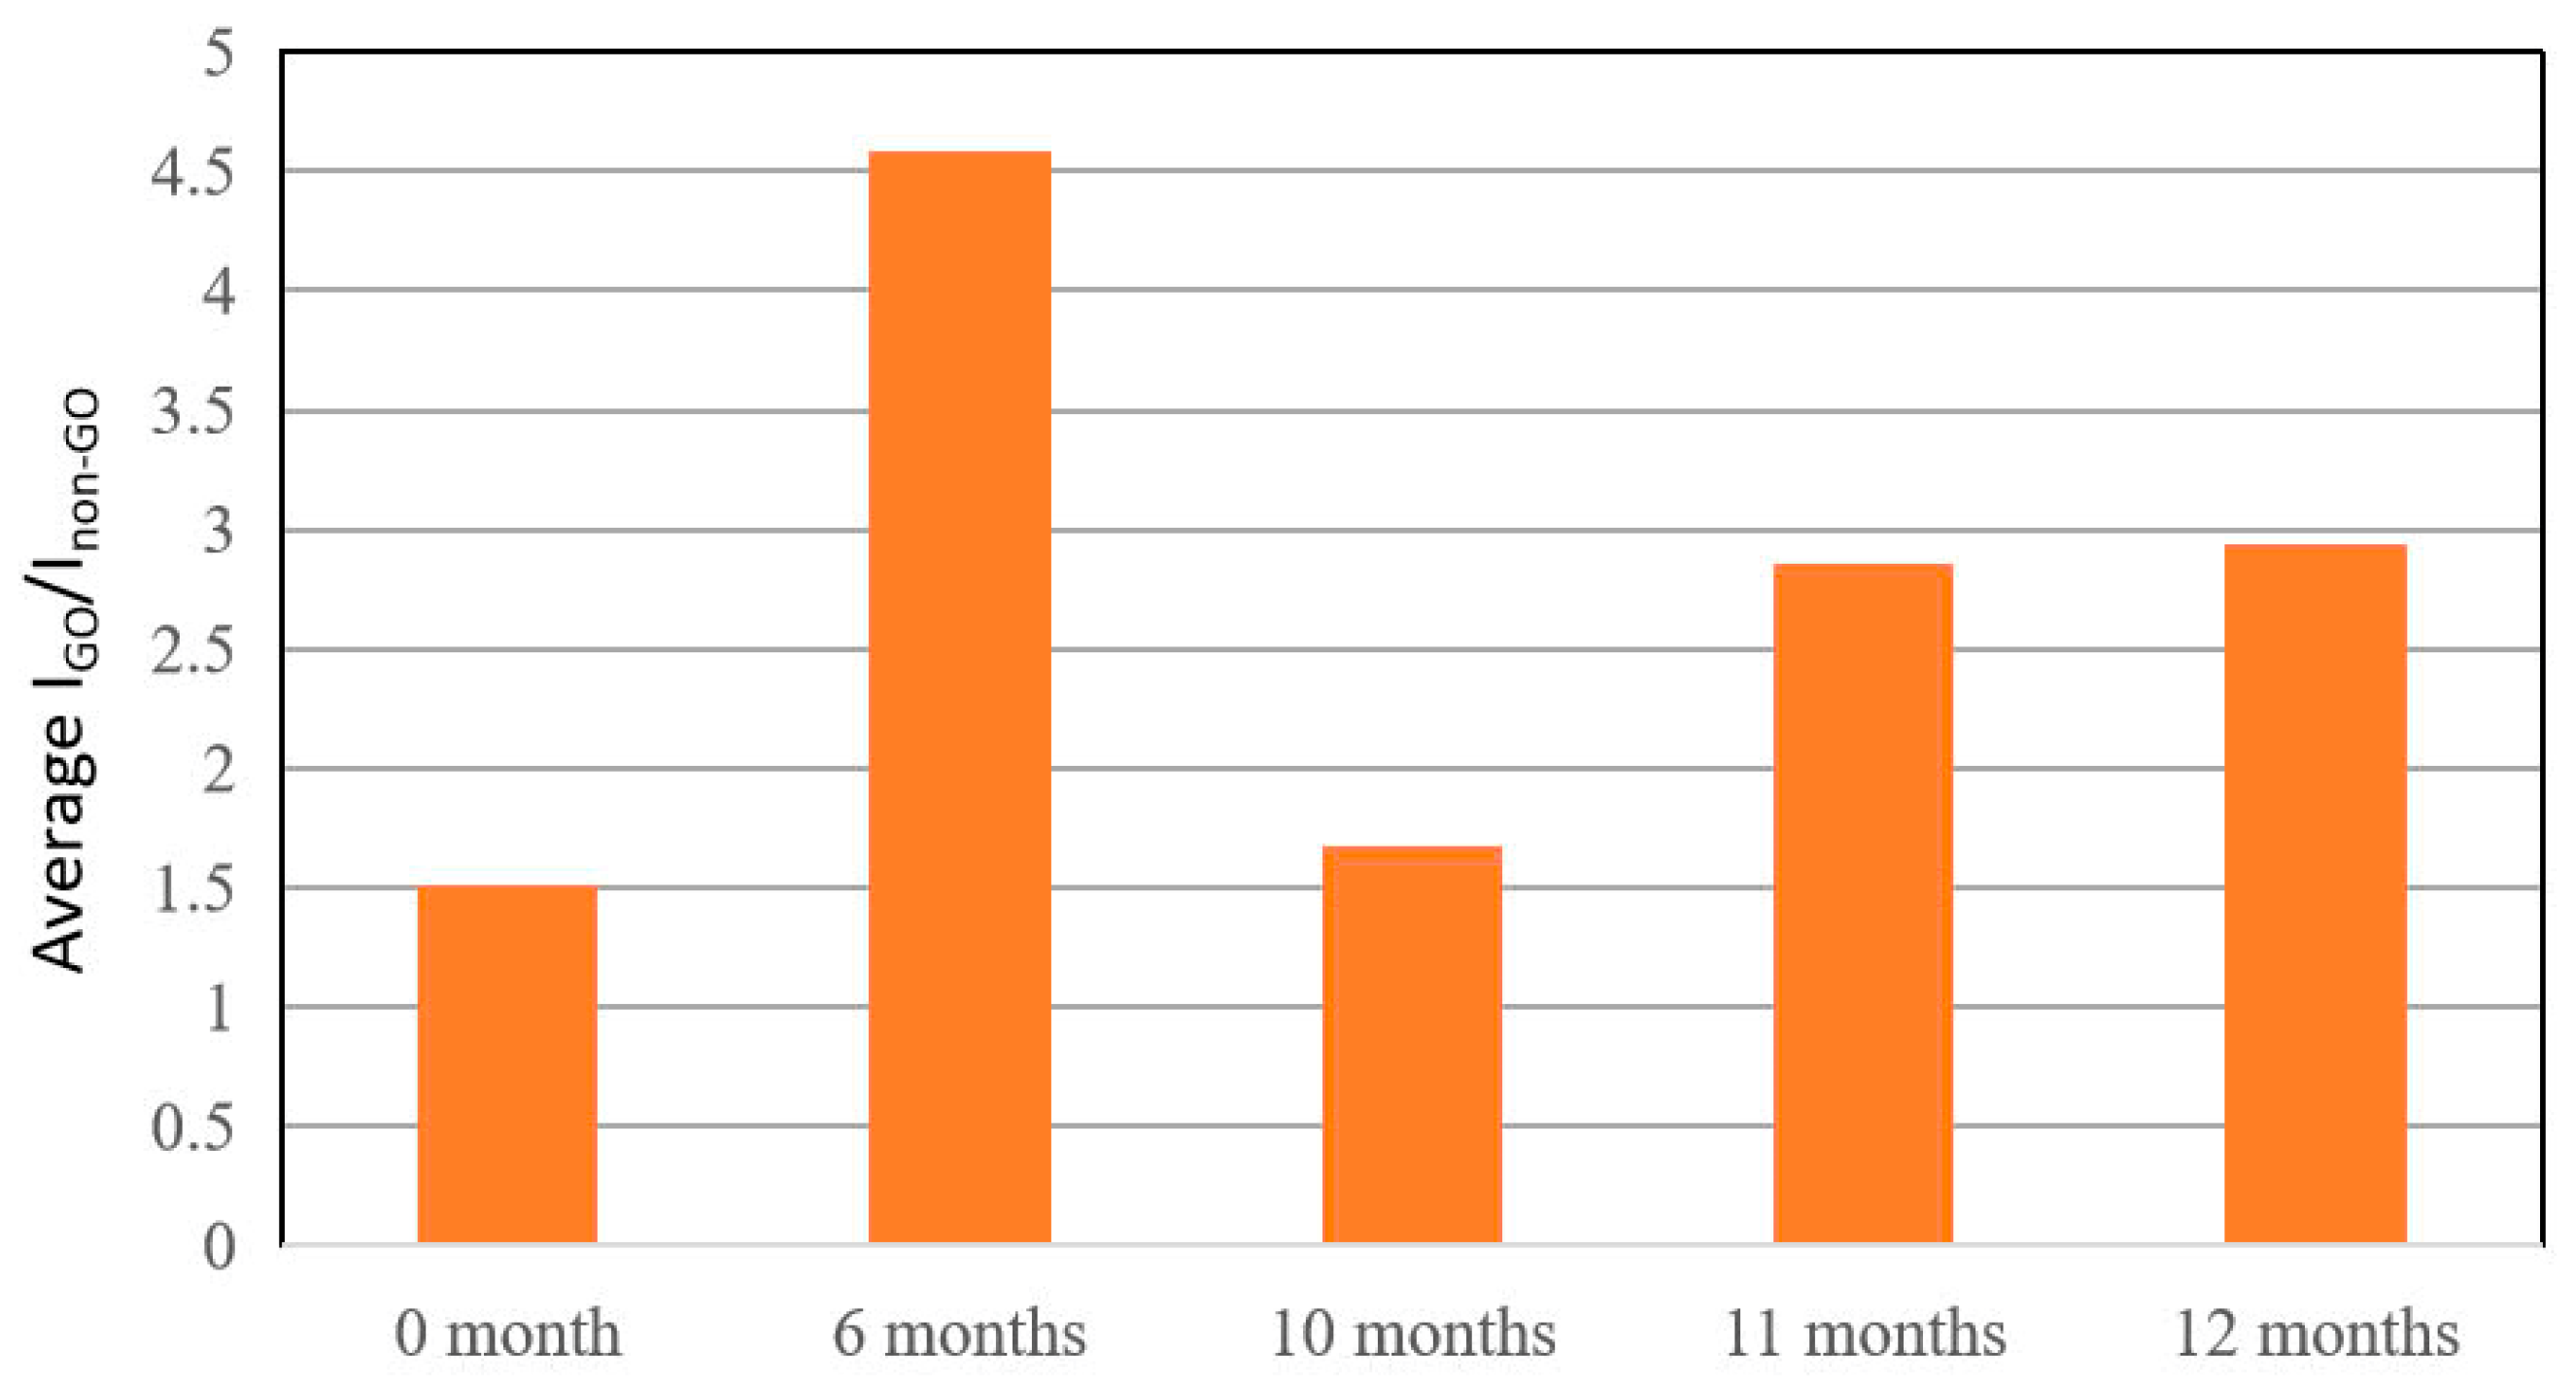
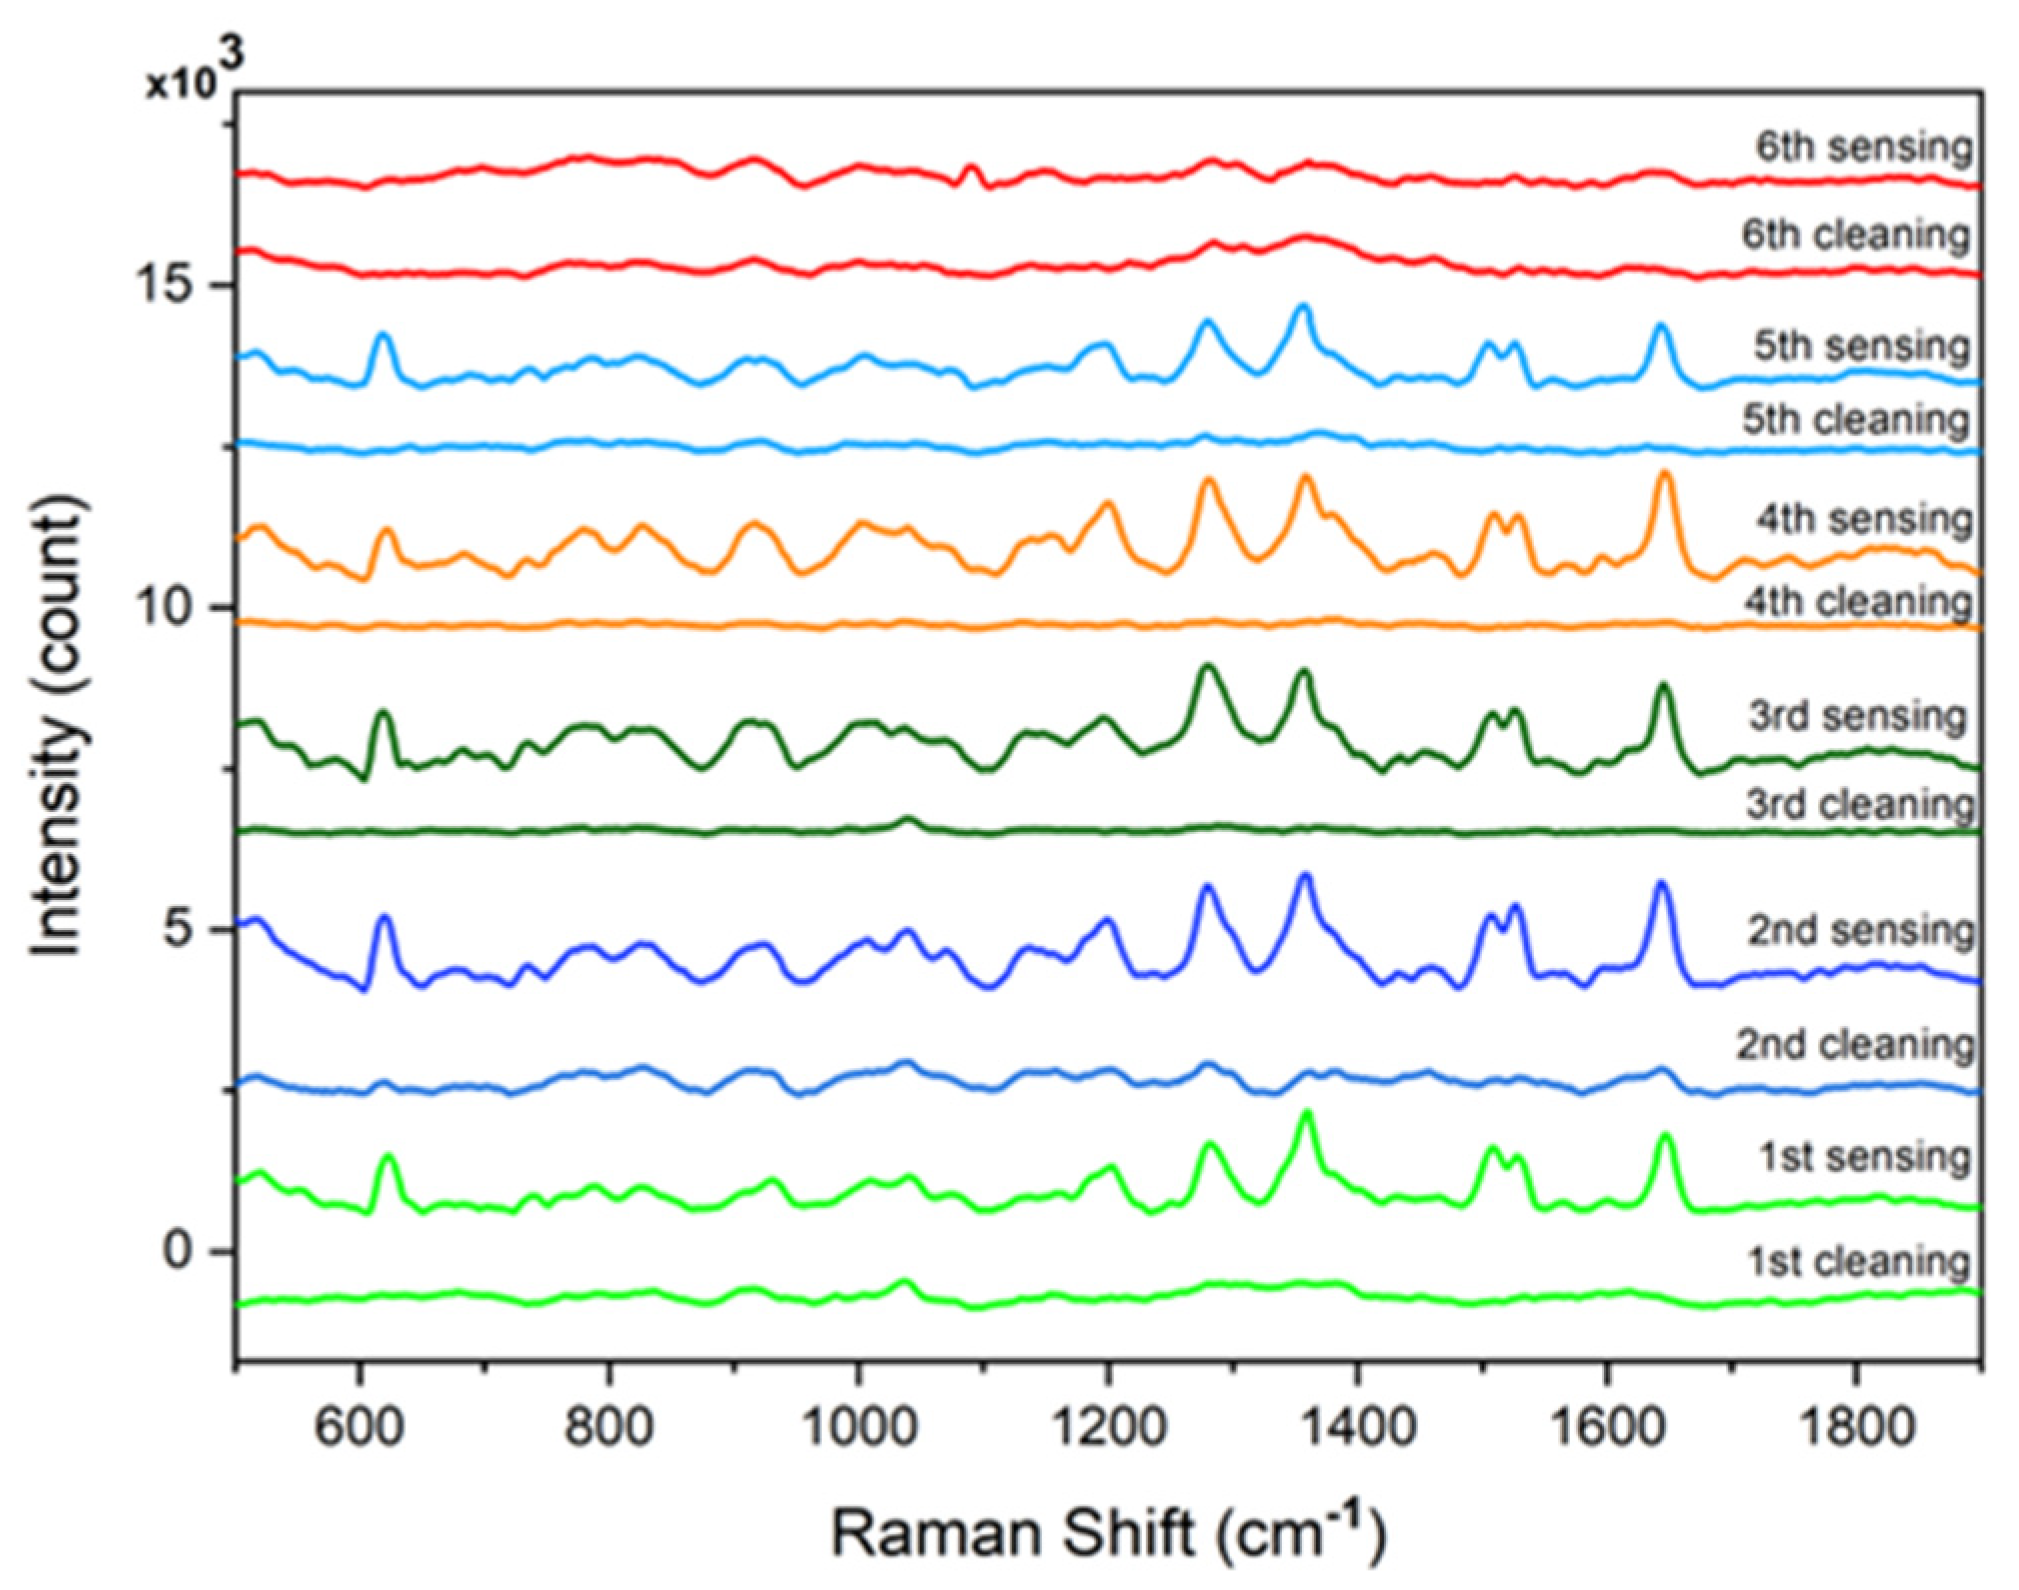
3.3. Investigation of the Stability and Recyclability of Cotton Swab-Based SERS Substrates

Among the plasmonic materials, Ag is dominantly the material of choice and has been used extensively in all kinds of morphologies and structures both commercially and in research. However, when Ag is exposed to air for sufficient time, it can be oxidized, turning metallic Ag0 into Ag+. The Ag2O formed on the surface of Ag NPs would deactivate them as SERS substrates. Thus, while excellent sensitivity is the key characteristic that makes Ag so popular, the relatively quick degradation of this sensitivity over time in air is an issue that makes Ag less attractive than Au, for example. In this work, we investigated the stability of a Ag/cotton swab substrate in air, up to 12 months. Simultaneously, the stability of a GO/Ag/cotton swab was also recorded for comparison. The results are shown in Figure 6. In addition, the average intensity ratios between the peaks of the Ag/cotton swab and the GO/Ag/cotton swab are indicated in Figure 7 to give the readers an idea of how large the Raman signals obtained from one substrate were relative to those obtained from the other after each recorded month. Our first data set was obtained momentarily after the substrates were fabricated and, on average, the signal intensities from the GO/Ag/cotton swab were ~1.5 times greater than those from the Ag/cotton swab. Since many research groups chose a 6-month period or less to report their stability results, we decided to record our second data set after the same period to quickly reach the point that we expected a significant degradation of Ag NPs. As seen in the figures, after 6 months, all the peaks obtained from the Ag/cotton swab and the GO/Ag/cotton swab had their intensities reduced. While this reduction made the spectrum harder to use to identify RhB by the Ag/cotton swab, the reduction was much less severe for the GO/Ag/cotton swab. In fact, after 6 months, the peak intensities obtained from the latter were, on average, still ~4.5 times greater than those obtained from the former. Ten months later, the RhB spectrum obtained from the Ag/cotton swab was barely detectable and then no longer visible after 11 months and beyond. Likewise, although peak intensities did decrease in the RhB spectra of the GO/Ag/cotton swab, even after 12 months, all eight prominent peaks of RhB were still somewhat detectable and consistently 3 times greater in intensity than those of the Ag/cotton swab. Clearly, the results from this stability investigation encourage the use of GO/Ag/cotton swabs for a longer shelf life of SERS substrates. We attributed this enhanced stability to the chemical enhancement mechanism described above, and to a much greater extent, to the protection of GO against Ag oxidation. If GO protection had not been effective, RhB peak intensities would have decreased to the levels equivalent to those without GO after several months of air exposure because the Ag2O formed would have deactivated the surfaces of Ag NPs, suppressing any synergistic GO-Ag NP interactions and making the greater analyte adsorption of GO much less useful. Furthermore, if GO protection had not been effective and the Ag NPs had been deactivated, the chemical enhancement mechanism alone would have not been able to maintain three times greater peak intensities for an RhB concentration of 10−5 M for almost a year. GO protection would have been more effective if GO had completely covered the Ag NPs, which was not our case, as seen in Figure 2c. More work on the relationship between the extent of GO coverage and the quality of its protection of Ag NPs from degradation by the ambient environment and the sampling environment will be conducted in the future.
Regarding the recyclability of our SERS substrates, we decided to carry out our experiments with the GO/Ag/cotton swab. We expected that the GO overlay would act as a shield to prevent the Ag NPs from the full attack of ozone, thus keeping the surfaces of the Ag NPs active longer for more detection cycles. Ozone has been used for more than a century as a disinfectant for drinking water and, more recently, it has been used to treat inorganic and organic pollutants in wastewater. In the aquatic environment, gaseous ozone either forms hydroxyl radicals or directly reacts with microorganisms and pollutants to transform them into other unharmful species [53]. In this work, ozone reacted with RhB in vacuum, and the results of multiple recycling rounds are shown in Figure 8. After the first round of RhB detection, the substrate was cleaned with ozone, and upon this treatment, a Raman spectrum of the substrate surface was recorded for any trace of RhB left. As seen in Figure 8, no sign of an RhB peak could be located. Then, the same substrate was dipped again into 10−5 M RhB solution and we observed RhB peaks again, this time without any noticeable reduction in intensity or the number of peaks or any altering in peak shapes. Similar outcomes were also observed even after repeating this “on/off” cycle four more times, for a total of five cycles. When we reached the sixth cycle, the substrate was still cleaned successfully without any trace of RhB, but this time no sign of RhB peaks was observed either after dipping the substrate in 10−5 M RhB. Thus, our results indicated that ozonation was a suitable method to clean SERS substrates after RhB detection. The fact that recyclability stopped at the sixth round could be due to two reasons. First, Ag NPs and GO could be deactivated completely at this stage. The abrupt decrease to zero signal at the sixth round instead of a gradual decrease in peak intensities indicated that there was a “surviving threshold” upon which Raman scattering enhancement collapsed and the substrate was deactivated. One possible scenario was that, after constantly exposing the GO/Ag/cotton swab to ozone, GO was eventually penetrated by ozone at the sixth round, leaving the entire surfaces of the Ag NPs exposed to direct ozone oxidation and leading to their deactivation shortly after that. Second, rinsing the substrate after ozone cleaning did not completely wash away the new transformed RhB products and they accumulated after each cycle. This accumulation of by-products would reduce the available substrate surfaces for RhB adsorption and weaken the Raman signals. The abrupt decrease to zero signal at the sixth recyclability round should be the result of those two degradation mechanisms combined. This ozonation method is expected to also be applicable to cleaning other organic compounds and should be further explored.

4. Conclusions

Cotton swab-based SERS substrates, namely, a Ag/cotton swab and a GO/Ag/cotton swab, were successfully fabricated using a facile solution-based method. We showed, in this work, that the cotton swab-based SERS substrates were ultra-sensitive by detecting RhB and thiophanate methyl at concentrations as low as 10−12 M and 10−10 M, respectively. We conducted further investigations on the stability and recyclability of these substrates and our results indicated that the GO/Ag/cotton swab substrate would still be able to detect RhB after 12 months of exposure to the ambient environment, and this GO/Ag/cotton swab substrate would be recycled up to five times by cleaning it with ozone. Regarding thiophanate methyl detection, we observed an increase in Raman peak intensities as the concentration of the analytes decreased, which proved to be very useful for detecting analytes of minute amount. In the near future, we expect to direct our efforts toward exploring ways to improve the stability of the GO/Ag/cotton swab substrate as well as its recyclability. Different types of analytes to be detected will also be incorporated into our plan.

Author Contributions

Conceptualization, M.H.T.; methodology, M.H.T.; formal analysis, M.H.T., A.D.L., C.L.T.N., and M.D.H.; investigation, M.H.T., A.D.L., C.L.T.N., M.D.H., and K.V.T.; writing—original draft preparation, M.H.T.; writing—review and editing, M.H.T.; supervision, M.H.T. All authors have read and agreed to the published version of the manuscript.

Funding

This research is funded by Vietnam National University HoChiMinh City (VNU-HCM) under grant number C2022-20-23.

Data Availability Statement

All data that support the findings of this study are included within the article.

Conflicts of Interest

The authors declare no conflicts of interest.

References

  1. Pérez-Jiménez, A.I.; Lyu, D.; Lu, Z.; Liu, G.; Ren, B. Surface-enhanced Raman spectroscopy: Benefits, trade-offs and future developments. Chem. Sci. 2020, 11, 4563–4577. [Google Scholar] [CrossRef] [PubMed]
  2. Chen, Y.; Zhu, L.; Yang, Y.; Wu, D.; Zhang, Y.; Cheng, W.; Tang, X. Fabrication of a metal organic framework (MOF)-modified Au nanoparticle array for sensitive and stable SERS sensing of paraquat in cereals. J. Food Sci. 2023, 88, 1769–1780. [Google Scholar] [CrossRef]
  3. Xie, W.; Xu, A.; Yeung, E.S. Determination of NAD+ and NADH in a Single Cell under Hydrogen Peroxide Stress by Capillary Electrophoresis. Anal. Chem. 2009, 81, 1280–1284. [Google Scholar] [CrossRef]
  4. Cai, J.; Zhu, Q. New advances in signal amplification strategies for DNA methylation detection in vitro. Talanta 2024, 273, 125895. [Google Scholar] [CrossRef] [PubMed]
  5. Vo-Dinh, T.; Liu, Y.; Fales, A.M.; Ngo, H.; Wang, H.; Register, J.K.; Yuan, H.; Norton, S.J.; Griffin, G.D. SERS Nanosensors and Nanoreporters: Golden Opportunities in Biomedical Applications. WIREs Nanomed. Nanobiotechnology 2014, 7, 17–33. [Google Scholar] [CrossRef] [PubMed]
  6. Dodds, J.N.; Baker, E.S. Ion Mobility Spectrometry: Fundamental Concepts, Instrumentation, Applications, and the Road Ahead. J. Am. Soc. Mass Spectrom. 2019, 30, 2185–2195. [Google Scholar] [CrossRef]
  7. Hoppmann, E.P.; Yu, W.W.; White, I.M. Highly sensitive and flexible inkjet printed SERS sensors on paper. Methods 2013, 63, 219–224. [Google Scholar] [CrossRef]
  8. Zhang, X.Y.; Young, M.A.; Lyandres, O.; van Duyne, R.P. Rapid detection of an anthrax biomarker by surface-enhanced Raman spectroscopy. J. Am. Chem. Soc. 2005, 127, 4484–4489. [Google Scholar] [CrossRef]
  9. Qiu, Y.; Kuang, C.; Liu, X.; Tang, L. Single-Molecule Surface-Enhanced Raman Spectroscopy. Sensors 2022, 22, 4889. [Google Scholar] [CrossRef]
  10. Schmidt, M.M.; Brolo, A.G.; Lindquist, N.C. Single-Molecule Surface-Enhanced Raman Spectroscopy: Challenges, Opportunities, and Future Directions. ACS Nano 2024, 18, 25930–25938. [Google Scholar] [CrossRef]
  11. Sharma, B.; Frontiera, R.R.; Henry, A.I.; Ringe, E.; Van Duyne, R.P. SERS: Materials, applications, and the future. Mater. Today 2012, 15, 16–25. [Google Scholar] [CrossRef]
  12. Tran, M.; Roy, S.; Kmiec, S.; Whale, A.; Martin, S.; Sundararajan, S.; Padalkar, S. Formation of Size and Density Controlled Nanostructures by Galvanic Displacement. Nanomaterials 2020, 10, 644. [Google Scholar] [CrossRef] [PubMed]
  13. Dao, C.T.; Luong, N.T.Q.; Cao, A.T.; Kieu, M.N. Detection of a Sudan dye at low concentrations by surface-enhanced Raman spectroscopy using silver nanoparticles. Commun. Phys. 2019, 29, 521–526. [Google Scholar] [CrossRef]
  14. Tran, M.; Whale, A.; Padalkar, S. Exploring the efficacy of platinum and palladium nanostructures for organic molecule detection via Raman spectroscopy. Sensors 2018, 18, 147. [Google Scholar] [CrossRef]
  15. Kundu, S.; Yi, S.-I.; Ma, L.; Chen, Y.; Dai, W.; Sinyukov, A.M.; Liang, H. Morphology dependent catalysis and surface enhanced Raman scattering (SERS) studies using Pd nanostructures in DNA, CTAB and PVA scaffolds. Dalton Trans. 2017, 46, 9678–9691. [Google Scholar] [CrossRef]
  16. Yu, X.; Cai, H.; Zhang, W.; Li, X.; Pan, N.; Luo, Y.; Wang, X.; Hou, J.G. Tuning chemical enhancement of SERS by controlling the chemical reduction of graphene oxide nanosheets. ACS Nano 2011, 5, 952–958. [Google Scholar] [CrossRef]
  17. Ling, X.; Xie, L.; Fang, Y.; Xu, H.; Zhang, H.; Kong, J.; Dresselhaus, M.S.; Zhang, J.; Liu, Z. Can graphene be used as a substrate for Raman enhancement? Nano Lett. 2010, 10, 553–561. [Google Scholar] [CrossRef]
  18. Liu, Z.M.; Li, S.X.; Hu, C.F.; Zhang, W.; Zhong, H.Q.; Guo, Z.Y. pH-dependent surface-enhanced Raman scattering of aromatic molecules on graphene oxide. J. Raman Spectrosc. 2013, 44, 75–80. [Google Scholar] [CrossRef]
  19. He, R.; Lai, H.; Wang, S.; Chen, T.; Xie, F.; Chen, Q.; Liu, P.; Chen, J.; Xie, W. Few-layered vdW MoO3 for sensitive, uniform and stable SERS applications. Appl. Surf. Sci. 2020, 507, 145116. [Google Scholar] [CrossRef]
  20. Kim, J.; Jang, Y.; Kim, N.J.; Kim, H.; Yi, G.C.; Shin, Y.; Kim, M.H.; Yoon, S. Study of chemical enhancement mechanism in non-plasmonic surface enhanced Raman spectroscopy (SERS). Front. Chem. 2019, 7, 582. [Google Scholar] [CrossRef]
  21. Sun, L.; Hu, H.; Zhan, D.; Yan, J.; Liu, L.; Teguh, J.S.; Yeow, E.K.L.; Lee, P.S.; Shen, Z. Plasma Modified MoS2 Nanoflakes for Surface Enhanced Raman Scattering. Small 2014, 10, 1090–1095. [Google Scholar] [CrossRef] [PubMed]
  22. Mahmoud, A.Y.F.; Rusin, C.T.; McDermott, M.T. Gold nanostars as a colloidal substrate for in-solution SERS measurements using a handheld Raman spectrometer. Analyst 2020, 145, 1396–1407. [Google Scholar] [CrossRef] [PubMed]
  23. Im, H.; Bantz, K.; Lindquist, N.; Haynes, C.; Oh, S. Vertically oriented sub-10-nm plasmonic nanogap arrays. Nano Lett. 2010, 10, 2231–2236. [Google Scholar] [CrossRef]
  24. Wu, Y.; Hang, T.; Komadina, J.; Ling, H.; Li, M. High-adhesive superhydrophobic 3D nanostructured silver films applied as sensitive, long-lived, reproducible and recyclable SERS substrates. Nanoscale 2014, 6, 9720–9726. [Google Scholar] [CrossRef] [PubMed]
  25. Jiang, X.; Qin, X.; Yin, D.; Gong, M.; Yang, L.; Zhao, B.; Ruan, W. Rapid monitoring of benzylpenicillin sodium using Raman and surface enhanced Raman spectroscopy. Spectrochim. Acta Part A Mol. Biomol. Spectrosc. 2015, 140, 474–478. [Google Scholar] [CrossRef]
  26. Huang, L.; Zhou, Y.; Han, S.; Yan, Y.; Zhou, L.; Chen, W.; Zhou, P.; Chen, X.; Roy, V. Controlled assembly of silver nanoparticles monolayer on 3D polymer nanotubes and their applications. Small 2014, 10, 4645–4650. [Google Scholar] [CrossRef]
  27. Tran, M.; Fallatah, A.; Whale, A.; Padalkar, S. Utilization of inexpensive carbon-based substrates as platforms for sensing. Sensors 2018, 18, 2444. [Google Scholar] [CrossRef]
  28. Gong, Z.; Du, H.; Cheng, F.; Wang, C.; Wang, C.; Fan, M. Fabrication of SERS swab for direct detection of trace explosives in fingerprints. Appl. Mater. Interfaces 2014, 6, 21931–21937. [Google Scholar] [CrossRef]
  29. Hoang, M.D.; Nguyen, T.D.; Nguyen, C.T.L.; Luong, A.D.; Le, L.N.; Tran, K.V.; Huynh, K.C.; Nguyen, K.D.; Tran, M.H. Hybrid SERS substrate based on cotton swab for sensitive detection of organic molecules. Mater. Res. Express 2024, 11, 025002. [Google Scholar]
  30. Kavitha, C.; Bramhaiah, K.; John, N.S.; Ramachandran, B.E. Low cost, ultra-thin films of reduced graphene oxide–Ag nanoparticle hybrids as SERS based excellent dye sensors. Chem. Phys. Lett. 2015, 629, 81–86. [Google Scholar] [CrossRef]
  31. Sun, S.; Wu, P. Competitive surface-enhanced Raman scattering effects in noble metal nanoparticle-decorated graphene sheets. Phys. Chem. Chem. Phys. 2011, 13, 21116–21120. [Google Scholar] [CrossRef]
  32. Ngo, D.X.; Tran, H.Q.; Le, V.V.; Le, T.T.; Le, T.A. Multiwalled carbon nanotubes/silver nanocomposite as effective SERS platform for detection of methylene blue dye in water. J. Sci. Adv. Mater. Devices 2016, 1, 84–89. [Google Scholar]
  33. Tran, H.T.; Nguyen, H.M.; Mai, H.H.; Pham, T.V.; Sai, D.C.; Nguyen, B.T.; Pham, H.N.; Nguyen, T.T.; Ho, H.K.; Nguyen, T.V. Toxic Gases on β12 Borophene: The Selective Adsorption. VNU J. Sci. Math. Phys. 2020, 36, 1–6. [Google Scholar]
  34. Fang, H.; Zhang, C.X.; Liu, L.; Zhao, Y.M.; Xu, H.J. Recyclable three-dimensional Ag nanoparticle-decorated TiO2 nanorod arrays for surface-enhanced Raman scattering. Biosens. Bioelectron. 2015, 64, 434–441. [Google Scholar] [CrossRef]
  35. Kumar, S.; Lodhi, D.K.; Singh, J.P. Highly sensitive multifunctional recyclable Ag–TiO2 nanorod SERS substrates for photocatalytic degradation and detection of dye molecules. RSC Adv. 2016, 6, 45120–45126. [Google Scholar] [CrossRef]
  36. Xu, S.C.; Zhang, Y.X.; Luo, Y.Y.; Wang, S.; Ding, H.L.; Xu, J.M.; Li, G.H. Ag-decorated TiO2 nanograss for 3D SERS-active substrate with visible light self-cleaning and reactivation. Analyst 2013, 138, 4519–4525. [Google Scholar] [CrossRef] [PubMed]
  37. Pham, T.N.; Le, H.X.; Dao, T.N.; Nguyen, L.T.; Binard, G.; de Marcillac, W.D.; Maitre, A.; Nguyen, L.Q.; Coolen, L.; Pham, N.T. Surface-enhanced Raman scattering from semiconductor and graphene quantum dots coupled to metallic-film-on-nanosphere substrates. Appl. Phys. A 2019, 125, 337. [Google Scholar]
  38. Gong, T.; Zhu, Y.; Zhang, J.; Ren, W.; Quan, J.; Wang, N. Surface-enhanced Raman scattering from semiconductor and graphene quantum dots coupled to metallic-film-on-nanosphere substrates. Carbon 2015, 87, 385–394. [Google Scholar] [CrossRef]
  39. Xu, S.; Man, B.; Jiang, S.; Wang, J.; Wei, J.; Xu, S.; Liu, H.; Gao, S.; Liu, H.; Li, Z.; et al. Graphene/Cu nanoparticle hybrids fabricated by chemical vapor deposition as surface-enhanced Raman scattering substrate for label-free detection of adenosine. ACS Appl. Mater. Interfaces 2015, 7, 10977–10987. [Google Scholar] [CrossRef]
  40. Sun, L.; He, J.; An, S.; Zhang, J.; Ren, D.J. Facile one-step synthesis of Ag@ Fe3O4 core–shell nanospheres for reproducible SERS substrates. Mol. Struct. 2013, 1046, 74–81. [Google Scholar] [CrossRef]
  41. He, X.; Wang, H.; Zhang, Q.; Li, Z.; Wang, X. Exotic 3D Hierarchical ZnO–Ag Hybrids as Recyclable Surface-Enhanced Raman Scattering Substrates for Multifold Organic Pollutant Detection. Eur. J. Inorg. Chem. 2014, 2014, 2432–2439. [Google Scholar] [CrossRef]
  42. Weng, X.; Feng, Z.; Guo, Y.; Feng, J.J.; Hudson, S.P.; Zheng, J.; Ruan, Y.; Laffir, F.; Pita, I. Recyclable SERS substrates based on Fe 2 O 3–Ag hybrid hollow microspheres with crumpled surfaces. New J. Chem. 2016, 40, 5238–5244. [Google Scholar] [CrossRef]
  43. Lee, P.C.; Meisel, D. Adsorption and surface-enhanced Raman of dyes on silver and gold sols. J. Phys. Chem. 1982, 86, 3391–3395. [Google Scholar] [CrossRef]
  44. Khai, T.V.; Long, L.N.; Khoi, N.H.T.; Thang, N.H. Effects of Hydrothermal Reaction Time on the Structure and Optical Properties of ZnO/Graphene Oxide Nanocomposites. Crystals 2023, 12, 1825. [Google Scholar] [CrossRef]
  45. Priya, P.S.; Nandhini, P.P.; Vaishnavi, S.; Pavithra, V.; Almutairi, M.H.; Almutairi, B.O.; Arokiyaraj, S.; Pachaiappan, R.; Arockiaraj, J. Rhodamine B, an organic environmental pollutant induces reproductive toxicity in parental and teratogenicity in F1 generation in vivo. Comp. Biochem. Physiol. C Toxicol. Pharmacol. 2024, 280, 109898. [Google Scholar] [CrossRef]
  46. Wang, Y.; Ji, W.; Sui, H.; Kitahama, Y.; Ruan, W.; Ozaki, Y.; Zhao, B.J. Exploring the Effect of Intermolecular H-Bonding: A Study on Charge-Transfer Contribution to Surface-Enhanced Raman Scattering of p-Mercaptobenzoic Acid. Phys. Chem. C 2014, 118, 10191–10197. [Google Scholar] [CrossRef]
  47. Visbal, C.A.; Cervantes, W.R.; Marín, L.; Betancourt, J.; Pérez, A.; Diosa, J.E.; Rodríguez, L.A.; Mosquera-Vargas, E. The Fabrication of Gold Nanostructures as SERS Substrates for the Detection of Contaminants in Water. Nanomaterials 2024, 14, 1525. [Google Scholar] [CrossRef]
  48. Food and Agriculture Organization of the United Nations. Codex Pesticides Residues in Food Online Database. In Codex Alimentarius—International Food Standards; FAO: Roma, Italy, 2023; Available online: https://www.fao.org/fao-who-codexalimentarius/codex-texts/dbs/pestres/en/ (accessed on 12 December 2024).
  49. Wu, Z.; Zhang, C.; Stair, P.C. Influence of absorption on quantitative analysis in Raman spectroscopy. Catal. Today 2006, 113, 40–47. [Google Scholar] [CrossRef]
  50. Muehlethaler, C.; Lombardi, J.R.; Leona, M.J. Sample self-absorption in surface-enhanced Raman spectroscopy (SERS): Influence of the resonance, dilution and depth of the measurements. Raman. Spectrosc. 2017, 48, 647–652. [Google Scholar] [CrossRef]
  51. Nguyen, H.T.N.; Le, T.N.T.; Nguyen, P.T.P.; Nguyen, H.D.; Nguyen, T.L.M. Potential application of gold nanospheres as a surface plasmon resonance based sensor for in-situ detection of residual fungicides. Sensors 2020, 20, 2229. [Google Scholar] [CrossRef] [PubMed]
  52. Li, J.L.; Sun, D.W.; Pu, H. Determination of trace thiophanate-methyl and its metabolite carbendazim with teratogenic risk in red bell pepper (Capsicumannuum L.) by surface-enhanced Raman imaging technique. Food Chem. 2017, 218, 543–552. [Google Scholar] [CrossRef] [PubMed]
  53. Lim, S.; Shi, J.L.; von Gunten, U.; McCurry, D.L. Ozonation of organic compounds in water and wastewater: A critical review. Water Res. 2022, 213, 118053. [Google Scholar] [CrossRef] [PubMed]
Figure 1. Illustration diagram showing key substrate fabrication and performance test steps.
Crystals 15 00240 g001
Figure 2. SEM images of (a) plain cotton swab, (b) Ag NP/cotton swab, and (c) GO/Ag NP/cotton swab.
Crystals 15 00240 g002
Figure 3. (a) XRD pattern of Ag NP/cotton swab and (b) Raman spectra of GO/Ag NP/cotton swab and plain cotton swab.
Crystals 15 00240 g003
Figure 4. SERS sensitivity comparison between Ag NP/cotton swab and GO/Ag NP/cotton swab substrates at multiple RhB concentrations.
Crystals 15 00240 g004
Figure 5. SERS performance comparison between the Ag NP/cotton swab and the GO/Ag NP/cotton swab substrates at TM concentrations of (a) 10−2 M–10−6 M and (b) 10−8 M–10−10 M. The black arrows indicate TM peaks.
Crystals 15 00240 g005
Figure 6. Degradation of RhB signals recorded after Ag/cotton swab and GO/Ag/cotton swab substrates were stored in air for up to 12 months. An RhB concentration of 10−5 M was used.
Crystals 15 00240 g006
Figure 7. Average intensity ratios between peaks of GO/Ag/cotton swab and Ag/cotton swab over time from Figure 6. The average intensity ratio at each recorded month was determined by dividing the intensity of each of the six prominent peaks of the GO/Ag/cotton swab by the intensity of the corresponding peaks of the Ag/cotton swab, and then averaging them.
Crystals 15 00240 g007
Figure 8. Recyclability performance of GO/Ag NP/cotton swab substrate showing five successful recycling rounds. A concentration of 10−5 M RhB was used.
Crystals 15 00240 g008
Table 1. Raman mode assignments for RhB [47].
Raman Shift (cm−1)Assignment
1644Aromatic C–C stretch
1591C–H stretch
1551Aromatic C–C stretch
1528C–H stretch
1508Aromatic C–C stretch
1426C–H stretch
1360Aromatic C–C stretch
1284Aromatic C–C stretch
1199C–H in-plane bend
1130C–H stretch
932C–H stretch
773C–H stretch
622C–C–C stretch
355
278
240Ag–N stretch
213
Table 2. Raman mode assignments for TM [51,52].
Raman Shift (cm−1)Assignment
1708C=O stretching, N–H stretching, N–H deformation, –CH3 deformation
1601C=C stretching, N–H deformation, C–H deformation
1538C–N stretching, N–H deformation
1298C–O–C stretching, N–H deformation, C–H deformation
1267C–O stretching, N–H deformation, C–H deformation
1154N–C–N asymmetric stretching, –CH3 deformation, C–C stretching
1039C–H deformation, C–O stretching
959C=S stretching, C–H deformation
898C–S stretching, C–H deformation
779C=S stretching, N–H deformation, C–H deformation
726N–H wagging
717C–H deformation, N-H bending
613–N–C=S deformation
465C–O–C deformation
325C–C stretching
Disclaimer/Publisher’s Note: The statements, opinions and data contained in all publications are solely those of the individual author(s) and contributor(s) and not of MDPI and/or the editor(s). MDPI and/or the editor(s) disclaim responsibility for any injury to people or property resulting from any ideas, methods, instructions or products referred to in the content.

