Article

A Tunable Z-Shaped Channel Gradient Metamaterial for Enhanced Detection of Weak Acoustic Signals

1
School of Information and Communication Engineering, North University of China, Taiyuan 030051, China
2
School of Physics and Information Engineering, Shanxi Normal University, Taiyuan 030031, China
*
Author to whom correspondence should be addressed.
Crystals 2025, 15(3), 216; https://doi.org/10.3390/cryst15030216
Submission received: 2 February 2025 / Revised: 16 February 2025 / Accepted: 22 February 2025 / Published: 24 February 2025

Abstract

:
Acoustic sensing technology has attracted significant attention across various fields, including mechanical fault early warning and wireless communication, due to its high information density and advantages in remote wireless applications. However, environmental noise reduces the signal-to-noise ratio (SNR) in traditional acoustic systems. In response, this article proposes a novel Z-shaped channel gradient metamaterial (ZCGM) that leverages strong wave compression effects coupled with effective medium theory to detect weak signals in complex environments. The properties of the designed metamaterials were verified by theoretical derivation and finite element simulation of the model. Compared to conventional linear gradient acoustic metamaterials (GAMs), ZCGM demonstrates significantly superior performance in acoustic enhancement, with a lower capture frequency. Furthermore, the structure exhibits flexible tunability in its profile. In addition, the center frequency of each actual air gap is determined in this paper based on the swept frequency signal test. Based on this center frequency, a preset specific harmonic acoustic signal is used as an emission source to simulate the actual application scenario, and experiments are constructed and conducted to verify the performance of the designed metamaterials. The results consistently show that ZCGM has distinct advantages and promising application prospects in the detection, enhancement, and localization of weak acoustic signals.

1. Introduction

Acoustic sensing technology, which leverages the physical properties of sound, is considered as one of the most effective techniques for monitoring and localization. It is extensively used in applications such as sound source localization [1,2,3], underwater navigation [4,5,6,7,8,9], and acoustic array imaging technologies [10,11,12]. Over the past decade, significant advancements have been made in improving the signal-to-noise ratio (SNR) in the application of electroacoustic sensors. For instance, Zhao et al. developed a system that enhances the SNR by approximately 2.8 dB through acoustic echo effects [13]. Santiago Pascual et al. proposed a method utilizing SEGAN networks to enhance the SNR of audio signals [14], while Chris Donahue et al. introduced a technique employing generative adversarial networks (GANs) to improve speech signals [15]. Additionally, Xiang et al. developed a robust speech enhancement method based on U-Net and adversarial learning algorithms to enhance speech quality under extremely low SNR conditions [16]. However, in practical engineering applications, acoustic signals often contain extremely low amplitude target information, posing significant challenges for conventional cost-effective electroacoustic transducers due to sensitivity limitations and inherent SNR constraints. Furthermore, samples contaminated with strong background noise are difficult to utilize for training reliable models through deep learning methods. Therefore, there is an urgent need to develop an acoustic transmission system capable of effectively sensing weak acoustic signals.
In recent years, the emergence of acoustic metamaterials, which are artificially engineered microstructures with sub-wavelength scales, has overcome the performance limitations of conventional acoustic structures and materials [17]. With their extensive physical properties and exceptional capabilities, such as acoustic bandgaps [18], acoustic focusing [19,20,21], directional transmission [22], and acoustic rainbow trapping [23], acoustic metamaterials have become pivotal in acoustic signal detection. Compared to periodic metamaterials, metamaterials or mediums with gradient refractive index characteristics demonstrate flexible control over sound waves. In 2014, Chen et al. [24] first proposed gradient acoustic metamaterials (GAMs), which employ spatially varying geometric parameters to achieve frequency-selective acoustic signal capture and amplification. This demonstrates the ability of this structure to modulate the spatial distribution of acoustic energy. In 2019, Huang et al. [25] proposed an improved gradient acoustic structure (AMMs) characterized by gradient curvature, thickness, and gap width, achieving a remarkable acoustic gain exceeding an order of magnitude, with experimental validation conducted underwater. In 2019, Yang et al. [26] designed a single-cell UHF acoustic signal acquisition model for rotating bodies based on acoustic metamaterials, realizing the local field enhancement effect of the model at different frequencies. Additionally, it is noteworthy that Chen et al. [27,28] enhanced the sensitivity of gradient structures to weak sound signals by incorporating sub-wavelength coiling structures into the gaps of the gradient structures. In 2020, John K. Birir et al. [29] introduced structured channel metamaterials for deep sub-wavelength resolution in guided ultrasonics to enable experiments in guided ultrasonics detection with super-resolution and sub-wavelength imaging beyond the diffraction limit. Inspired by these studies, we propose that utilizing coiling structures made from high-refractive-index materials may effectively reduce the size of the metamaterial structure. Within the coiling structure, sound waves are compelled to propagate through the channel system, significantly increasing the total propagation time. This leads to a reduced sound speed and a high refractive index, while also exhibiting exceptionally high effective mass density and bulk modulus. However, in the aforementioned metamaterial structures, the mismatch between the tooth structures used to construct the coiling channels and the overall gradient growth results in issues such as discontinuities in the impedance of adjacent narrow slits and challenges in fabricating metamaterials that meet the specific frequency requirements.
To enhance the applicability of effective media in gradient structures, this study ingeniously leverages the interactions of acoustic energy to optimize the design of coiled structures within the Z-shaped channel gradient metamaterial (ZCGM). This structure possesses flexible contour variations. Compared to the coiling structures developed by Chen et al. [27,28], ZCGM overcomes the issue of impedance discontinuities between gaps introduced by the incorporation of acoustic effective media. As a result, it enables gradient structures to move closer to practical applications. Simulation results demonstrate that, compared to traditional gradient metamaterials (GAMs), ZCGM not only maintains the capability for acoustic rainbow trapping but also exhibits enhanced acoustic performance, lower operational frequencies, and a broader detection range. In addition, this paper determines the center frequency of each actual air gap on the basis of the swept signal testing technique. Based on the center frequency, a set harmonic acoustic signal is used as the emission source to simulate the actual application scenario, and experiments are constructed and conducted to verify the performance of the designed metamaterials. Experimental testing further indicates that ZCGM displays superior acoustic responsiveness in detecting harmonic sound signals.
The structure of this article is organized as follows. In Section 2, we present the design of the ZCGM structure. Section 3 provides a numerical analysis to derive the characteristics of the metamaterial ZCGM model. In Section 4, we perform finite element simulations to validate the acoustic enhancement properties of the designed ZCGM structure and to verify the feasibility of constructing ZCGM using multiple materials under the simulation of acoustic solid coupling. Section 5 introduces the experimental setup, where specific acoustic signals are utilized as the source to test the performance of the ZCGM structure from both frequency domain and time domain perspectives. Finally, Section 6 provides a summary of the article.

2. Structural Design

By analyzing the linear profile gradient structure proposed by Chen et al. [24], it is observed that the phenomenon of acoustic rainbow trapping occurs when the acoustic impedance between the slits of the gradient structure satisfies a condition of gradual increase. Therefore, this article proposes to construct acoustic effective media within the slits to modulate the impedance of each gap, ensuring that it satisfies the criteria for linear variation. The structure consists of an array of 13 rectangular plates, as illustrated in Figure 1a, with an amplified view of a coiling cell provided in Figure 1b. The center of the first plate is set as the origin of the coordinate system. Each plate has a thickness of d = 5 mm, and the gaps between the plates are set to c = 11 mm. The metamaterial sample is fabricated using 3D printing technology with photosensitive resin (modulus of 2.65 GPa, density of 1130 kg/m3), and the height of the sample is set to H = 55 mm. The length of the first rectangular plate from the centerline is L1 = 5 mm, and the lengths of the subsequent rectangular plates increase linearly by t = 5 mm from the centerline. A labyrinthine grid structure is established between the plates, with a width of l = 1 mm and an internal channel width of m = 3 mm. The distance of the first slit from the centerline is set to e = 3 mm. All parameter settings are summarized in Table 1. It is important to note that the selected parameters are appropriate values within a specific range, which facilitate the representation of the structural characteristics and ease of processing and experimental measurement. In practical applications, these parameters can be adjusted to customize the required gradient structure. Furthermore, the 3D printing process was performed with a print resolution of 50 μm to ensure the precision and surface smoothness of the structure, details that further enhance the acoustic properties of the structure.

3. Theoretical Derivation and Calculations

Based on the characteristics of the constructed ZCGM, a numerical model is established to analyze its performance theoretically. The general uniform medium sound wave is controlled by its scalar wave equation [30]:
2 P t 2 = K ρ 2 P
where P represents the acoustic pressure. Acoustic velocity is clearly defined by c = K / ρ . Chen et al. [24] derived the mechanism for increased acoustic pressure in nonlinear gradient structures using effective medium theory. The effective mass density ρ and bulk modulus K can be expressed as follows:
ρ = ρ r e s ρ e f f 1 F r ρ r e s + F r ρ e f f
K = K r e s K e f f 1 F r K r e s + F r K e f f
The parameter F r represents the filling ratio of the parallel plates. In Section 2, the constructed ZCGM model is fabricated using photosensitive resin, with the material having a density of ρ r e s = 1130   kg / m 3 and a bulk modulus of K r e s = 2.65   GPa . The air has a density of ρ a i r = 1.2   kg / m 3 and a bulk modulus of K a i r = 1.4 × 10 5   Pa . The propagation of sound waves in the metamaterial structure is influenced by the presence of sub-wavelength coiled elements between the gradient structure’s two plates. These varying gaps are capable of capturing sound signals at different frequencies. Since the speed of sound in air is generally uniform, the sound waves are predominantly along the path depicted in Figure 1b (shown in red). Once sound enters a slit on one side, it collides with waves from the opposite side, resulting in reflection into the next adjacent slit. After passing through the second slit, the waves further reflect at the boundary of the rigid acoustic field. Ultimately, sound waves from both sides converge into the innermost slit. Based on transformation acoustics, the three-layer slit curled structure between two plates can be calculated and deduced, following [25], to obtain the mass density of the curled structure as ρ e f f = β ρ a i r , the volume modulus as K e f f = K a i r / β , and the effective refractive index as n e f f = β n a i r . The propagation distance of sound waves in the three-layer slit curl structure is:
L e f f = 3 ( L 1 + ( n 1 ) × t ) 2 + m 2   ( n 2 )
To facilitate the description of the structural positioning in this article, the plate-like structures are numbered from smallest to largest, with n defined as the number of each layer. Compared with the direct propagation distance of L 1 + ( n 1 ) × t , the coiled structure increases the transmission distance between the slits, effectively reducing the sound speed and thereby enhancing the effective refractive index of the structure [31]. Here, β = L e f f / ( L 1 + ( n 1 ) × t ) represents the compression ratio of the coiled structure. The constructed ZCGM model can be decomposed into an approximation of an infinite number of uniform metamaterial sections. As a function of the ZCGM width z ( x ) = t c + d x + L 1 , the effective refractive index of the metamaterial can be expressed as follows:
n Z C G M ( x , f ) = n e f f + K e f f ρ e f f ρ K tan 2 π f z ( x ) ρ K 2
Based on the solution for the effective refractive index in the equation above, the relationship between the sound pressure along the x-axis and the input frequency can be derived as follows:
P Z C G M ( x , f ) = 2 π ρ e f f f 1 n Z C G M 2 4 cos arctan ρ ρ e f f 1 n Z C G M 2 1
Due to the addition of the coiling structure between the plates in the ZCGM, compared to the GAM structure, the effective refractive index n e f f and equivalent mass density ρ e f f between the plates increase, while the bulk modulus K e f f decreases. When these parameters are substituted into Equations (5) and (6), this results in an increase in both n Z C G M and P Z C G M . Furthermore, it is important to note that n Z C G M cannot be an arbitrarily large value. The maximum wave vector is defined as k x = π c + d , which corresponds to the boundary of the first Brillouin zone in a periodic system [32]. Consequently, the maximum effective refractive index n m a x is determined as n max = c e f f 2 f ( c + d ) , where c e f f = K e f f ρ e f f is the effective sound speed in the Z-shaped corridor, which is limited by the periodicity of the metamaterial structure of c + d . This introduces a spatial cutoff condition where there is a cutoff distance along the direction of wave propagation. At the cutoff frequency n Z C G M = n m a x , the refractive index reaches its maximum, and the pressure gain is maximized. When n Z C G M > n m a x , sound wave propagation is prohibited. When n m a x is considered constant, there exists a corresponding maximum frequency f m a x . When f > f m a x , high-frequency sound signals are obstructed by the current grating, preventing further propagation of sound waves.
Based on the theoretical derivation above, by substituting the parameters from Section 2 into the equations, we can calculate the variation in the effective refractive index with the frequency for each slit, as shown in Figure 2. Consequently, the operating frequency for each slit can be inferred, as detailed in Table 2.
According to Figure 2, as the frequency increases, the working gap shifts forward, and n Z C G M gradually decreases. At a certain frequency, a larger gap position corresponds to a greater value of n Z C G M . As shown in Table 2, it is also evident that as the gap positions increase, the frequency at which the maximum refractive index is achieved becomes higher. In this study, we consider the position of the maximum refractive index (cutoff frequency) as the operational frequency. Through the aforementioned derivation, the acoustic rainbow effect can be clearly observed. Different gap configurations can respond to varying frequencies, which enhances the detection of wideband signals.

4. Simulation Analysis

4.1. Study on the Acoustic Response of ZCGM Structures Under Thermo-Viscous Loss Conditions

In this study, the pressure acoustic model and the thermo-viscous acoustic model in COMSOL Multiphysics v6.0 are coupled to construct a two-dimensional ZCGM structure. Finite element simulations of sound wave propagation within the metamaterial structure are conducted. The pressure acoustic model is applied in the ambient medium region to simulate the propagation of sound waves in free space. In the narrow gaps of the metamaterial structure, the thermo-viscous acoustic model is used to account for the energy loss of sound waves due to viscosity and thermal conduction effects. The pressure acoustic model is based on the linear acoustic theory, which assumes that the propagation of acoustic waves in air is a small amplitude fluctuation and ignores the nonlinear effects, while the thermo-viscous acoustic model takes into account the energy dissipation of acoustic waves caused by viscous friction and heat conduction at the microscopic scale, which is suitable for the simulation of acoustic wave propagation in narrow air gaps. The mesh division and model configuration are shown in Figure 3. The light-blue region represents the air medium (the air medium parameters are as follows: density (ρ) is 1.225 kg/m3, speed of sound c = 343 m/s, and dynamic viscosity coefficient μ = 1.81 × 10⁻⁵ Pa·s in standard conditions), while the ZCGM structure is modeled as a rigid body within the air domain, depicted by the deep-yellow area. The meshing is performed with a free triangular mesh with local encryption in the narrow air gap region to ensure the accurate calculation of thermo-viscous acoustic effects. The maximum cell size of the mesh is λ/6 (λ is the wavelength of the sound wave) to meet the numerical accuracy requirements of the acoustic wave propagation. The boundaries of the structure are defined using rigid boundary (RB) conditions. That is, the sound wave undergoes complete reflection at the surface of the structure with no energy transmission or absorption. This boundary condition is suitable for modeling the acoustic behavior of high impedance solid materials (e.g., metals) at the interface with air. To simulate a plane wave, a background pressure field of 1 Pa is applied, with the wave vector k incident perpendicularly onto the ZCGM structure. The frequency range of the background pressure field is set from 100 Hz to 10 kHz to cover the main operating frequency band of the ZCGM structure. Additionally, a Perfectly Matched Layer (PML) is implemented around the environment (shown in blue) to absorb reflected sound waves, thereby simulating an ideal plane wave propagation environment. The boundaries between the gaps are set as thermo-viscous acoustic boundaries (represented by magenta lines). This boundary condition takes into account the viscous friction and thermal conduction effects of acoustic waves in a narrow air gap, and is applicable to the case where the size of the air gap is much smaller than the wavelength of the acoustic wave. By setting the thermo-viscous acoustic boundary, the energy loss behavior of acoustic waves at the microscopic scale can be accurately simulated.
In the experiments, a Micro-Electro-Mechanical Systems (MEMS) microphone is placed at the edge of the central cavity to detect sound signals. The specific positioning method is as follows: the center of the microphone is aligned with the inner wall of the cavity rim, ensuring that the distance between its receiving surface and the cavity rim is 1 mm to maximize the capture of changes in the sound field to detect sound signals. Similarly, in the simulated environment, the probe point is also positioned at the edge of the central cavity to observe the phenomenon of sound enhancement between the air gaps, as indicated by the red points in Figure 3. The selection of the 6th, 8th, 10th, and 12th gaps for testing is based on the following criteria: (1) frequency coverage: the theoretical operating frequency (475–951 Hz) of these gaps covers the typical mechanical failure characteristic frequency band (500–1000 Hz), which is representative of the engineering; (2) structural symmetry: the even-numbered gaps (e.g., 8th, 10th, and 12th) are located on both sides of the centerline of the ZCGM, which can avoid the interference of boundary effects; (3) thermo-viscous loss gradient: the equivalent acoustic ranges of the higher gaps (e.g., 12th gap) are longer, which facilitates the study of the relationship between the loss and the location of the gaps. The sound pressure gain is considered a crucial metric for measuring the effectiveness of sound enhancement. Here, the sound pressure gain (PG) is defined as PG = PM/PF [24], where PM represents the sound pressure amplitude in the ZCGM and PF denotes the sound pressure amplitude in the free sound field. The transmission characteristics of the sound field are simulated. Moreover, due to the mismatch between the sound wave vector and mode field of the first two air gaps in the gradient structure, these gaps are excluded from the analysis in this study. The center frequencies for each air gap (from the third air gap to the last) of the ZCGM structure f (Hz), and the GAMs structure F (Hz), as obtained through simulation, are listed in Table 3. In the experiment, the analysis of sound pressure gain and the acoustic enhancement phenomenon is realized by multi-step signal processing: firstly, the signal is collected by a MEMS microphone and then digitized at a sampling rate of 48 kHz after band-pass filtering and denoising from 100 Hz to 10 kHz; subsequently, the spectral characteristics and peak distribution are analyzed by converting the frequency domain through the FFT; and the signal averaging and standard deviation statistics of the data from multiple experiments are carried out to enhance the reliability.
The results presented in Table 3 indicate that for the ZCGM structure with t = 5 mm, the center frequencies for the selected sixth, eighth, tenth, and twelfth air gaps are 951 Hz, 709 Hz, 570 Hz, and 475 Hz, respectively. Figure 4(a1–d1) illustrate the sound pressure distribution at these frequencies. For comparative analysis, Figure 4(a3–d3) display the sound pressure distribution at the center frequencies of the same gap positions for the metamaterial without the coiled structure. It is evident that sound pressure enhancement is captured at the positions of the sixth, eighth, tenth, and twelfth air gaps, with center frequencies of 2221 Hz, 1754 Hz, 1455 Hz, and 1258 Hz, respectively, for the non-coiled metamaterial. Furthermore, to highlight the flexible tunability of the structure’s profile, we set the gradient structure increment to t = 3 mm and obtained the operational frequencies for each air gap. The center frequencies for the selected sixth, eighth, tenth, and twelfth air gaps are 1438 Hz, 1102 Hz, 894 Hz, and 758 Hz, respectively. Figure 4(a2–d2) illustrate the sound pressure distribution at these center frequencies for the ZCGM structure with a gradient increment of t = 3 mm. The frequency-absolute sound pressure gain between different air gaps is obtained by simulation. Figure 5a–d present the absolute sound pressure gain curves for the ZCGM structures (with t = 5 mm and t = 3 mm) and the GAM structure. For the sixth, eighth, tenth, and twelfth air gaps, the sound pressure amplitudes amplified by the ZCGM structure when t = 5 mm are 27.5 times, 29.8 times, 24.7 times, and 20.75 times, respectively. When t = 3 mm, the amplification factors are 22.1 times, 27 times, 27.7 times, and 22.1 times, respectively. In contrast, the GAM structure exhibits amplification factors of 16.5 times, 21.1 times, 25.3 times, and 24.6 times for the corresponding gaps.
This study first compares the operational frequencies of each air gap in the ZCGM structure at t = 5 mm, as obtained from Table 2 and Table 3. The results indicate that the operational frequencies derived from theoretical analysis and simulation calculations are in close agreement, validating the accuracy of the theoretical derivation. Besides the simulation results for the two configurations, with or without the Z-shaped coiled structure, the curve obtained in the gap frequency domain at the same position shows that the average pressure amplitude in the ZCGM structure can be amplified by approximately 25.6 times, while the average pressure amplitude is amplified by about 19 times in the GAM structure. This phenomenon supports the theoretical analysis presented in Section 2. Notably, the ZCGM structure captures frequencies that are approximately 62.3% lower than those in the GAM structure. In GAM, capturing lower-frequency acoustic signals typically requires a larger gradient structure volume. The unique characteristics of the ZCGM structure effectively address this issue and offer an important solution for practical applications of gradient structures. Additionally, the frequency response characteristics of each gap in the ZCGM structure demonstrate further enhancement compared to the GAM structure, with a narrower bandwidth captured between each gap in the frequency domain. Furthermore, a comparison of the frequency responses for ZCGM structures with different increments t reveals that the ZCGM structure with t = 3 mm has a higher acoustic rainbow capture frequency than that with t = 5 mm. This indicates that as the increment t increases, the ZCGM structure exhibits lower operational frequencies, while a decrease in the increment t corresponds to higher operational frequencies. This conclusion is helpful in using the ZCGM structure for acoustic detection and research across various specific domains.

4.2. Acoustic Response of ZCGM Structures of Different Material Acoustic-Structural Coupling Conditions

In the theoretical analysis, it is assumed that the metamaterial constructed is acoustically rigid at the boundaries. However, due to the 1 mm thickness of the coiled structural walls formed between the gaps within the structure, the harmonic interference caused by the acoustic-structural coupling needs to be considered. A simulation analysis was conducted to investigate the acoustic rainbow trapping effect resulting from the acoustic-structural coupling of steel plate material and photosensitive resin material, as shown in Figure 6.
Figure 6a–d present the acoustic response of ZCGM structures constructed from steel material. Compared to the photosensitive resin material, which has relatively lower material strength (shown in Figure 6e–h), the acoustic response of the steel-based ZCGM structure is closer to that of an ideal rigid boundary condition. However, it still exhibits unnecessary resonant responses due to the inherent characteristic frequencies of the structure. For instance, at the 10th gap position (Figure 6b), harmonic noise is generated at a frequency of 335 Hz. Additionally, at the 6th gap position (Figure 6d), a bandgap is observed within the characteristic frequency range, where the acoustic gain sharply decreases around 970 Hz. This phenomenon is attributed to the acoustic-structural coupling, where the acoustic signal at 1000 Hz excites the vibration of the coiled structural wall, leading to a subsequent acoustic gain response within this narrow frequency range.
Figure 6e–h present the ZCGM structure constructed with resin material. Compared to the steel structure (Figure 6a–d), the rigidity of the resin material is further reduced, making it more susceptible to acoustic-structural coupling resonance under different frequency excitations. The results in Figure 6e–h show that the acoustic gain response curves for each gap become more complex. However, it is noteworthy that there exists a clear frequency band separation between the acoustic gain frequency range, generated by strong wave compression, and the frequency range of acoustic-structural coupling resonance. Therefore, it is conceivable to use corresponding frequency band-pass filters for signal post-processing at different gap positions. The shaded areas in Figure 6e–h represent the passband range of the band-pass filter, while the areas outside the shaded regions represent the stopband range. Based on numerical analysis of acoustic-structural coupling and considering cost-effectiveness, the addition of hardware circuit band-pass filters or numerical band-pass filters allows photosensitive resin to also be used as a material for constructing ZCGM structures.

5. Experimental Validations

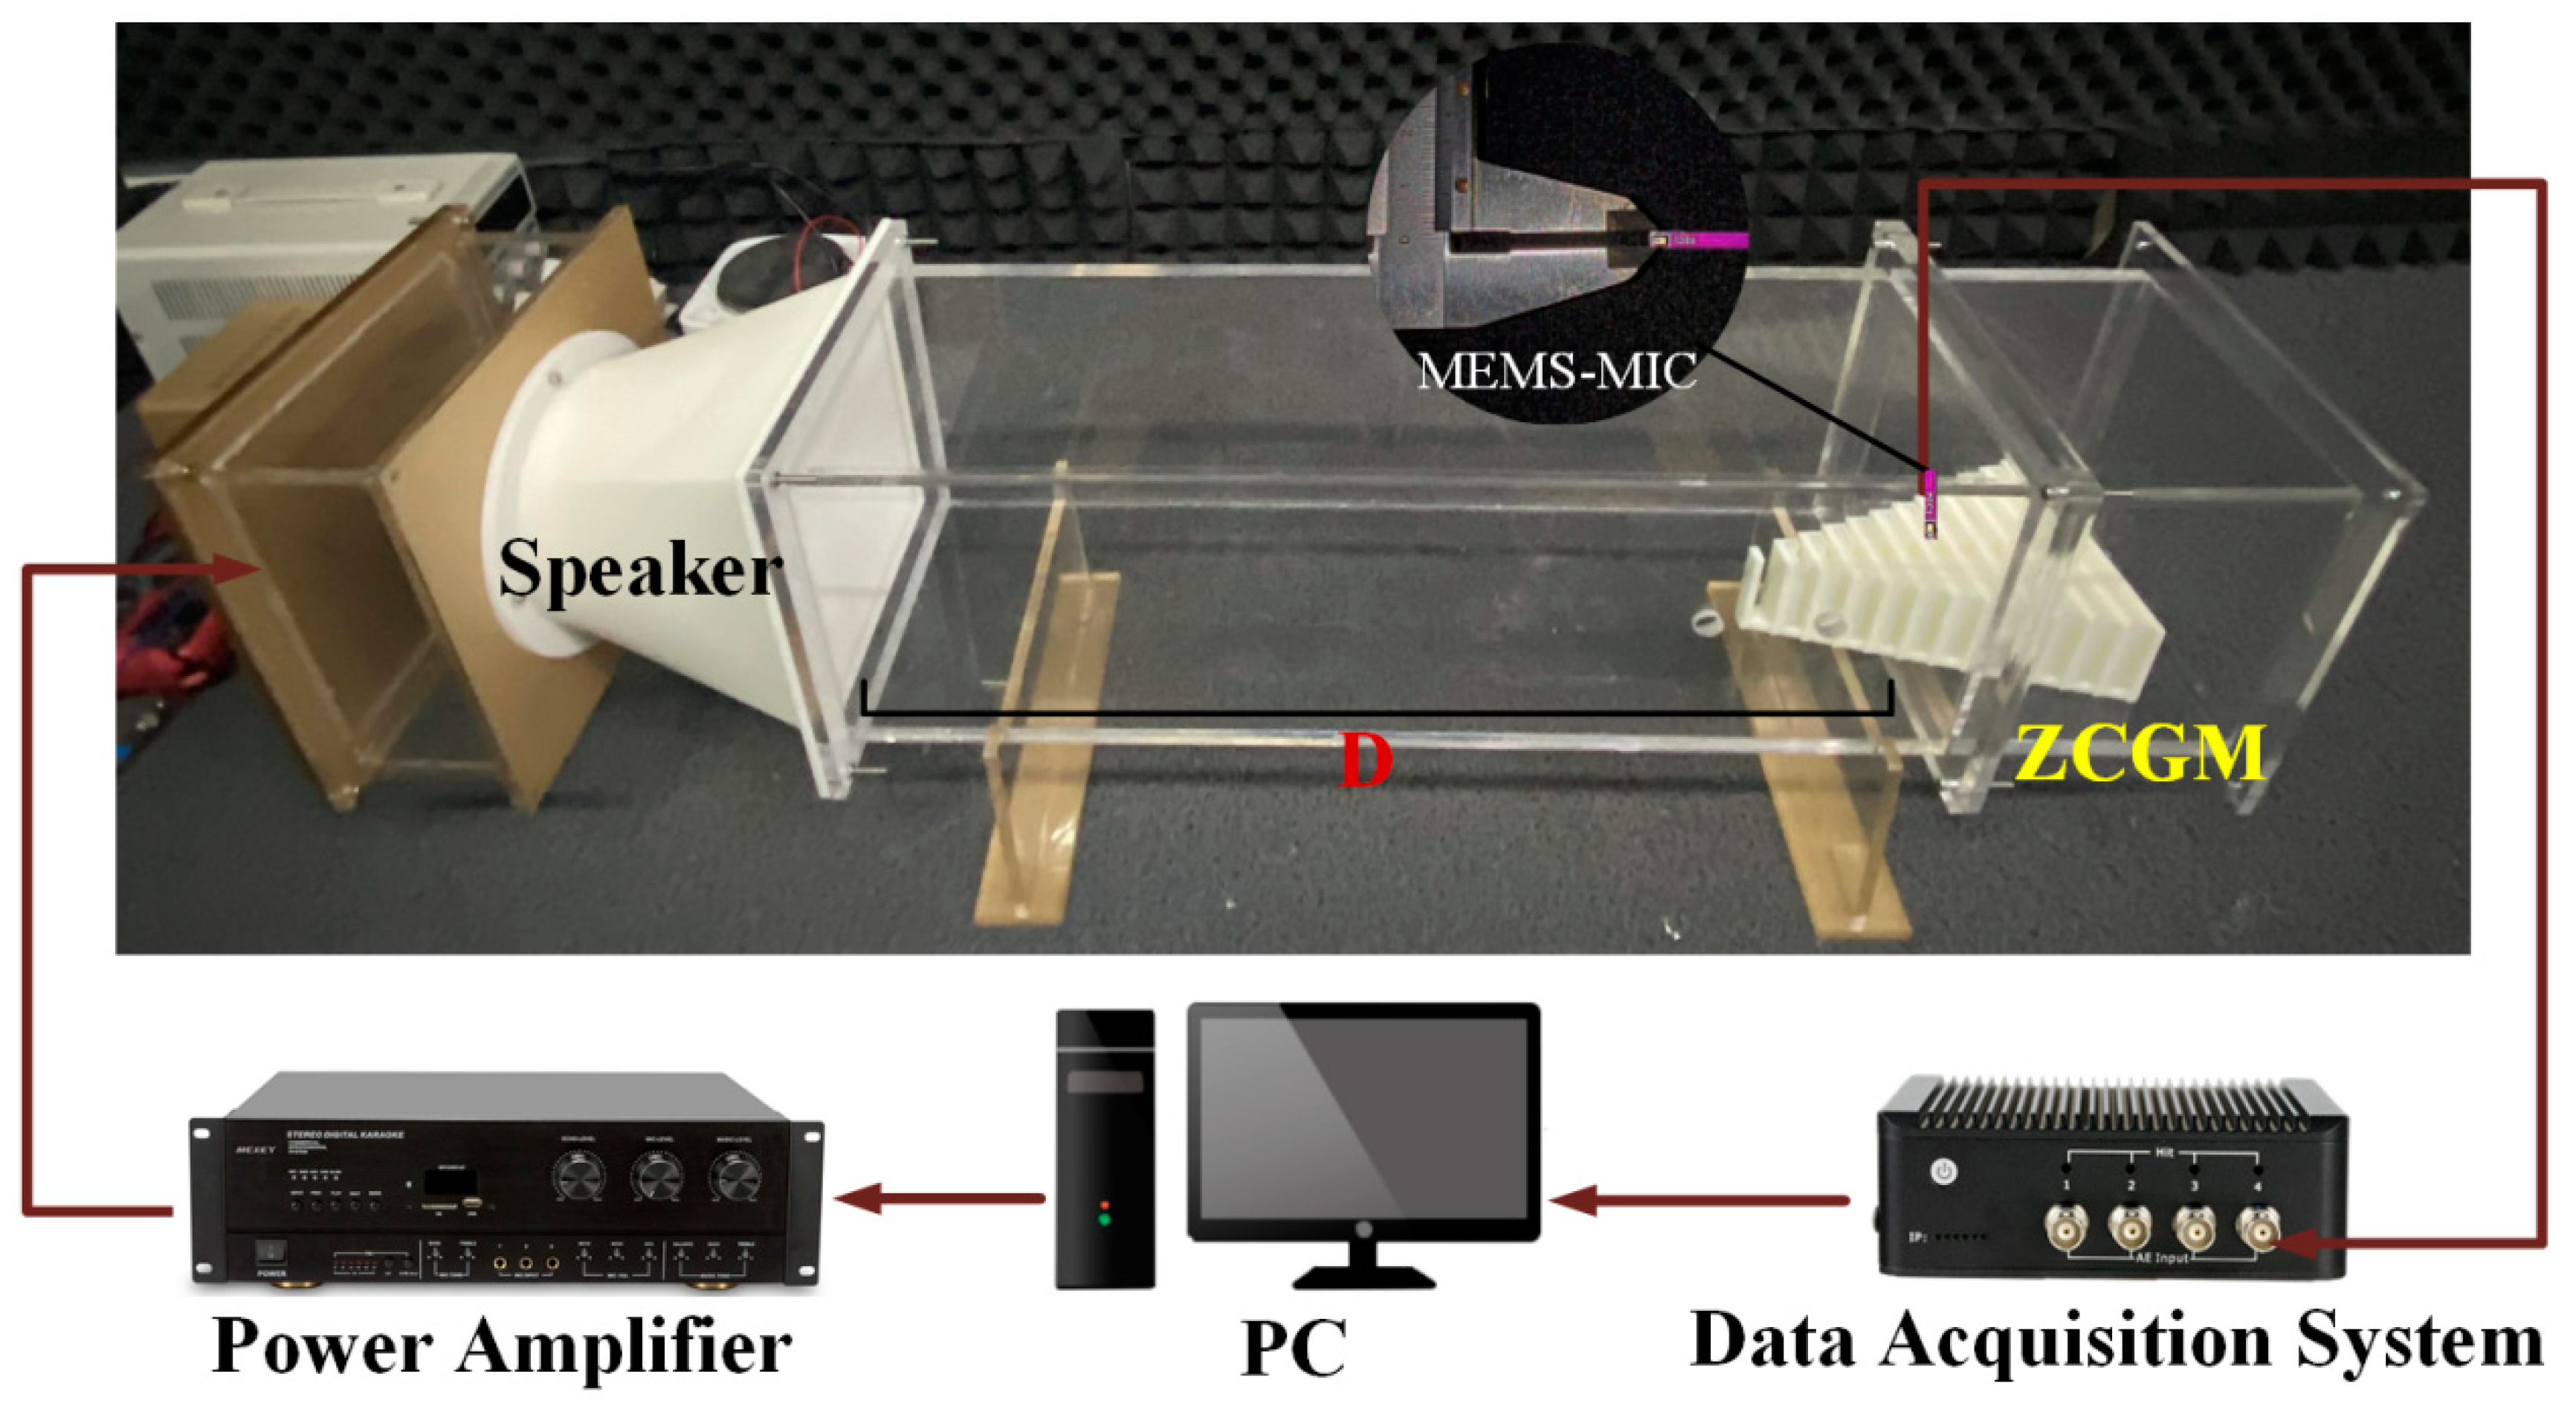
5.1. Experimental System

To validate the perceptual performance of the proposed ZCGM structure in response to various special signals in practical applications, an experimental test was conducted. A prototype of the proposed metamaterial was fabricated based on the geometric parameters outlined in Table 1, as illustrated in Figure 7. The prototype was 3D printed using photosensitive resin, with the base securely connected using the same material. A remote-control system was employed to input harmonic signals to the speaker via a wireless network. The speaker emitted the acoustic signals. The sound measurement device used in this study was a MEMS microphone (model: S15OT421-005, sensitivity: −42 dB, gain: 66), which was positioned at the edge of the central cavity to detect the sound signals. When the MEMS microphone was in operation but not detecting sound signals, the output voltage fluctuated around 1.5 V. The probe cross-sectional area of the MEMS microphone (3.06 mm2) is significantly smaller than that of the gap cavity, ensuring minimal disturbance to the internal sound pressure distribution within the metamaterial during testing. The distance between the speaker and the measurement point was set to D = 0.45 m. In constructing the test environment (Figure 7), an acrylic transparent plastic sheet was used to create a channel (modulus: 1.52 GPa, density: 1190 kg/m3), promoting an ideal plane wave sound field distribution. The testing environment was located in an anechoic chamber to minimize external interference and reflections.

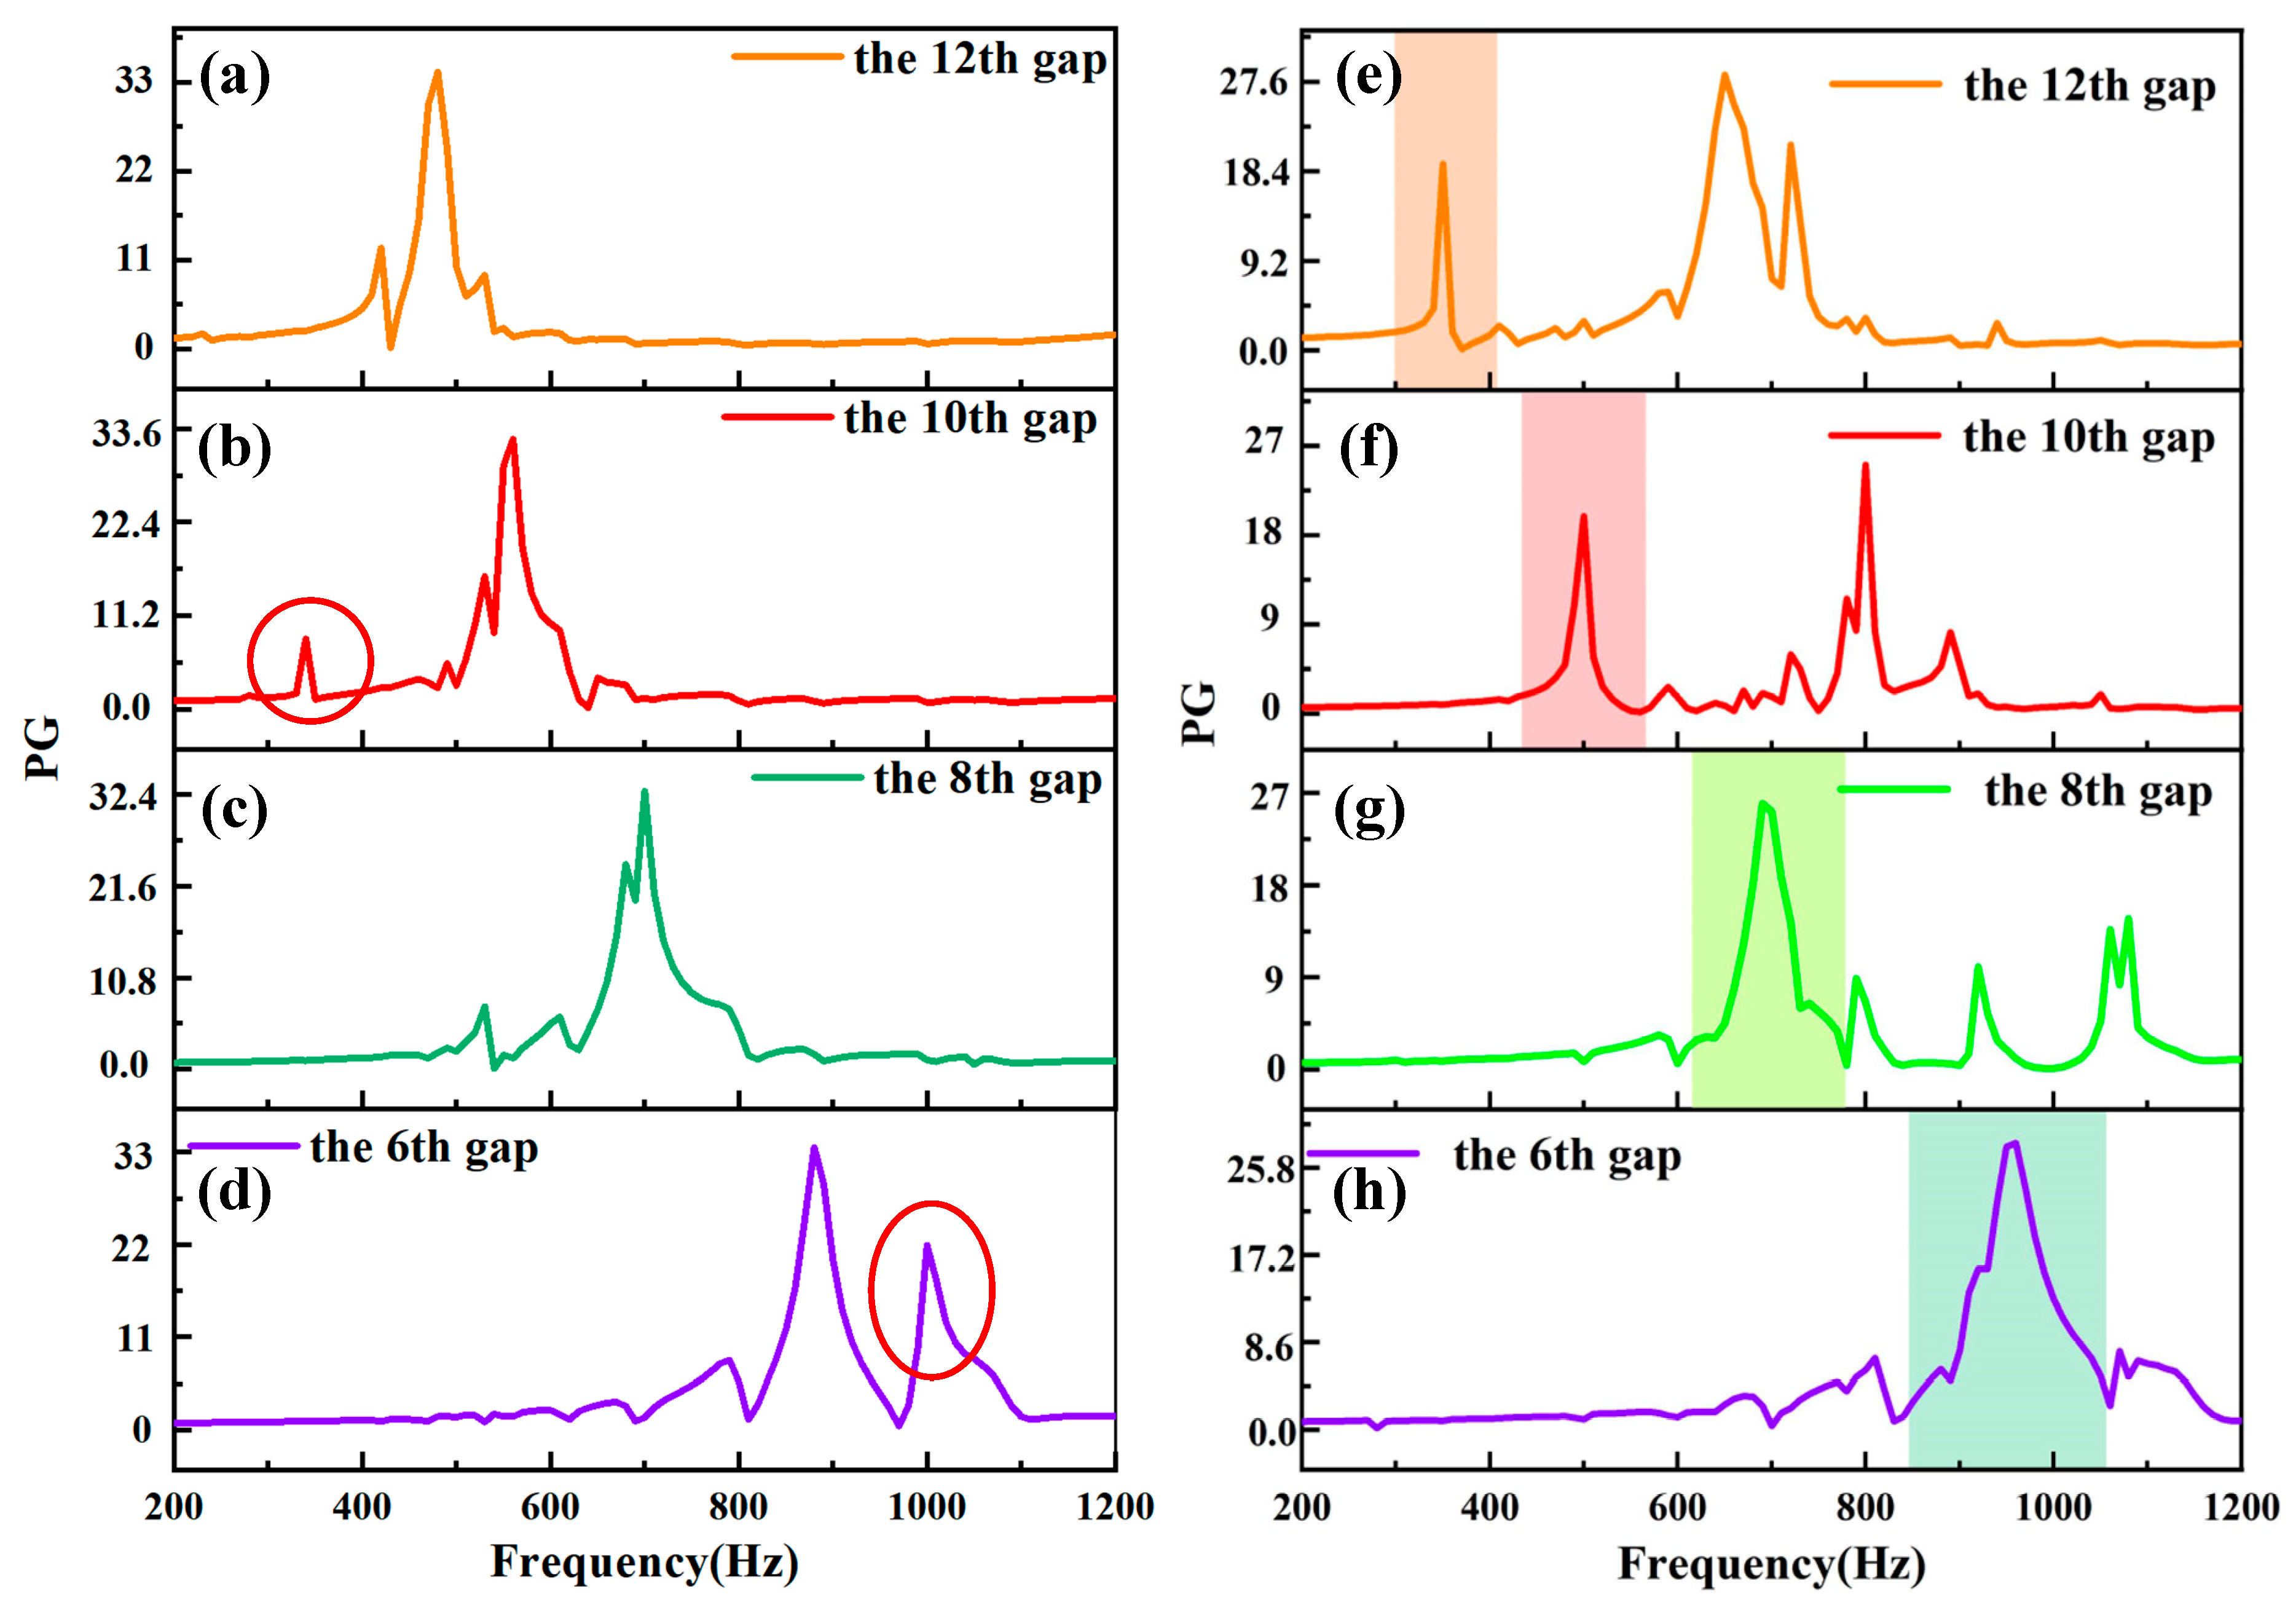
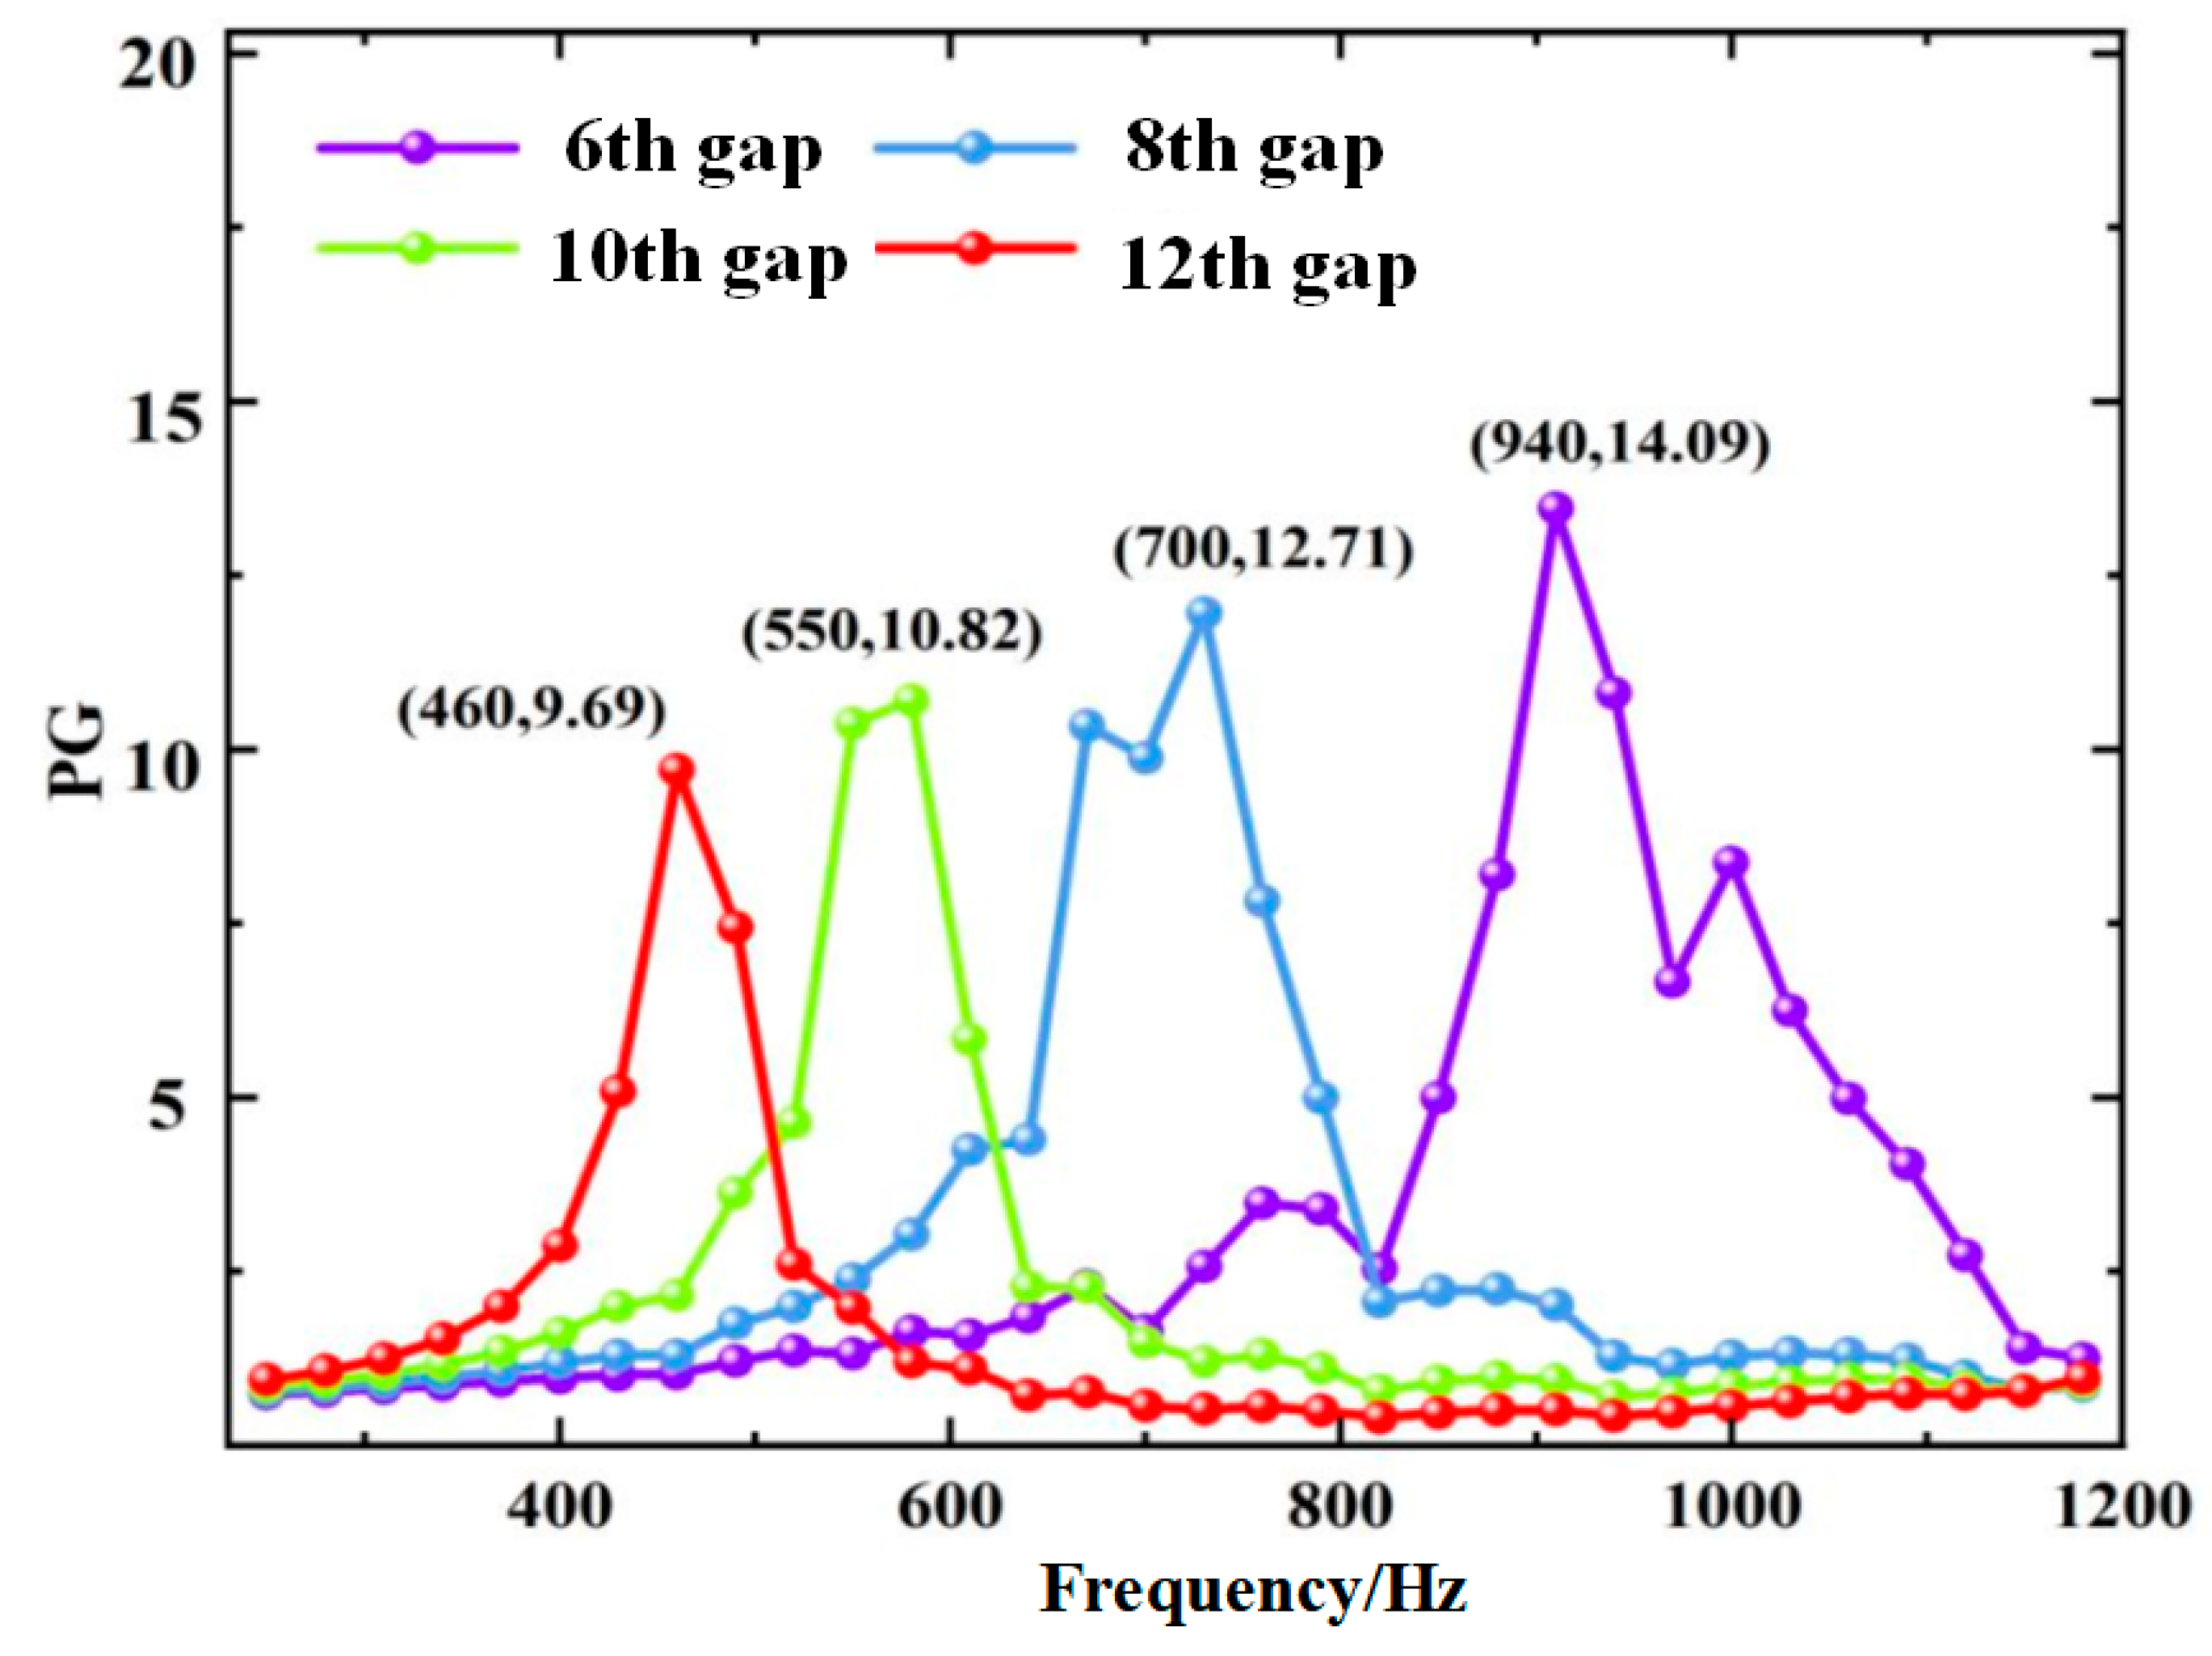
5.2. Sweep Frequency Signal Testing Based on the ZCGM Structure

To validate the numerical and simulation analyses presented in Section 2 and Section 3, this study analyzed a sweep frequency signal ranging from 250 Hz to 1200 Hz, with a step size of 30 Hz. The experiment focused on four selected air gaps, with the MEMS microphone positioned in the sixth, eighth, tenth, and twelfth gaps. Firstly, the frequency response of ZCGM structure under different gaps was collected, and high-frequency coupling resonance frequencies were filtered out through a low-pass filter. The cutoff frequencies of the sixth gap, eighth gap, tenth gap, and twelfth gap were 580 Hz, 710 Hz, 920 Hz, and 1200 Hz, respectively. Then, the acoustic response of the sixth gap, eighth gap, tenth gap, and twelfth gap without the ZCGM structure was tested for comparison. By analyzing these two sets of data, the sound pressure gain capabilities across different gaps were obtained, as illustrated in Figure 8. From the results in Figure 8, it can be observed that the operational frequencies of the constructed ZCGM structure for the four gaps are approximately 460 Hz, 550 Hz, 700 Hz, and 940 Hz, respectively. These results align closely with the operational frequencies obtained from simulations and calculations, demonstrating superior frequency selectivity. Furthermore, this supports the conclusion that as the gap position increases, the operational frequency decreases, and conversely, as the gap position decreases, the operational frequency increases. However, the measured central operational frequencies have decreased by 10 Hz to 20 Hz. The main reasons can be summarized as follows: systematic errors: the frequency resolution is limited by the sweep signal step size (30 Hz), resulting in an inherent deviation of ±15 Hz in the peak frequency identification; refractive index change introduced by the probe: the MEMS microphone occupies 3.06 mm2 of the gap cross-sectional area, and its rigid support structure equates to a local increase in the gap refractive index (~1.2%), which reduces the resonance frequency; manufacturing tolerances: the surface roughness of the 3D printed structure (measured Ra = 12.5 μm) leads to small changes in the acoustic wave propagation path, introducing a frequency shift of about 5 Hz (verified by simulation with the COMSOL roughness module). Figure 8 also indicates that the gain capabilities for the four gaps are approximately 9.69 times, 10.82 times, 12.71 times, and 14.09 times, respectively. These measured values are notably lower than those obtained from numerical simulations and theoretical calculations. This decrease is likely due to rough boundaries on the edges of the photosensitive resin printed material, which results in acoustic and thermal viscous losses in the testing environment. In general, as the gap position increases, the effective refractive index becomes higher, leading to a larger equivalent acoustic length of the gap, which in turn results in higher thermal viscous losses. Conversely, smaller gap positions correspond to shorter equivalent acoustic lengths and reduced thermal viscous losses. Thus, the thermal viscous losses between the gaps are proportional to the gap position, which suppresses the sound gain capabilities of higher-order gaps to some extent. A comparison of the thermo-viscous loss is shown in Table 4.

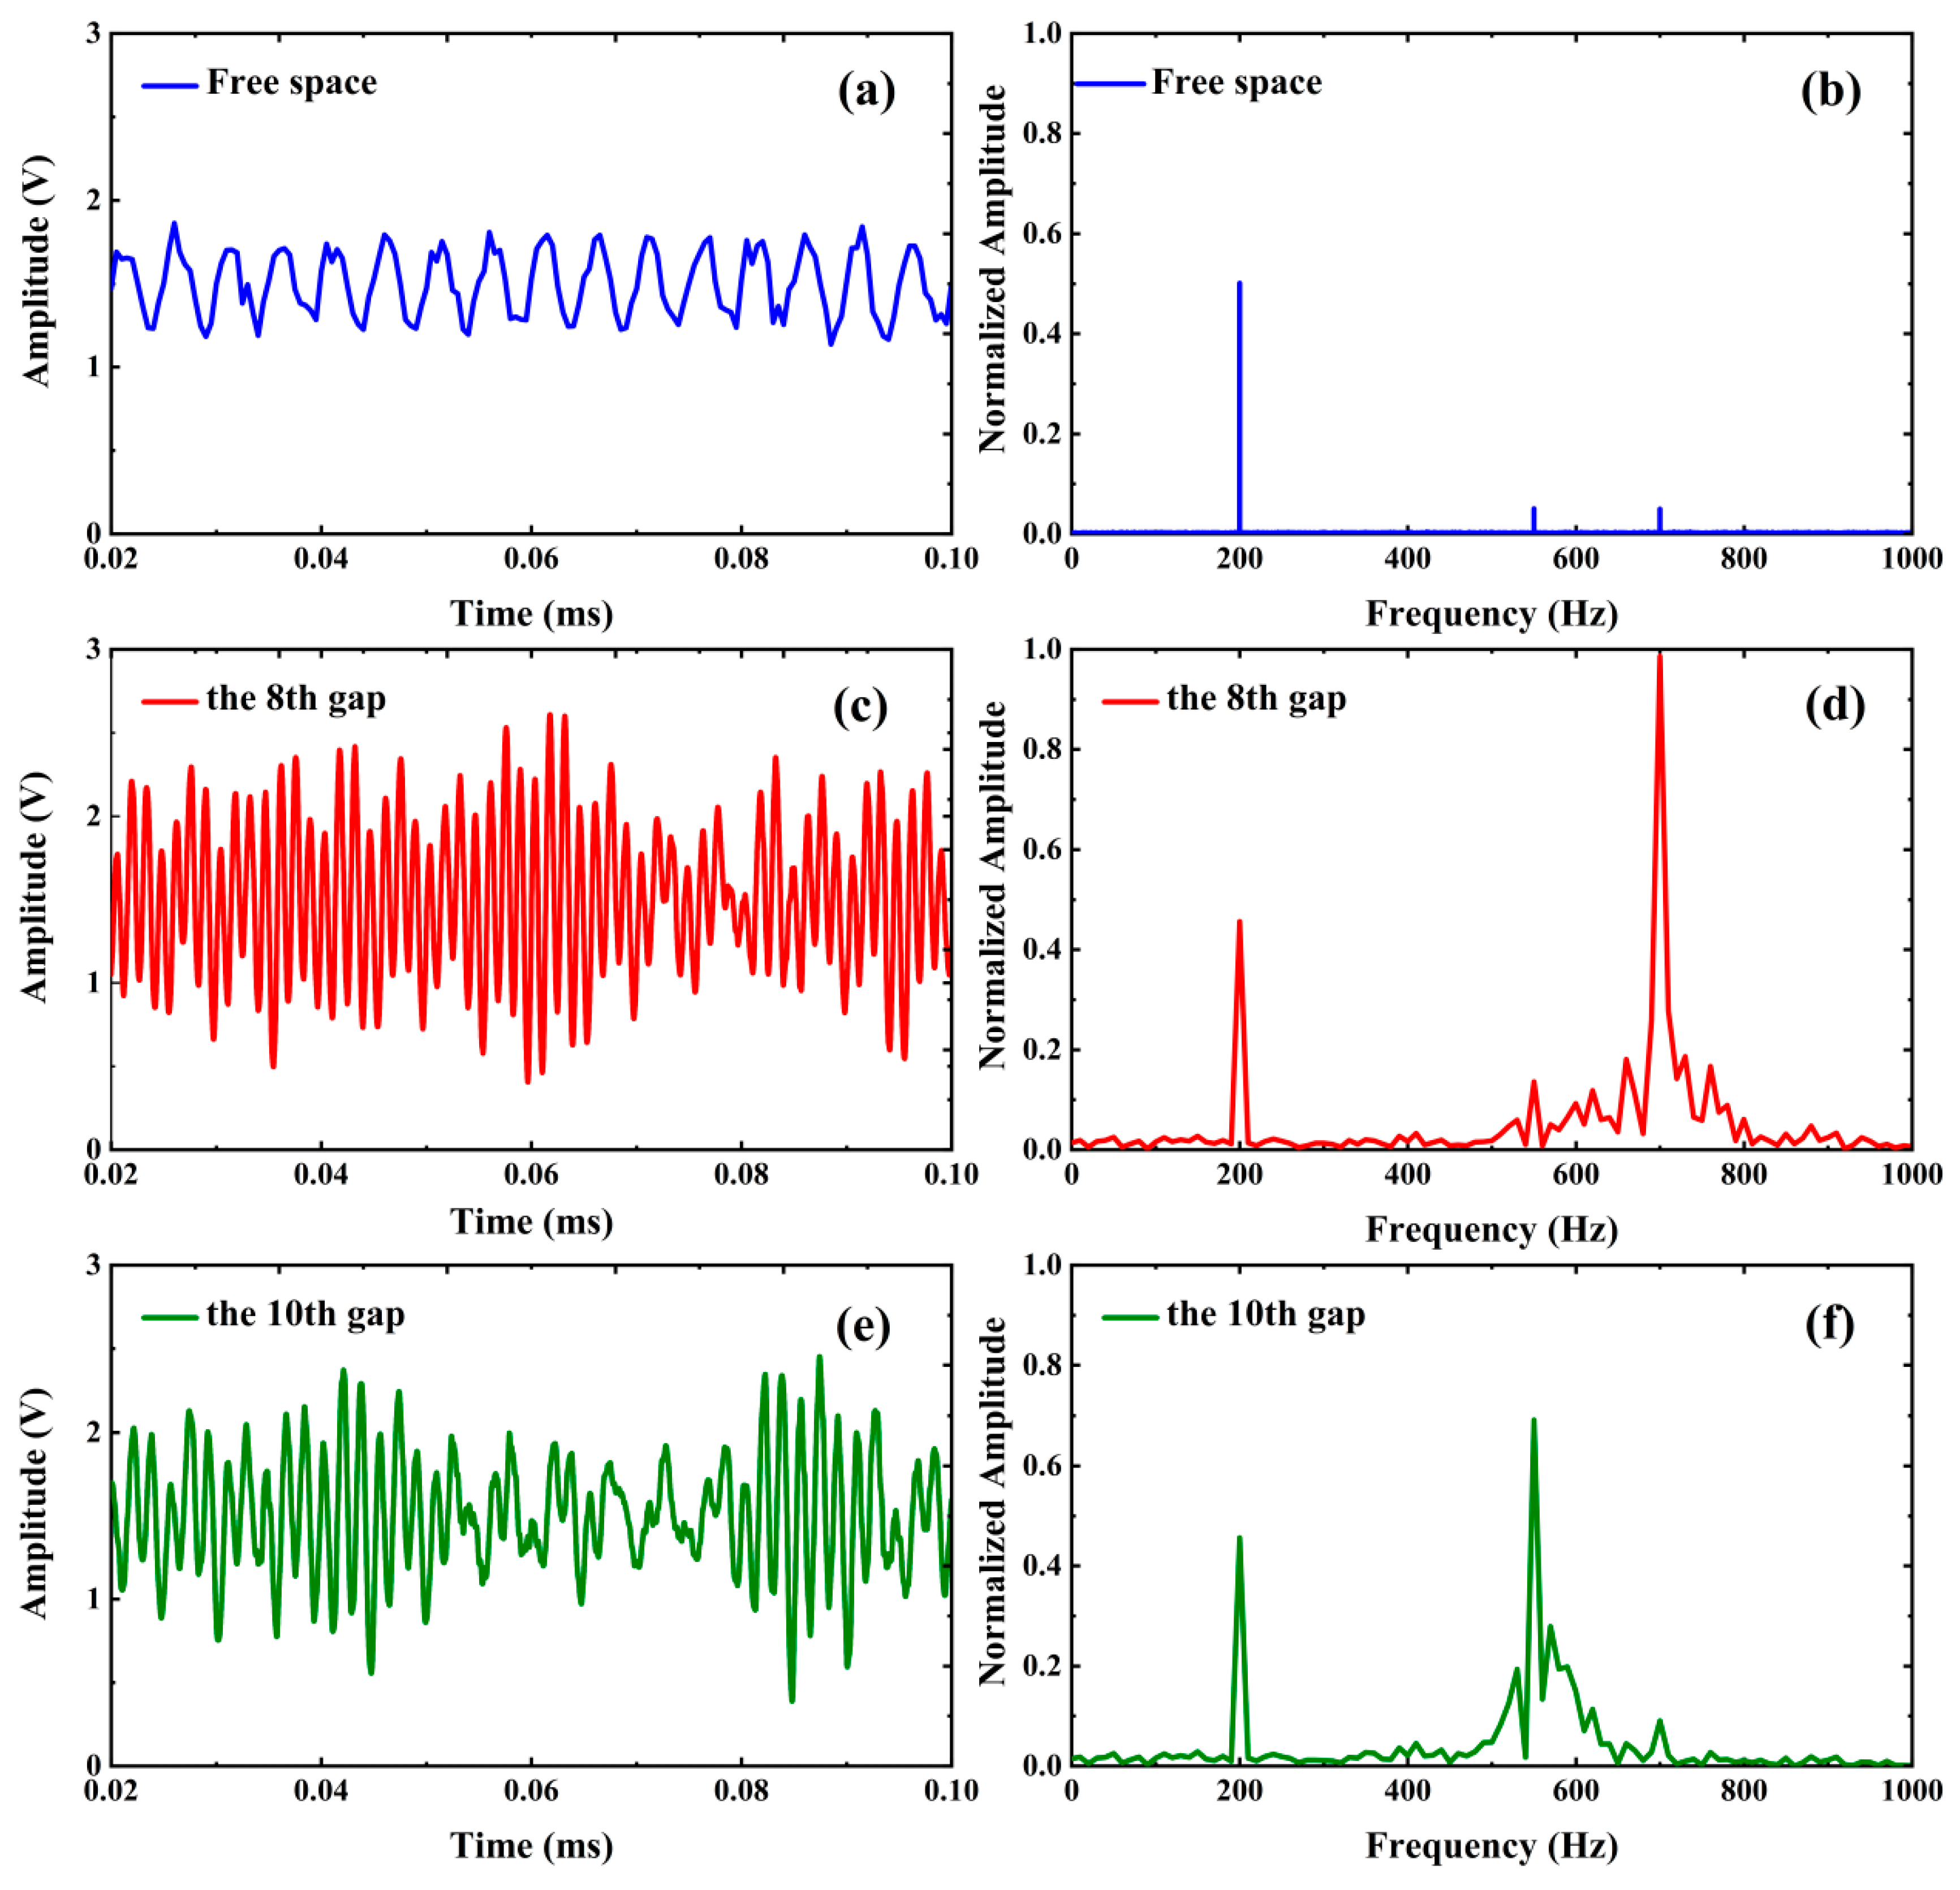
5.3. Acoustic Sensing of Harmonic Signals Based on the ZCGM Structure

In certain specific environments, weak sound communication methods and environmental sound signal monitoring represent superior options. However, environmental noise poses a significant challenge to this approach. As a result, it is crucial to effectively enhance the signal-to-noise ratio (SNR) of the received signals in high-noise environments. Based on the sweep frequency analysis of the selected four target gaps, this study utilizes a speaker to simulate the output of specific harmonic signals in the environment:
P ( t ) = 10 × cos ( 2 π × f 0 × t ) + cos ( 2 π × f 1 × t ) + cos ( 2 π × f 2 × t ) + R ( x )
The fundamental frequency of the acoustic signals is set at f0 = 200 Hz, with f1 = 550 Hz and f2 = 700 Hz corresponding to the center frequencies of the eighth and tenth gaps, respectively. Additionally, a disturbance noise signal R(x) was introduced using software. Since both the signals and noise are obtained under the same conditions, SNR can be calculated by evaluating the ratio of the square of the amplitude of the acquired signals:
S N R = 10 log 10 P s i g n a l P n o i s e = 10 log 10 A s i g n a l A n o i s e 2
where P s i g n a l corresponds to the average energy of the signal, P s i g n a l indicates the average energy of the noise, A s i g n a l stands for the measured effective signal amplitude, and A n o i s e represents the average amplitude of the noise.
In the absence of the ZCGM structure, the MEMS microphone was positioned 0.45 m from the speaker, and the obtained time-domain and frequency-domain signals are illustrated in Figure 9a and Figure 9b, respectively. It is evident that the effective signal is obscured by the fundamental frequency signal and noise, making it challenging to distinguish specific frequency components within the complex harmonic signals. Calculations reveal that the SNR for the frequency components at 550 Hz and 700 Hz are 1.5 dB and 1.4 dB, respectively. Subsequently, the ZCGM structure was introduced into the acrylic glass channel, with the microphone centrally positioned on the wall surfaces of the 8th and 10th gaps, which are in proximity to the sound source. Figure 9c,d present the time-domain waveforms and frequency-domain computed waveforms of the sound signal acquired from the 8th gap, while Figure 9e,f depict the corresponding time-domain and frequency-domain waveforms obtained from the 10th gap.
The data indicate that when the frequency of the target harmonic signal matches the operational frequency of the gap, the amplitude of the signal in that frequency range is amplified, resulting in an improved SNR. Conversely, frequencies that do not fall within the operational frequency range of the gap do not experience any enhancement. Furthermore, while the target harmonic signal at the gap frequency is amplified, there is also an increase in noise within that frequency range. This is not unexpected, as the primary objective of this study is to enhance the target frequency signal to make it perceptible. For the noise present within the operational bandwidth of the gap, digital filtering algorithms can be applied to the signals, enabling us to obtain a signal that closely approximates the desired target frequency. A comparison of acoustic signal amplification methods is shown in Table 5.
We calculated the acoustic gain and SNR for various target frequencies obtained from gaps six through twelve using the measured data, as illustrated in Figure 10. Specifically, Figure 10a presents the PG and SNR for the target frequency of 700 Hz captured by each gap, while Figure 10b displays the PG and SNR for the target frequency of 550 Hz across the same gaps. For the 700 Hz signal, the maximum SNR and gain factors are achieved at gap eight, with values of 14.32 dB and 26.21 times, respectively. Conversely, for the 550 Hz signal, the highest SNR and gain factors are recorded at gap ten, yielding values of 12.82 dB and 19.28 times, respectively. These results indicate that the amplification frequency range of the ZCGM is characterized by individual gap positions, demonstrating strong frequency selectivity and superior sound signal enhancement capabilities.

6. Conclusions

To address the challenges faced by traditional microphones in detecting weak sound signals and their associated low SNR, this study proposes a ZCGM structure that effectively amplifies the amplitude of weak signals at target frequencies. The ZCGM structure was evaluated and validated through numerical calculations, simulation models, and practical experiments. A harmonic signal environment was constructed to facilitate system testing and analyze the system’s performance. The results indicate that the proposed ZCGM structure can amplify the average sound pressure amplitude of acoustic signals by approximately 59.5 times, outperforming gradient models without the Z-shaped coiled structure. In comparison to conventional gradient models, the ZCGM can operate at lower frequencies without increasing its volume, enabling it to control sound signals with longer wavelengths. Each slit in the ZCGM structure features a narrower bandwidth, thereby enhancing the overall frequency selectivity of the structure. Additionally, ZCGM structures with varying increment parameters t were designed, and simulation calculations were conducted, demonstrating that different t values correspond to distinct operational frequencies. Leveraging the inherent tunability of the ZCGM structure’s profile, it exhibits superior adaptability in terms of operational frequency and response range. This adaptability enhances the ZCGM’s efficiency in locating weak sound signals. The structure is 3D printed, with cost advantages for small-scale production and cost reductions for large-scale optimization of materials (e.g., low-cost polymers) and processes; the proposed approach can use high-stability materials or protective coatings and long-term validation; and the choice of materials can be scenario-adapted (resins to preserve precision, plastics to reduce costs, and metals to improve strength), and synergistically optimized in combination with acoustic requirements. However, there are still some practical limitations of the current design: First, the performance of ZCGM structures is more sensitive to fabrication tolerances, e.g., deviations in the geometrical accuracy of the slit width and curl structure may lead to significant degradation of the acoustic pressure gain. Second, the scalability of ZCGMs is limited by material properties and processing techniques, especially in large-scale fabrication, where maintaining high accuracy and consistency is a challenge. To address these issues, potential optimization strategies include adopting higher-precision fabrication processes (e.g., nanoscale 3D printing), optimizing material selection to reduce acoustic loss, and optimizing structural parameters via machine learning algorithms to achieve a wider frequency response range. It is anticipated that ZCGM will leverage its unique advantages to excel in practical engineering applications, particularly in environments characterized by complex background noise when detecting target signals.

Author Contributions

Conceptualization, Formal analysis, Software, Writing—original draft preparation, Y.R.; Data curation, Validation, Writing—review and editing, G.H.; Investigation, Methodology, X.Z.; Supervision, Resources, Writing—review and editing, Project administration, Funding acquisition, J.H. All authors have read and agreed to the published version of the manuscript.

Funding

The work was supported by Shanxi Scholarship Council of China (2023-127), Natural Science Foundation of Shanxi Province (202103021224201) and The National Natural Science Foundation of China (61671414).

Institutional Review Board Statement

Not applicable.

Informed Consent Statement

Not applicable.

Data Availability Statement

The original contributions presented in this study are included in the article. Further inquiries can be directed to the corresponding author(s).

Conflicts of Interest

The authors declare no conflicts of interest. The funders had role in the writing of the manuscript and in the decision to publish the results.

References

  1. Mahapatra, C.; Mohanty, A.R. Optimization of number of microphones and microphone spacing using time delay based multilateration approach for explosive sound source localization. Appl. Acoust. 2022, 198, 108998. [Google Scholar] [CrossRef]
  2. Zhang, Y.; Chen, D.; You, W.; Li, J.; Du, M. Two-dimensional planar sound source localization based on microphone array. J. Phys. Conf. Ser. 2022, 2232, 012006. [Google Scholar] [CrossRef]
  3. Kaneko, S.; Ozawa, Y.; Nakai, K.; Saito, Y.; Asai, K.; Nonomura, T.; Ura, H. High-efficiency sound source localization using data-driven sparse sampling with validation using monopole laser sound source. AIP Adv. 2024, 14, 065025. [Google Scholar] [CrossRef]
  4. He, P.; Shen, L.; Henson, B.; Zakharov, Y.V. Coarse-to-Fine Localization of Underwater Acoustic Communication Receivers. Sensors 2022, 22, 6968. [Google Scholar] [CrossRef] [PubMed]
  5. Miller, A.; Miller, B.; Miller, G. On AUV Control with the Aid of Position Estimation Algorithms Based on Acoustic Seabed Sensing and DOA Measurements. Sensors 2019, 19, 5520. [Google Scholar] [CrossRef]
  6. Otero, P.; Hernández-Romero, Á.; Luque-Nieto, M.-Á.; Ariza, A. Underwater Positioning System Based on Drifting Buoys and Acoustic Modems. J. Mar. Sci. Eng. 2023, 11, 682. [Google Scholar] [CrossRef]
  7. Tang, Y.; Wang, L.; Jin, S.; Zhao, J.; Huang, C.; Yu, Y. AUV-Based Side-Scan Sonar Real-Time Method for Underwater-Target Detection. J. Mar. Sci. Eng. 2023, 11, 690. [Google Scholar] [CrossRef]
  8. Viegas, R.; Zabel, F.; Silva, A. In-Lab Demonstration of an Underwater Acoustic Spiral Source. Sensors 2023, 23, 4931. [Google Scholar] [CrossRef]
  9. Chen, Q.; Wang, P.; Wei, H. An algorithm for multi-target tracking in low-signal-to-clutter-ratio underwater acoustic scenes. AIP Adv. 2024, 14, 105121. [Google Scholar] [CrossRef]
  10. Zhang, T.; Zhang, W.; Shao, X.; Yang, Y.; Wu, Y.; Lei, M.; Wang, Z. Compressed sensing approach for CMUT sparse array in multi-element synthetic transmit aperture. Sens. Actuators A Phys. 2023, 349, 113965. [Google Scholar] [CrossRef]
  11. Chun-Di, S.I.; Chen, E.L.; Yang, S.P.; Wang, C.Y. Experimental on vehicle noise source identification. Noise Vib. Control 2010, 2, 40–43. [Google Scholar]
  12. Tian, H.; Peng, W.; Gao, K.; Jin, M.; Wu, T. High-resolution acoustic imaging method based on block sparsity constraint. AIP Adv. 2024, 14, 105230. [Google Scholar] [CrossRef]
  13. Zhao, W.; Yu, H.; Wen, Y.; Li, P.; Wang, X.; Wang, F.; Yang, Y.; Liu, L.; Li, W.J. Improving photoacoustic-imaging axial positioning accuracy and signal-to-noise ratio using acoustic echo effect. Sens. Actuators A Phys. 2021, 329, 112788. [Google Scholar] [CrossRef]
  14. Pascual, S.; Bonafonte, A.; Serrà, J. SEGAN: Speech Enhancement Generative Adversarial Network. In Proceedings of the Interspeech 2017, Stockholm, Sweden, 20–24 August 2017. [Google Scholar]
  15. Donahue, C.; Li, B.; Prabhavalkar, R. Exploring Speech Enhancement with Generative Adversarial Networks for Robust Speech Recognition. In Proceedings of the 2018 IEEE International Conference on Acoustics, Speech and Signal Processing (ICASSP), Calgary, AB, Canada, 15–20 April 2018; pp. 5024–5028. [Google Scholar]
  16. Hao, X.; Su, X.; Wang, Z.; Zhang, H.; Batushiren. UNetGAN: A Robust Speech Enhancement Approach in Time Domain for Extremely Low Signal-to-Noise Ratio Condition. In Proceedings of the Interspeech 2019, Graz, Austria, 15–19 September 2019; pp. 1786–1790. [Google Scholar]
  17. Hu, P.; Zhao, J.-B.; Liu, H.; Zhang, X.; Yao, H.; Zhang, G.-j. Low-frequency acoustic isolation performance of Helmholtz cavity acoustic metamaterials with bilateral single openings. AIP Adv. 2024, 14, 045325. [Google Scholar] [CrossRef]
  18. Zhang, S.; Zhang, Y.; Lu, W.; Hu, G.; Xu, B.-q.; Cao, W. Low-frequency forbidden bandgap engineering via a cascade of multiple 1D superlattices. J. Appl. Phys. 2018, 124, 155102. [Google Scholar] [CrossRef]
  19. Chen, D.-C.; Zhu, X.-F.; Wei, Q.; Yao, J.; Wu, D.-J. Broadband tunable focusing lenses by acoustic coding metasurfaces. J. Phys. D Appl. Phys. 2020, 53, 255501. [Google Scholar] [CrossRef]
  20. Chen, D.-C.; Zhu, X.-F.; Wei, Q.; Wu, D.-J. Bidirectional asymmetric acoustic focusing with two flat acoustic metasurfaces. Chin. Phys. B 2018, 27, 124302. [Google Scholar] [CrossRef]
  21. Gao, X.-y.; Cui, X.-b.; Zhang, Y.; Zhu, J.-j.; Huang, C.-p. Acoustoelectric conversion and deep-subwavelength acoustic focusing based on Fresnel zone plates. AIP Adv. 2023, 13, 035336. [Google Scholar] [CrossRef]
  22. Zangeneh-Nejad, F.; Fleury, R. Acoustic Analogues of High-Index Optical Waveguide Devices. Sci. Rep. 2018, 8, 10401. [Google Scholar] [CrossRef] [PubMed]
  23. Xu, B.-q.; Wu, J.; Lu, W.; Gu, X.; Zhang, L.-j.; Zhang, S.; Zhang, Y. Transmission and rainbow trapping of acoustic waves in a fluid medium using gradient-index superlattices. J. Appl. Phys. 2021, 129, 154501. [Google Scholar] [CrossRef]
  24. Chen, Y.; Liu, H.; Reilly, M.; Bae, H.; Yu, M. Enhanced acoustic sensing through wave compression and pressure amplification in anisotropic metamaterials. Nat. Commun. 2014, 5, 5247. [Google Scholar] [CrossRef] [PubMed]
  25. Xinjing, H.; Yutian, Y.; Jinyu, M.; Jian, L.; Xiaobo, R. An Acoustic Metamaterial-Based Sensor Capable of Multiband Filtering and Amplification. IEEE Sens. J. 2020, 20, 4413–4419. [Google Scholar] [CrossRef]
  26. Han, J.; Yang, P.; Tang, S. Local acoustic field enhancement of single cell photoacoustic signal detection based on metamaterial structure. AIP Adv. 2019, 9, 095064. [Google Scholar] [CrossRef]
  27. Chen, T.; Jiao, J.; Yu, D. Enhanced broadband acoustic sensing in gradient coiled metamaterials. J. Phys. D Appl. Phys. 2021, 54, 085501. [Google Scholar] [CrossRef]
  28. Chen, T.; Wang, C.; Yu, D. Pressure amplification and directional acoustic sensing based on a gradient metamaterial coupled with space-coiling structure. Mech. Syst. Signal Process. 2022, 181, 109499. [Google Scholar] [CrossRef]
  29. Birir, J.K.; Gatari, M.J.; Rajagopal, P. Structured channel metamaterials for deep sub-wavelength resolution in guided ultrasonics. AIP Adv. 2020, 10, 065027. [Google Scholar] [CrossRef]
  30. Cummer, S.A.; Christensen, J.; Alù, A. Controlling sound with acoustic metamaterials. Nat. Rev. Mater. 2016, 1, 16001. [Google Scholar] [CrossRef]
  31. Zhu, X.; Liang, B.; Kan, W.; Peng, Y.-G.; Cheng, J. Deep-Subwavelength-Scale Directional Sensing Based on Highly Localized Dipolar Mie Resonances. Phys. Rev. Appl. 2016, 5, 054015. [Google Scholar] [CrossRef]
  32. Poddubny, A.; Iorsh, I.; Belov, P.; Kivshar, Y. Hyperbolic metamaterials. Nat. Photonics 2013, 7, 948–957. [Google Scholar] [CrossRef]
Figure 1. (a) Three-dimensional view of the structure of ZCGMs; (b) amplified two-dimensional view of the coiling cell.
Crystals 15 00216 g001
Figure 2. Refractive index response of ZCGM structure (t = 5 mm) numerically calculated with different air gaps.
Crystals 15 00216 g002
Figure 3. Two-dimensional structure of the ZCGM.
Crystals 15 00216 g003
Figure 4. Simulation results of sound pressure distribution for three different structures at various frequencies: (a1d1) ZCGM structure (t = 5 mm) at frequencies of 951 Hz, 709 Hz, 570 Hz, and 475 Hz; (a2d2) ZCGM structure (t = 3 mm) at frequencies of 1438 Hz, 1102 Hz, 894 Hz, and 758 Hz; (a3d3) GAM structure at frequencies of 2221 Hz, 1754 Hz, 1455 Hz, and 1258 Hz.
Crystals 15 00216 g004
Figure 5. Absolute sound pressure gain between different air gaps for the ZCGM structure (t = 5 mm) and (t = 3 mm) as well as the GAM structure: (a) the sixth air gap; (b) the eighth air gap; (c) the tenth air gap; (d) the twelfth air gap.
Crystals 15 00216 g005
Figure 6. Acoustical frequency response diagram of ZCGM constructed with different materials at 12, 10, 8, 6 gaps: (ad) steel; (eh) photosensitive resin material.
Crystals 15 00216 g006
Figure 7. Testing environment and experimental setup.
Crystals 15 00216 g007
Figure 8. Gain response curves obtained from actual sound sweep frequency signal testing for the sixth, eighth, tenth, and twelfth air gaps.
Crystals 15 00216 g008
Figure 9. Signals received by the microphone at different gaps of the ZCGM: (a) the time domain in free space; (b) the frequency domain in free space; (c) the time domain in the 8th gap; (d) the frequency domain in the 8th gap; (e) the time domain in the 10th gap; (f) the frequency domain in the 10th gap.
Crystals 15 00216 g009
Figure 10. (a) Gain factors and SNR corresponding to the target frequency of 700 Hz for gaps six through twelve; (b) gain factors and SNR corresponding to the target frequency of 550 Hz for gaps six through twelve.
Crystals 15 00216 g010
Table 1. Summary of characteristic parameters.
ParametersL1DmlctHe
Values (mm)5531115553
Table 2. Center frequencies of ZCGM structure (t = 5 mm) numerically calculated with different air gaps at fnum (Hz).
Air Gapsfnum (Hz)Air Gapsfnum (Hz)
3rd18858th708
4th14309th628
5th114110th570
6th95111th517
7th80812th475
Table 3. Center frequencies obtained from simulations for each air gap in the ZCGM structure (t = 5 mm) at f1 (Hz), the ZCGM structure (t = 3 mm) at f2 (Hz), and the GAM structure at F (Hz).
Air Gapsf1 (Hz)f2 (Hz)F (Hz)Air Gapsf1 (Hz)f2 (Hz)F (Hz)
3rd1910261035438th70911021754
4th1430205630079th6289861588
5th11421692256110th5708941455
6th9511438222111th5188181338
7th8091248195812th4757581258
Table 4. Quantitative comparison table of thermo-viscous loss.
Air GapsSimulated Gain
(t = 5 mm)
Actual GainActual Gain/Simulated Gain (%)
6th27.514.0951.2%
8th29.812.7142.6%
10th24.710.8243.8%
12th20.759.6946.6%
Table 5. Comparison table of acoustic signal amplification methods.
MethodSound Pressure Gain
Multiple
Frequency Range
ZCGM20Low frequency
(475–1910 Hz)
Traditional GAM15High frequency (1258–3543 Hz)
Huang’s [25]>10Underwater mid-high frequencies
John K. Birir’s [29]UnspecifiedUltra-high frequency (guided wave ultrasound)
Disclaimer/Publisher’s Note: The statements, opinions and data contained in all publications are solely those of the individual author(s) and contributor(s) and not of MDPI and/or the editor(s). MDPI and/or the editor(s) disclaim responsibility for any injury to people or property resulting from any ideas, methods, instructions or products referred to in the content.

