Abstract
In this paper, the microstructure changes of an Al–6.8Zn–2Mg–2Cu–0.1Zr–0.2Sc alloy for shipbuilding under different T6 states were investigated. The effect of aging temperature on the electrochemical corrosion behavior of the alloy was analyzed by means of SEM, EDS, and TEM, and the corrosion mechanism was revealed. The results show that the bean-shaped Al3(Sc, Zr) phase is formed in the T6 alloy. The matrix-precipitated phase is mainly the GP zone at 120 °C. At 150 °C, part of the GP zone is transformed into the η′ phase, and at 180 °C, it is mainly η′ phase + η phase. After electrochemical testing in a 3.5 wt.% NaCl solution, it was found that the Cu content in the grain boundary η phase increased with the increase in aging temperature, the potential near the grain boundary increased, and the corrosion resistance increased. At the same time, the grain boundary precipitates were coarsened and distributed intermittently, which hindered the formation of corrosion channels and improved the corrosion resistance of the alloy. The corrosion mechanism of the alloy after aging at 120 °C/150 °C was mainly intergranular corrosion and pitting corrosion, while the corrosion mechanism after aging at 180 °C was mainly pitting corrosion.
1. Introduction
The 7xxxx aluminum alloy (Al–Zn–Mg–Cu series) is a typical aging-strengthening alloy that is widely used in aerospace, automobile manufacturing, and marine engineering due to its low density, high strength ratio, and excellent fatigue properties [1,2,3]. When the ship is sailing in the marine environment, it is exposed to corrosive media such as seawater, salt fog, and marine organisms for a long time, and the corrosion resistance of the material is extremely high. The 7xxx aluminum alloy can be used to manufacture the hull, superstructure, deck, and other structural parts of the ship. Its electrochemical corrosion resistance can effectively resist the erosion of seawater, prolong the service life of the ship, and reduce the maintenance costs [4,5]. The existence of Zn element in the alloy will form a layer of corrosion product film in some environments, which has a certain protective effect on the matrix [6]. Its corrosion resistance will change due to different heat treatment conditions. In the corrosive environment containing Cl−, if the heat treatment method is improper, the grain boundary of the alloy may be corroded and cracked, resulting in the failure and fracture of the ship’s structural parts [7,8]. The grain refinement and microstructure optimization of the alloy are usually realized by adding trace alloying elements or adjusting the heat treatment process so as to enhance its electrochemical corrosion resistance and protect the long-term safe operation of ship engineering structural parts. During the solidification process of the Al–Zn–Mg–Cu aluminum alloy, Zr element can form fine and uniformly distributed Al–Zr dispersed phase, which can effectively inhibit grain growth and refine grain size and is beneficial to improve the electrochemical corrosion resistance [9]. Sun et al. [10] studied the corrosion mechanism of an Al–7.82Zn–1.99Mg–2.41Cu–0.12Zr alloy under different aging conditions and found that the grain size was smaller in the under-aged state. The grain boundaries are mainly distributed with small and continuous precipitates, and the main corrosion mode is intergranular corrosion. In addition, Sun et al. [11] and Jiang et al. [12] also conducted electrochemical polarization curve tests on 7xxx aluminum alloy and obtained similar conclusions. Its essence is that the refined grain structure increases the grain boundary area. The grain boundary can be used as a barrier layer for corrosion during the electrochemical corrosion process, which changes the corrosion path and makes the corrosion process more uniform and slower. However, in the long-term corrosion environment containing Cl−, the stability of the passivation film formed on the surface of the alloy with only Zr element is poor, and the increase in the corrosion potential and the decrease in the corrosion current density are limited, which cannot effectively prevent the invasion of Cl−, resulting in the decrease in the corrosion resistance of the alloy [13,14,15]. Therefore, we focus our attention on the addition of Zr and Sc elements to the alloy in order to exert the synergistic effect of the elements. The formation of an Al3 (Sc, Zr) composite phase with a similar lattice constant to the Al matrix and higher thermal stability in the alloy further enhances the inhibition of grain growth [16]. Xia et al. [17] reached a similar conclusion that the electrochemical corrosion resistance of Al Zn Mg Cu alloy was improved by simultaneously adding Zr and Sc elements. At the same time, studies have shown that the Sc element can optimize the growth mechanism of the passivation film, make it more resistant to ion penetration in a Cl− containing environment, delay the occurrence of localized corrosion such as pitting, and provide more durable protection for the alloy matrix [18].
It is generally believed that the mechanical behavior and corrosion resistance of Al–Zn–Mg–Cu aluminum alloys are closely related to the precipitation behavior of the main strengthening precipitate η phase in the matrix. Aging treatment is the key to controlling the precipitation behavior of the η phase, and its size, dispersion, and distribution position are greatly affected by aging temperature [19]. Kayani et al. [20] conducted research on the morphology of η phase precipitation and found that after T6 treatment, the fine and dispersed η phase precipitated in the crystal is conducive to blocking dislocation movement, reducing the rupture of the surface facial mask caused by dislocation slip, and thus enhancing the electrochemical corrosion resistance of the alloy. Zhang et al. [21] found that when a large amount of η phase precipitates at the grain boundary, it leads to a decrease in the potential at the grain boundary, becoming a sensitive area for corrosion and easily causing corrosion cracks at the grain boundary, thereby affecting the electrochemical corrosion resistance of the alloy. In addition, Zhang et al. [22] believe that the intermittent and coarse precipitates distributed on grain boundaries can help hinder the formation of corrosion channels and improve the corrosion resistance of alloys. In summary, the precipitation behavior of the η phase has a complex effect on the electrochemical corrosion resistance of Al–Zn–Mg–Cu alloys. At present, there are few studies on the electrochemical corrosion behavior of Al–Zn–Mg–Cu alloys with Zr and Sc elements. Therefore, we selected T6 state Al–6.8Zn–2Mg–2Cu–0.1Zr–0.2Sc as the research object and took different aging temperatures as the entry point. We intended to achieve the redistribution of Cu elements in the η phase on the basis of satisfying the second phase strengthening by adjusting the heat treatment process, thereby changing the behavior of precipitates and reducing the potential difference between grain boundaries and grains, thereby improving corrosion resistance.
2. Experiment
The material used in the experiment was a self-designed Al–Zn–Mg–Cu–Zr–Sc alloy. The specific chemical composition was 6.8 wt.% Zn, 2.0 wt.% Mg, 2.0 wt.% Cu, 0.1 wt.% Zr, and 0.2 wt.% Sc, Bal.Al. Before smelting, the required raw materials were calculated according to the mass fraction ratio, and the burning loss of 5% Mg was considered. The melting temperature was 740 °C, and the order of adding raw materials was Al block, Cu block, Zn block, Al-5% Zr master alloy, Al-2% Sc master alloy, and Mg block. In the process of smelting, it was necessary to gently stir the aluminum liquid to ensure that all alloy elements were evenly and fully dissolved into the aluminum liquid. The metal liquid was poured into the metal mold slowly and evenly to avoid the break flow. After the casting was completed, the metal liquid naturally cooled and formed. Before extrusion, the ingot was subjected to a two-stage homogenization treatment of 410 °C × 6 h + 460 °C × 19 h + air cooling to remove the oxide scale on the surface of the ingot and clean the extrusion cylinder and mold. Ingots, extrusion drums, and dies were preheated at 460 °C for 4 h. The extrusion temperature was set to 490 °C–500 °C, the extrusion speed was 1.5–2 mm/s, and the extrusion ratio was 21:1. After the extruded bar was taken out, it was cooled to room temperature in natural air. The T6 treatment of the alloy was carried out in a special heating furnace for the JHF-27 (Beijing Haifuda Technology Co., Ltd., Beijing, China ) end quenching test. The specific process flow diagram is shown in Figure 1. Among them, the solid solution treatment process was 470 °C/2 h, water quenching. The aging treatment process was 120 °C, 150 °C, and 180 °C/10 h, air cooling.
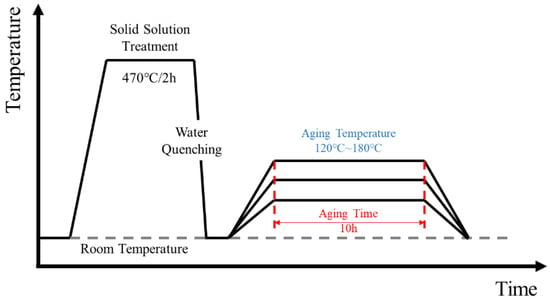
Figure 1.
Heat treatment process diagram of Al–6.8Zn–2Mg–2Cu–0.1Zr–0.2Sc alloy.
The samples after extrusion, homogenization treatment, and different aging treatments were selected for Brinell hardness measurement, and the influence of the heat treatment process on the change of hardness value was clarified. The sample was prepared by wire cutting with a size of 100 × 50 × 3 mm. The surface of the sample was cleaned with acetone, and the surface of the sample was polished with 1000# and 2000# sandpaper in turn. The HB-3000B Brinell hardness tester (Laizhou Dechuan Testing Instrument Co., Ltd., Yantai, China) was used to select a tungsten carbide ball indenter with a diameter of Φ5 mm and a test force of 1000 kgf for 30 s to ensure that the indentation diameter was within the appropriate range. Before measurement, the surface of the sample should be smooth and flat, without an oxide skin, an electroplating layer, a work-hardening layer, and other dirt, and the surface roughness should be Ra ≤ 3.2 μm. During the test, three different positions were selected for each sample for measurement. Generally, the diameters of the two directions perpendicular to each other are measured and averaged. According to the measured indentation diameter, the Brinell hardness calculation formula (HBW = 2F/(D(D − ))) is used to calculate the hardness value, where HBW is the Brinell hardness value, F is the test force, D is the indenter diameter, and d is the indentation diameter. The measurement results are shown in Table 1.

Table 1.
Brinell hardness (HBW) of the alloy in different states.
The dynamic potential polarization test was carried out by the VSP-300 electrochemical workstation (Hebei Dingtaike Technology Co., Ltd., Xingtai, China). The sample is prepared into blocks with a size of 1.2 × 1.2 × 1 cm after wire cutting to ensure that the sample surface is flat and free of obvious defects. Clean the surface of the sample with acetone to remove impurities such as oil and dust on the surface, so as to prevent these impurities from affecting the results of the corrosion test. The surface of the sample was polished with sandpaper of different particle sizes (such as 800#, 1200#, 2000#, etc.) until the surface was smooth and without obvious scratches. Epoxy resin for cold mosaic of the sample was selected to ensure that the working area of the test sample was 1 cm2. The corrosion solution was a 3.5 wt.% NaCl aqueous solution, and the electrochemical test adopted a three-electrode measurement system. The auxiliary electrode was a platinum electrode, the working electrode was the Al–6.8Zn–2Mg–2Cu–0.1Zr–0.2Sc alloy, and the reference electrode was a saturated calomel electrode. Before the electrochemical test, the samples were immersed in the electrolyte for 10~15 min, and the open-circuit potential was measured after the system was stable. An impedance spectrum test and a polarization curve test were carried out after the open-circuit potential was stabilized. The test frequency range of the impedance spectrum was from 100 kHz to 10 MHz, and the amplitude was 10 mV. The polarization curve was tested by the potentiodynamic scanning method. The scanning rate was 0.5 mV/s, and the scanning potential was −1.0~+1.5 V. ZSimpWin software was used to fit the test results with the selected equivalent circuit, and finally, the specific parameter values of the selected circuit corresponding to each component were obtained. The Tafel fitting of the strong polarization zone in the curve was carried out by the software of the electrochemical workstation to obtain the self-corrosion potential and self-corrosion current density of the sample and to evaluate the corrosion resistance of the alloy at different aging temperatures. In order to obtain accurate experimental results, all experiments were repeated three times or more.
The surface morphology and cross-sectional morphology of the alloy after electrochemical corrosion were observed by a SN-300 scanning electron microscope to determine the microstructural characteristics of the alloy after polarization corrosion in a 3.5 wt.% NaCl solution at different aging temperatures. The specific surface was scanned by an energy-dispersive spectrometer (EDS) to determine the content and distribution of each element in different regions, and the electrochemical corrosion characteristics of the alloy at different aging temperatures were analyzed. The microstructure of the alloy were observed and analyzed by a JEM-2100 transmission electron microscope. A TenuPol-5 double-jet thinning instrument was used for thinning, and a mixed solution of nitric acid and methanol (HNO3:CH3OH = 3:7) was prepared as the electrolyte. The parameter selection voltage of the double-jet thinning instrument was 19.2 V, and the temperature was −25 °C.
3. Results and Analysis
3.1. Microstructure
Figure 2 shows the bright field phase and the electron diffraction pattern along the axis of Al crystal band of Al-6.8Zn-2Mg-2.0Cu-0.1Zr-0.2Sc alloy at different aging temper-atures. It can be seen from the diagram that a large number of nano-scale precipitated phases are distributed inside the matrix at different aging temperatures. Combined with the electron diffrac- 192 tion pattern and related literature [13], it is known that the fine particle phases in TEM are 193 GP zone (FCC structure), η′ phase(HCP structure) and η phase(HCP structure), re-spec- 194 tively. The presence of no contrast band in the middle indicates that these particles are coherent with the matrix. From Figure 2a, it can be seen that after aging treatment, a large number of fine second phases are evenly distributed in the α-Al matrix. The matrix precip-itates (MPs) at different aging temperatures are mainly spherical, needle-like and rod-like. When the aging temperature is 120 °C (Figure 2(a1)), there are high density MPs in the al-loy matrix and the size is small, and the main form is nearly circular. With the increase of aging temperature, the number density level of MPs gradually decreases, while the size gradually increases. When the aging temperature is 150 °C (Figure 2(a2)), the size of MPs continues to increase, but the density decreases. In addition, the morphology of MPs also changed, and many needle-like precipitates appeared. When the aging temperature rises to 180 °C (Figure 2(a3)), rod-like precipitates with larger particle size appear in the matrix, and the morphology of MPs is mainly needle-like and rod-like. Combined with the electron diffraction pattern and related literature [13], it is known that the fine particle phases in TEM are GP zone, η′ phase and η phase, respectively. The type of precipitated phase can be distinguished by the position of the diffraction spots. The corresponding position of the diffraction bright spot in the GP zone in the diffraction pattern is 1/4{430}Al. The diffrac-tion bright spots of η′ phase appear at 1/3 and 2/3{220}Al in the diffraction pattern, and the bright spots near 2/3{220}Al indicate the existence of η phase. It can be seen that after aging at 120 °C, the precipitated phase in the alloy is mainly GP zone. When the aging temperature increases to 150 °C, the bright spot of η′ phase appears in the diffraction pattern. At this time, the precipitated phase of the alloy is mainly η′ phase, and there are a certain number of GP zones. When the aging temperature rises to 180 °C, the precipitated phases are mainly η′ phase and η phase. In addition, it can be seen from Figure 2b that the secondary Al3(Sc, Zr) phase exists at different aging temperatures, and its size is larger than that of the matrix precipitated phase. With the increase of aging temperature, the morphology and size of Al3(Sc, Zr) particles do not change significantly, which indicates that the aging treatment has little effect on its size. The diffraction spots at 1/2Al{220} cor-respond to Al3(Sc, Zr) particles in the diffraction pattern along the axis of Al crystal band [23]. It can be seen from the morphology and energy spectrum analysis results of the grain boundary precipitates in Figure 2c that when the aging temperature is 120 °C, the grain boundary precipitates (GBPs) of the alloy are fine and uniform, and are continuously dis-tributed, and no grain boundary precipitate free zone (PFZ) is observed. When the aging temperature increased to 150 °C, GBPs grew slightly, and its distribution changed from continuous to intermittent, and PFZ began to appear. When the aging temperature reaches 180 °C, the GBPs are relatively coarse, showing intermittent distribution characteristics, the interval between adjacent GBPs increases significantly, and the PFZ broadens signifi-cantly, about 205.1 nm. The energy spectrum analysis of A, B, and C positions shows that the content of the Cu element in GBPs increases gradually with the increase of aging temperature.
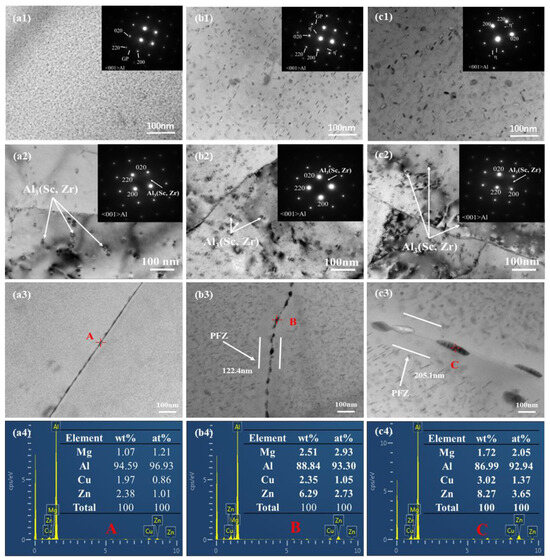
Figure 2.
The morphology and diffraction pattern of precipitated phase in T6 state Al-6.8Zn-2Mg- 221 2Cu-0.1Zr-0.2Sc alloy (a) 120 °C; (b) 150 °C; (c) 180 °C; (1) matrix precipitated phase; (2) Al3(Sc, Zr); 222 (3) PFZ; (4) EDS.
3.2. Polarization Curve
By analyzing the polarization curve, the key electrochemical parameters such as corrosion potential and corrosion current density can be obtained so as to reveal the characteristics of corrosion behavior of metal materials in a specific environment. Figure 3 is the corrosion potential–time diagram of the Al–6.8Zn–2Mg–2Cu–0.1Zr–0.2Sc alloy at different aging temperatures in 3.5 wt.% NaCl solution. It can be seen from the diagram that the open-circuit potential increases with the increase in aging temperature after aging at 120 °C, 150 °C, and 180 °C. This also indicates that the corrosion resistance of the alloy is improved after aging treatment at 180 °C.
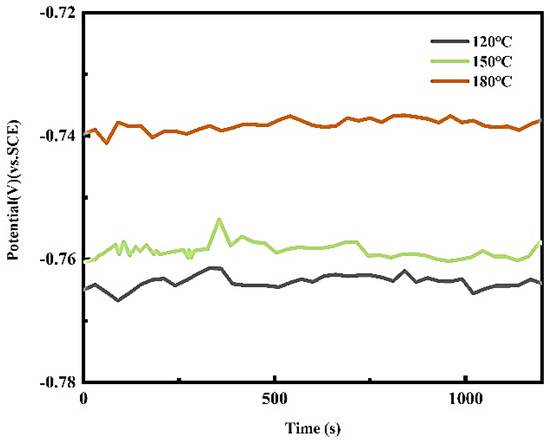
Figure 3.
Potential–time graph of alloy in 3.5 wt.% NaCl solution.
Figure 4 shows the potentiodynamic polarization curves of the alloy at different aging temperatures. The trend of the Tafel curves in the figure is similar, showing an obvious passivation phenomenon. This means that the alloys at different aging temperatures undergo a similar corrosion process in 3.5 wt.% NaCl solution. In the process of anodic polarization, a layer of passivation film has been formed on the surface of the alloy, which can weaken the attack of aggressive anions to a certain extent. Al is an active metal. After surface treatment, such as decontamination and polishing, the surface of the sample can quickly form a passivation film. However, due to the poor compactness of the passivation film, it is vulnerable to the destruction of Cl− and other acid-containing substances in the surrounding environment, resulting in the failure of the passivation film, so that the exposed surface of the Al alloy reacts with Cl−. In the environment containing Cl−, Cl− can penetrate and destroy the protective film formed on the metal surface, adsorb onto the surface passivation film, and inhibit the passivation process of the Al alloy [24]. At the same time, due to the adsorption of Cl− on the surface of the alloy, the electric field effect is generated, which leads to the accelerated dissolution rate of the metal surface [25].
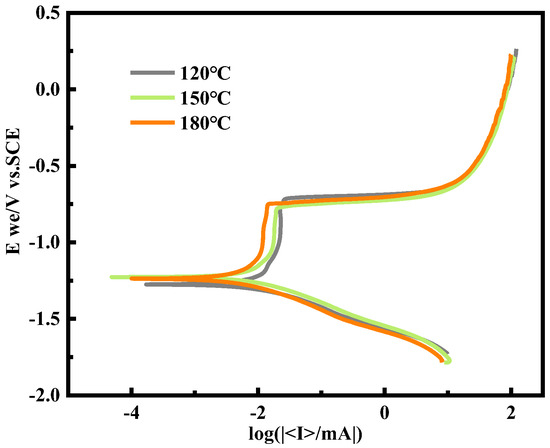
Figure 4.
Potentiodynamic polarization curves of alloy in 3.5 wt.% NaCl solution.
In order to further evaluate the corrosion resistance of the T6 Al–6.8Zn–2Mg–2Cu–0.1Zr–0.2Sc alloy, the relevant electrochemical parameters obtained by the Tafel curve extrapolation method are shown in Table 2. It can be seen from the table that there is no significant difference in the self-corrosion potential (Ecorr) of the alloy after the aging treatment at 120 °C and 150 °C. However, after the aging treatment at 180 °C, the self-corrosion potential (Ecorr) of the alloy moves to a positive value of 0.3 V, and the overall curve moves to a positive direction in the polarization curve. This means that the alloy surface may form a more stable passive film or have a better re-passivation ability, so that the potential moves forward, which is consistent with the re-passivation tendency. For the alloy with the tendency of re-passivation, the over-passivation zone may be delayed; that is, a higher potential is required to destroy the passivation film and enter the over-passivation zone, or the current density in the over-passivation zone increases relatively slowly, which indicates that the re-passivation ability of the alloy makes the passivation film have a higher stability and damage resistance. This is consistent with the negative correlation trend of corrosion current density (Icorr) and effective temperature change. When the aging temperature is 180 °C, the corrosion current density reaches the minimum. This shows that at this aging temperature, the aging temperature of the alloy is 3.5 wt.%, and the corrosion resistance in NaCl solution is the best.

Table 2.
Electrochemical parameters of alloy in 3.5 wt.% NaCl solution.
3.3. Electrochemical Impedance Spectroscopy
In the process of electrochemical reaction, the passivation film or the corrosion products formed on the surface will play a certain role in protecting the alloy matrix. When the impedance of the passivation film is large, the corrosion current density of the selected alloy can be reduced. Therefore, the EIS test method is used to quantify the impedance of the corrosion products generated on the surface of the passivation film, and the corrosion mechanism of the alloy is clarified. Figure 5 shows the Nyquist diagram, Bode diagram, phase angle diagram, and equivalent circuit diagram of the alloy at different aging temperatures. It can be seen from Figure 5a that the alloys exhibit semi-circular arc characteristics, which are related to the charge transport process at the interface. The capacitive arc corresponds to the electric double layer formed on the surface of the solution and the electrode, including the complete electrode processes such as the desorption of aluminum ions, the adsorption of chloride ions, and ion exchange. When the curve finally intersects the abscissa, this point represents the sum of the solution resistance and the oxide film resistance. Among them, the capacitance resistance radius of the alloy is the largest at the aging temperature of 180 °C, indicating that the charge transport resistance of the alloy material is the largest and the corrosion resistance is the strongest under this condition. Followed by the 150 °C aging alloy, the last is the 120 °C aging alloy. This means that with the increase in aging temperature, the arc radius of T6 alloy increases in different degrees. It can be seen from Figure 5b,c that the degree of the maximum tilted phase angle of the T6 alloy is less than 90°, and the maximum tilted phase angle varies from 60° to 80°. Therefore, when obtaining the equivalent circuit parameters of the alloy in 3.5 wt.% NaCl solution, the electrochemical device with double-layer capacitance should be selected for fitting.
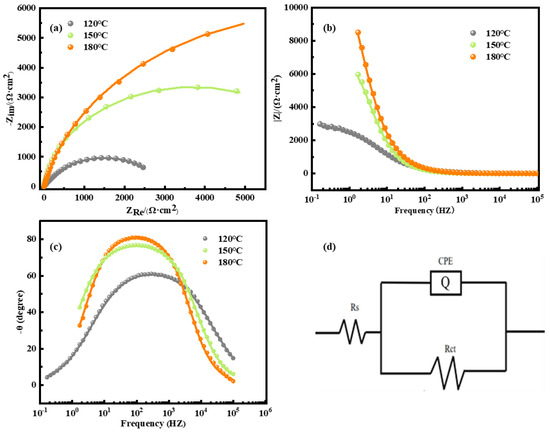
Figure 5.
Electrochemical impedance spectroscopy of alloy in 3.5 wt.% NaCl solution. (a) Nyquist plot; (b) Bode plot; (c) phase curve plot; (d) equivalent circuit diagram.
In general, the corrosion resistance of the material in the single capacitive arc impedance spectrum can be judged by the polarization resistance Rct, and the larger the Rct resistance is, the better the corrosion resistance is. The corrosion resistance of the alloy is stronger. The equivalent circuit obtained by fitting is shown in Figure 5d. The fitting results of the equivalent circuit parameters are listed in Table 2. RS is the solution resistance, Rct is the polarization resistance, and Q is the constant phase angle element. In the electrochemical test, the electrode and the solution medium contact to form a positive and negative charge arrangement distribution, attract each other, and form a double layer. The electric double layer is usually compared to a capacitor, but it is not exactly the same as the ‘pure capacitor’. There is a deviation between them, that is, the dispersion effect. In electrochemical impedance spectroscopy, the dispersion index of the constant phase element CPE is between 0.5 and 1. When the dispersion index is 1, it represents the pure capacitance, indicating that the electrode surface is smooth. It can be concluded from the table that when the n value is between 0.8 and 1.0, the surface of the alloy is relatively smooth and pollution-free. The electric double-layer capacitance shows a gradual increasing trend, indicating that the oxide film on the surface of the sample is getting thicker and thicker, and the difficulty of electrochemical reaction is gradually increasing. At the same time, the increase in the electric double-layer capacitance also shows that the activity of the surface of the sample is getting lower and lower, and the corrosion resistance of the sample is getting better and better. In addition, the polarization resistance (Rct) of the alloy aged at 120 °C, 150 °C, and 180 °C is 2983 Ω·cm−2, 7492 Ω·cm−2, and 14,320 Ω·cm−2, respectively. That is to say, the Rct of the alloy increases with the increase in aging temperature, which indicates that the corrosion resistance of the alloy increases with the increase in aging temperature. The above results are consistent with the change rule of Icorr described in Table 3.

Table 3.
Equivalent circuit parameters of alloy in 3.5 wt.% NaCl solution.
3.4. Morphology Characterization
In order to obtain the microstructure and element distribution of Al–5Zn–1.7Mg–2Cu–0.2Zr–0.2Sc alloy after corrosion in 3.5 wt.% NaCl solution at different aging temperatures, the surface of the alloy samples after polarization corrosion was observed and characterized by SEM. The results are shown in Figure 6. It can be clearly seen from the figure that there is a big difference between the corrosion morphologies of the samples due to the different aging temperatures. It can be seen from Figure 6a that a large number of deep local pits and irregular polygonal corrosion cracks were observed in the alloy after the aging treatment at 120 °C, and the corresponding corrosion types were pitting corrosion and intergranular corrosion. At this time, the alloy has serious corrosion, which corresponds to the maximum self-corrosion current density Icorr of the sample. It can be seen from Figure 6b that there are still a large number of pitting pits, and corrosion occurs at the grain boundary after the aging treatment at 150 °C, but the intergranular corrosion cracks are reduced compared with those at low-temperature aging, indicating that the corrosion resistance of the alloy is slightly improved at this aging temperature. It is worth noting that these pitting pits are mainly distributed around Cu-rich coarse particles (mainly Al7Cu2Fe phase), but these Cu-rich coarse particles are relatively uneroded. From Figure 6c, it can be seen that when the alloy is aged at 180 °C, almost no intergranular corrosion cracks can be observed, only pitting pits can be observed, and the depth of pitting pits is shallow, indicating that the corrosion resistance of the alloy is the best at this time. In summary, increasing the aging temperature can effectively control the intergranular corrosion of the alloy and improve the corrosion resistance of the alloy.
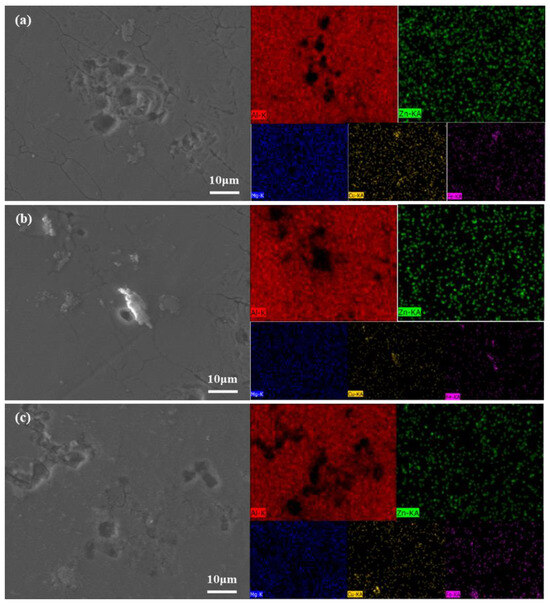
Figure 6.
EDS elemental distribution maps of alloy polarized surfaces after different aging treat-351 ments (a) 120 °C; (b) 150 °C; (c) 180 °C; (1) SEM; (2) Al element; (3) Zn element; (4) Mg element; (5) Cu 352 element; (6) Fe element.
Figure 7 shows the cross-sectional morphology and element distribution of the T6 Al–6.8Zn–2Mg–2Cu–0.1Zr–0.2Sc alloy after polarization in a 3.5 wt.% NaCl solution. The cross-sectional element distribution map includes the five elements Al, O, Mg, Cu, and Fe. By comparing the color depth changes of each element in the picture, the distribution of each element can be intuitively analyzed. Al is an active metal. The polarization test makes the oxide film of the metal break, and the Al matrix is exposed. In an environment containing oxygen or water, a new passive and self-healing surface oxide film will be formed, which corresponds to the shallower Al element and the deeper O element in the corroded area in Figure 7. The corrosion depth reflects the corrosion rate of the alloy during the polarization test. The maximum corrosion depth of the sample at the 120 °C aging temperature reaches 112 μm, and a large area of corrosion area is formed (as shown in Figure 7a). The corrosion degree of the alloy at this aging temperature is more serious. With the increase in aging temperature, the corrosion depth of the samples decreased significantly. The maximum corrosion depths of the samples at 150 °C and 180 °C are 53 μm and 51 μm, respectively (as shown in Figure 7b,c). However, the samples at 180 °C did not form a large area of corrosion area and only a small part of the pitting (the depth is 38 μm~51 μm). The above results show that the increase in aging temperature reduces the corrosion rate of T6 Al–6.8Zn–2Mg–2Cu–0.1Zr–0.2Sc alloy in 3.5 wt.% NaCl solution.
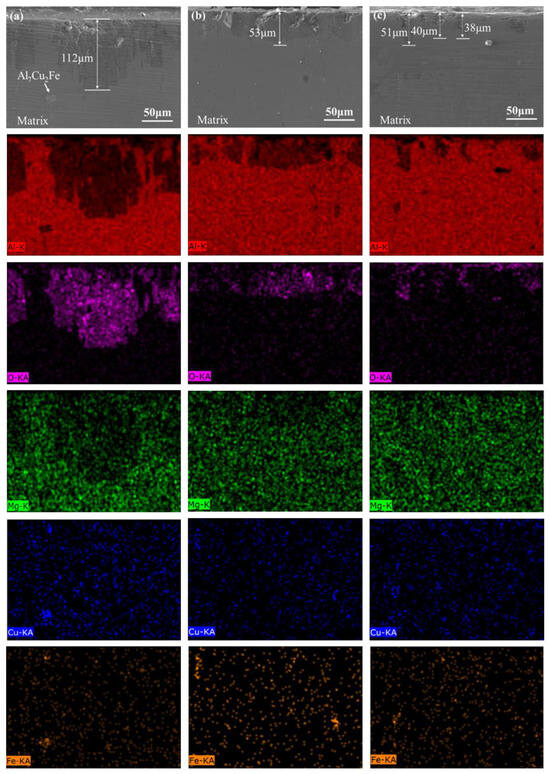
Figure 7.
EDS elemental distribution maps of alloy polarization cross-sections after different aging treat-373 ments (a) 120 °C; (b) 150 °C; (c) 180 °C; (1) SEM; (2) Al element; (3) O element; (4) Mg element; (5) Cu 374 element; (6) Fe element.
4. Discussion
Pitting corrosion and intergranular corrosion are two common forms of corrosion. Corrosion first begins on the surface of the alloy and extends to the grain boundary, resulting in a significant weakening of the intergranular bonding force and eventually leading to brittle fracture of the alloy. It can be seen from the above analysis that the intergranular corrosion of Al–Zn–Mg–Cu alloy is closely related to the characteristics of GBPs. Due to the precipitation of the η phase from the Al matrix at a certain temperature, a large amount of Zn and Mg elements near the grain boundary are consumed. The content of Zn and Mg elements near the grain boundary is lower than the limit required for passivation, forming a poor Zn and Mg zone, which destroys the passivation state of Al–6.8Zn–2Mg–2Cu–0.1Zr–0.2Sc alloy. The electrochemical potential of the region near the grain boundary decreases, while the grain itself maintains a passive state, and the potential is high, so that a short-circuit galvanic corrosion cell with the grain as the cathode and the grain boundary as the anode, activation-passivation is formed. The current density of the active dissolution of the grain boundary is very large, and the grain boundary of the material is in the corrosive liquid. Serious anodic dissolution occurs. Figure 8 shows the change in precipitated phase behavior of the T6 alloy during electrochemical corrosion. Both Mg and Zn have lower electrochemical potential than Al matrix. Therefore, the η phase is easily preferentially dissolved as an anode during SCC, as shown in Figure 8a. On the contrary, the Cu-rich precipitated phase (mainly Al7Cu2Fe phase) preferentially dissolves the Al matrix due to its high potential, as shown in Figure 8b. Xu et al. [26] showed that coarse copper-rich particles could not be obviously dissolved and existed as the cathode phase. Kayani et al. [20] pointed out that the coarse copper-rich particles as the cathode promoted the local dissolution of the Al matrix in its surrounding environment, and the corrosion products gathered on these coarse particles, resulting in higher local stress concentration. Combined with Figure 6, it is shown that the pitting pits around the Cu-rich coarse particles are due to the fact that the Al7Cu2Fe phase as the cathode promotes the local pitting of the Al matrix, which is consistent with the above view. In Al–6.8Zn–2Mg–2Cu–0.1Zr–0.2Sc alloy, the continuous distribution of GBPs will lead to the continuous distribution of corrosion products, which will form channels and accelerate the corrosion rate of the alloy. This is because the oxide forms a protective film on the surface, which further promotes the anodic reaction, so the corrosion is more severe in this case. On the contrary, when GBPs are discontinuously distributed, the formation of corrosion channels will be limited, thus preventing the anodic reaction. When the corrosive medium can invade the region between GBPs, the intergranular corrosion rate decreases due to the hindrance of the anodic reaction. When the aging temperature is 120 °C, GBPs show a fine, uniform, and continuous distribution. The η phase precipitated on the grain boundary shows a high dissolution tendency, and different precipitated phases are formed inside and around the grain boundary. Due to the different potential difference between the grain boundary and the matrix, the GBPs continuously distributed at the grain boundary are dissolved after the galvanic reaction with the adjacent Al matrix, thus forming intergranular corrosion on the surface. When the aging temperature rises to 150 °C, the size of GBPs increases, and the distribution of GBPs changes from continuous to discontinuous, which limits the formation of corrosion channels and inhibits the rapid corrosion propagation along the grain boundary to a certain extent. As the aging temperature increases to 180 °C, the size of GBPs increases, and the spacing between adjacent GBPs also increases, and the anodic dissolution reaction is hindered. In this paper, increasing the aging temperature can reduce the continuity of GBPs, thereby improving the corrosion resistance of the alloy. In summary, in Al–Zn–Mg–Cu aluminum alloys, the continuous distribution of GBPs will accelerate the corrosion rate, while the discontinuous distribution will slow down the corrosion rate. Therefore, reasonable control of the distribution of GBPs can effectively improve the corrosion resistance of the alloy.
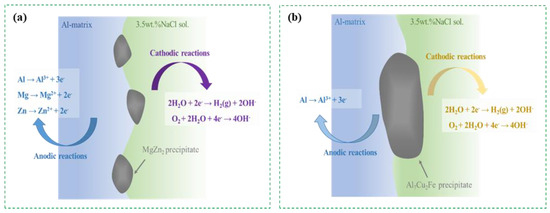
Figure 8.
Electrochemical corrosion behavior of alloy during SCC, showing (a) anodic reaction; (b) cathodic reaction.
5. Conclusions
- (1)
- After aging treatment at 120 °C, 150 °C, and 180 °C/10 h, the matrix precipitates of T6 Al–6.8Zn–2Mg–2Cu–0.1Zr–0.2Sc alloy are GP zone, GP zone + η′ phase, and η′ phase + η phase, respectively. Bean-like Al3(Sc, Zr) phase is distributed in the crystal.
- (2)
- With the increase in aging temperature, the precipitated phase at the grain boundary gradually coarsens and distributes intermittently. With the increase in Cu content, there is no precipitation zone at the grain boundary, and the width is obvious.
- (3)
- After electrochemical corrosion in a 3.5 wt.% NaCl solution, with the increase of aging temperature, the corrosion current density decreases, the polarization resistance increases, and the corrosion resistance increases. The coarse η phase on the grain boundary and its high Cu content are the main reasons for the improvement in the corrosion resistance of the alloy.
- (4)
- The electrochemical corrosion mechanism of the alloy aged at 120 °C/150 °C is intergranular corrosion and pitting corrosion, while the corrosion mechanism of the alloy aged at 180 °C is pitting corrosion.
Author Contributions
Conceptualization, B.C. and X.L.; methodology, Y.Y.; software, H.L.; data curation, B.C.; writing—original draft preparation, B.C.; writing—review and editing, F.S. All authors have read and agreed to the published version of the manuscript.
Funding
This research received no external funding.
Informed Consent Statement
Informed consent was obtained from all subjects involved in the study.
Data Availability Statement
Data available in a publicly accessible repository.
Conflicts of Interest
Author Yang Yi was employed by the company Shenyang Xinghua Aviation Electrical Co., Ltd. The remaining authors declare that the research was conducted in the absence of any commercial or financial relationships that could be construed as a potential conflict of interest.
References
- Yang, M.; Lu, F.; Zhou, S.; Liu, S.; Ye, L. Effect of Cu on precipitation hardening and clustering behavior of Al-Zn-Mg alloys in the early stage of aging. Mater. Charact. 2025, 219, 114632. [Google Scholar] [CrossRef]
- Chen, Z.; Ren, C.; Le, W.; An, B. Precipitation behavior and precipitates Characterization of Al-Zn-Mg-Cu alloy during the non-isothermal aging process. Vacuum 2024, 113946. [Google Scholar] [CrossRef]
- Jiang, X.; Che, X.; Zhu, M.; Liu, C. Effect of aging state on the microstructure and tensile properties of Al-7.0Zn-2.5Mg-2.0Cu-0.1Zr-0.2Sc alloy. Crystals 2023, 13, 581. [Google Scholar] [CrossRef]
- Wei, X.; Fu, D.; Chen, M.; Wu, W.; Wu, D.; Liu, C. Data mining to effect of key alloying elements on corrosion resistance of low alloy steels in Sanya seawater environment Alloying Elements. J. Mater. Sci. Technol. 2021, 64, 222–232. [Google Scholar] [CrossRef]
- Xiong, X.L.; Zhang, N.; Yang, J.J.; Chen, T.; Niu, T. Machine learning-assisted prediction of corrosion behavior of 7XXX aluminum alloys. Metals 2024, 14, 401. [Google Scholar] [CrossRef]
- Chen, S.; Li, J.; Hu, G.-Y.; Chen, K.; Huang, L. Effect of Zn/Mg ratios on SCC, electrochemical corrosion properties and microstructure of Al-Zn-Mg alloy. J. Alloys Compd. 2018, 757, 259–264. [Google Scholar] [CrossRef]
- Peng, X.; Li, Y.; Xu, G.; Huang, J.; Yin, Z. Effect of precipitate state on mechanical properties, corrosion behavior, and microstructures of Al-Zn-Mg-Cu alloy. Met. Mater. Int. 2018, 24, 1046–1057. [Google Scholar] [CrossRef]
- Liu, P.; Hu, L.; Zhang, Q.; Yang, C.; Yu, Z.; Zhang, J.; Hu, J.; Cao, F. Effect of aging treatment on microstructure and corrosion behavior of Al-Zn-Mg aluminum alloy in aqueous. J. Mater. Sci. Technol. 2021, 64, 85–98. [Google Scholar] [CrossRef]
- Deng, P.; Mo, W.; Ouyang, Z.; Chen, J.; Luo, B.; Bai, Z. Effect of Zr content on corrosion behavior and chemically-milled surface roughness of Al-Cu-Mg alloy. J. Alloys Compd. 2023, 965, 171364. [Google Scholar] [CrossRef]
- Sun, Y.W.; Wang, Z.Y.; Pan, Q.L.; Chen, W.X.; Yin, Z.K.; Li, D.K.; Zheng, Q. Localized corrosion process of Al-Zn-Mg-Cu-Zr alloy: Transitions from pitting corrosion to intergranular corrosion. J. Cent. South Univ. 2023, 30, 2120–2132. [Google Scholar] [CrossRef]
- Sun, Q.Q.; Chen, K.H.; Fang, H.C.; Xu, J.; Dong, P.; Hu, G.; Chen, Q. Effect of grain refinement on electrochemical behavior of Al-Zn-Mg-Cu alloys. Int. J. Electrochem. Sci. 2016, 11, 5855–5869. [Google Scholar] [CrossRef]
- Jiang, K.-D.; Liao, Z.-X.; Chen, M.-Y.; Liu, S.-D.; Tang, J.-G. Impact of cooling rate on exfoliation corrosion resistance of a Li-containing 7xxx aluminum alloy. J. Cent. South Univ. 2024, 31, 2225–2236. [Google Scholar] [CrossRef]
- Lin, Y.; Zhang, J.; Liu, G.; Liang, Y.J. Effects of pre-treatments on aging precipitates and corrosion resistance of a creep-aged Al-Zn-Mg-Cu alloy. Mater. Des. 2015, 83, 866–875. [Google Scholar] [CrossRef]
- Yu, X.; Zhao, Z.; Shi, D.; Dong, X.; Shi, X.; Li, C.; Zhao, J.; Dai, H. Enhancing the corrosion resistance and mechanical properties of a high-alloying Al-Zn-Mg-Cu-Zr alloy by Ce addition and aging treatment. Metals 2020, 10, 1318. [Google Scholar] [CrossRef]
- Shi, Y.J.; Pan, Q.L.; Li, M.J.; Huang, X.; Li, B. Effect of Sc and Zr additions on corrosion behaviour of Al-Zn-Mg-Cu alloys. J. Alloys Compd. 2014, 612, 42–50. [Google Scholar] [CrossRef]
- Sun, F.; Nash, G.L.; Li, Q.; Liu, E.; He, C.; Shi, C.; Zhao, N. Effect of Sc and Zr additions on microstructures and corrosion behavior of Al-Cu-Mg-Sc-Zr alloys. J. Mater. Sci. Technol. 2017, 33, 1015–1022. [Google Scholar] [CrossRef]
- Xia, P.; Wang, S.; Huang, H.; Zhou, N.; Song, D.; Jia, Y. Effect of Sc and Zr additions on recrystallization behavior and intergranular corrosion resistance of Al-Zn-Mg-Cu alloys. Materials 2021, 14, 5516. [Google Scholar] [CrossRef]
- Liu, L.; Jia, Y.-Y.; Jiang, J.-T.; Zhang, B.; Li, G.-A.; Shao, W.-Z.; Zhen, L. The effect of Cu and Sc on the localized corrosion resistance of Al-Zn-Mg-X alloys. J. Alloys Compd. 2019, 799, 1–14. [Google Scholar] [CrossRef]
- Azarniya, A.; Taheri, A.K.; Taheri, K.K. Recent advances in ageing of 7xxx series aluminum alloys: A physical metallurgy perspective. J. Alloys Compd. 2019, 781, 945–983. [Google Scholar] [CrossRef]
- Kayani, S.H.; Park, S.; Euh, K.; Seol, J.B.; Kim, J.G.; Sung, H. Dislocation-aided electrochemical behavior of precipitates in stress corrosion cracking of Al-Zn-Mg-Cu alloys. Mater. Charact. 2022, 190, 112019. [Google Scholar] [CrossRef]
- Zhang, M.-H.; Liu, S.-D.; Jiang, J.-Y.; Wei, W.-C. Effect of Cu content on intergranular corrosion and exfoliation corrosion susceptibility of Al-Zn-Mg-(Cu) alloys. Trans. Nonferrous Met. Soc. China 2023, 33, 1963–1976. [Google Scholar] [CrossRef]
- Zhang, Z.G.; Ma, X.W.; Zhang, C.S.; Chu, G.; Meng, Z.; Zhao, G.; Chen, L. Effect of stress-aging treatment on the mechanical and corrosion properties of Al–Zn–Mg–Cu alloy. Mater. Sci. Eng. A 2022, 838, 142791. [Google Scholar] [CrossRef]
- Leng, J.-F.; Ren, B.-H.; Zhou, Q.-B.; Zhao, J.-W. Effect of Sc and Zr on recrystallization behavior of 7075 aluminum alloy. Trans. Nonferrous Met. Soc. China 2021, 31, 2545–2557. [Google Scholar] [CrossRef]
- Li, C.; Pan, Q.L.; Shi, Y.J.; Wang, Y.; Li, B. Influence of aging temperature on corrosion behavior of Al-Zn-Mg-Sc-Zr alloy. Mater. Des. 2014, 55, 551–559. [Google Scholar] [CrossRef]
- Liang, Y.; Li, G.; Liu, L.; Jiang, J.; Cao, J.; Shao, W.; Zhen, L. Corrosion behavior of Al-6.8Zn-2.2Mg-Sc-Zr alloy with high resistance to intergranular corrosion. J. Mater. Res. Technol. 2023, 24, 7552–7569. [Google Scholar] [CrossRef]
- Xu, D.K.; Birbilis, N.; Rometsch, P.A. Effect of S-phase dissolution on the corrosion and stress corrosion cracking of an as-rolled Al-Zn-Mg-Cu Alloy. Corrosion 2012, 68, B1–B10. [Google Scholar] [CrossRef]
Disclaimer/Publisher’s Note: The statements, opinions and data contained in all publications are solely those of the individual author(s) and contributor(s) and not of MDPI and/or the editor(s). MDPI and/or the editor(s) disclaim responsibility for any injury to people or property resulting from any ideas, methods, instructions or products referred to in the content. |
© 2025 by the authors. Licensee MDPI, Basel, Switzerland. This article is an open access article distributed under the terms and conditions of the Creative Commons Attribution (CC BY) license (https://creativecommons.org/licenses/by/4.0/).