Article

Chromaticity Study of Yellow HTHP Lab-Grown Diamonds Based on Spectroscopy

Faculty of Materials Science and Engineering, Kunming University of Science and Technology, Kunming 650093, China
*
Authors to whom correspondence should be addressed.
Crystals 2025, 15(11), 942; https://doi.org/10.3390/cryst15110942 (registering DOI)
Submission received: 10 October 2025 / Revised: 28 October 2025 / Accepted: 29 October 2025 / Published: 31 October 2025
(This article belongs to the Section Mineralogical Crystallography and Biomineralization)

Abstract

In recent years, lab-grown diamonds have become more popular in both domestic and international markets for their rich color palette. Research on yellow lab-grown diamonds has primarily focused on spectroscopic and defect characteristics currently, while the study has largely focused on nitrogen content and related color-causing mechanisms, such as NV series defects. However, the relationship between nitrogen content and defects and color is limited. In this study, eight lab-grown diamonds with varying yellow shades were selected as samples to be studied by photoluminescence spectra, infrared spectra, Raman spectra, and colorimetry testing. Based on the colorimetric parameters L*, a*, and b*, the standard formula for the yellowness index, the intensities of the NV0 and NV peaks in the photoluminescence spectra and the absorptivity in the infrared spectra, the hue angle h, the yellowness index YI E313, the concentration ratio of NV defect in NV color centers R, and the nitrogen content NC were calculated. Results indicate that characteristic peaks of NV series defects as a specific photoluminescence signature, notably the absence of [Si-V] defect, demonstrate that the samples are high-temperature, high-pressure diamonds derived from graphite that underwent post-growth irradiation. The specific infrared signature indicates that the type of samples is type Ib, attributed to isolated nitrogen (C aggregate). The intrinsic peak of diamond is detected in Raman spectra, with symmetric stretching vibrations of C and N and the ‘D’ peak of graphite is detected as well. Meanwhile, the yellowness index shows a negative correlation with hue angle, a positive correlation with concentration ratio, and a positive linear correlation with nitrogen content, the equation y   =   0.17 x   +   124.40 . The yellowness index is divided into three levels: 70–80, 80–90, and 90–100. The yellow hue of samples is light between 70–80, intense between 80–90, and deep between 90–100.

1. Introduction

Diamond, a precious gemstone, is known as the “King of Gems.” Its primary component is carbon, reaching 99.95% by mass, with trace elements, such as nitrogen, boron, hydrogen, and silicon [1]. Its unique physical and chemical properties have led to its significant application in a variety of fields, including jewelry, materials, optics, and even medicine, attracting widespread attention and research.
Diamonds can be divided into two categories: natural and lab-grown. Natural diamonds are single crystals formed naturally from carbon under extreme high temperature and pressure deep within the Earth. Lab-grown diamonds, also known as synthetic diamonds, are grown in a laboratory through artificial means [1].
The most common trace element in diamonds is nitrogen (N), which enters the crystal lattice by replacing carbon (C) in an isomorphic form. The content and presence of N atoms have a significant impact on the properties of diamonds. It is also the basis for the classification of diamonds. Based on the different forms and characteristics of N atoms present in the crystal lattice of diamonds, diamonds can be classified into the following types [1].
Fancy color lab-grown diamonds primarily include yellow series (including brown, brownish yellow, yellow, and orange yellow), blue, red series (including pinkish purple, pink, orange-pink, and red), and green. Their color formation is like that of natural diamonds [1]. Yellow series lab-grown diamonds are primarily due to the artificial addition of nitrogen during growth, while some brown diamonds are related to plastic deformation within the crystal [2,3]. Blue diamonds are the result of artificial boron addition [4,5]. Red series diamonds are attributed to post-growth irradiation annealing [6,7]. Green diamonds are also derived from post-growth irradiation and are rarely attributed to the activation of nickel in the iron-nickel catalyst during high-temperature and high-pressure treatment, resulting in a green appearance [8,9].
Currently, gem-quality lab-grown diamonds are primarily produced using two methods: the high-temperature high-pressure (HTHP) method and the chemical vapor deposition (CVD) method. The BARS press, a low-cost and compact method, is often used during the HTHP treatment. The pressure within the synthetic chamber of the device (approximately 2.5 cm thick) is obtained through the combined application of pressure from a continuous carbon steel anvil. The inner chamber is equipped with six anvil heads, positioned on the faces of a cube surrounding the synthetic chamber; the outer chamber is equipped with eight anvil heads, positioned on the faces of an octahedron surrounding the inner chamber. The entire array of multi-anvil components is placed within two steel-cast hemispheres (these two-hinged hemispheres are referred to as “separators” and serve as passageways for the anvil and synthetic chamber), connected by two large steel clamps. The “BARS” device utilizes graphite tubes to heat the synthetic chamber. This improved equipment features a longer service life, higher productivity, simpler operation, easier maintenance, and safer operation, but it can only produce one diamond at a time [1]. Chemical vapor deposition (CVD) primarily involves growing diamonds on silicon or single-crystal diamond substrates under low pressure [1].
Research on lab-grown diamonds primarily focuses on spectroscopic and defect characteristics. Qi Lijian [10] noted that Raman spectroscopy testing of Australian pink diamonds and HTHP-treated blue diamonds revealed peaks at 2087 cm−1 (D1) and 795 cm−1 (D2). The ratio of their relative intensities to the intensity of the diamond’s intrinsic peaks can be used to determine the diamond’s internal lattice structure. However, the fluorescence peaks of HTHP-treated yellowish-green diamonds are too strong, significantly interfering with and masking the characteristic Raman peaks of D1 and D2. Mitsuhashi M. [11] believes that the full width at half maximum (FWHM) of a diamond’s Raman spectrum can be used to indicate the relative density of dislocations. Comparing the FWHM of Raman peaks in diamonds with different dislocation densities revealed that the FWHM of the Raman peaks increases with increasing dislocation density.
Wotherspoon A [12] and Dong Linling [13] pointed out that photoluminescence spectroscopy can be used to detect NV concentrations of 10 ppb or less in diamonds, and determine whether the diamond is natural or lab-grown, or what type of treatment it has undergone. Christopher M. Breeding [14] believes that PL photoluminescence analysis performed in liquid nitrogen can detect diamond defects as low as a few parts per billion (ppb). For isolated nitrogen (C aggregate) diamonds, the PL spectra show distinct peaks at 575 nm and 637 nm, characteristic of NV series defects, and sometimes also at 986 nm, characteristic of H defects. In the 480 nm band, peaks at 799 nm and 883–885 nm also appear, often associated with the color origin of orange diamonds. Xue Yuan [15] believes that the peak at 572 nm is intrinsic to diamond, and the characteristic peak of the NV defect at 637 nm is more intense than the characteristic peak of the NV0 defect at 575 nm. Characteristic peaks at 658 and 548 nm from NiV and Ni-N complexes may also be present, due to the use of an iron-nickel catalyst in the synthesis process of lab-grown diamonds.
Zhu Wenfang [16] noted that the peak at 270 nm in the UV-visible spectrum plays a key role in various types of diamonds, serving as supplementary evidence for the presence of diamond defects. Furthermore, Jones R. et al. [17] suggest that when the nitrogen content in diamond is below a few ppm, the peak at 270 nm is very sensitive to minute changes in nitrogen impurity levels, allowing nitrogen content to be calculated based on this peak.
Hainschwang T. [18] believes that wavelengths 1130 and 1344 cm−1 are the most prominent characteristics of isolated nitrogen (C aggregate) diamonds, typically type Ib. The ‘Y’ defect, possibly related to hydrogen, may also be present. The “amber center” defect [19] can be used to characterize plastic deformation in brownish-yellow type Ib diamonds. Xue Yuan [15] points out that nitrogen can change its form, transforming the type of diamond from type Ib to type Ib + IaA under high-temperature and high-pressure environments. Yan Bingmin [20] also points out that H element may also be present in lab-grown diamonds, and that the infrared absorption peaks of H at different locations can be used to distinguish lab-grown diamonds from natural diamonds.
Color is a crucial indicator of the optical properties of lab-grown diamonds, related to numerous defects. Yellow lab-grown diamonds are primarily associated with NV series defects [21]. The more significant NV defects are typical point defects in diamonds and are divided into the NV defect with a zero-phonon line at 637 nm and the NV0 defect with a zero-phonon line at 575 nm. Additionally, the N3 defect, the characteristic peak at 415.2 nm, and the H3 defect, the characteristic peak at 503.2 nm, can also cause diamonds to appear yellow.
In summary, research on lab-grown diamonds has primarily focused on spectroscopic and defect characteristics presently, while chromaticity studies are limited. Therefore, photoluminescence, infrared, Raman spectra, and colorimetry are used to explore the relationship between spectroscopic characteristics and color in this paper, also discussing the color classification of yellow lab-grown diamonds. Quantitatively expressing the color of yellow lab-grown diamonds based on hue angle and yellowness index, combined with nitrogen content and the concentration ratio of NV defect in NV color centers, provides a theoretical basis for color classification of yellow lab-grown diamonds and makes a more objective evaluation from a new perspective.

2. Materials and Methods

2.1. Materials

In this study, eight naked yellow lab-grown diamonds (numbers Y1–Y8) were selected as samples with varying yellow shades (Figure 1). All samples were purchased from Shenzhen LUCINU Jewellery Co., Ltd. (Shenzhen, China).

2.2. Methods

Photoluminescence spectra testing is conducted by JASCO NRS7500 micro laser Raman spectrometer, made in Japan. Test conditions: liquid nitrogen environment, single point, laser source 532 nm, and wavelength range 560–800 nm.
Colorimetric characteristics are tested by the FUV-007 UV-Vis-NIR spectrometer from Shenzhen Fable Company. Use the reflection method, with a wavelength range of 220–1000 nm, a light source D65, an observer angle of 10°, an integration time of 80 ms, and a scanning time of 10.
Infrared spectra testing is conducted using the TENSOR27 Fourier Transform Infrared Spectrometer from Bruker, made in Germany. Use the reflection method, with the wave-number range of 400–4000 cm−1, a resolution of 4 cm−1, and a scanning time of 16 s.
Raman spectroscopy testing is performed by the Renishaw inVia microscope Raman spectrometer. The Raman shift range was 100–2000 cm−1, with a laser source of 785 nm, an exposure time of 10 s, and the laser power of 20 mW.

3. Results

3.1. Gemological and Defect Characteristics

These samples are yellow lab-grown diamonds with adamantine luster, isotropic body, refractive index 2.417, dispersion value 0.044, no multi-color, fluorescence ranging from weak to Intense, and relative density 3.52 g/cm3.
Photoluminescence spectroscopy can be used to detect defects within the diamond lattice and indicate their type and state. In the spectra (Figure 2), the peak at 572 nm is an intrinsic diamond peak, while the peak at 612 nm is due to absorption of orange-yellow light in the visible light range [22]. The peak at 637 nm is characteristic of the NV defect [22], with the peak intensity in samples Y7 and Y8 being much greater than that in the other samples. Meanwhile, sample Y7 shows a 659 nm peak, an impurity peak [15] caused by residual iron-nickel catalyst within the crystal lattice after high-temperature and high-pressure synthesis. The peak at 575 nm, the characteristic of the standard NV0 defect, also appears in sample Y7. Other samples exhibit this peak in the 574–578 nm range. The shift relative to the standard peak of defect at 575 nm is different between samples, indicating a redshift of the peak. Furthermore, the absence of the 737 nm peak associated with the [Si-V] defect suggests that the samples were synthesized directly through high-temperature and high-pressure treatment, rather than lab-grown diamonds produced by the CVD method treated with high-temperature and high-pressure treatment.

3.2. Colorimetric Characteristics

3.2.1. Colorimetric Parameters

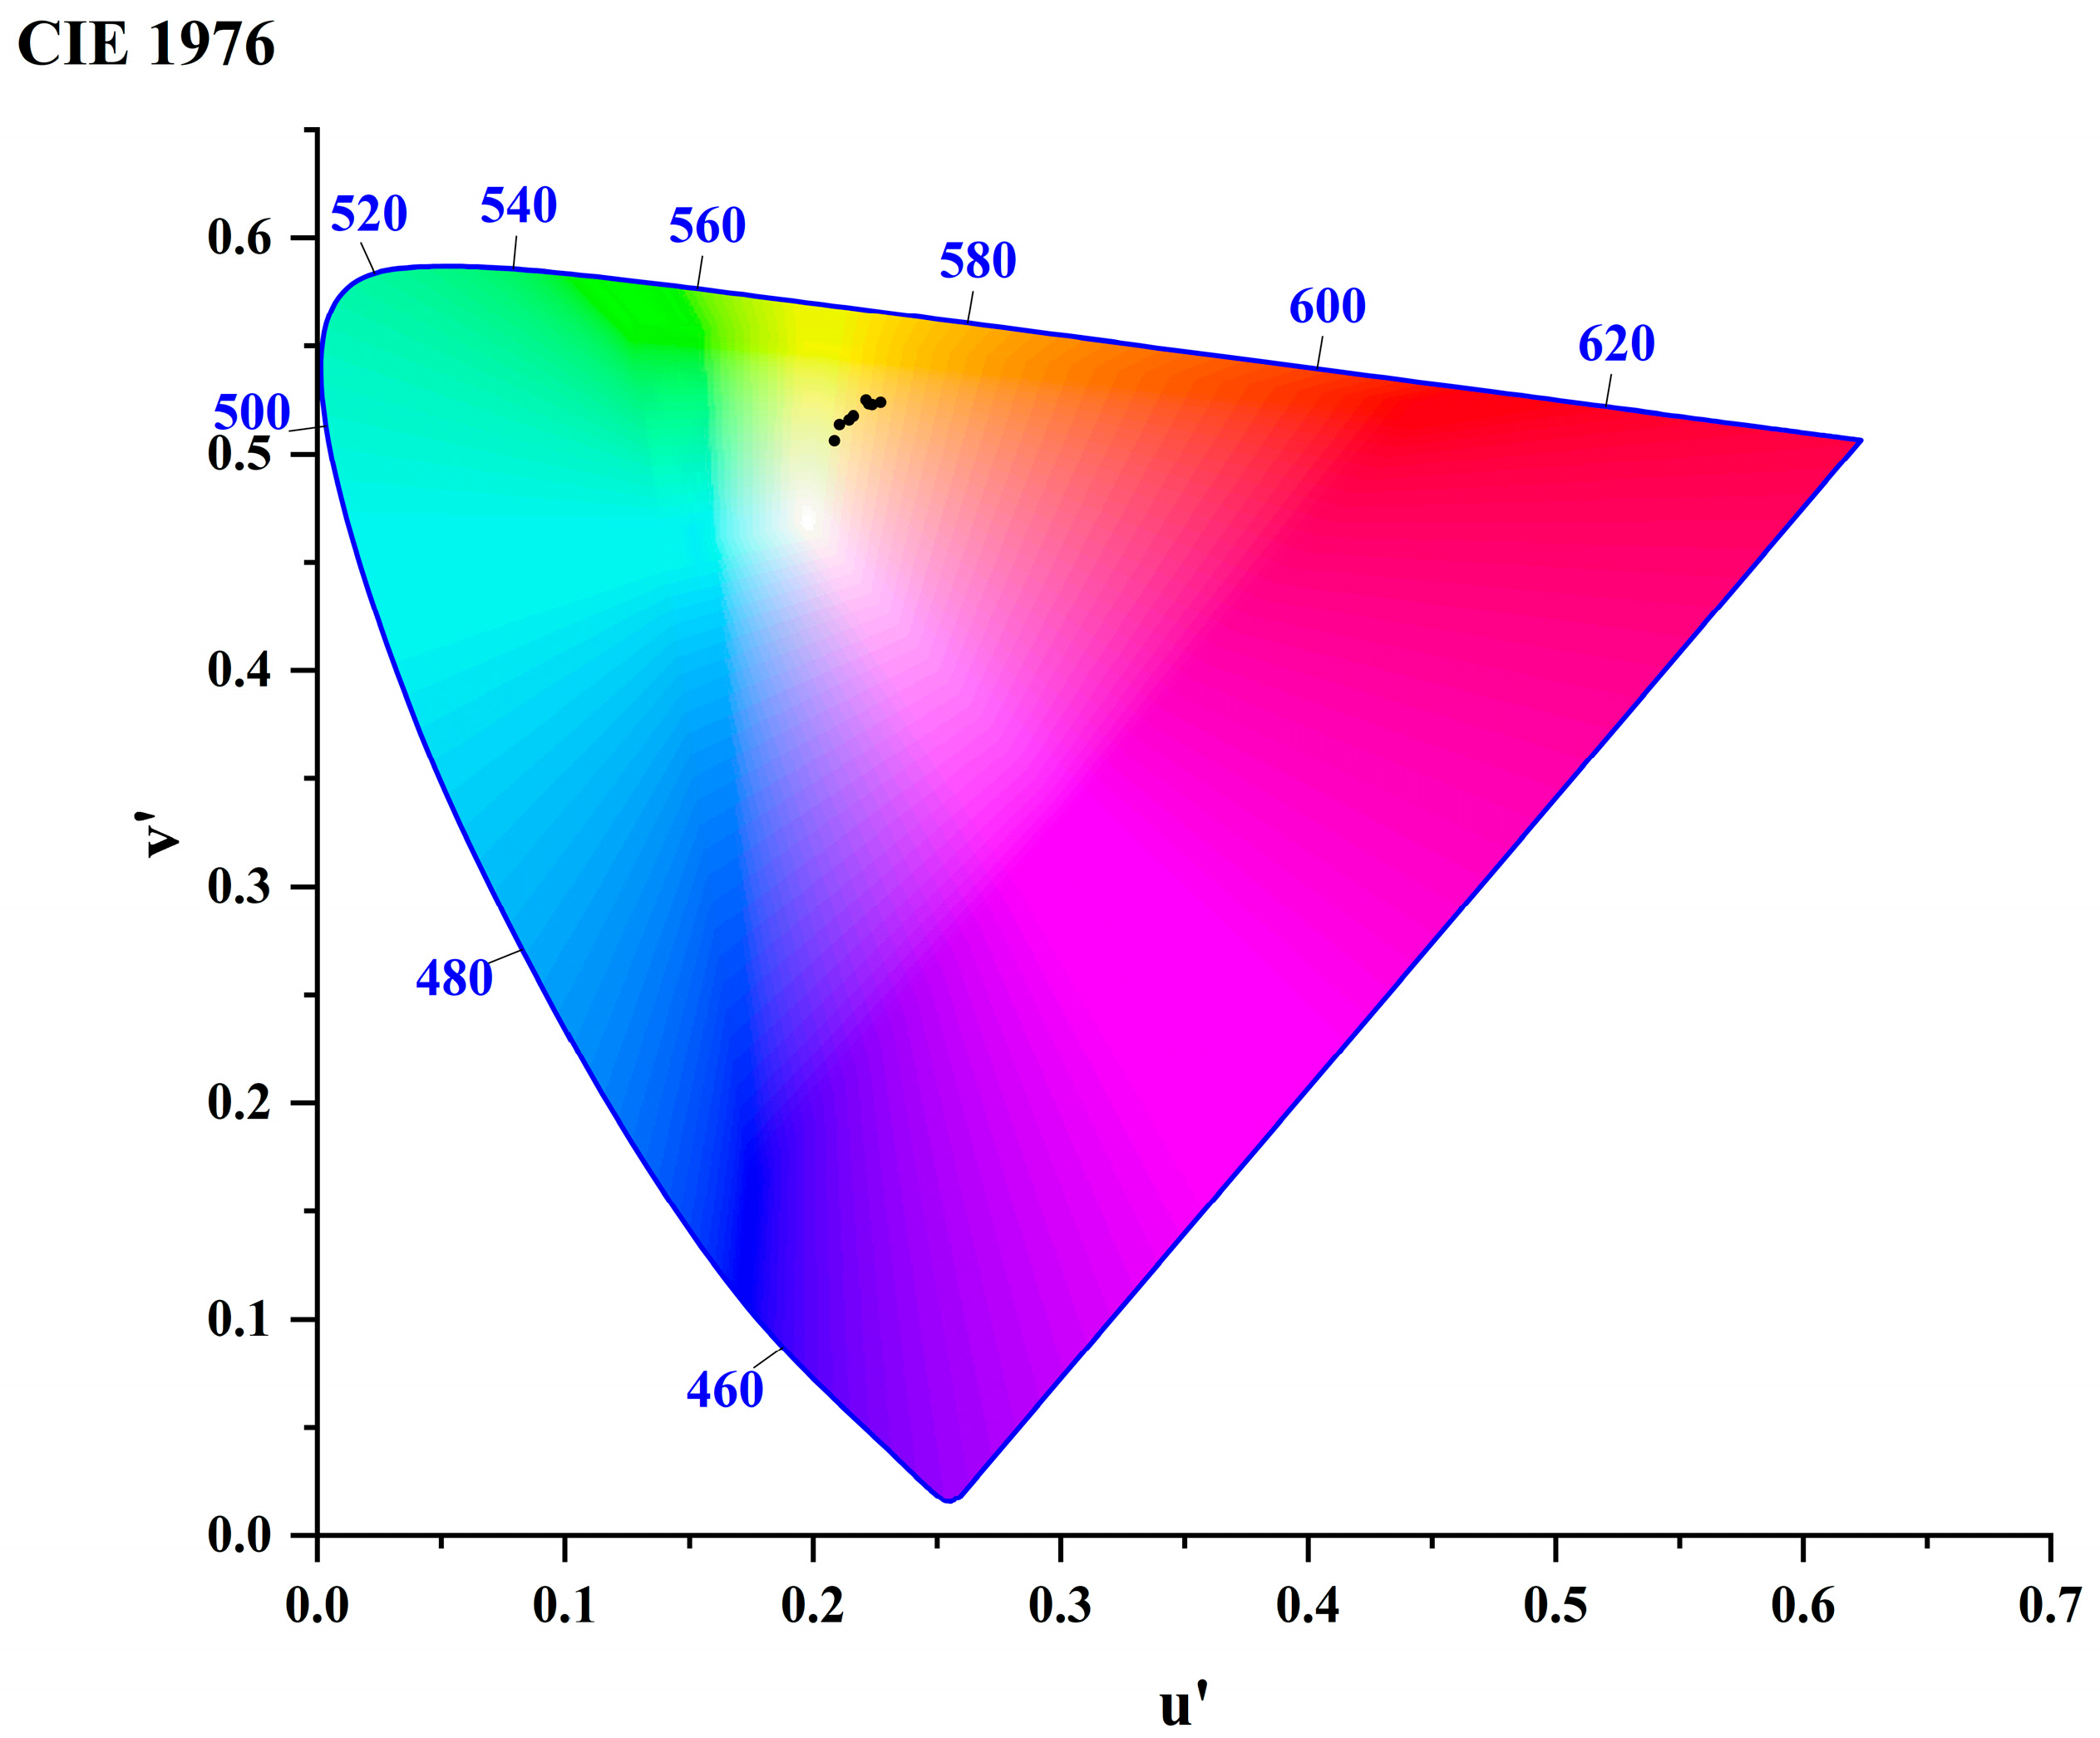
The points in the CIE chromaticity diagram of samples (Figure 3) are all clustered in the range of 570–580 nm, which corresponds to the yellow color in the visible spectra, consistent with the yellow tones presented by the samples. Samples with varying yellow shades can be seen from the figure, while samples Y1–Y4 show the light color, and samples Y5–Y8 show the deep color.
According to CIELAB color space theory [23,24], L* represents lightness, indicating black and white; a* and b* represent chromaticity, indicating different hue directions. a* represents red and green, +a* represents red, and −a* represents green; b* represents yellow and blue, +b* represents yellow, and −b* represents blue. Therefore, L*, a*, b*, and their positive and negative signs can be used to represent the degree of black, white, red, green, yellow, and blue in the samples. The colorimetric parameters L*, a*, and b* of samples were measured using the UV-Vis-NIR spectrometer. The results show (Table 1) that the range of L* for the samples is 72.07–81.3, a* 3.78–10.12, and b* 37.04–56.25. The ranges are consistent with the yellow body color of the samples, also matching the color points in Figure 3 concentrated in the orange-yellow area.

3.2.2. Hue Angle h and Yellowness Index YI E313

Hue angle h is a commonly used colorimetric parameter and calculation method in colorimetry. It measures the overall color distribution and saturation of an image. By calculating the hue angle, the color characteristics of an object can be analyzed and compared, leading to a deeper understanding and application. The calculation formula is as follows:
h = arctan b * / a *
Substituting the a* and b* values from the colorimetric parameters into Equation (1) yields the hue angle h of samples.
YI E313 is the yellowness index [25] recommended by ASTM E313 (American Society for Testing and Materials), which is applicable to D65 and C standard light sources (also known as standard illuminants). The standard formula is as follows:
Y I   E 313 = 100 × 1.3013 X 1.1498 Z Y
Converting the L*, a*, and b* values into the corresponding X, Y, and Z values and substituting them into Equation (2) yields the yellowness index YI E313 of samples.
Through the calculation results between the yellowness index YI E313 and the hue angle h, it is not difficult to find that there is a roughly negative correlation between the two: the larger the hue angle, the smaller the yellowness index. The comparison of colorimetric parameters L*, a*, and b* values, hue angle h, and yellowness index YI E313 of samples is shown in Table 2.

3.3. Infrared Spectra Testing

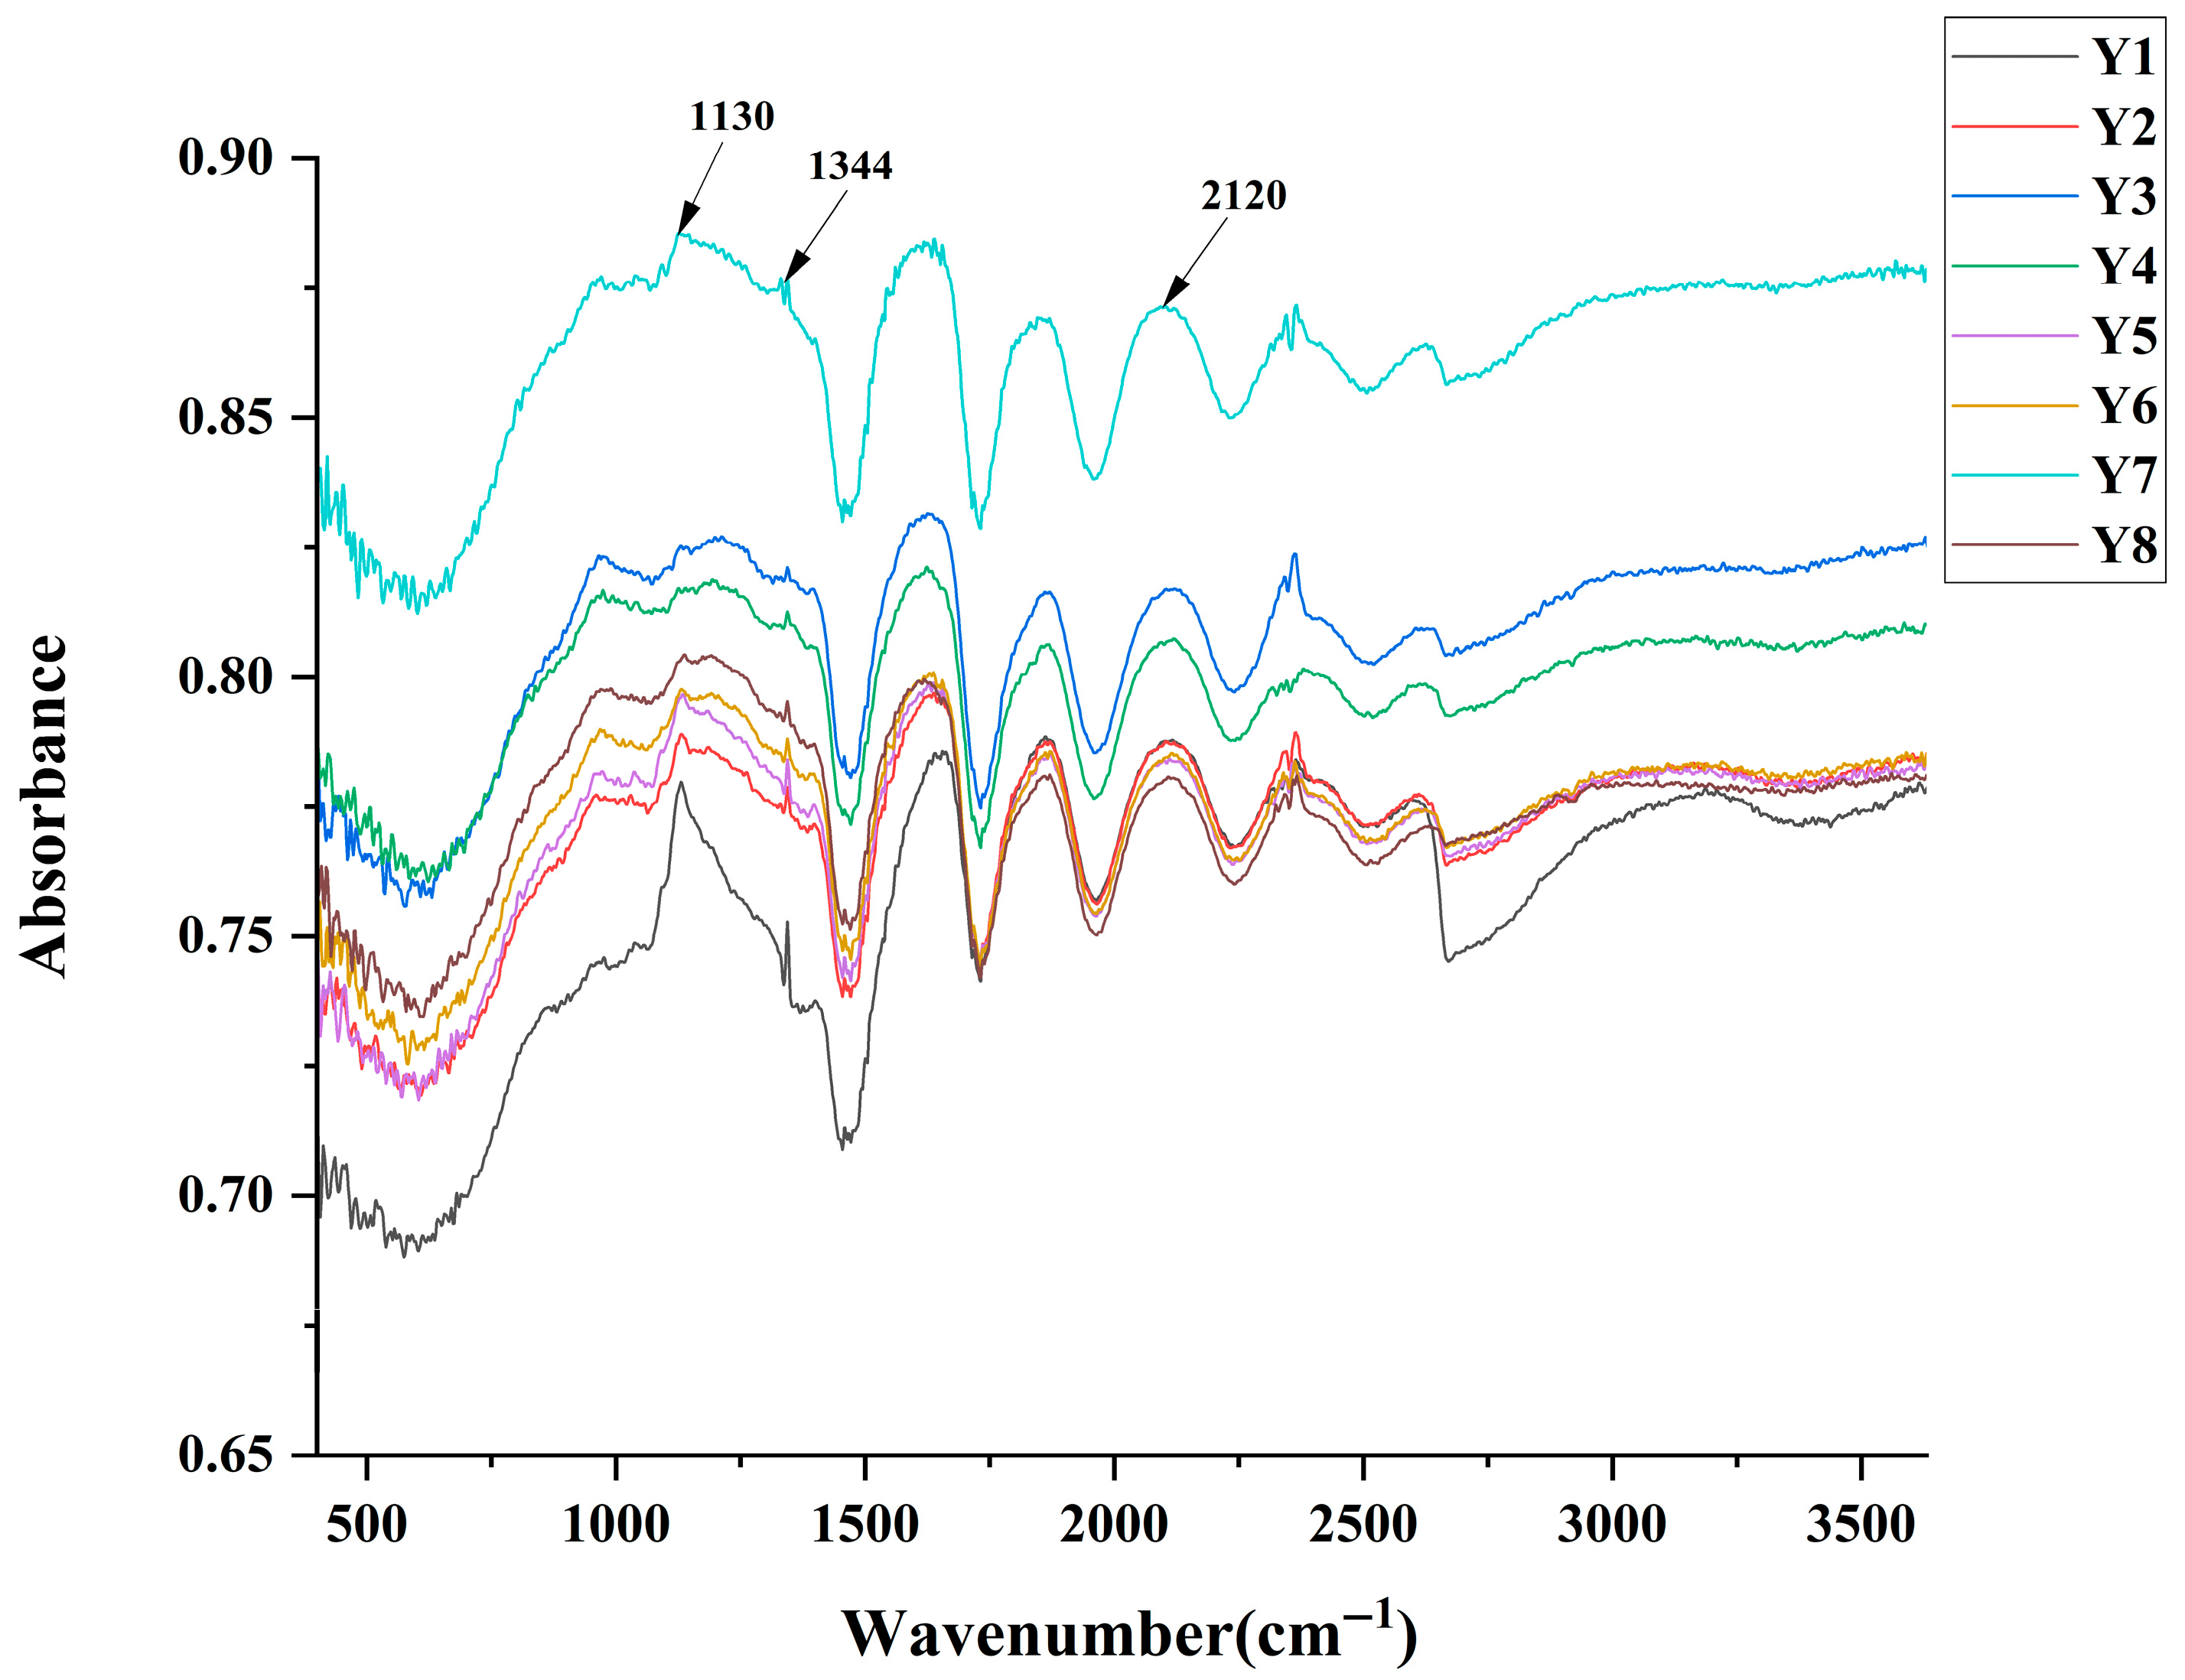
In the infrared spectra of samples (see Figure 4), the main absorption features detected in the 1000–1500 cm−1 region are the broad absorption peaks at 1130 cm−1 and the narrow absorption peaks at 1344 cm−1, which are characteristic peaks of isolated nitrogen (C aggregate) diamonds and belong to type Ib diamonds. The main location of the absorption broad peak at 1130 cm−1 in type Ib diamonds is located at the 1127–1130 cm−1 region, and most peaks are at 1130 (±0.5) cm−1 [22]. The peak at 2120 cm−1 is the carbon-nitrogen triple bond peak, which can also be used for baseline correction in the calculation of nitrogen content [26]. No related absorption peaks of hydrogen were detected in the 3000–3500 cm−1 region, indicating the absence of related defects of hydrogen in the samples.
There is one more electron in an isolated nitrogen atom than in a carbon atom. When it replaces carbon, this extra electron cannot be accommodated by a covalent bond and will either be excited to the conduction band or form a shallow donor level near the nitrogen atom, creating an electronic environment that places the diamond at a higher position on the Fermi level [27]. Especially in high-temperature environments (such as HTHP annealing or post-irradiation annealing), an isolated nitrogen atom can attract and capture a vacancy, forming NV color centers, thus generating NV0 and NV defects. At the same time, the isolated nitrogen alters local lattice strain and electronic structure, creating conditions for the introduction of other impurities or defects. For example, in HTHP lab-grown diamonds, metal impurities (such as Ni) in the iron-nickel catalyst used during the synthesis process can easily combine with isolated nitrogen, affecting the purity of diamonds [28].

3.4. Raman Spectra Testing

The Raman spectra (Figure 5) show a peak at 1332 cm−1, the primary carbon peak and an intrinsic peak of diamonds, as well as peaks at 972, 2455, and 1418 cm−1 are also present. The peak at 972 cm−1 is due to the symmetric stretching vibration of the C-N bond [29]; the peak at 2455 cm−1 is due to the symmetric stretching vibration of C≡N [29]; and the peak at 1418 cm−1 is the ‘D’ peak in graphite, indicating that samples were derived from graphite under the high temperature and high pressure [30], consistent with the results in the photoluminescence spectra. Furthermore, the presence of nitrogen as an impurity replaces a carbon atom in the diamond lattice, and peaks at 1130 and 1344 cm−1 in the infrared spectra are a great demonstration.

4. Discussion

4.1. Yellowness Index YI E313 and Nitrogen Content NC Discussion

Boyd, Kiwi [31,32,33] et al. calculated the nitrogen content based on the infrared spectra of different types of diamonds, including A aggregate (diamond composed of two adjacent substituted nitrogen atoms (N-N)), B aggregate (diamond composed of four adjacent substituted nitrogen atoms with one vacancy (4N + V)), and C aggregate (diamond composed of a single substituted nitrogen atom (N)).
N A   ( p p m ) = 16.5   ±   1   ×   α A
N B   ( p p m ) = 79.4   ±   1   ×   α B
  N C   ( p p m ) = 25.0   ±   2   ×   α C
Among them, N A , N B , and N C represent the nitrogen content absorbed by diamonds with different color aggregates, while α A , α B ,   and   α C represent the absorption coefficients of diamonds at 1282 cm−1, 1175 cm−1, and 1130 cm−1.
Since the samples used in this experiment are isolated nitrogen (C aggregate) diamonds, Equation (5) is used to calculate the nitrogen content. The absorption coefficient αC in Equation (5) can be solved by following Equation (6):
  α C   = A   /   d
In this formula, ‘A’ is the absorption rate of samples, and ‘d’ is the thickness of samples.
The baseline of the infrared spectra of samples in this article is uneven, with a strong peak at 1130 cm−1 and a relatively weak peak at 1344 cm−1. Therefore, it is necessary to use the modified formula [26] to calculate the nitrogen content values of isolated nitrogen (C aggregate) diamonds:
  N C   ( p p m )   =   α 1130   cm - 1 / α 2120   cm - 1   ×   5.5   ×   25
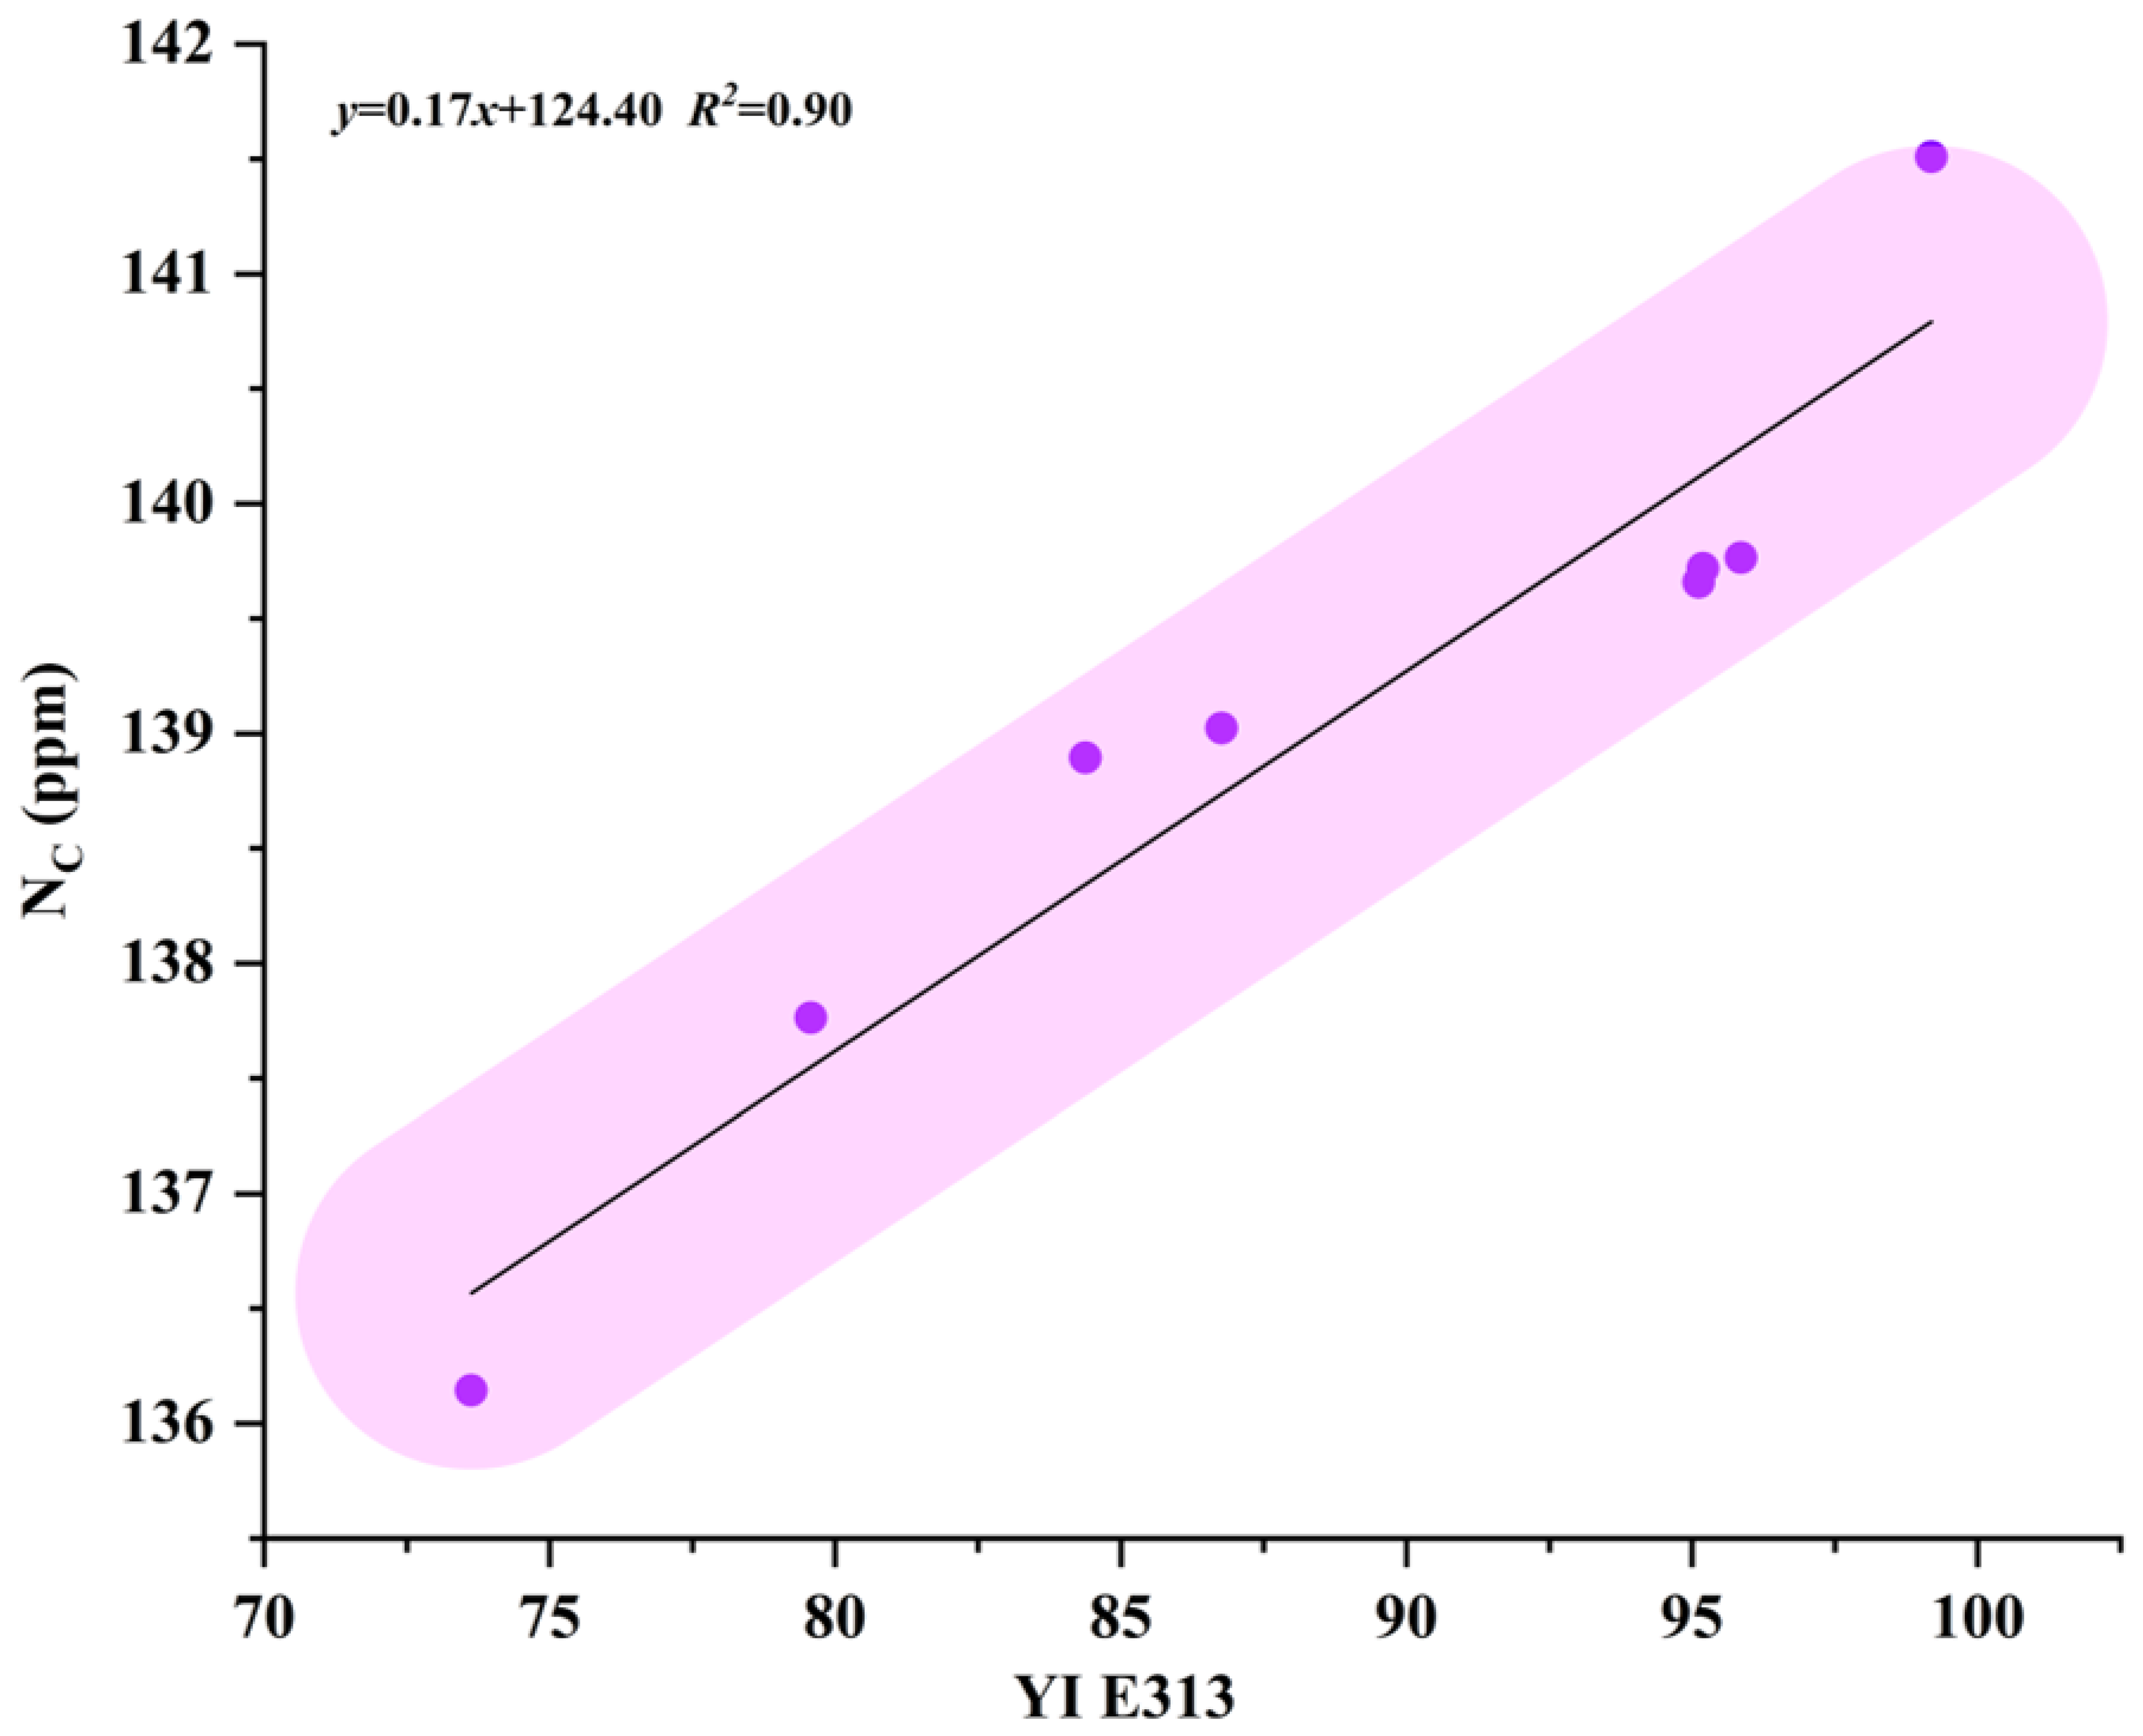
Substituting the calculated results into Equation (7), the nitrogen content NC of the samples was calculated. It is clear to see from the calculation results that the nitrogen content of eight yellow lab-grown diamond samples is all on the high side, with the lowest at 136 ppm, the highest at 141 ppm, and the average at 139 ppm, with little difference. In addition, the yellowness index of the samples is compared with the corresponding nitrogen content (NC; Table 3). The results show (Figure 6) that the nitrogen content of samples increases with the increase of the yellowness index, and there is a positive linear correlation between them, with the equation y   =   0.17 x   +   124.40 . The error of slope is ±0.02, and the error of intercept is ±1.99.

4.2. Yellowness Index YI E313 and FWHM Discussion

During the production process of lab-grown diamonds, iron and nickel catalysts are artificially added, which can affect the internal structure and stress of the diamond crystal, leading to deterioration in crystal quality. Analysis of the diamond Raman peak position and full width at half maximum (FWHM) can be used to determine the crystallinity and quality of the crystal. The larger the FWHM, the lower the crystallinity and the crystal quality [34]. The calculated FWHM of the intrinsic peaks in Raman spectra and the nitrogen content are compared (Table 4). The results show that there is a relatively large FWHM in samples Y1–Y4, indicating lower crystallinity, poorer crystal quality, relatively lower nitrogen content, lower yellowness index, and light color. A relatively smaller FWHM in samples Y5–Y8 indicates higher crystallinity, better crystal quality, comparatively higher nitrogen content, higher yellowness index, and deep color. However, the correlation between FWHM and yellowness index is not ideal, so the FWHM of the intrinsic peaks in Raman spectra can only roughly reflect the trend of the color shades.

4.3. Yellowness Index YI E313 and Concentration Ratio R Discussion

The color of yellow lab-grown diamonds is primarily attributed to NV series defects, with NV defects as a key factor. Its concentration ratio in NV color centers not only alters the surface color of diamonds but also enhances their economic and aesthetic value. It also provides important insights into non-intrinsic physical phenomena in diamond, serving as a source of inspiration for functionalizing diamond materials and developing new applications [35]. Calculations of the intensities of NV0 and NV peaks, concentration ratio of NV defect in NV color centers, nitrogen content, and yellowness index (Table 5) show that, with the exception of sample Y1, the concentration ratio of NV defect exceeds 50% in all other samples, even over 80% in sample Y8, demonstrating its crucial role in the color of diamonds. The concentration ratio of NV defect in NV color centers is positively correlated with the nitrogen content and yellowness index, increasing with the increase of nitrogen content and yellowness index, resulting in a deep color. Therefore, it can reflect the nitrogen content and yellowness index, indicating the color shades of yellow lab-grown diamonds.

4.4. Color Classification

Based on the results of the relationship between spectroscopic characteristics and color, the infrared, Raman, and photoluminescence spectra of samples can all quantitatively indicate the color of yellow lab-grown diamonds. The nitrogen content in the infrared spectra and the concentration ratio of NV defect in NV color centers in the photoluminescence spectra both show a stable and positive correlation with color, and a positive linear correlation with nitrogen content, particularly, the equation y   =   0.17 x   +   124.40 . However, the correlation between the full width at half maximum of the intrinsic peaks of diamonds in Raman spectra and color is unreliable.
Therefore, based on the principle of selecting parameters that are closely related and relatively consistent with distributions for color classification of samples, it is more appropriate to let hue angle and yellowness index as the basis, combined with nitrogen content and the concentration ratio of NV defect in NV color centers for color classification of yellow lab-grown diamonds. Calculation results show that the yellowness index of samples ranges from 70 to 100 and can be divided into three grades: 70–80, 80–90, and 90–100. The hue angle ranges from 1.39 to 1.48, correspondingly divided into three intervals: 1.47–1.48, 1.45–1.46, and 1.39–1.44. Nitrogen content ranges from 136 to 141, correspondingly divided into intervals: 136–138, 138–139, and 139–141. Concentration ratio of NV defect in NV color centers ranges from 0.31 to 0.80, correspondingly divided into 0.31–0.51, 0.52–0.67, and 0.68–0.80. Therefore, yellow lab-grown diamonds can be classified into three grades based on the yellowness index (YI E313), hue angle (h), nitrogen content (NC), and concentration ratio of NV defect in NV color centers (R). The final summary of color classification is shown in Table 6.

5. Conclusions

This article quantitatively represents the color of yellow HTHP lab-grown diamonds through the relationship established by the hue angle h, yellowness index YI E313, nitrogen content NC, and the concentration ratio of NV defect in NV color centers R, which is significant to the color classification for lab-grown diamonds and provides a more objective evaluation from a new perspective.
Photoluminescence spectroscopy reveals the presence of NV0 and NV defects, but the characteristic peak of [Si-V] defect at 737 nm is absent. This indicates that the samples belong to isolated nitrogen (C aggregate) diamonds synthesized from graphite by high-temperature, high-pressure, and irradiation treatments to color modification. Furthermore, the concentration ratio of NV defect in NV color centers positively correlates with nitrogen content and yellowness index.
The yellowness index of lab-grown diamonds is negatively correlated with the hue angle, while it is positively linearly correlated with nitrogen content, with the equation y   =   0.17 x   +   124.40 .
It is appropriate to the color classification of yellow lab-grown diamonds based on the hue angle and yellowness index, combined with nitrogen content and the concentration ratio of NV defect in NV color centers. The yellowness index is divided into three levels: 70–80, 80–90, and 90–100, with the corresponding hue angle ranges 1.47–1.48, 1.45–1.46, and 1.39–1.44, the nitrogen content ranges 136–138, 138–139, and 139–141, the concentration ratios 0.31–0.51, 0.52–0.67, and 0.68–0.80. The yellow hue of samples is light between 70–80, intense between 80–90, and deep between 90–100.

Author Contributions

Conceptualization, Z.P. and E.Z.; methodology, Z.P.; investigation, Z.P., Y.S., M.X. and Z.Z.; resources, E.Z.; data curation, Z.P.; writing—original draft preparation, Z.P., S.Y., B.M. and E.Z.; writing—review and editing, Z.P., E.Z. and S.Y.; supervision, S.Y. and E.Z.; funding acquisition, B.M., S.Y. and E.Z. All authors have read and agreed to the published version of the manuscript.

Funding

This research was supported by the National Natural Science Foundation of China (Grant No. 52262018) and the Scientific Research Fund Project of Yunnan Provincial Department of Education (Grant No. 2025J0078).

Data Availability Statement

All data are included in the article; further inquiries can be made to the respective authors.

Acknowledgments

We sincerely thank our teachers for their guidance and revision of this paper, and our students for their help with the experiments.

Conflicts of Interest

The authors declare no conflicts of interest.

References

  1. Zhang, B.L. Systematic Gemology, 2nd ed.; Geological Publishing House: Beijing, China, 2006; pp. 131–143. [Google Scholar]
  2. Meng, Y.F.; Peng, M.S.; Chen, W.X. Spectral Study of Transition Metal Ions in Colored Diamond. Spectrosc. Spectr. Anal. 2004, 24, 769–774. [Google Scholar]
  3. Green, B.L.; Collins, A.T.; Breeding, C.M. Diamond Spectroscopy, defect centers, color, and treatments. Rev. Mineral. Geochem. 2022, 88, 637–888. [Google Scholar] [CrossRef]
  4. Fu, S.Q.; Zhang, C.H.; An, Q.Y. Research on the Chromogenic Mechanism of Natural, Synthetic, and Processed Blue Diamonds. Shandong Ind. Technol. 2018, 19, 11–12. [Google Scholar]
  5. Smith, E.M.; Shirey, S.B.; Richardson, S.H.; Nestola, F.; Bullock, E.S.; Wang, J.; Wang, W. Blue boron-bearing diamonds from Earth’s lower mantle. Nature 2018, 560, 84–87. [Google Scholar] [CrossRef]
  6. Mei, Y.L.; Elina, M.; Matthew, F.H.; Sally, E.M.; Christopher, M.B. Spectroscopic characterization of rare natural pink diamonds with yellow color zones. Diam. Relat. Mater. 2024, 148, 111428. [Google Scholar] [CrossRef]
  7. Taryn, L.M.; Sally, E.M.; Christopher, M.B.; Daniel, J.; Elina, M. Spectroscopy of green fluorescence rims on rough pink diamonds from Argyle mine. Diam. Relat. Mater. 2025, 153, 112079. [Google Scholar] [CrossRef]
  8. Zhu, W.F.; Zhu, X.X.; Zhao, X.Y.; Ye, H. Discussion on the Identification of an Irradiated Green type IIa Diamond. China Gems Jades. 2020, 158, 19–22. [Google Scholar]
  9. Qi, L.J.; Zhou, Z.Y.; Zhao, B.W.; Zeng, C.G.; Xiang, C.J. Difference of lattice radiation damage and spectroscopic characterization in natural and artificial radiation green diamonds. J. Gems Gemol. 2022, 24, 1–10. [Google Scholar]
  10. Qi, L.J.; Yuan, X.Q.; Tian, L.G.; Yuan, Z.Z. Evolution and colouration of lattice defects in diamonds at high pressure and high temperature. J. Gems Gemol. 2001, 3, 1–7. [Google Scholar]
  11. Mitsuhashi, M.; Karasawa, S.; Ohya, S.; Togashi, F. Dislocation of epitaxial CVD diamond and the characterization by Raman spectroscopy. Appl. Surf. Sci. 1992, 60–61, 565–572. [Google Scholar] [CrossRef]
  12. Wotherspoon, A.; Steeds, J.W.; Catmull, B.; Butler, J. Photoluminescence and positron annihilation measurements of nitrogen doped CVD diamond. Diam. Relat. Mater. 2003, 12, 652–657. [Google Scholar] [CrossRef]
  13. Dong, L.L.; Gao, X.X.; Liu, Y.M.; Lu, R. The anisotropy of photoluminescence of gemstones and materials: In Cr-bearing ruby and chrysoberyl. J. Raman Spectrosc. 2024, 56, 499–511. [Google Scholar] [CrossRef]
  14. Christopher, M.; Sally, E.M.; James, E.S. Naturally Colored Yellow and Orange Gem Diamonds: The Nitrogen Factor. J. Gems Gemol. 2022, 56, 194–219. [Google Scholar]
  15. Xue, Y.; He, X.M.; Xie, T.Q. Exploration of the Color Formation and Color Modification Mechanism of High temperature and high pressure Synthesis of Yellow Diamond. Acta Petrol. Mineral. 2014, 33, 120–130. [Google Scholar]
  16. Zhu, W.F.; Ding, T.; Li, H.H.; Zhu, X.X. Identification characteristic of HPHT-Treated yellow type Ib CVD synthetic diamond. J. Gems Gemol. 2021, 23, 1–6. [Google Scholar]
  17. Jones, R.; Goss, J.P.; Briddon, P.R. Acceptor level of nitrogen in diamond and the 270-nm absorption band. Philos. Mag. B 2009, 80, 033205. [Google Scholar] [CrossRef]
  18. Hainschwang, T.; Fritsch, E.; Notari, F.; Rondeau, B. A new defect center in type Ib diamond inducing one phonon infrared absorption: The Y center. Diam. Relat. Mater. 2012, 21, 120–126. [Google Scholar] [CrossRef]
  19. Massi, L.; Fritsch, E.; Collins, A.T.; Hainschwang, T.; Notari, F. The “amber centres” and their relation to the brown colour. Diam. Relat. Mater. 2005, 14, 1623–1629. [Google Scholar] [CrossRef]
  20. Yan, B.-M.; Jia, X.-P.; Qin, J.-M.; Sun, S.-S.; Zhou, Z.-X.; Fang, C.; Ma, H.-A. Characterization of typical infrared characteristic peaks of hydrogen in nitrogen hydrogen co doped diamond. Acta Phys. Sin. 2014, 63, 048101. [Google Scholar] [CrossRef]
  21. Chen, F. Color centers in minerals: Taking diamond nitrogen centers as an example. Acta Mineral. Sin. 2021, 41, 109–119. [Google Scholar]
  22. Song, Z.H.; Tang, P.; Zhu, W.F.; Gao, B.; Li, Y.J. Spectral characteristics of yellow diamonds synthesized under high pressure and high temperature and natural pure Ib type yellow diamonds. J. Gems Gemol. 2021, 23, 51–57. [Google Scholar]
  23. Li, M.M.; Teng, Y.J.; Tan, H.L.; Zu, E.D. Study on Fresh water Cultured White Pearls from Anhui Province Based on Chromaticity and Raman Spectra. Spectrosc. Spect. Anal. 2022, 42, 1504–1507. [Google Scholar]
  24. Lu, Z.Y.; He, X.M.; Lin, C.L.; Jin, X.Y.; Pan, Y.M. Identification of Beihong Agate and Nanhong Agate from China Based on Chromaticity and Raman Spectra. Spectrosc. Spect. Anal. 2019, 39, 2153–2159. [Google Scholar]
  25. ASTM E313-20; Standard Practice for Calculating Yellowness and Whiteness Indices from Instrumentally Measured Color Coordinates. ASTM International: West Conshohocken, PA, USA, 2020.
  26. Zhang, Y.F. Cultivation of High Nitrogen Content Gemstone Diamond. Ph.D. Thesis, Jilin University, Changchun, China, 2009. [Google Scholar]
  27. Kuganathan, N.; Chroneos, A.; Grimes, R.W. Vacancy defects in nitrogen doped diamond. Phys. B Condens. Matter 2023, 655, 414769. [Google Scholar] [CrossRef]
  28. Michael, N.R.; Jonathan, P.G.; Ben, L.G. Nitrogen in Diamond. Chem. Rev. 2020, 120, 5745–5794. [Google Scholar] [CrossRef]
  29. Panchakarla, L.S.; Subrahmanyam, K.S.; Saha, S.K. Synthesis, Structure and Properties of Boron and Nitrogen Doped Graphene. ACS Nano. 2009, 3, 4726–4730. [Google Scholar] [CrossRef]
  30. Liu, J.H.; Chen, M.H.; Wu, G.; Gong, N.N. Study on the evaluation of the crystal quality of diamonds. J. Synth. Cryst. 2014, 43, 559–564. [Google Scholar]
  31. Boyd, S.R.; Kiflawi, I.; Woods, G.S. The correlation between absorption and the A defect concentration in diamond. Philos. Mag. B 1994, 69, 1149. [Google Scholar] [CrossRef]
  32. Boyd, S.R.; Kiflawi, I.; Woods, G.S. Infrared absorption by the B aggregate in diamond. Philos. Mag. B 1995, 72, 351. [Google Scholar] [CrossRef]
  33. Kiflawi, I.; Mayer, A.E.; Spear, P.M.; VanWyk, J.A.; Woods, G.S. Infrared absorption by the single nitrogen and A defect centers in diamond. Philos. Mag. B 1994, 69, 1141. [Google Scholar] [CrossRef]
  34. Hu, M.H.; Bi, N.; Gong, C.S. Study on synthesis and Raman spectra of boron and nitrogen doped diamond single crystals. J. Synth. Cryst. 2016, 45, 1477–1481. [Google Scholar]
  35. Shen, X.T. Current status and prospect of defect in gemmology. J. Miner. Petrol. 2025, 45, 86–105. [Google Scholar]
Figure 1. Yellow lab-grown diamond samples.
Crystals 15 00942 g001
Figure 2. Photoluminescence spectra of samples, with the liquid nitrogen environment, single point, laser source 532 nm, and the wavelength range 560–800 nm.
Crystals 15 00942 g002
Figure 3. CIE chromaticity diagram of samples. The blue numbers in the diagram are the wavelength bands within the visible light spectrum, with each band corresponding to a specific color.
Crystals 15 00942 g003
Figure 4. Infrared spectra of samples, with the reflection method and the wave number range 400–4000 cm−1.
Crystals 15 00942 g004
Figure 5. Raman spectra of samples, with the laser source 785 nm and the Raman shift range 100–2000 cm−1.
Crystals 15 00942 g005
Figure 6. The correlation between yellowness index and nitrogen content values of samples. The purple dots represent the position of yellowness index and nitrogen content of samples on the coordinate axis, and the purple shadow represents the overall trend of the distribution of dots.
Crystals 15 00942 g006
Table 1. The type of diamonds.
TypeThe Form of N AtomsThe Characteristics of ColorNotes
Type I (Consist of N)Type IaType IaATwo N atomsColorless to YellowThe type of most natural diamonds
Type IaBThree to Nine N atoms
Type Ib One N atomColorless to Yellow/BrownThe type of most lab-grown diamonds
Type II(No N)Type IIa No N atom or w(N) < 0.001%Colorless to Brown/Pinkish RedBecause of the lattice dislocation of the C atom
Type IIb Litte BBlueCan be conductive
Table 2. Comparison of colorimetric parameters L*, a*, and b* values, hue angle h, and yellowness index YI E313 of samples.
Sample NumberL*a*b*hYI E313
Y172.303.7837.041.4773.63
Y281.304.2145.691.4879.57
Y373.975.3544.981.4584.38
Y474.245.7746.791.4586.76
Y573.797.7652.301.4295.12
Y679.187.4556.251.4495.19
Y772.077.8251.781.4295.86
Y874.6010.1254.501.3999.19
Table 3. Comparison of yellowness index YI E313 and nitrogen content NC of samples.
Sample NumberYI E313NC (ppm)
Y173.63136.14
Y279.57137.76
Y384.38138.89
Y486.76139.02
Y595.12139.66
Y695.19139.72
Y795.86139.77
Y899.19141.51
Table 4. Comparison of the full width at half maximum (FWHM) of the intrinsic peak of samples in Raman spectra with nitrogen content NC and yellowness index YI E313.
Sample NumberFWHMNC (ppm)YI E313
Y17.08136.1473.63
Y29.16137.7679.57
Y37.95138.8984.38
Y47.00139.0286.76
Y52.18139.6695.12
Y65.55139.7295.19
Y75.57139.7795.86
Y85.51141.5199.19
Table 5. The intensities of NV0 and NV peaks, concentration ratio of NV defect in NV color centers R, nitrogen content NC, and yellowness index YI E313.
Sample NumberNV0 Peak IntensityNV Peak IntensityRNC (ppm)YI E313
Y10.00340.00150.309136.1473.63
Y20.01200.01260.513137.7679.57
Y30.01500.01920.561138.8984.38
Y40.01860.03770.670139.0286.76
Y50.01530.03230.678139.6695.12
Y60.00960.03790.798139.7295.19
Y70.02320.08340.783139.7795.86
Y80.02100.08590.804141.5199.19
Table 6. Color classification of yellow lab-grown diamonds.
HuehYI E313NC (ppm)RSample Number
Light1.47–1.4870–80136–1380.31–0.51Y1–Y2
Intense1.45–1.4680–90138–1390.52–0.67Y3–Y4
Deep1.39–1.4490–100139–1410.68–0.80Y5–Y8
Disclaimer/Publisher’s Note: The statements, opinions and data contained in all publications are solely those of the individual author(s) and contributor(s) and not of MDPI and/or the editor(s). MDPI and/or the editor(s) disclaim responsibility for any injury to people or property resulting from any ideas, methods, instructions or products referred to in the content.