Article

Structural and Magnetic Properties of Sputtered Chromium-Doped Sb2Te3 Thin Films

1
Clarendon Laboratory, Department of Physics, University of Oxford, Oxford OX1 3PU, UK
2
Diamond Light Source, Harwell Science and Innovation Campus, Didcot OX11 0DE, UK
3
ISIS Neutron and Muon Source, Rutherford Appleton Laboratory, Harwell Science and Innovation Campus, Didcot OX11 0QX, UK
4
Advanced Light Source, Lawrence Berkeley National Laboratory, Berkeley, CA 94720, USA
5
Department of Physics, University of York, York YO10 5DD, UK
*
Author to whom correspondence should be addressed.
Crystals 2025, 15(10), 896; https://doi.org/10.3390/cryst15100896
Submission received: 24 September 2025 / Revised: 13 October 2025 / Accepted: 14 October 2025 / Published: 16 October 2025
(This article belongs to the Special Issue Advances in Thin-Film Materials and Their Applications)

Abstract

Magnetron sputtering offers a scalable route to magnetic topological insulators (MTIs) based on Cr-doped Sb2Te3. We combine a range of X-ray diffraction (XRD), reciprocal-space mapping (RSM), scanning transmission electron microscopy (STEM), scanning TEM-energy-dispersive X-ray spectroscopy (STEM-EDS), and X-ray absorption spectroscopy, and X-ray magnetic circular dichroism (XAS/XMCD) techniques to study the structure and magnetism of Cr-doped Sb2Te3 films. Symmetric θ -2 θ XRD and RSM establish a solubility window. Layered tetradymite order persists up to ∼10 at.-% Cr, while higher doping yields CrTe/Cr2Te3 secondary phases. STEM reveals nanocrystalline layered stacking at low Cr and loss of long-range layering at higher Cr concentrations, consistent with XRD/RSM. Magnetometry on a 6% film shows soft ferromagnetism at 5 K. XAS and XMCD at the Cr L 2 , 3 edges exhibits a depth dependence: total electron yield (TE; surface sensitive) shows both nominal Cr2+ and Cr3+, whereas fluorescence yield (FY; bulk sensitive) shows a much higher Cr2+ weight. Sum rules applied to TEY give m L = ( 0.20 ± 0.04 )   μ B /Cr, and m S = ( 1.6 ± 0.2 )   μ B /Cr, whereby we note that the applied maximum field (3 T) likely underestimates m S . These results define a practical growth window and outline key parameters for MTI films.

1. Introduction

Topological insulators (TIs) of the tetradymite family, such as (Bi,Sb)2(Se,Te)3, host spin-polarized surface states protected by time-reversal symmetry (TRS) [1,2]. Breaking TRS in TIs through transition-metal doping (e.g., Cr, V, or Mn) stabilizes ferromagnetism and enables the quantum anomalous Hall effect (QAHE) [3,4,5,6], which hosts dissipationless chiral edge transport and a rich set of magneto-electric responses [7,8]. These materials show a clear path from fundamental physics to devices, including prospects for precision quantum electrical metrology using QAHE platforms [9]. The same symmetry breaking underlies predicted and observed topological magneto-electric phenomena, such as quantized Faraday rotation and the giant Kerr response [10], the image–monopole effect near a magnetized TI surface [11], and topological magneto-electric effects in thin films [12]. TI interfaces have also been shown to provide efficient charge-to-spin conversion that connects magnetic TIs with modern spin-orbitronics [13]. While Cr- and V-doped Sb2Te3 have been established as prototypical magnetic topological insulators (MTIs) [14,15], the QAHE remains restricted to cryogenic temperatures (≲2 K), despite Curie temperatures T C exceeding 100 K [16,17]. This disparity is widely attributed to magnetic inhomogeneity and disorder, including clustering, phase segregation, and Dirac-mass disorder [17].
In Cr-doped Sb2Te3 grown using molecular beam epitaxy (MBE), the solubility limit of Cr is significantly enhanced compared to bulk crystals [18], enabling T C values up to ∼190 K [16,17,19,20]. Systematic studies combining magnetometry, magnetotransport, and X-ray spectroscopy have demonstrated substitutional incorporation of Cr on Sb sites, with antiparallel alignment of Te 5 p moments indicating carrier-mediated ferromagnetism [20]. Electrical gating experiments further confirm an RKKY-like coupling mechanism between Cr moments mediated by itinerant carriers [16]. Related MBE work on co-doping has focused on (V,Cr):Sb2Te3, where T C can be enhanced while preserving the layered host [21,22,23,24]. Nevertheless, at higher doping levels or in codoped systems, secondary phases such as Cr2Te3 can emerge, complicating efforts to optimize T C by alloying strategies [22].
Recent work has highlighted the sensitivity of MTI growth to the deposition technique. In sputter-deposited films, kinetic growth processes lead to nanocrystalline (nc) morphologies that can differ significantly from MBE-grown counterparts [25,26,27]. Our own sputtering studies on Mn-doped Bi2Te3 [28] and MnBi2Te4 [29] showed that while smoother morphologies and scalable growth are accessible, secondary phases and compositional inhomogeneity strongly influence the magnetic ground state. These findings motivate the systematic investigation of sputter-grown Cr-doped Sb2Te3, where nanocrystallinity and local disorder may alter magnetic exchange pathways and doping solubility relative to MBE films.
Here, we present a comprehensive structural and magnetic study of magnetron-sputtered Cr-doped Sb2Te3 thin films. By correlating X-ray diffraction, transmission electron microscopy, X-ray magnetic circular dichroism, and magnetometry, we establish the growth–structure–magnetism relationship in sputtered films. We find that while substitutional Cr incorporation is achieved at low doping, higher concentrations lead to disorder and the appearance of chromium telluride phases, similar to the observations in Cr-doped MBE films. These results place sputtered Cr:Sb2Te3 within the broader landscape of MTIs, bridging insights from epitaxial growth and scalable sputtering approaches, and highlighting both opportunities and challenges for integrating MTIs into future spintronic devices.

2. Experimental Methods

2.1. Thin Film Growth

Cr-doped Sb2Te3 films were grown on 10 × 10 mm2+ Al2O3(0001) substrates (430 μm thickness) using magnetron sputtering. The substrates were cleaned in acetone, isopropanol, and deionized water, and placed in a home-built sputter chamber with a base pressure of 2 × 10⁻⁸ mbar, and 2-inch targets of Sb2Te3 and Cr were used to co-sputter a thin film at a rate of ∼0.025 nm s−1 W−1, i.e., between 0.3 and 0.9 nm/s. This process consisted of the deposition of a thin nucleation layer of ∼1 nm at 175 °C followed by the main layer at 240 °C. The films were then allowed to cool in vacuum before a 3–4 nm Al capping layer was sputtered to prevent oxidation. The doping concentration was controlled by adjusting the ratios between Sb2Te3 and Cr targets, with a list of samples and their compositions, determined by energy-dispersive X-ray spectroscopy (EDS; XMaxn 80T, Oxford Instruments NanoAnalysis, High Wycombe, UK) using a scanning electron microscope (SEM; JEOL JSM-6610LV, JEOL Ltd., Tokyo, Japan), shown in Table 1.
As can be seen in Table 1, there is no simple relationship between the ratio of sputter powers and dopant concentrations. This can be attributed to particular ratios of elements encouraging certain growth modes, uneven distribution of the dopant (although minimized by measuring EDS across multiple sites), or variance in target preconditioning. Despite this variation, the result is a range of films of varying doping concentrations to test the impact of the dopant on the structural and magnetic order.

2.2. Structural Characterization

The structural properties of the Cr-doped Sb2Te3 films were characterized by X-ray diffraction (XRD) using a Rigaku Smartlab diffractometer (Rigaku Corporation, Tokyo, Japan) with Cu K α 1 radiation ( λ = 1.5406 Å). Symmetric θ -2 θ scans were collected to probe out-of-plane orientation and lattice constants, while asymmetric reciprocal space maps (RSMs) were recorded as 2 θ - χ scans, where χ denotes the sample tilt relative to the symmetric specular condition ( χ = 0 ° ), enabling access to off-axis reflections for distinguishing secondary phases from the layered Sb2Te3 structure. X-ray reflectivity (XRR) was routinely used only for on-the-fly film thickness determination.
Scanning transmission electron microscopy (STEM) was carried out on cross-sectional lamellae prepared by focused ion beam (FIB) milling, using a Nova 200 Dual Beam system (FEI Company, Hillsboro, OR, USA). High-angle annular dark-field STEM (HAADF-STEM) has been performed on an aberration corrected JEOL JEM-ARM200F NEOARM microscope (JEOL Ltd., Tokyo, Japan), operating at 200 kV and equipped with dual EDS detectors. STEM-EDS elemental mapping was used to determine the dopant distribution of Cr relative to Sb and Te across the film thickness. This combination of XRD and STEM provided complementary information on the crystalline quality, secondary phase formation, and local structural disorder in the sputtered films.

2.3. Magnetic Characterization

Magnetic properties of the Cr-doped Sb2Te3 films were investigated using a superconducting quantum interference device vibrating sample magnetometer SQUID-VSM magnetometer (Quantum Design MPMS 3; Quantum Design, San Diego, CA, USA). Hysteresis loops M ( H ) were recorded at selected temperatures with magnetic fields applied both in-plane and out-of-plane, while temperature-dependent magnetization M ( T ) curves were measured under small applied fields to determine magnetic transition temperatures.
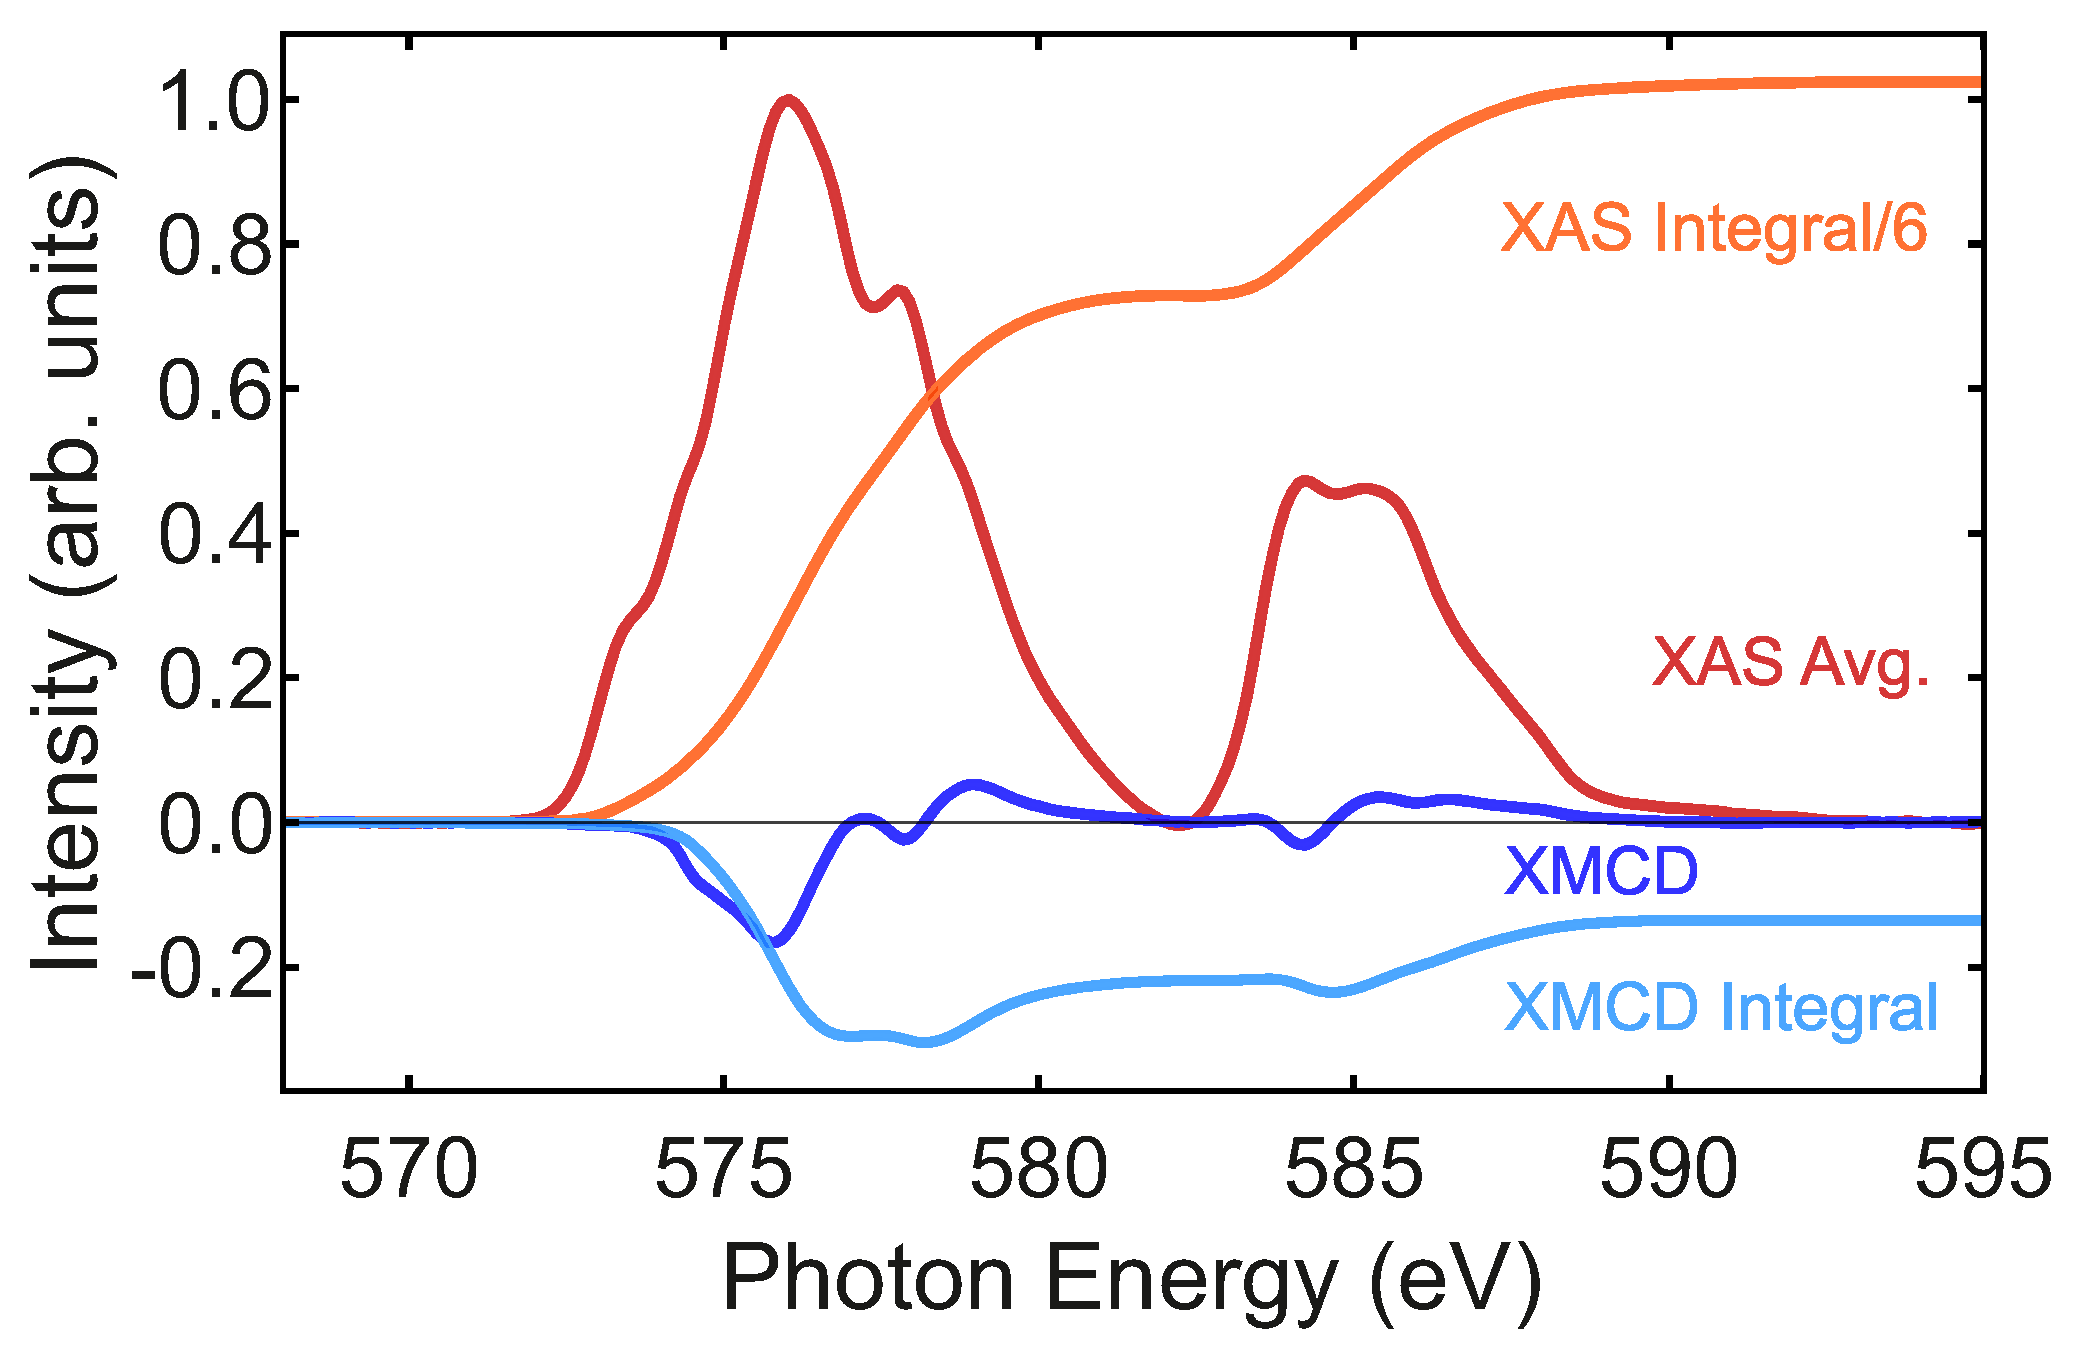
Element-specific magnetic properties were probed by X-ray magnetic circular dichroism (XMCD) at the Cr L 2 , 3 absorption edges on the I10 (BLADE) beamline at the Diamond Light Source (UK), equipped with an APPLE-II undulator capable of providing variable linear and circular polarization in the soft X-ray range. The beamline optics is based on a plane grating monochromator design. Some years ago, the degree of the circular polarized light of the beamline was measured using an X-ray polarimeter and reported to be close to 100% [30], while a more recent measurement based on spectral analysis found somewhat lower values [31]. X-ray absorption spectra (XAS) were collected in both total-electron yield (TEY; surface sensitive) and fluorescence yield (FY; bulk-sensitive) detection modes [32]. XMCD spectra were obtained as the difference between right- and left-circularly polarized X-ray absorption spectra under applied magnetic fields up to 3 T along the beam direction. This approach enabled a direct comparison of surface and bulk magnetic contributions, as well as insight into the valence state of Cr in the sputtered films. The XAS spectra obtained with positive and negative helicity X-rays, μ + and μ , were aligned and a sloping pre-edge baseline (∼570–571 eV) was subtracted, followed by the removal of a two-step arctangent continuum at the Cr L 3 and L 2 thresholds. The average XAS, μ av = ( μ + μ + ) / 2 was then normalized to a unit post-edge (∼590–595 eV). The Cr L 2 , 3 region overlapped with the Te M 4 , 5 edges; however, the Te contribution was very small here and could be ignored. XMCD was defined as ( μ μ + ) , and the sum-rule integrals p ( L 3 XMCD), q ( L 2 , 3 XMCD), and r ( L 2 , 3 XAS) were evaluated to obtain m L and m S using the established j j -mixing correction for Cr ( C = 2 ± 0.2 ). The quantitative analysis used TEY data, while FY was only used qualitatively due to self-absorption and saturation effects that distort the L 2 / L 3 ratio.
The calculated XAS/XMCD spectra were obtained within charge-transfer atomic multiplet theory for the 3 d n 2 p 5 3 d n + 1 dipole transitions, treating intra-atomic Coulomb/exchange interactions and 2 p / 3 d spin-orbit coupling on an equal footing, and including an octahedral crystal field and metal-ligand hybridization through configuration interactions between 3 d n and 3 d n + 1 L ̲ states [32,33,34,35]. Radial Slater integrals were reduced from their Hartree-Fock values to 80% to account for intra-atomic screening, the crystal-field splitting was set by 10 D q (here, 1.5 eV and 2 eV for bulk and surface Cr, respectively), and the charge-transfer energy Δ and hybridization strengths were adjusted within physically realistic values to match the experimental spectral shapes. The calculated spectra were convolved with Lorentzian and Gaussian functions that account for core-hole lifetime and instrumental broadening, then aligned in photon energy to the experimental L 3 maximum. Spin and orbital moments were extracted from the experimental XMCD via the magneto-optical sum rules [36] with the established j j -mixing correction appropriate for Cr [32,37]. For completeness, we followed the implementation and parameterization method reported in our earlier works on Cr-doped chalcogenides [20], adopting the same notational conventions, where L ̲ denotes a ligand hole on adjacent chalcogen sites.

3. Results

3.1. Structural Properties

Structural properties of a series of Cr-doped Sb2Te3 thin films were characterized by XRD in the symmetric θ - 2 θ and the asymmetric reciprocal-space mapping modes. First, we focused on the symmetric θ - 2 θ scans shown in Figure 1. The films were labeled by their nominal Cr concentrations, as determined by SEM-EDS (undoped, 5.3%, 6.0%, 10.5%, and 15.6%). At a low Cr content, the patterns displayed well-defined Sb2Te3 ( 0 0 3 l ) reflections, most prominently ( 0 0 3 ) , ( 0 0 6 ) , and ( 0 0 9 ) at approximately 8 ° , 18 ° , and 26 ° , which confirmed c-axis-oriented growth. With increasing the Cr content above about 10 at.-%, the ( 0 0 3 l ) reflections vanished while the substrate peak remained, which is consistent with a loss of c-plane crystallinity and the emergence of a material that lacks a preferred out-of-plane orientation. In this regime, additional weak features were consistent with Cr-Te-rich phases, indicating a gradual structural breakdown of the tetradymite host at high Cr loading.
The c-lattice parameters were extracted from Bragg fits to the ( 0 0 3 ) , ( 0 0 6 ) , and ( 0 0 9 ) peaks, using the average to reduce the systematic error. We obtained c = 31.4 Å for the undoped film, c = 30.6 Å for 5.3% Cr and c = 30.9 Å for 6.0% Cr. The overall trend of decreasing c with Cr addition was expected for substitutional doping in Sb2Te3, although the small increase between 5.3% and 6.0% was unusual. Possible contributors include local off-stoichiometry, stacking faults, partial strain relaxation, or a change in the Cr site distribution. We note that the c value of the undoped Sb2Te3 film differed from bulk reference values reported in the literature. This was plausibly due to the lattice mismatch between Al2O3 and Sb2Te3, which could impose epitaxial strain in thin films and shift the apparent lattice parameters [38]. The loss of ( 0 0 3 l ) order and the appearance of Cr-Te-like signatures at a high Cr content were consistent with the chemical and magnetic inhomogeneity observed by STEM-EDS (see below), respectively, and provided a structural framework for the depth-dependent electronic and magnetic responses discussed in later sections.
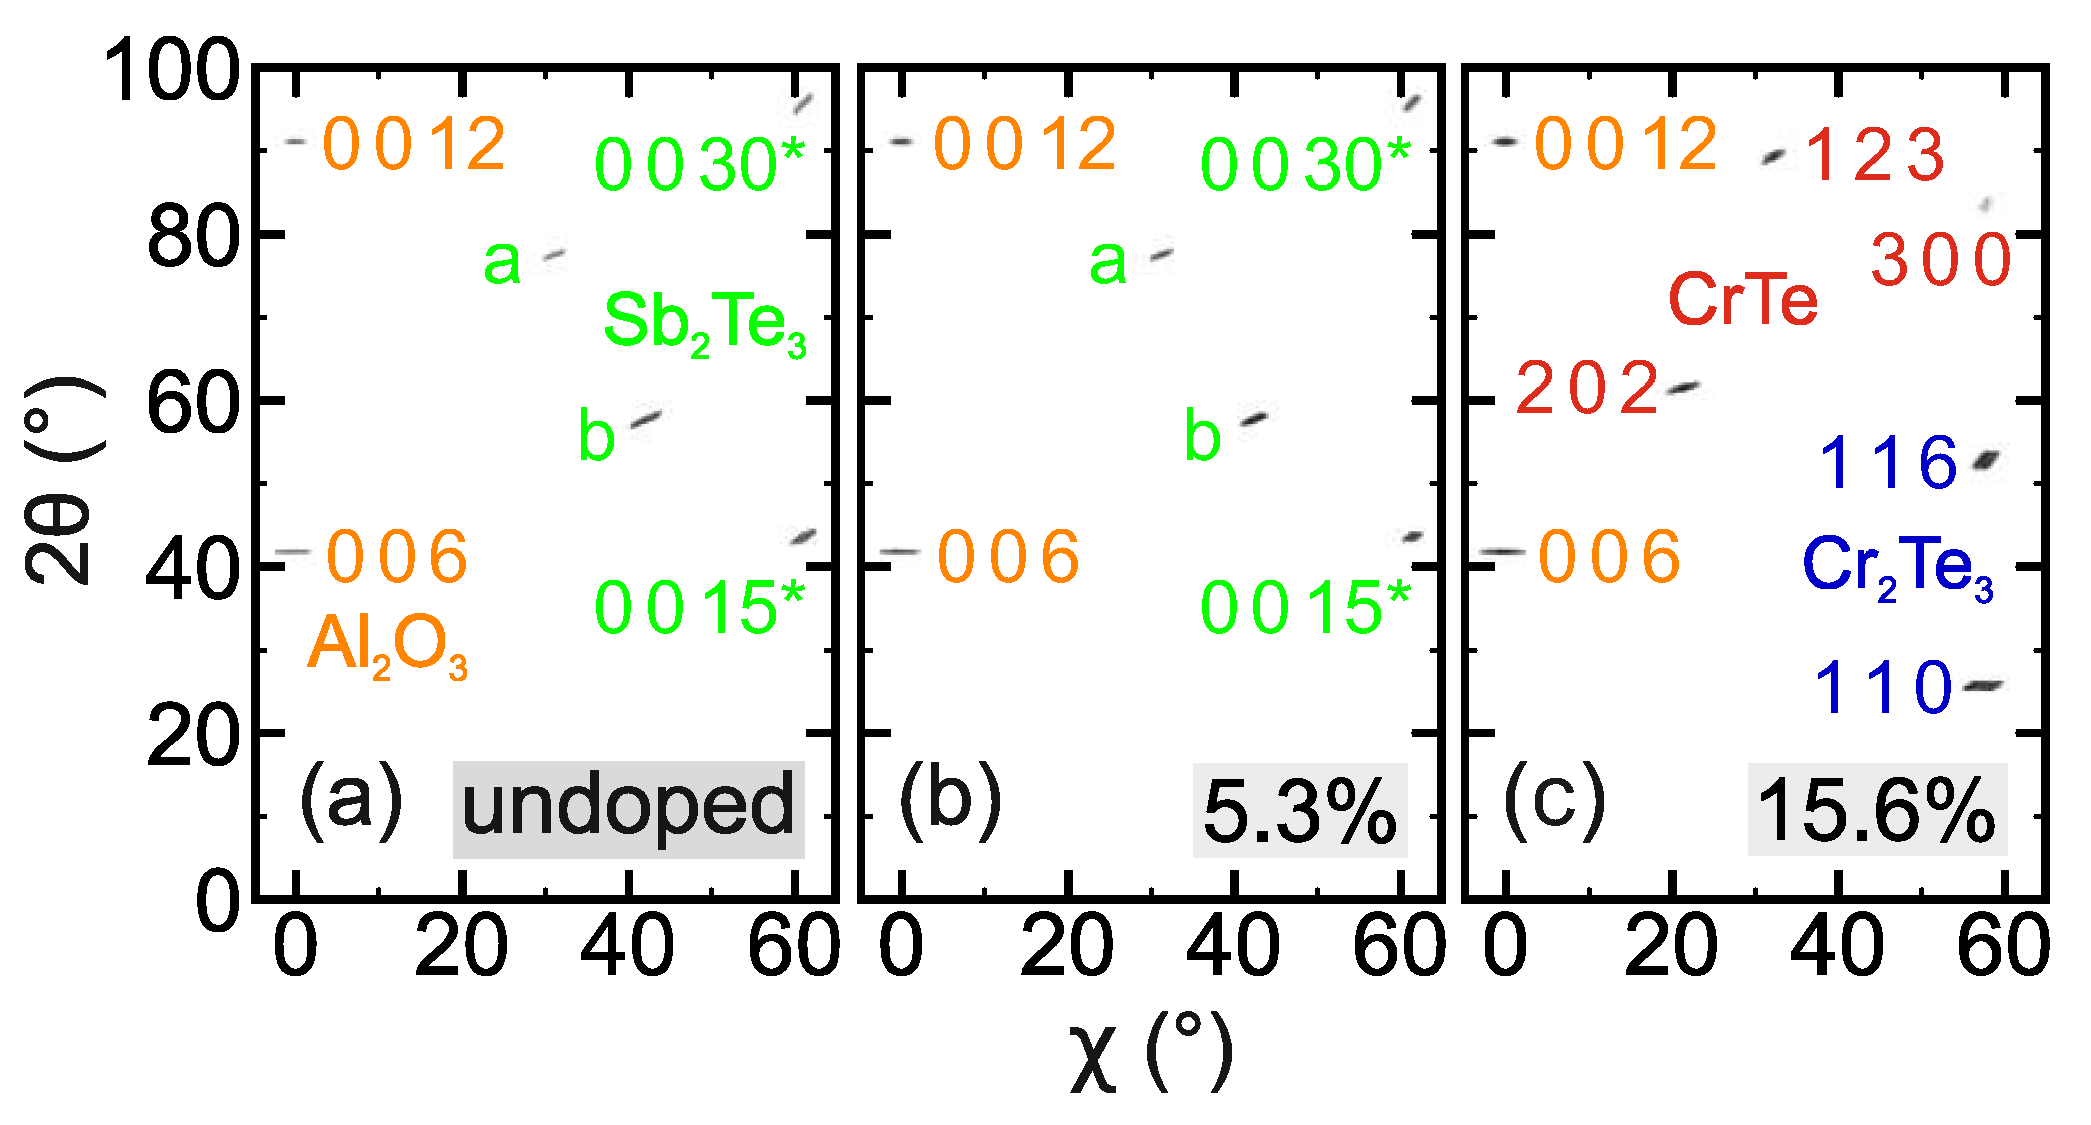
To assess the texture of the films beyond the ( 0 0 3 l ) family, we performed asymmetric reciprocal-space mapping. Representative RSMs for the undoped, 5.3%, and 15.6% films are shown in Figure 2. The undoped and 5.3% samples retained Sb2Te3-type reflections, consistent with residual layered order and c-axis-oriented domains. In contrast, the 15.6% film exhibited only reflections attributable to CrTe and Cr2Te3, evidencing secondary-phase formation and the loss of the tetradymite host at high Cr loading. Additional RSMs on intermediate compositions (e.g., 10.5%) still displayed Sb2Te3-type peaks, even when the corresponding symmetric θ -2 θ scans showed weak or undetectable ( 0 0 3 l ) intensities. This is expected because off-axis reflections in Sb2Te3 could carry higher relative intensity than the ( 0 0 3 l ) family, so RSM provides a more sensitive probe of residual order [38]. Taken together, the data indicate a gradual degradation of crystalline order with increasing Cr content up to about 10% and a complete transformation to CrTe/Cr2Te3-dominated diffraction at the highest doping.
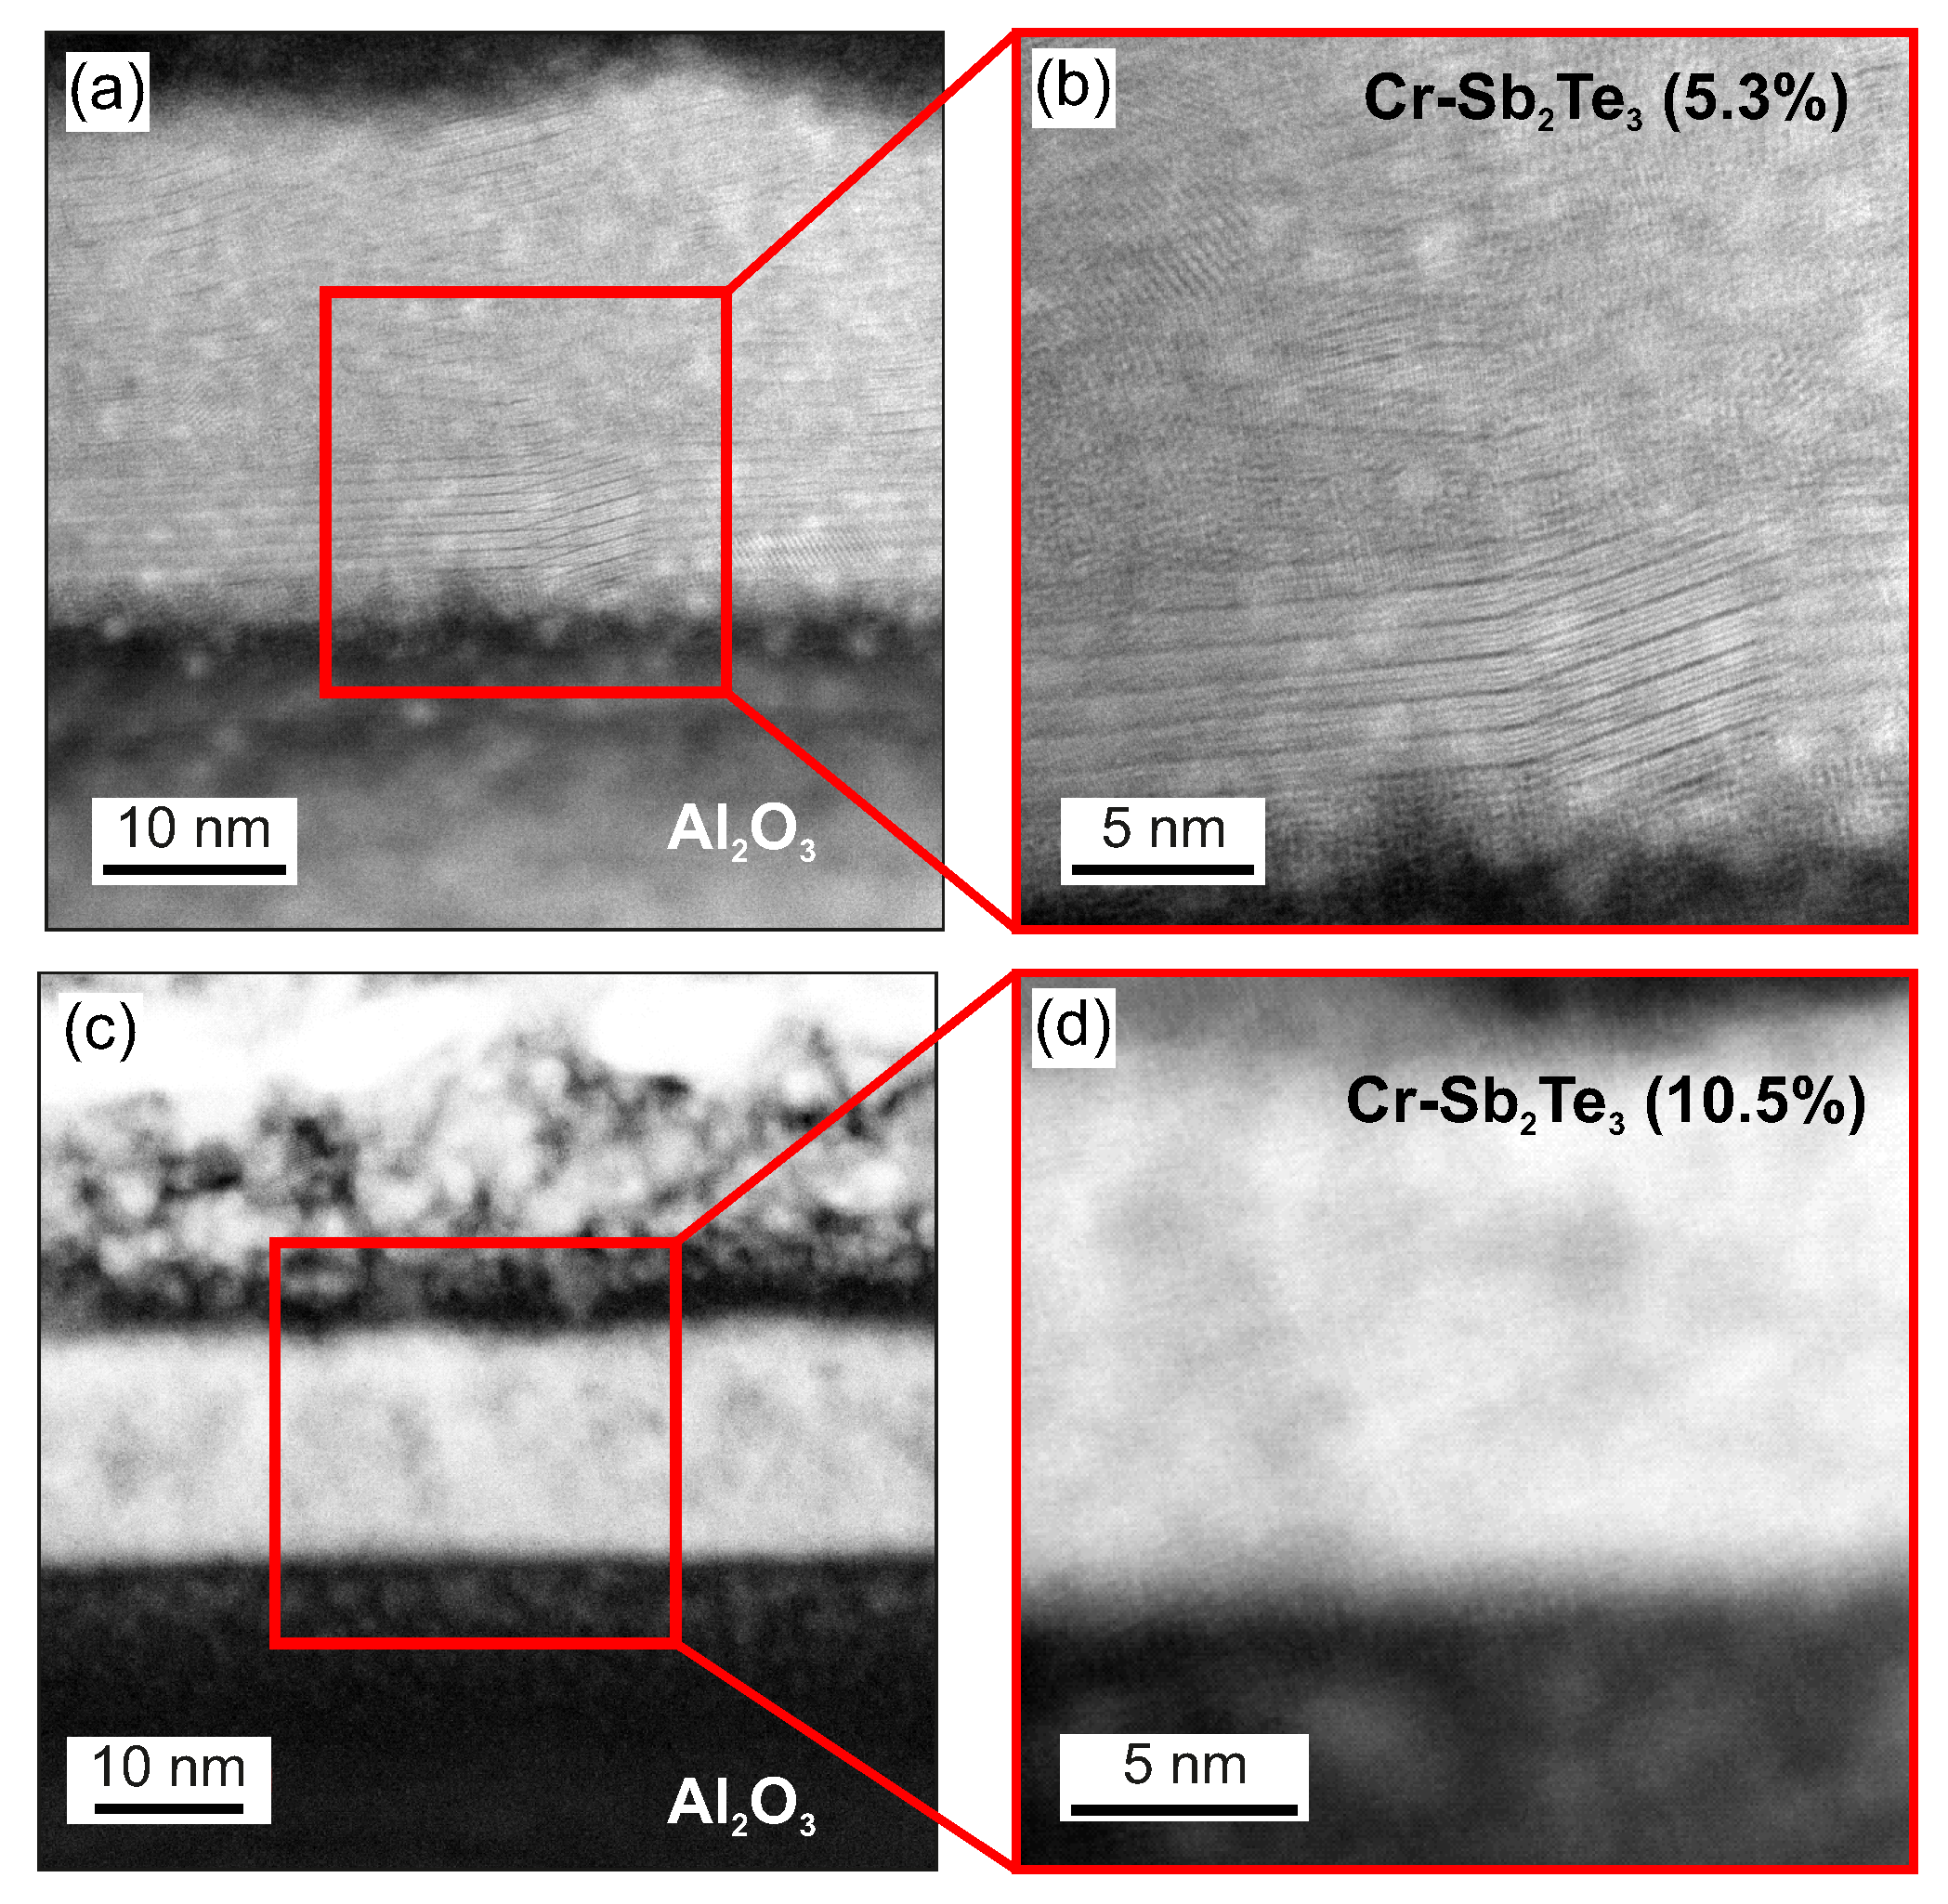
To clarify the microstructural evolution across the mid- to high-doping regime, HAADF-STEM was employed (Figure 3). At 5.3% Cr [Figure 3a,b], the film is nanocrystalline with nearly parallel lattice fringes consistent with c-axis oriented quintuple layers. Frequent tilts, layer terminations, and stacking faults are present, indicating significant disorder on the 5–10 nm length scale. At 10.5% Cr [Figure 3c,d], the images show a loss of long-range layered order over comparable fields of view, with extended amorphous regions. These observations are consistent with the progressive breakdown of tetradymite stacking inferred from XRD and RSM as the Cr content approaches and exceeds the solubility threshold. We cannot exclude nanoscale inclusions of Cr-Te phases below the detection limit of symmetric scans, but the dominant motif is a loss of contiguous quintuple-layer order.
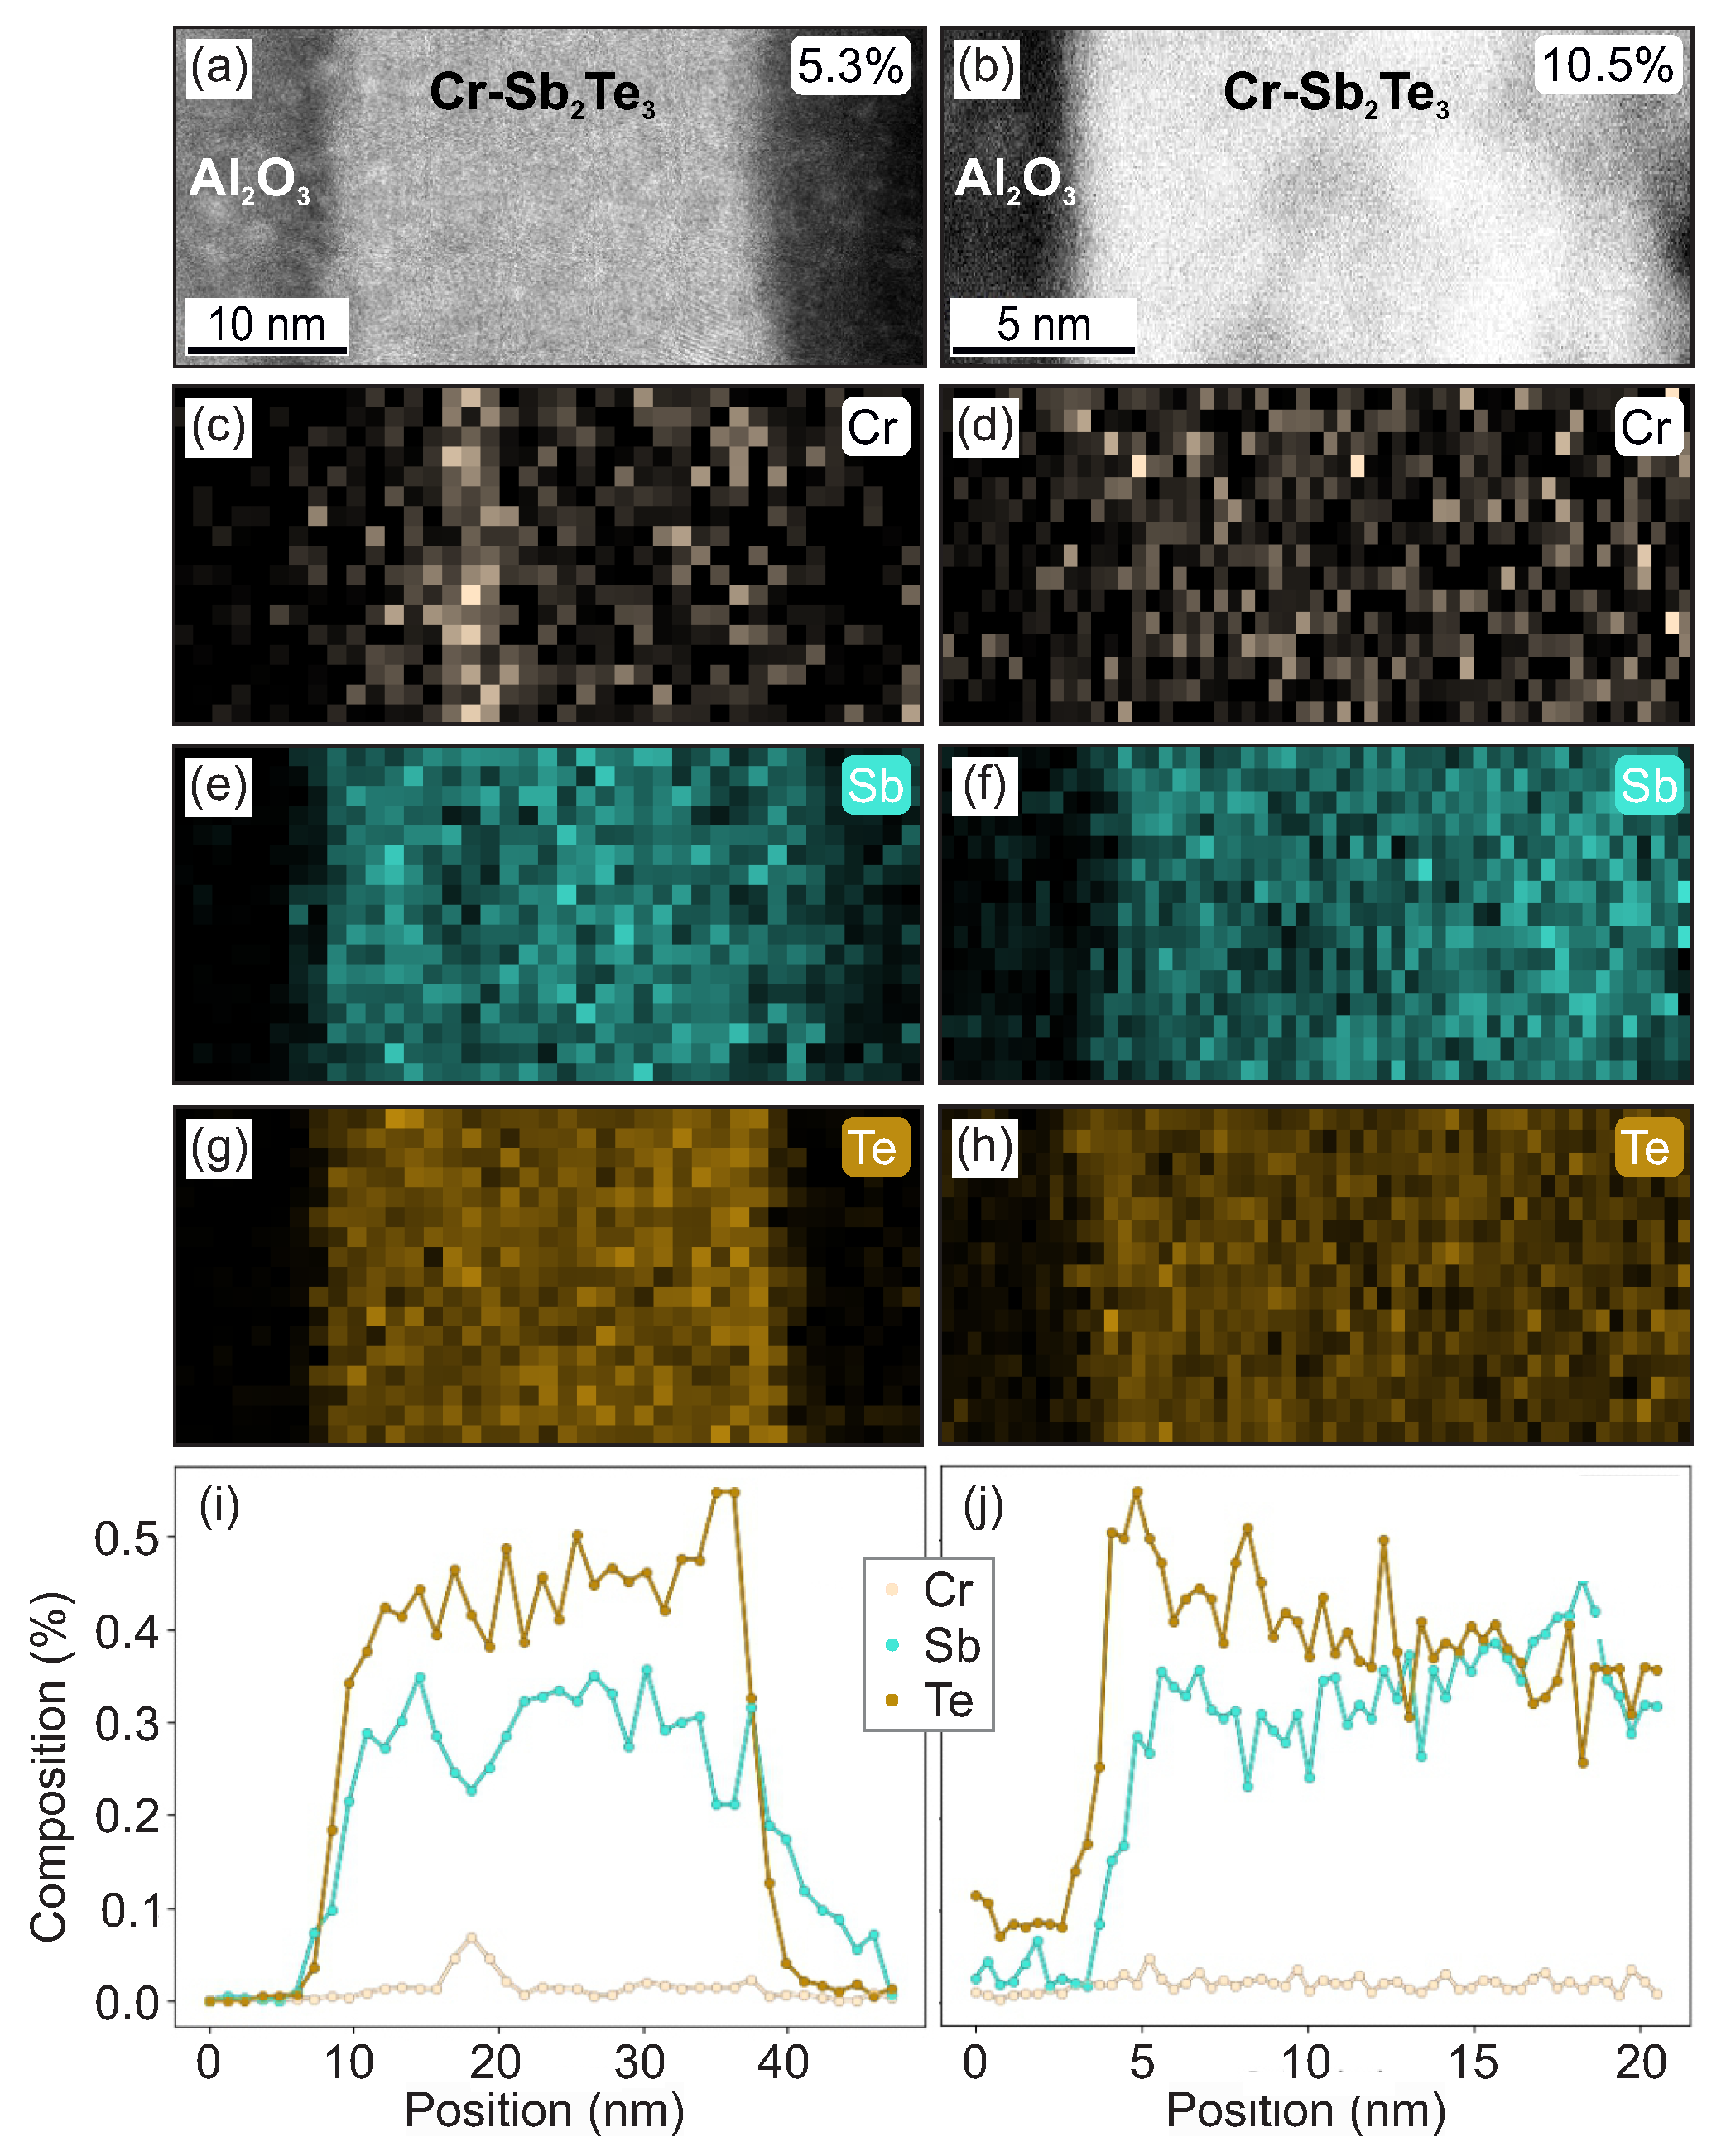
The STEM-EDS maps shown in Figure 4 highlight the pronounced spatial inhomogeneity in the dopant distribution. For the 5.3% film, a narrow Cr-enriched band appears ∼10 nm below the surface, which coincides with a local depletion of Sb, while Te remains comparatively uniform [Figure 4c,e,g,i]. This depth-confined feature is compatible with local CrxTey-rich environments that are below the detection threshold of symmetric XRD. In contrast, the 10.5% sample lacks a single Cr-rich band and instead shows more diffuse composition fluctuations across the thickness, consistent with the amorphous contrast in STEM [Figure 4b,d,f,h,j]. A modest, near-surface change in the Te:Sb ratio is visible in the line profile, which may reflect surface chemistry or post-growth relaxation rather than a distinct phase. The combined XRD and STEM data support a picture in which low-to-mid Cr doping preserves layered order, but introduces local compositional modulations, whereas higher Cr content drives severe structural disorder and, finally, the occurrence of secondary phases.

3.2. Magnetic Properties

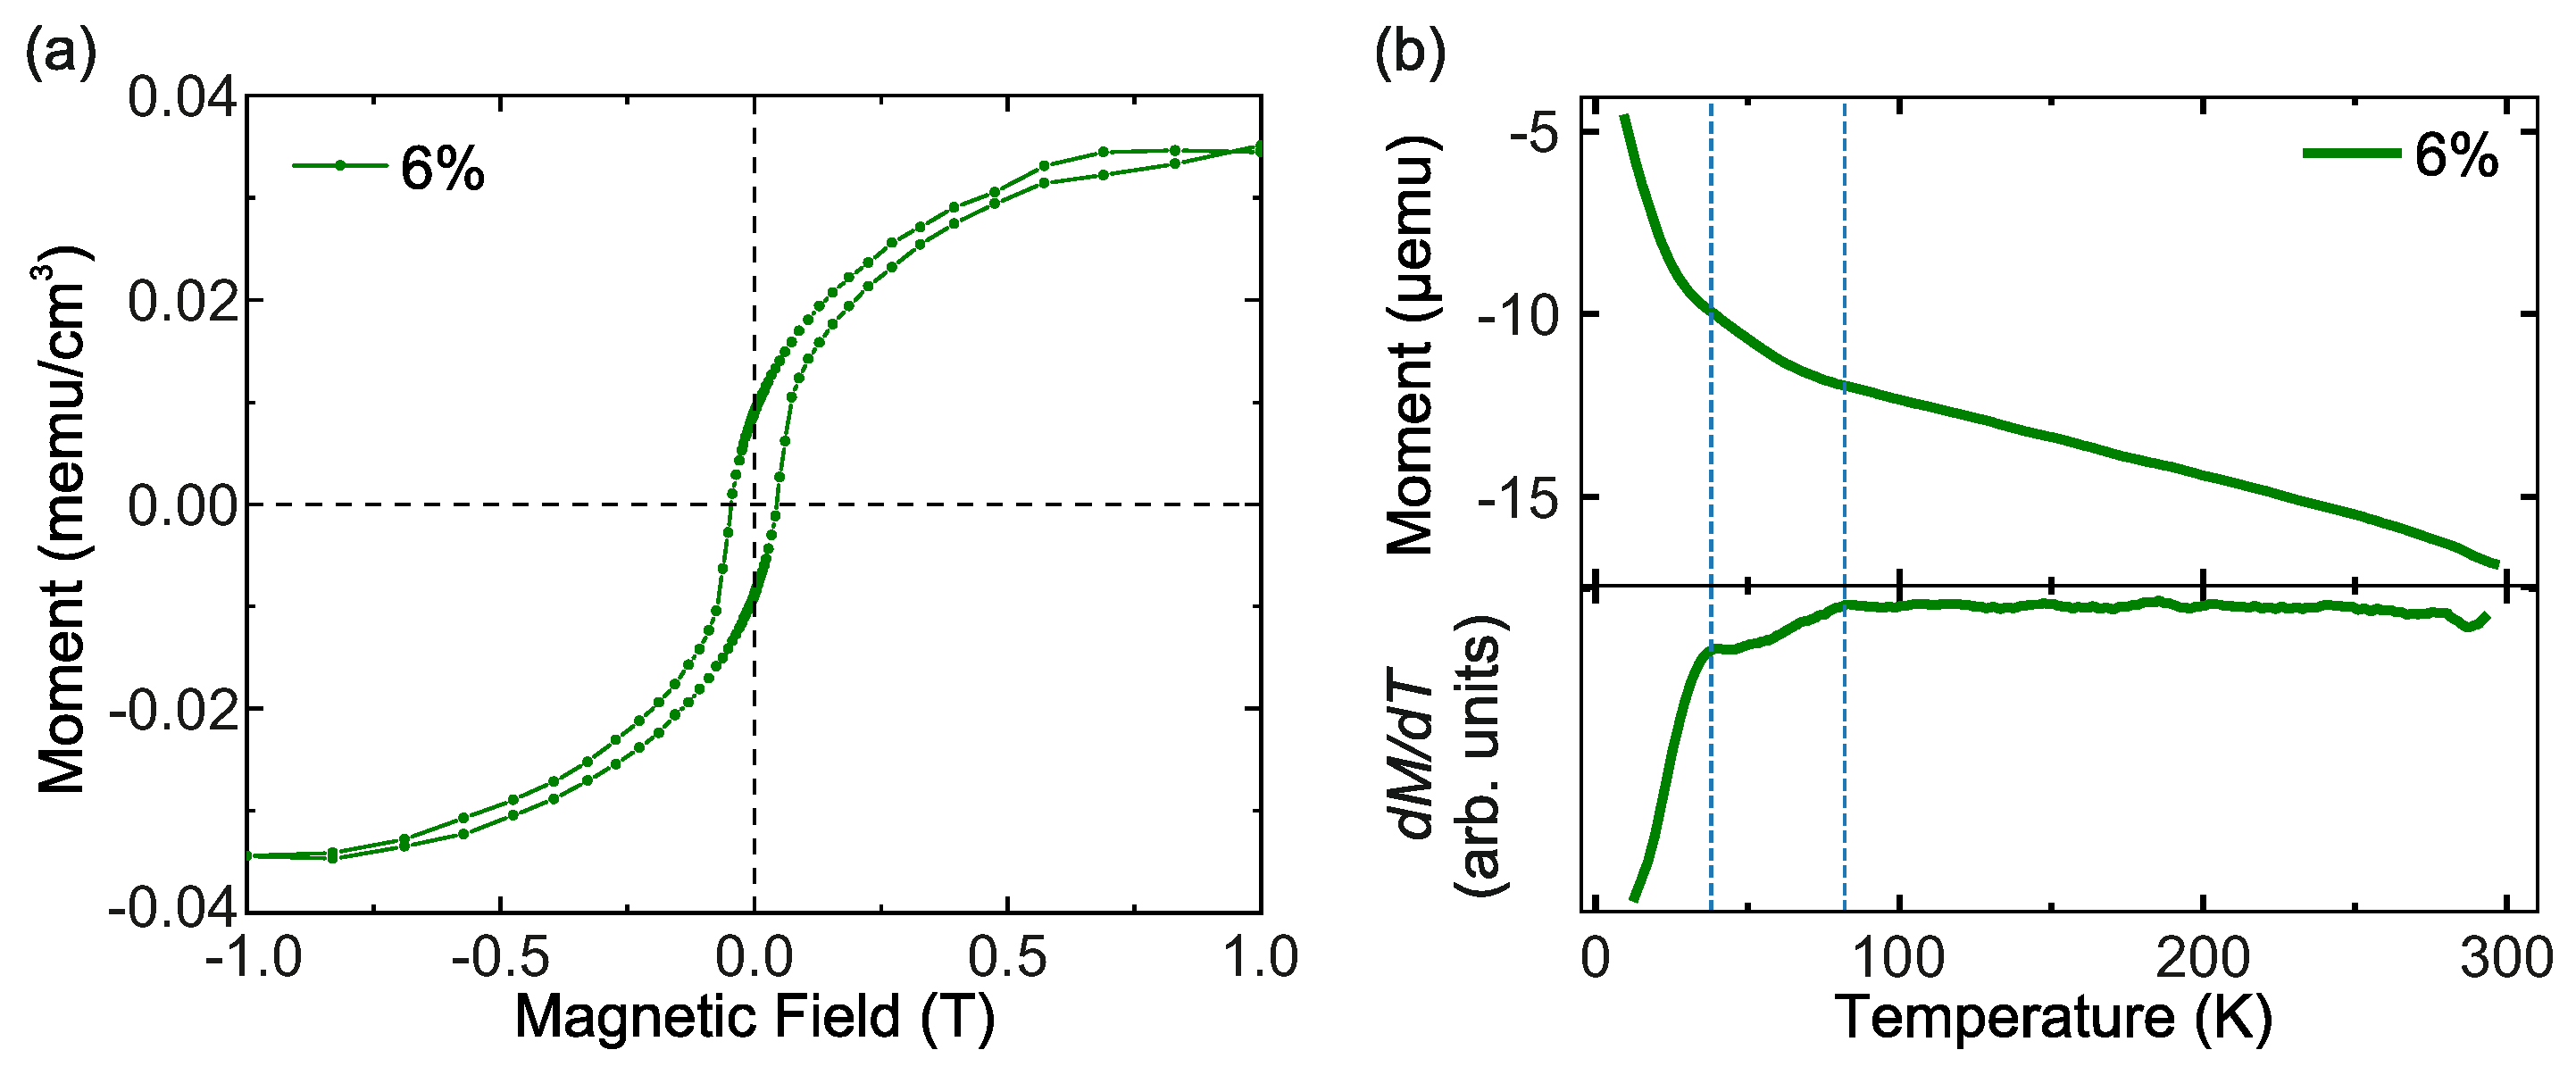
For the detailed magnetic study, we selected a 6% Cr film, which provided a robust magnetic signal while remaining comfortably below the solubility threshold. The resulting spectra could, therefore, be attributed to Cr substituting in the Sb2Te3 host with negligible contributions from secondary Cr–Te phases. To minimize any ambient oxidation, this specimen was grown immediately before the synchrotron measurements. The growth conditions were identical to those used for the series, and its out-of-plane XRD pattern matched the series response (Figure 1). SQUID magnetometry of the 6% Cr film (Figure 5) showed a soft ferromagnetic loop at 5 K with small coercivity and incomplete saturation up to 1 T. The M ( T ) and accompanying d M / d T traces exhibited two weak anomalies near 38 K and 82 K, consistent with multiple magnetic contributions stemming from structurally distinct phases within the film. In epitaxial Cr-doped Bi2Se3, prior work reported a much lower T C of ∼12.5 K with a coercive field ∼10 mT at a few kelvin and effective moments of order ∼2 μ B /Cr from bulk magnetometry/PNR, establishing a baseline for comparison [37]. Note that because the loops exhibited a sizable paramagnetic background, which remained unsaturated even in 6 T at 5 K, indicating a substantial fraction of uncoupled or weakly coupled Cr moments in our sputtered films, we refrained from a quantitative comparison of per-Cr magnetic moments to MBE-grown films.
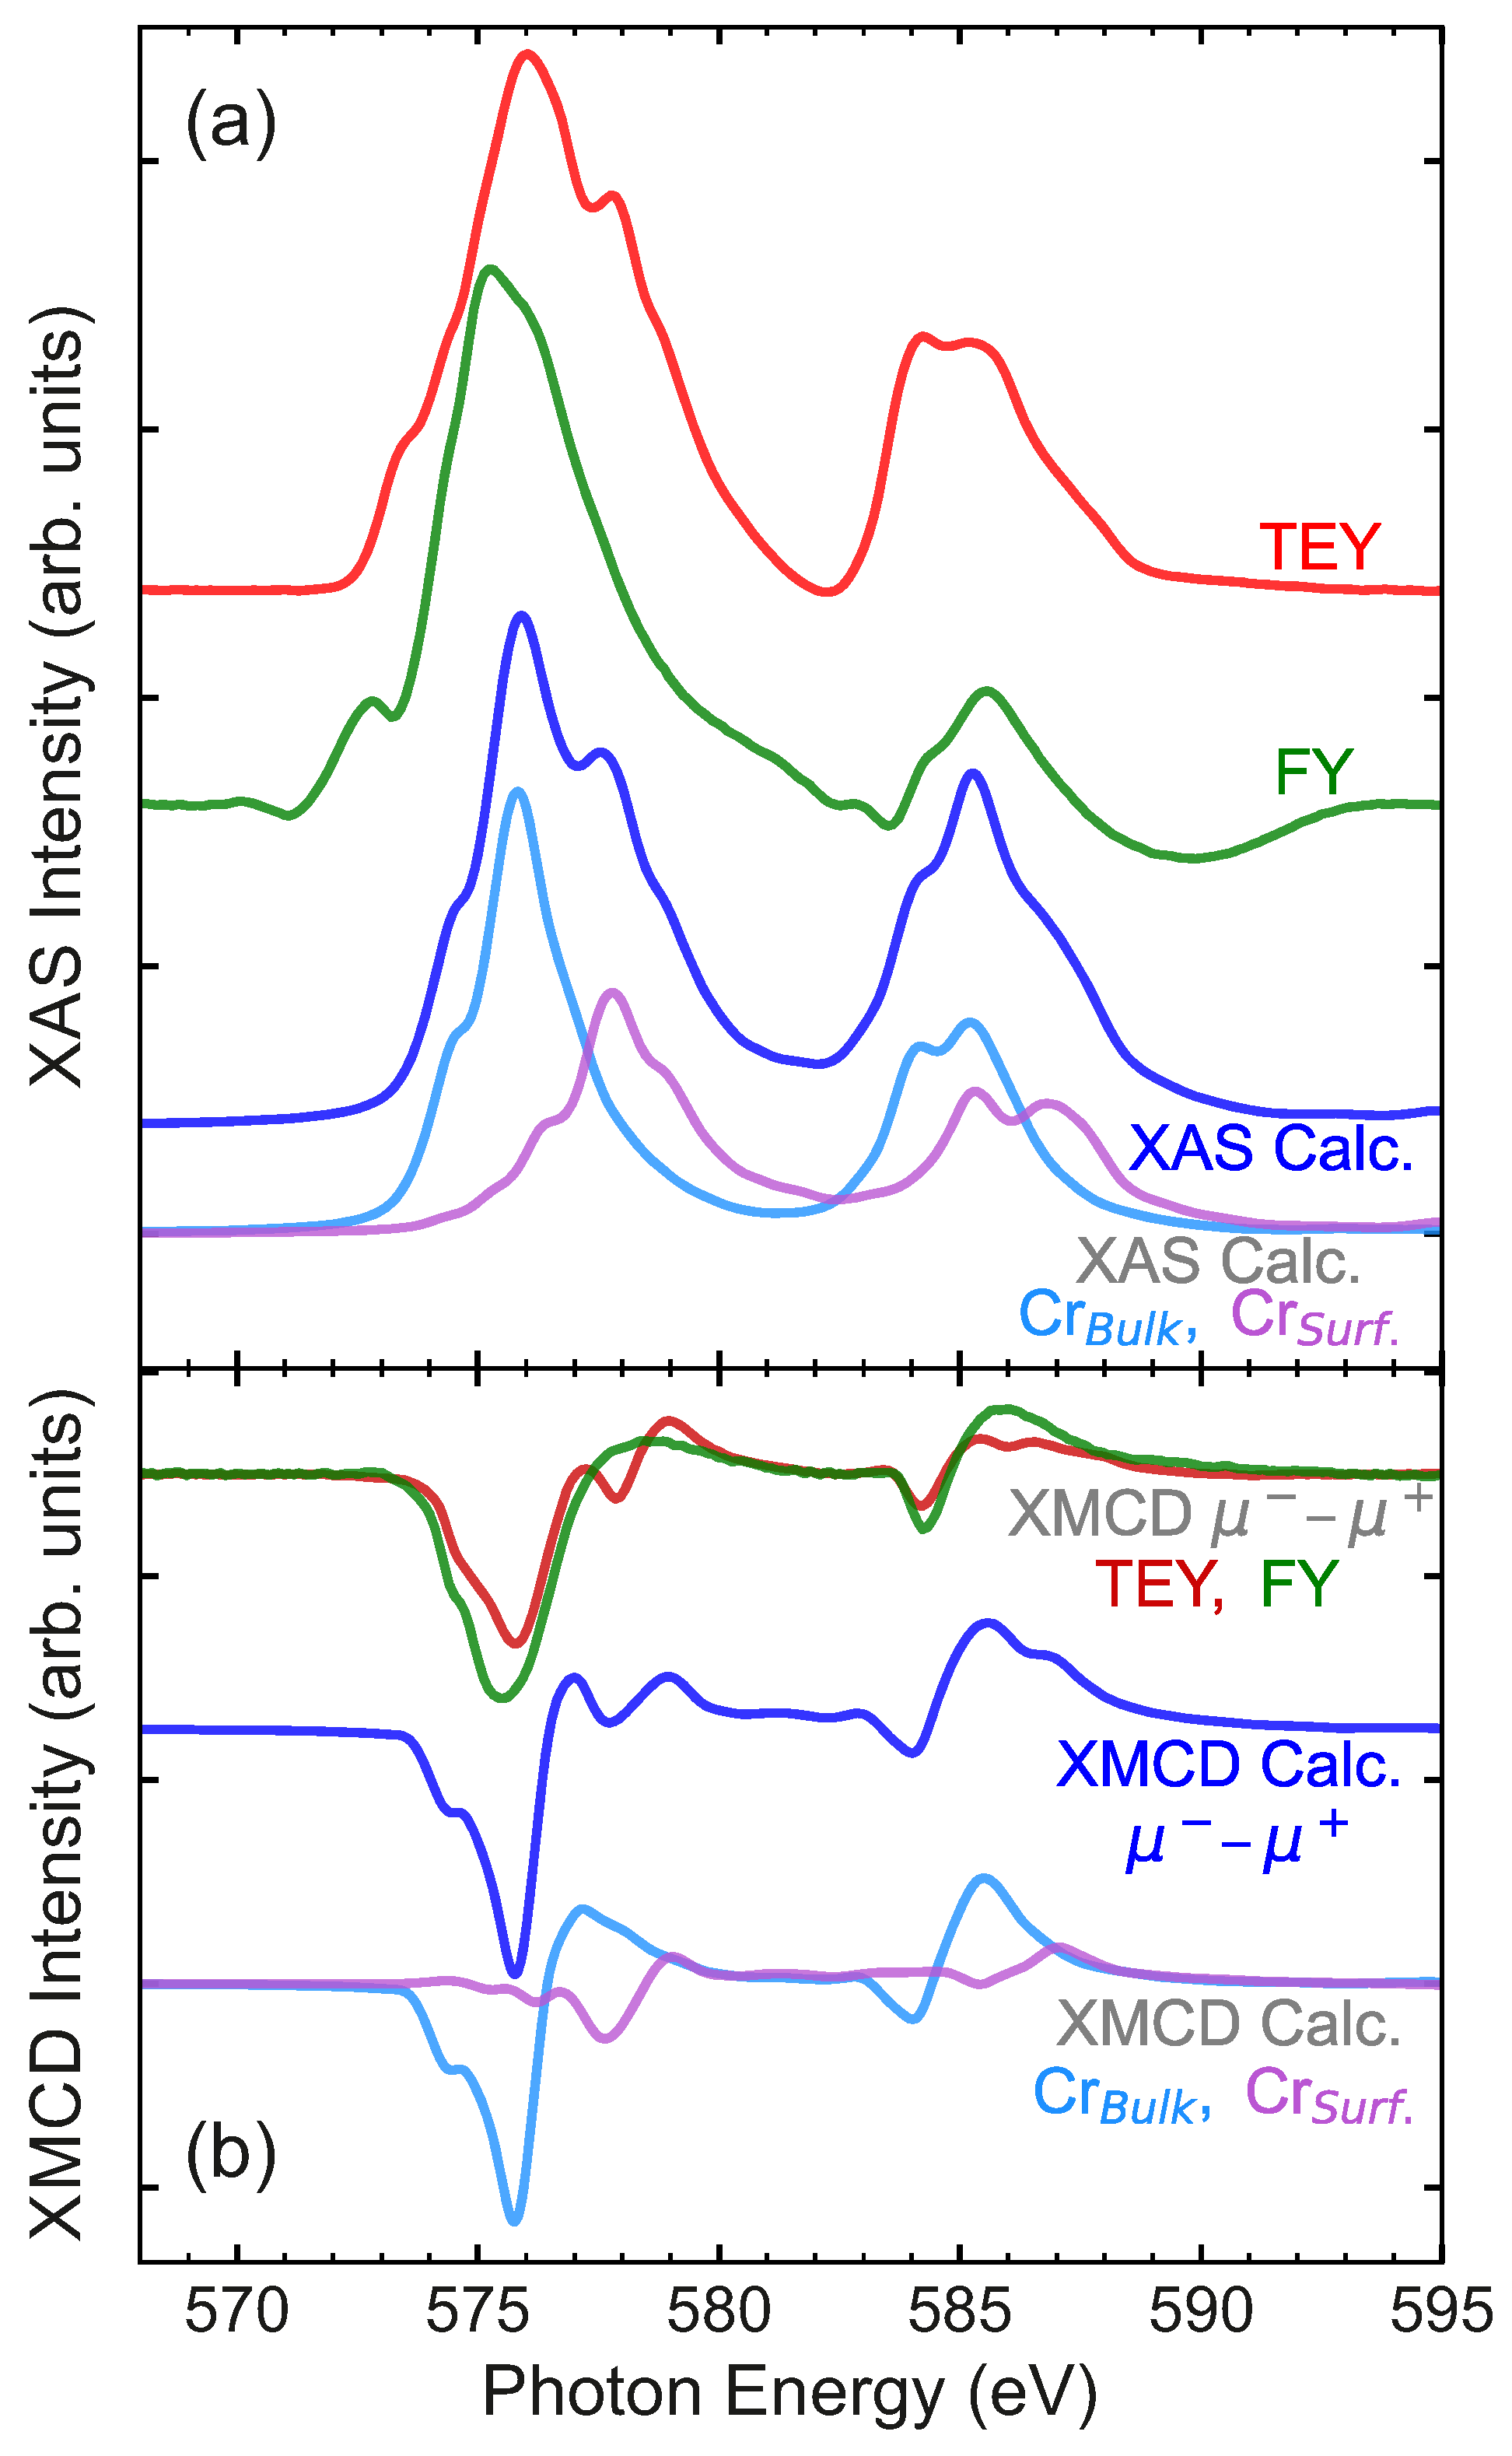
XAS/XMCD at the Cr L 2 , 3 edges (Figure 6) revealed a pronounced depth dependence: the surface-sensitive TEY signal (top ∼3–5 nm) differed from the more bulk-sensitive FY, for which self-absorption and saturation distorted the L 2 / L 3 intensity ratio [37]. Accordingly, we used TEY for quantitative analysis and FY only qualitatively. The TEY spectrum showed distinct contributions for nominal Cr2+ and Cr3+, whereas FY displayed low photon energy features indicative of a predominantly Cr2+ character. This assignment followed the general trend that more electropositive ions appeared at a higher photon energy, so the lower-energy bulk peak reflected a larger divalent weight. Applying the sum rules to the TEY data with the j j -mixing correction C = 2.0 ± 0.2 , appropriate for Cr [37], yielded an orbital moment of m L = ( 0.20 ± 0.04 ) μ B /Cr and a spin moment of m S = ( 1.6 ± 0.2 ) μ B /Cr (see Figure 7). The contribution of the magnetic dipole term, T z to the spin moment was expected to be small. Because our applied field was limited to 3 T, below the ∼7 T typically required to fully saturate the TEY response in similar Bi2Se3 films [37], these extracted moments, like m S , may be underestimated. The coexistence of surface-like Cr3+ and bulk-like Cr2+ components is consistent with a covalent bonding picture in chalcogenides, where hybridization and local bonding drive mixed valence without necessarily changing the free-carrier density. It also matched spatial inhomogeneity seen by TEM-EDS. Finally, we note that, as common for the Te-based TIs, the sloping background from Te M 4 , 5 edges complicated the normalization of the XAS spectra, hence affecting the accuracy of the sum-rule results.
X-ray dichroism on similar films showed ferromagnetic hysteresis with surface moments saturating only at high fields (TEY ∼7 T; FY ∼3 T), underscoring the role of depth-dependent magnetism [37]. The absence of secondary phases below the threshold concentration in our XRD/RSM data suggests that the additional transition did not stem from a crystalline impurity. This was consistent with the literature, which found high structural quality without parasitic phases and attributed the magnetic behavior to Cr occupying octahedral substitutional sites with a predominantly divalent, covalently bonded bulk character (surface more trivalent) [37]. Together, these points support an interpretation in which local variations in Cr concentration and bonding/valence (nominally Cr2+-chalcogen covalency in the bulk vs. more Cr3+ at the surface) generated multiple magnetic components, accounting for the broadened M ( H ) and the two temperature scales in M ( T ) . In comparison, for Cr-doped Bi2Se3, Figueroa et al. [37] reported from a TEY-based sum rule analysis a spin moment μ S = ( 2.90 ± 0.30 ) μ B / Cr av and an essentially quenched orbital moment μ L = ( 0.04 ± 0.10 ) μ B / Cr av . They further decomposed the spectra with multiplet structure simulations [33], finding μ S 3.64 μ B /Cr for bulk-like sites and μ S 1.91   μ B /Cr for surface-like sites (TEY average ∼2.84 μ B /Cr). In contrast, our TEY-derived values for Cr-doped Sb2Te3 were reduced in spin and larger in orbital moment magnitude. Plausible contributors included incomplete saturation at the measurement field and normalization/background choices that biased the p , q , r integrals (Ref. [37] explicitly corrected background steps before integration). We note that the spin-sum rule for Cr required a j j -mixing correction C = 2.0 ± 0.2 , and uncertainties in C propagated directly to μ S [37]. Finally, reduced per-Cr moments of order ∼2 μ B have also been reported by bulk magnetometry on similar films, underscoring that suppressed effective moments are not uncommon in this materials family [37].

4. Summary and Conclusions

We have established that Cr incorporation into sputtered Sb2Te3 is feasible within a limited solubility range. Symmetric θ -2 θ scans and asymmetric reciprocal-space maps show that the layered tetradymite structure is retained up to about 10 at.-% Cr, while higher concentrations lead to the disappearance of Sb2Te3 reflections and the emergence of CrTe and Cr2Te3 peaks. HAADF-STEM and STEM-EDS reveal a nanocrystalline but layered morphology at a low Cr content, including a narrow Cr-enriched band accompanied by local Sb depletion, and a progressive loss of long-range layering with a more diffuse composition at higher Cr. Element-specific XAS/XMCD confirms a depth-dependent magnetic response with predominantly Cr3+ at the surface and predominantly Cr2+ weight in the bulk. Sum-rule analysis of TEY data yields finite orbital and reduced spin moments, noting that the 3 T measurement field likely underestimates m S . Occasional orientation variants seen by RSM are consistent with van der Waals sputter growth and do not contradict the out-of-plane ordering captured by θ -2 θ . Note that within our explored growth window, sputtered Cr-doped Sb2Te3 films do not yet match the structural and magnetic homogeneity achieved by MBE growth, and further process optimization is required. Nevertheless, they define a starting point and highlight that controlling dopant solubility, suppressing secondary Cr-Te phases, and managing local compositional modulation are the key for realizing homogeneous magnetic topological insulator films by sputtering.

Author Contributions

Conceptualization, T.H.; methodology, V.K.L., G.v.d.L., and T.H.; formal analysis, J.B. (Joshua Bibby), V.K.L., G.v.d.L., and T.H.; resources, V.K.L., G.v.d.L., and T.H.; data curation, J.B. (Joshua Bibby), A.S., E.H., J.B. (Jack Bollard), B.A., J.A.d.N., and C.M.; writing—original draft preparation, J.B. (Joshua Bibby) and T.H.; writing—review and editing, T.H.; visualization, J.B. (Joshua Bibby) and T.H.; supervision, A.S., V.K.L., G.v.d.L., and T.H.; project administration, T.H.; funding acquisition, T.H. All authors have read and agreed to the published version of the manuscript.

Funding

The XMCD experiments were carried out on beamline I10 at the Diamond Light Source under proposal MM33454-1. Financial support from the Leverhulme Trust (RPG-2020-358), the John Fell Fund (University of Oxford), the Oxford-ShanghaiTech collaboration project, and the UK Skyrmion Project (Engineering and Physical Sciences Research Council, EP/N032128/1) is acknowledged. We also thank the York-JEOL Nanocentre and EPSRC (EP/S033394/1) for STEM access and specimen preparation. J.Bi. was supported by the Leverhulme Trust, E.H. acknowledges an STFC-Diamond-EPSRC studentship (project 2604894, EP/R513295/1, EP/T517811/1), and J.Bo. a Diamond-EPSRC studentship (project 2606404, EP/R513295/1, EP/T517811/1).

Data Availability Statement

The original contributions presented in this study are included in the article. Further inquiries can be directed to the corresponding author.

Conflicts of Interest

The authors declare no conflicts of interest. Generative-AI disclosure: ChatGPT (OpenAI, GPT-5) was used to improve sentence flow, grammar, and spelling; all scientific content, analyses, and conclusions are the authors’ own.

References

  1. Hasan, M.Z.; Kane, C.L. Colloquium: Topological insulators. Rev. Mod. Phys. 2010, 82, 3045–3067. [Google Scholar] [CrossRef]
  2. Qi, X.L.; Zhang, S.C. Topological insulators and superconductors. Rev. Mod. Phys. 2011, 83, 1057–1110. [Google Scholar] [CrossRef]
  3. Liu, C.X.; Qi, X.L.; Dai, X.; Fang, Z.; Zhang, S.C. Quantum Anomalous Hall Effect in Hg1-yMnyTe Quantum Wells. Phys. Rev. Lett. 2008, 101, 146802. [Google Scholar] [CrossRef]
  4. Yu, R.; Zhang, W.; Zhang, H.J.; Zhang, S.C.; Dai, X.; Fang, Z. Quantized Anomalous Hall Effect in Magnetic Topological Insulators. Science 2010, 329, 61–64. [Google Scholar] [CrossRef]
  5. Chang, C.Z.; Zhang, J.; Feng, X.; Shen, J.; Zhang, Z.; Guo, M.; Li, K.; Ou, Y.; Wei, P.; Wang, L.L.; et al. Experimental Observation of the Quantum Anomalous Hall Effect in a Magnetic Topological Insulator. Science 2013, 340, 167–170. [Google Scholar] [CrossRef] [PubMed]
  6. Checkelsky, J.; Yoshimi, R.; Tsukazaki, A.; Takahashi, K.; Kozuka, Y.; Falson, J.; Kawasaki, M.; Tokura, Y. Trajectory of Anomalous Hall Effect toward the Quantized State in a Ferromagnetic Topological Insulator. Nat. Phys. 2014, 10, 731. [Google Scholar] [CrossRef]
  7. Tokura, Y.; Yasuda, K.; Tsukazaki, A. Magnetic topological insulators. Nat. Rev. Phys. 2019, 1, 126–143. [Google Scholar] [CrossRef]
  8. Chang, C.Z.; Liu, C.X.; MacDonald, A.H. Colloquium: Quantum anomalous Hall effect. Rev. Mod. Phys. 2023, 95, 011002. [Google Scholar] [CrossRef]
  9. Huang, N.J.; Boland, J.L.; Fijalkowski, K.M.; Gould, C.; Hesjedal, T.; Kazakova, O.; Kumar, S.; Scherer, H. Quantum anomalous Hall effect for metrology. Appl. Phys. Lett. 2025, 126, 040501. [Google Scholar] [CrossRef]
  10. Tse, W.K.; MacDonald, A.H. Giant Magneto-Optical Kerr Effect and Universal Faraday Effect in Thin-Film Topological Insulators. Phys. Rev. Lett. 2010, 105, 057401. [Google Scholar] [CrossRef]
  11. Qi, X.L.; Li, R.; Zang, J.; Zhang, S.C. Inducing a Magnetic Monopole with Topological Surface States. Science 2009, 323, 1184–1187. [Google Scholar] [CrossRef]
  12. Morimoto, T.; Furusaki, A.; Nagaosa, N. Topological magnetoelectric effects in thin films of topological insulators. Phys. Rev. B 2015, 92, 085113. [Google Scholar] [CrossRef]
  13. Manchon, A.; Železný, J.; Miron, I.M.; Jungwirth, T.; Sinova, J.; Thiaville, A.; Garello, K.; Gambardella, P. Current-induced spin-orbit torques in ferromagnetic and antiferromagnetic systems. Rev. Mod. Phys. 2019, 91, 035004. [Google Scholar] [CrossRef]
  14. Zhang, D.; Richardella, A.; Rench, D.W.; Xu, S.Y.; Kandala, A.; Flanagan, T.C.; Beidenkopf, H.; Yeats, A.L.; Buckley, B.B.; Klimov, P.V.; et al. Interplay between ferromagnetism, surface states, and quantum corrections in a magnetically doped topological insulator. Phys. Rev. B 2012, 86, 205127. [Google Scholar] [CrossRef]
  15. Zhang, J.M.; Ming, W.; Huang, Z.; Liu, G.B.; Kou, X.; Fan, Y.; Wang, K.L.; Yao, Y. Stability, electronic, and magnetic properties of the magnetically doped topological insulators Bi2Se3, Bi2Te3, and Sb2Te3. Phys. Rev. B 2013, 88, 235131. [Google Scholar] [CrossRef]
  16. Singh, A.; Kamboj, V.S.; Liu, J.; Llandro, J.; Duffy, L.B.; Senanayak, S.P.; Beere, H.E.; Ionescu, A.; Ritchie, D.A.; Hesjedal, T.; et al. Systematic study of ferromagnetism in CrxSb2-xTe3 topological insulator thin films using electrical and optical techniques. Sci. Rep. 2018, 8, 17024. [Google Scholar] [CrossRef]
  17. Steinke, N.J.; Zhang, S.L.; Baker, P.J.; Duffy, L.B.; Kronast, F.; Krieger, J.; Salman, Z.; Prokscha, T.; Suter, A.; Langridge, S.; et al. Magnetic correlations in the magnetic topological insulator (Cr,Sb)2Te3. Phys. Rev. B 2022, 106, 224425. [Google Scholar] [CrossRef]
  18. Dyck, J.S.; Drašar, i.c.v.; Lošt’ák, P.; Uher, C. Low-temperature ferromagnetic properties of the diluted magnetic semiconductor Sb2-xCrxTe3. Phys. Rev. B 2005, 71, 115214. [Google Scholar] [CrossRef]
  19. Zhou, Z.; Chien, Y.J.; Uher, C. Thin film dilute ferromagnetic semiconductors Sb2-xCrxTe3 with a Curie temperature up to 190 K. Phys. Rev. B 2006, 74, 224418. [Google Scholar] [CrossRef]
  20. Duffy, L.B.; Figueroa, A.I.; Gładczuk, L.; Steinke, N.J.; Kummer, K.; van der Laan, G.; Hesjedal, T. Magnetic proximity coupling to Cr-doped Sb2Te3 thin films. Phys. Rev. B 2017, 95, 224422. [Google Scholar] [CrossRef]
  21. Drasar, C.; Kasparova, J.; Lostak, P.; Shi, X.; Uher, C. Transport and magnetic properties of the diluted magnetic semiconductors Sb1.98-xV0.02CrxTe3 and Sb1.984-yV0.016MnyTe3. Phys. Status Solidi B 2007, 244, 2202–2209. [Google Scholar] [CrossRef]
  22. Duffy, L.B.; Figueroa, A.I.; van der Laan, G.; Hesjedal, T. Codoping of Sb2Te3 thin films with V and Cr. Phys. Rev. Materials 2017, 1, 064409. [Google Scholar] [CrossRef]
  23. Ou, Y.; Liu, C.; Jiang, G.; Feng, Y.; Zhao, D.; Wu, W.; Wang, X.X.; Li, W.; Song, C.; Wang, L.L.; et al. Enhancing the Quantum Anomalous Hall Effect by Magnetic Codoping in a Topological Insulator. Adv. Mater. 2018, 30. [Google Scholar] [CrossRef]
  24. Zhang, W.; West, D.; Lee, S.H.; Qiu, Y.; Chang, C.Z.; Moodera, J.S.; Hor, Y.S.; Zhang, S.; Wu, W. Electronic fingerprints of Cr and V dopants in the topological insulator Sb2Te3. Phys. Rev. B 2018, 98, 115165. [Google Scholar] [CrossRef]
  25. DC, M.; Grassi, R.; Chen, J.Y.; Jamali, M.; Hickey, D.R.; Zhang, D.; Zhao, Z.; Li, H.; Quarterman, P.; Lv, Y.; et al. Room-temperature high spin-orbit torque due to quantum confinement in sputtered BixSe(1-x) films. Nat. Mater. 2018, 17, 800–807. [Google Scholar] [CrossRef]
  26. Lu, Q.; Li, P.; Guo, Z.; Dong, G.; Peng, B.; Zha, X.; Min, T.; Zhou, Z.; Liu, M. Giant tunable spin Hall angle in sputtered Bi2Se3 controlled by an electric field. Nat. Commun. 2022, 13, 1650. [Google Scholar] [CrossRef]
  27. Lu, H.; Huang, Y.; Guo, Q.; Wang, K.; He, M.; Yin, Z.; Wang, D.; Liu, T.; Wang, J.; Yu, G.; et al. Transport properties of crystallized antiferromagnetic MnBi2Te4 thin films grown by magnetron sputtering. J. Phys. D Appl. Phys. 2023, 56, 045302. [Google Scholar] [CrossRef]
  28. Bibby, J.; Singh, A.; Heppell, E.; Bollard, J.; Achinuq, B.; Haigh, S.J.; van der Laan, G.; Hesjedal, T. Synthesis of nanocrystalline Mn-doped Bi2Te3 thin films via magnetron sputtering. Crystals 2025, 15, 54. [Google Scholar] [CrossRef]
  29. Bibby, J.; Heppell, E.; Bollard, J.; Arnold, E.L.; Herrero-Martin, J.; van der Laan, G.; Hesjedal, T. Sputter-grown MnBi2Te4 thin films: Magnetic ground states and phase control. Phys. Status Solidi RRL 2025, e2500329. [Google Scholar] [CrossRef]
  30. Wang, H.; Bencok, P.; Steadman, P.; Longhi, E.; Zhu, J.; Wang, Z. Complete polarization analysis of an APPLE II undulator using a soft X-ray polarimeter. J. Synchrotron Rad. 2012, 19, 944–948. [Google Scholar] [CrossRef]
  31. van der Laan, G.; Hesjedal, T.; Bencok, P. Polarization analysis by means of individual soft x-ray absorption spectra of rare earths. Phys. Rev. B 2022, 106, 214423. [Google Scholar] [CrossRef]
  32. van der Laan, G.; Figueroa, A.I. X-ray magnetic circular dichroism–A versatile tool to study magnetism. Coord. Chem. Rev. 2014, 277–278, 95–129. [Google Scholar] [CrossRef]
  33. van der Laan, G.; Thole, B.T. Strong magnetic x-ray dichroism in 2p absorption spectra of 3d transition-metal ions. Phys. Rev. B 1991, 43, 13401–13411. [Google Scholar] [CrossRef]
  34. van der Laan, G. Hitchhiker’s Guide to Multiplet Calculations. Lect. Notes Phys. 2006, 697, 143–199. [Google Scholar] [CrossRef]
  35. Cowan, R.D. The Theory of Atomic Structure and Spectra; University of California Press: Berkeley, CA, USA, 1992. [Google Scholar]
  36. Thole, B.T.; Carra, P.; Sette, F.; van der Laan, G. X-ray circular dichroism as a probe of orbital magnetization. Phys. Rev. Lett. 1992, 68, 1943–1946. [Google Scholar] [CrossRef] [PubMed]
  37. Figueroa, A.I.; van der Laan, G.; Collins-McIntyre, L.J.; Zhang, S.L.; Baker, A.A.; Harrison, S.E.; Schönherr, P.; Cibin, G.; Hesjedal, T. Magnetic Cr doping of Bi2Se3: Evidence for divalent Cr from x-ray spectroscopy. Phys. Rev. B 2014, 90, 134402. [Google Scholar] [CrossRef]
  38. Mansour, A.N.; Wong-Ng, W.; Huang, Q.; Tang, W.; Thompson, A.; Sharp, J. Structural characterization of Bi2Te3 and Sb2Te3 as a function of temperature using neutron powder diffraction and extended X-ray absorption fine structure techniques. J. Appl. Phys. 2014, 116, 083513. [Google Scholar] [CrossRef]
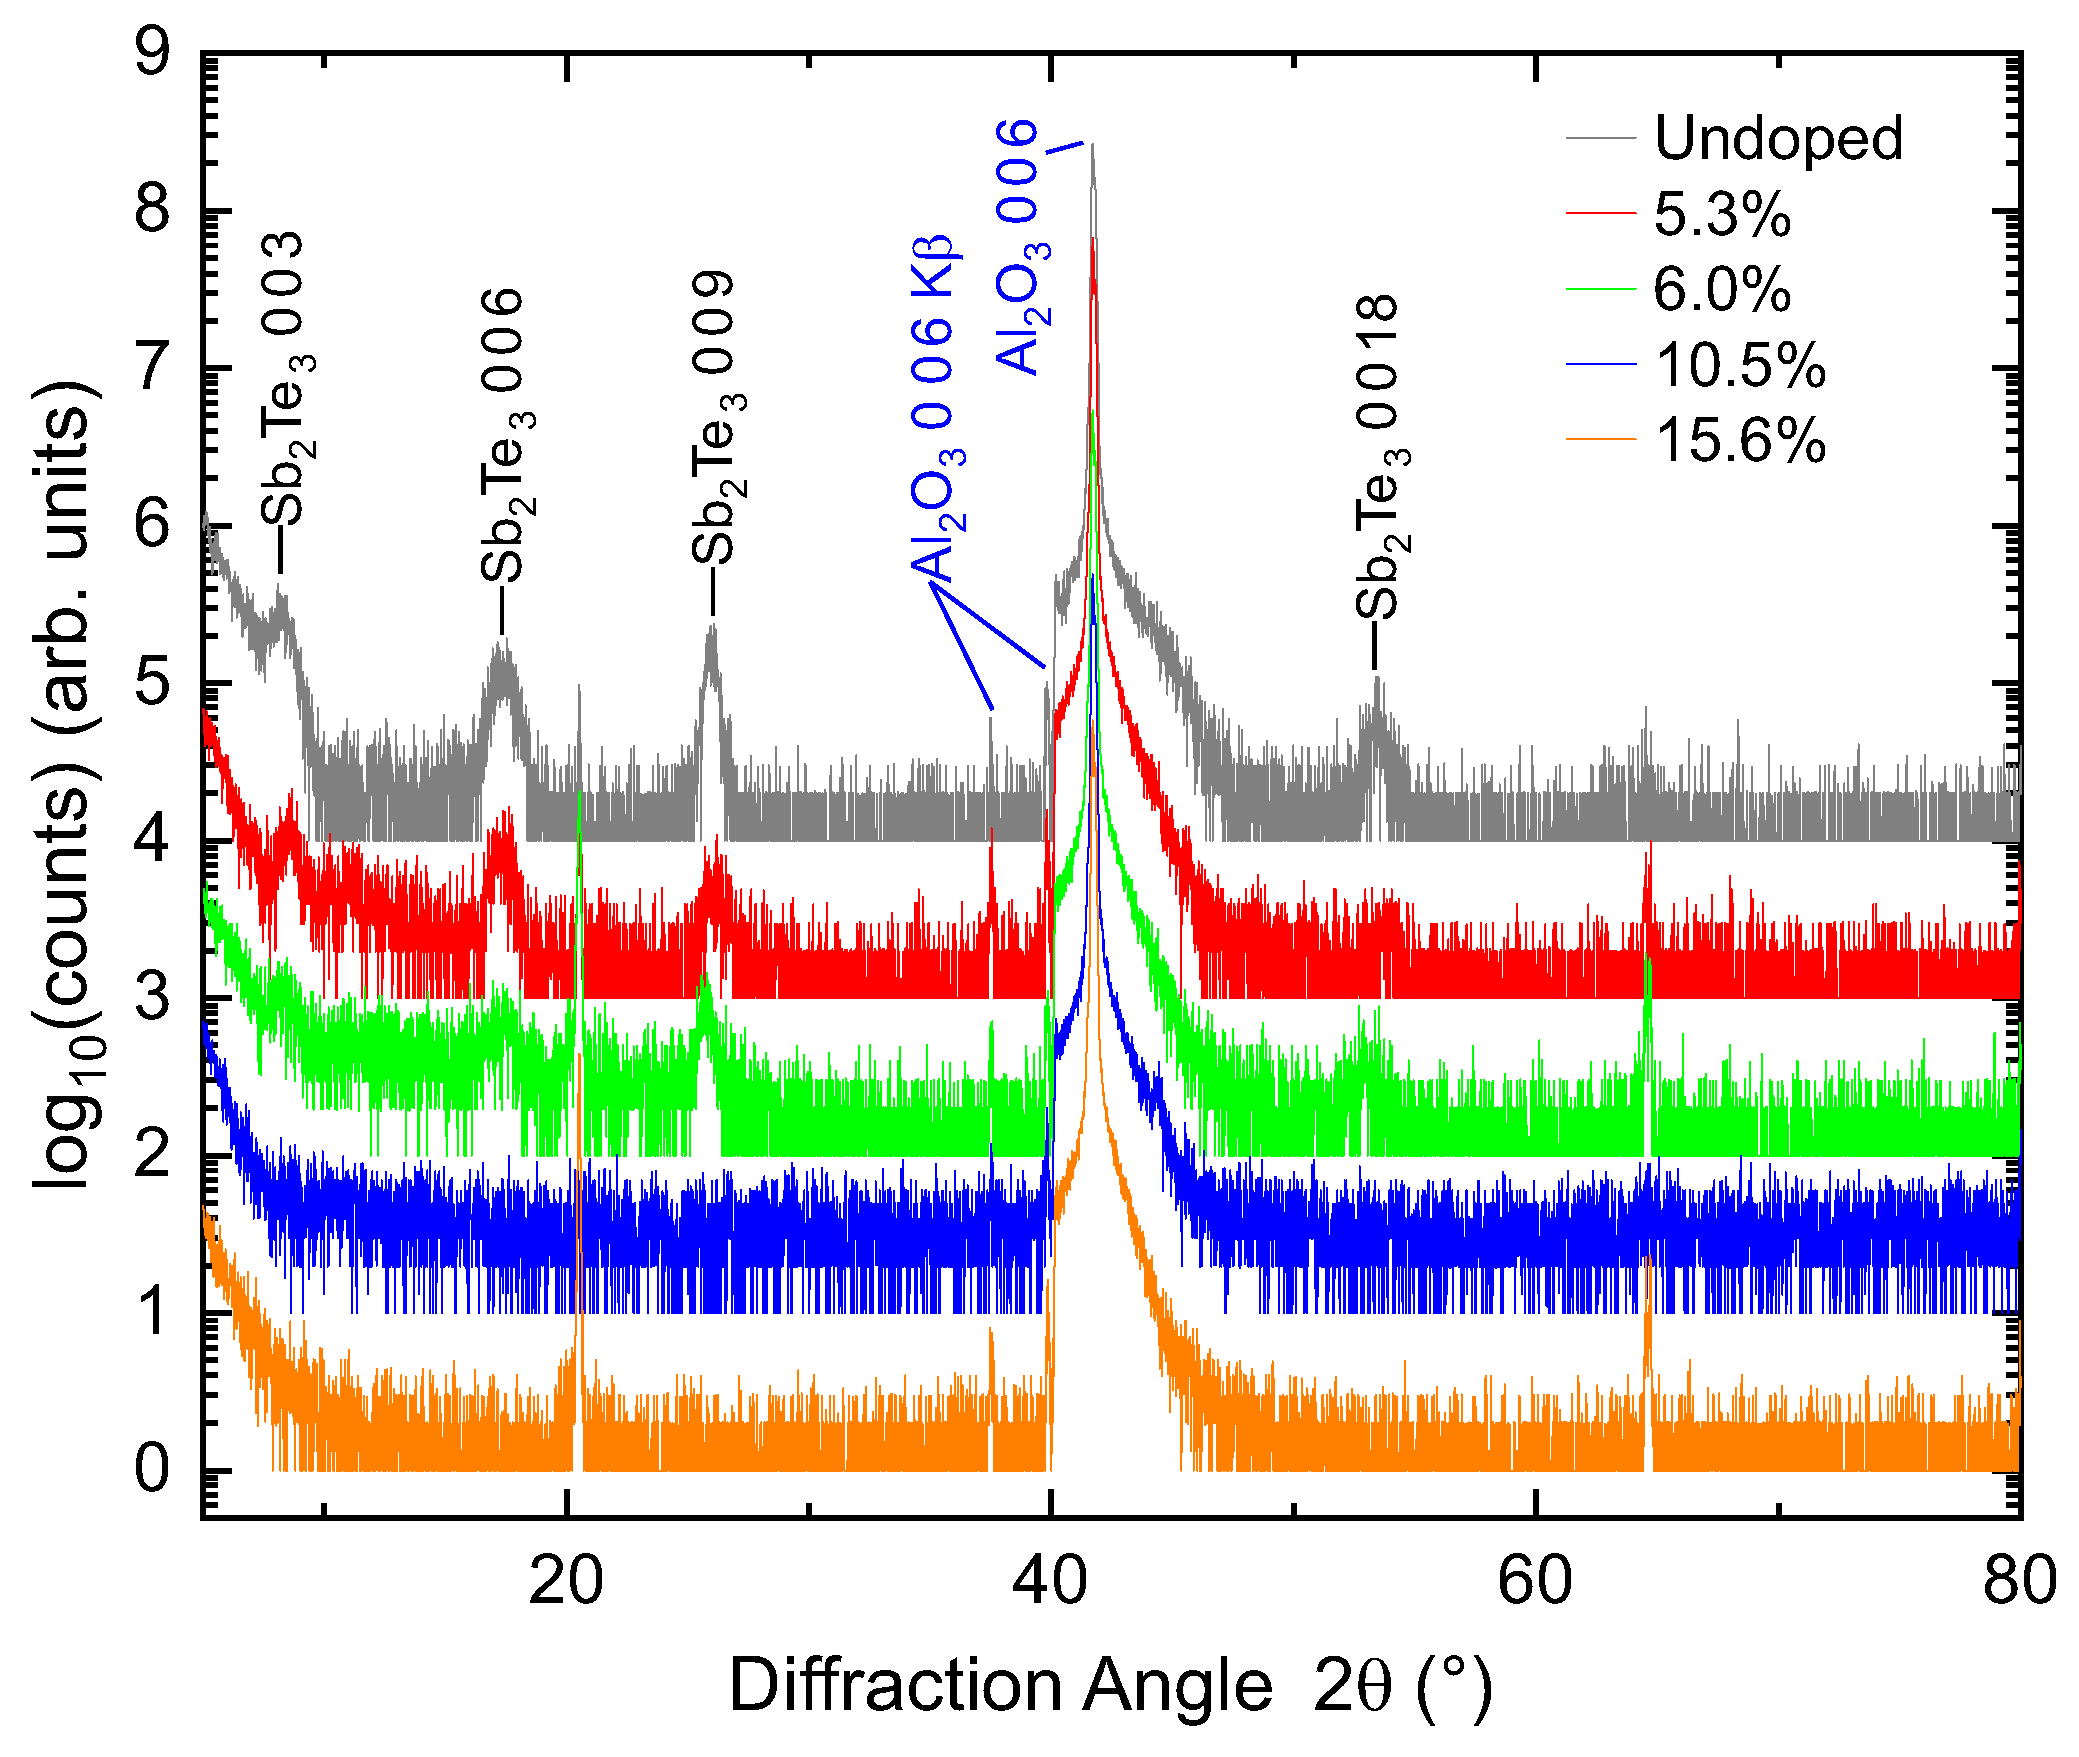
Figure 1. Out-of-plane ( θ - 2 θ ) XRD patterns for a Cr-doped Sb2Te3 thin-film series, plotted on a log intensity scale and vertically offset for clarity (top to bottom: undoped, 5.3%, 6.0%, 10.5%, and 15.6%). Pronounced Sb2Te3 ( 0 0 3 l ) reflections [ ( 0 0 3 ) , ( 0 0 6 ) , ( 0 0 9 ) , ( 0 0 18 ) ] are evident for undoped to ≲6–10% Cr, indicating c-axis-oriented growth. At ≳10% Cr, these ( 0 0 3 l ) peaks are no longer visible, consistent with a breakdown of c-plane crystallinity and the emergence of a material lacking a well-defined out-of-plane orientation.
Crystals 15 00896 g001
Figure 2. RSMs ( 2 θ versus χ ) for selected films of the Cr doping series: (a) undoped, (b) 5.3%, and (c) 15.6%. Here, χ is the sample tilt and the reflections near χ 0 ° therefore correspond to, e.g., ( 0 0 3 l ) reflections from the substrate, while the intensity at finite χ arose from off-axis reflections and tilted domain variants. The undoped and 5.3% samples showed only Al2O3 and Sb2Te3 peaks, whereas the 15.6% sample showed no Sb2Te3 peaks. Instead, peaks which could be ascribed to CrTe and Cr2Te3 phases became visible, evidencing secondary-phase formation at a high Cr content. The Sb2Te3 peaks labeled a and b could be indexed, for example, as ( 1 ¯ 1 ¯ 20 ) or ( 1 2 ¯ 20 ) and ( 1 ¯ 1 ¯ 13 ) or ( 1 2 ¯ 13 ) , respectively. Features marked 0 0 15 * and 0 0 30 * are attributed to c-axis oriented columnar domains tilted by ∼ 60 ° from the normal surface.
Crystals 15 00896 g002
Figure 3. Cross-sectional HAADF-STEM of Cr-doped Sb2Te3 films. (a,b) The 5.3% Cr film shows parallel lattice fringes consistent with c-axis-oriented quintuple layer stacking. Further, local defects are visible, as expected for nanocrystalline domains. (c,d) The 10.5% Cr film shows more diffuse contrast with no resolvable layering over comparable length scales, consistent with a breakdown of the tetradymite stacking seen at lower doping.
Crystals 15 00896 g003
Figure 4. Cross-sectional STEM and STEM-EDS compositional maps for the films of Figure 3. (a,b) STEM overview images of the 5.3% and 10.5% Cr samples, respectively (scale bars 10 nm and 5 nm). (c,e,g) Elemental maps for the 5.3% film showing Cr, Sb, and Te, respectively. A narrow, Cr-enriched band appears at mid-thickness, which coincides with a local reduction of Sb, while Te is comparatively uniform. (d,f,h) Corresponding maps for the 10.5% film, which displays less pronounced spatial fluctuations together with reduced layering contrast. (i,j) Line profiles of the relative composition extracted across the mapped fields for the 5.3% and 10.5% films.
Crystals 15 00896 g004
Figure 5. SQUID-VSM measurements of a film with a 6% Cr concentration. (a) M ( H ) loop of measured at 5 K, where a narrow open loop that does not fully saturate is visible. (b) Temperature-dependent plots of the same sample with an additional panel at the bottom showing the first-derivative d M / d T . These reveal two discontinuities, at 38 and 82 K (indicated by dashed lines), suggesting two magnetic phases within the film.
Crystals 15 00896 g005
Figure 6. Cr L 2 , 3 -edge XAS and XMCD spectra measured at 3 T and 2.5 K for the sample with nominal 6 % Cr. (a) XAS acquired in surface-sensitive TEY (red) and bulk-sensitive FY (green) detection modes, overlaid with calculations for bulk-like (light blue) and surface-oxidized Cr (purple), summing up to the total calculated XAS (dark blue). The Te M 4 , 5 edge contributed a sloping background in XAS, which has been removed in the experimental data. (b) XMCD ( μ μ + ) measured in TEY (red) and FY (green) together with the calculated spectra, again showing the bulk-like (light blue) and surface-oxidized (purple) contributions, summing up to the total calculated XMCD signal (dark blue). The TEY spectra exhibit a second peak at 578 eV on the main L 3 feature consistent with surface oxidation, whereas FY mainly tracks the bulk response of unoxidized Cr.
Crystals 15 00896 g006
Figure 7. Experimental Cr L 2 , 3 -edge XAS/XMCD, measured in TEY, of the 6% Cr sample used for sum-rule analysis. The helicity-averaged XAS ( μ + μ + ) / 2 and its energy integral (scaled by 1 / 6 for display) are plotted together with the XMCD ( μ μ + ) and its integral. The integrated areas define p (XMCD over L 3 ), q (XMCD over L 2 , 3 ), and r (XAS over L 2 , 3 ), from which m L and m S are obtained via the sum rules. For Cr, a j j -mixing correction factor C = 2.0 is applied when extracting m S , and TEY data are used for quantitative analysis as FY can suffer from self-absorption/saturation that distorts the L 2 / L 3 ratio; FY is, therefore, used only qualitatively. Background steps and Te M 4 , 5 overlap were removed as described in the Methods. The very small Te M 5 feature near ∼573.4 eV, documented for MBE-grown Cr:Sb2Te3 films [20], lay outside the used integration windows.
Crystals 15 00896 g007
Table 1. SEM-EDS analysis of the Sb2Te3 samples at different doping concentrations. There is no reliable correlation between sputter powers and concentrations, suggesting variance in growth modes or an uneven dopant distribution. The growth of the undoped reference sample followed the same temperature protocol as for the doped samples. Note that the Sb/Te ratio was not measured for the reference.
#Sputter Power (W)Concentration (at.-%)
Sb2Te3 Cr Sb Te Cr
ref30
46330439.355.45.3
46430639.254.86.0
46710337.252.510.5
46810235.948.515.6
Disclaimer/Publisher’s Note: The statements, opinions and data contained in all publications are solely those of the individual author(s) and contributor(s) and not of MDPI and/or the editor(s). MDPI and/or the editor(s) disclaim responsibility for any injury to people or property resulting from any ideas, methods, instructions or products referred to in the content.