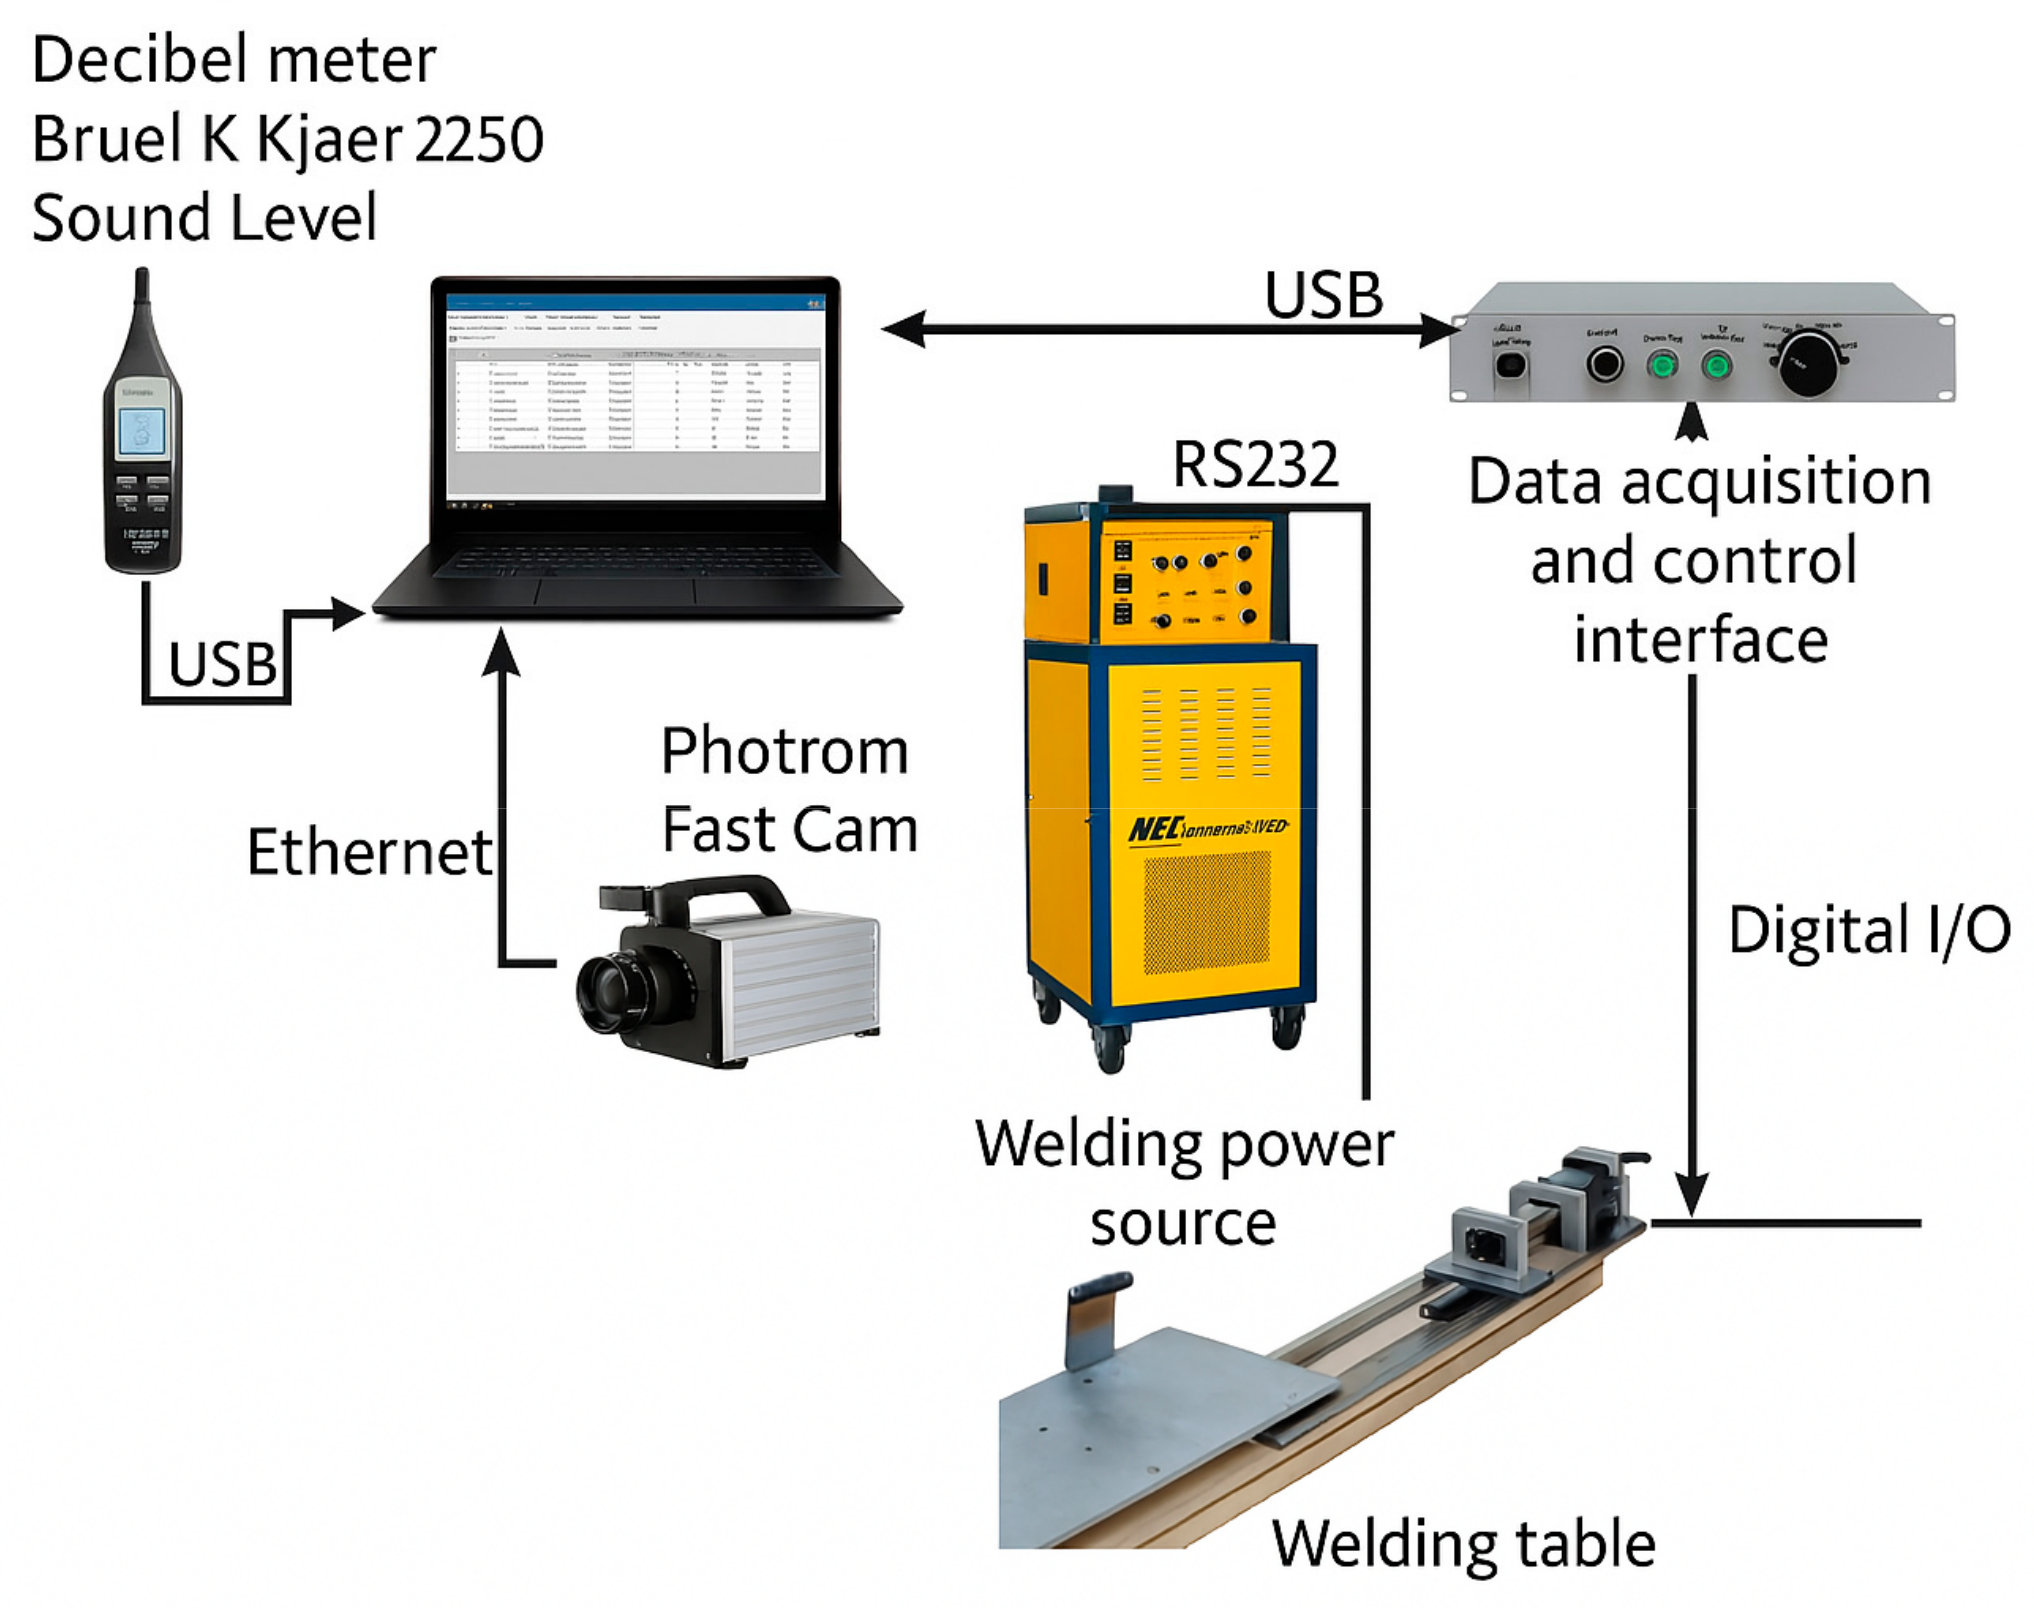
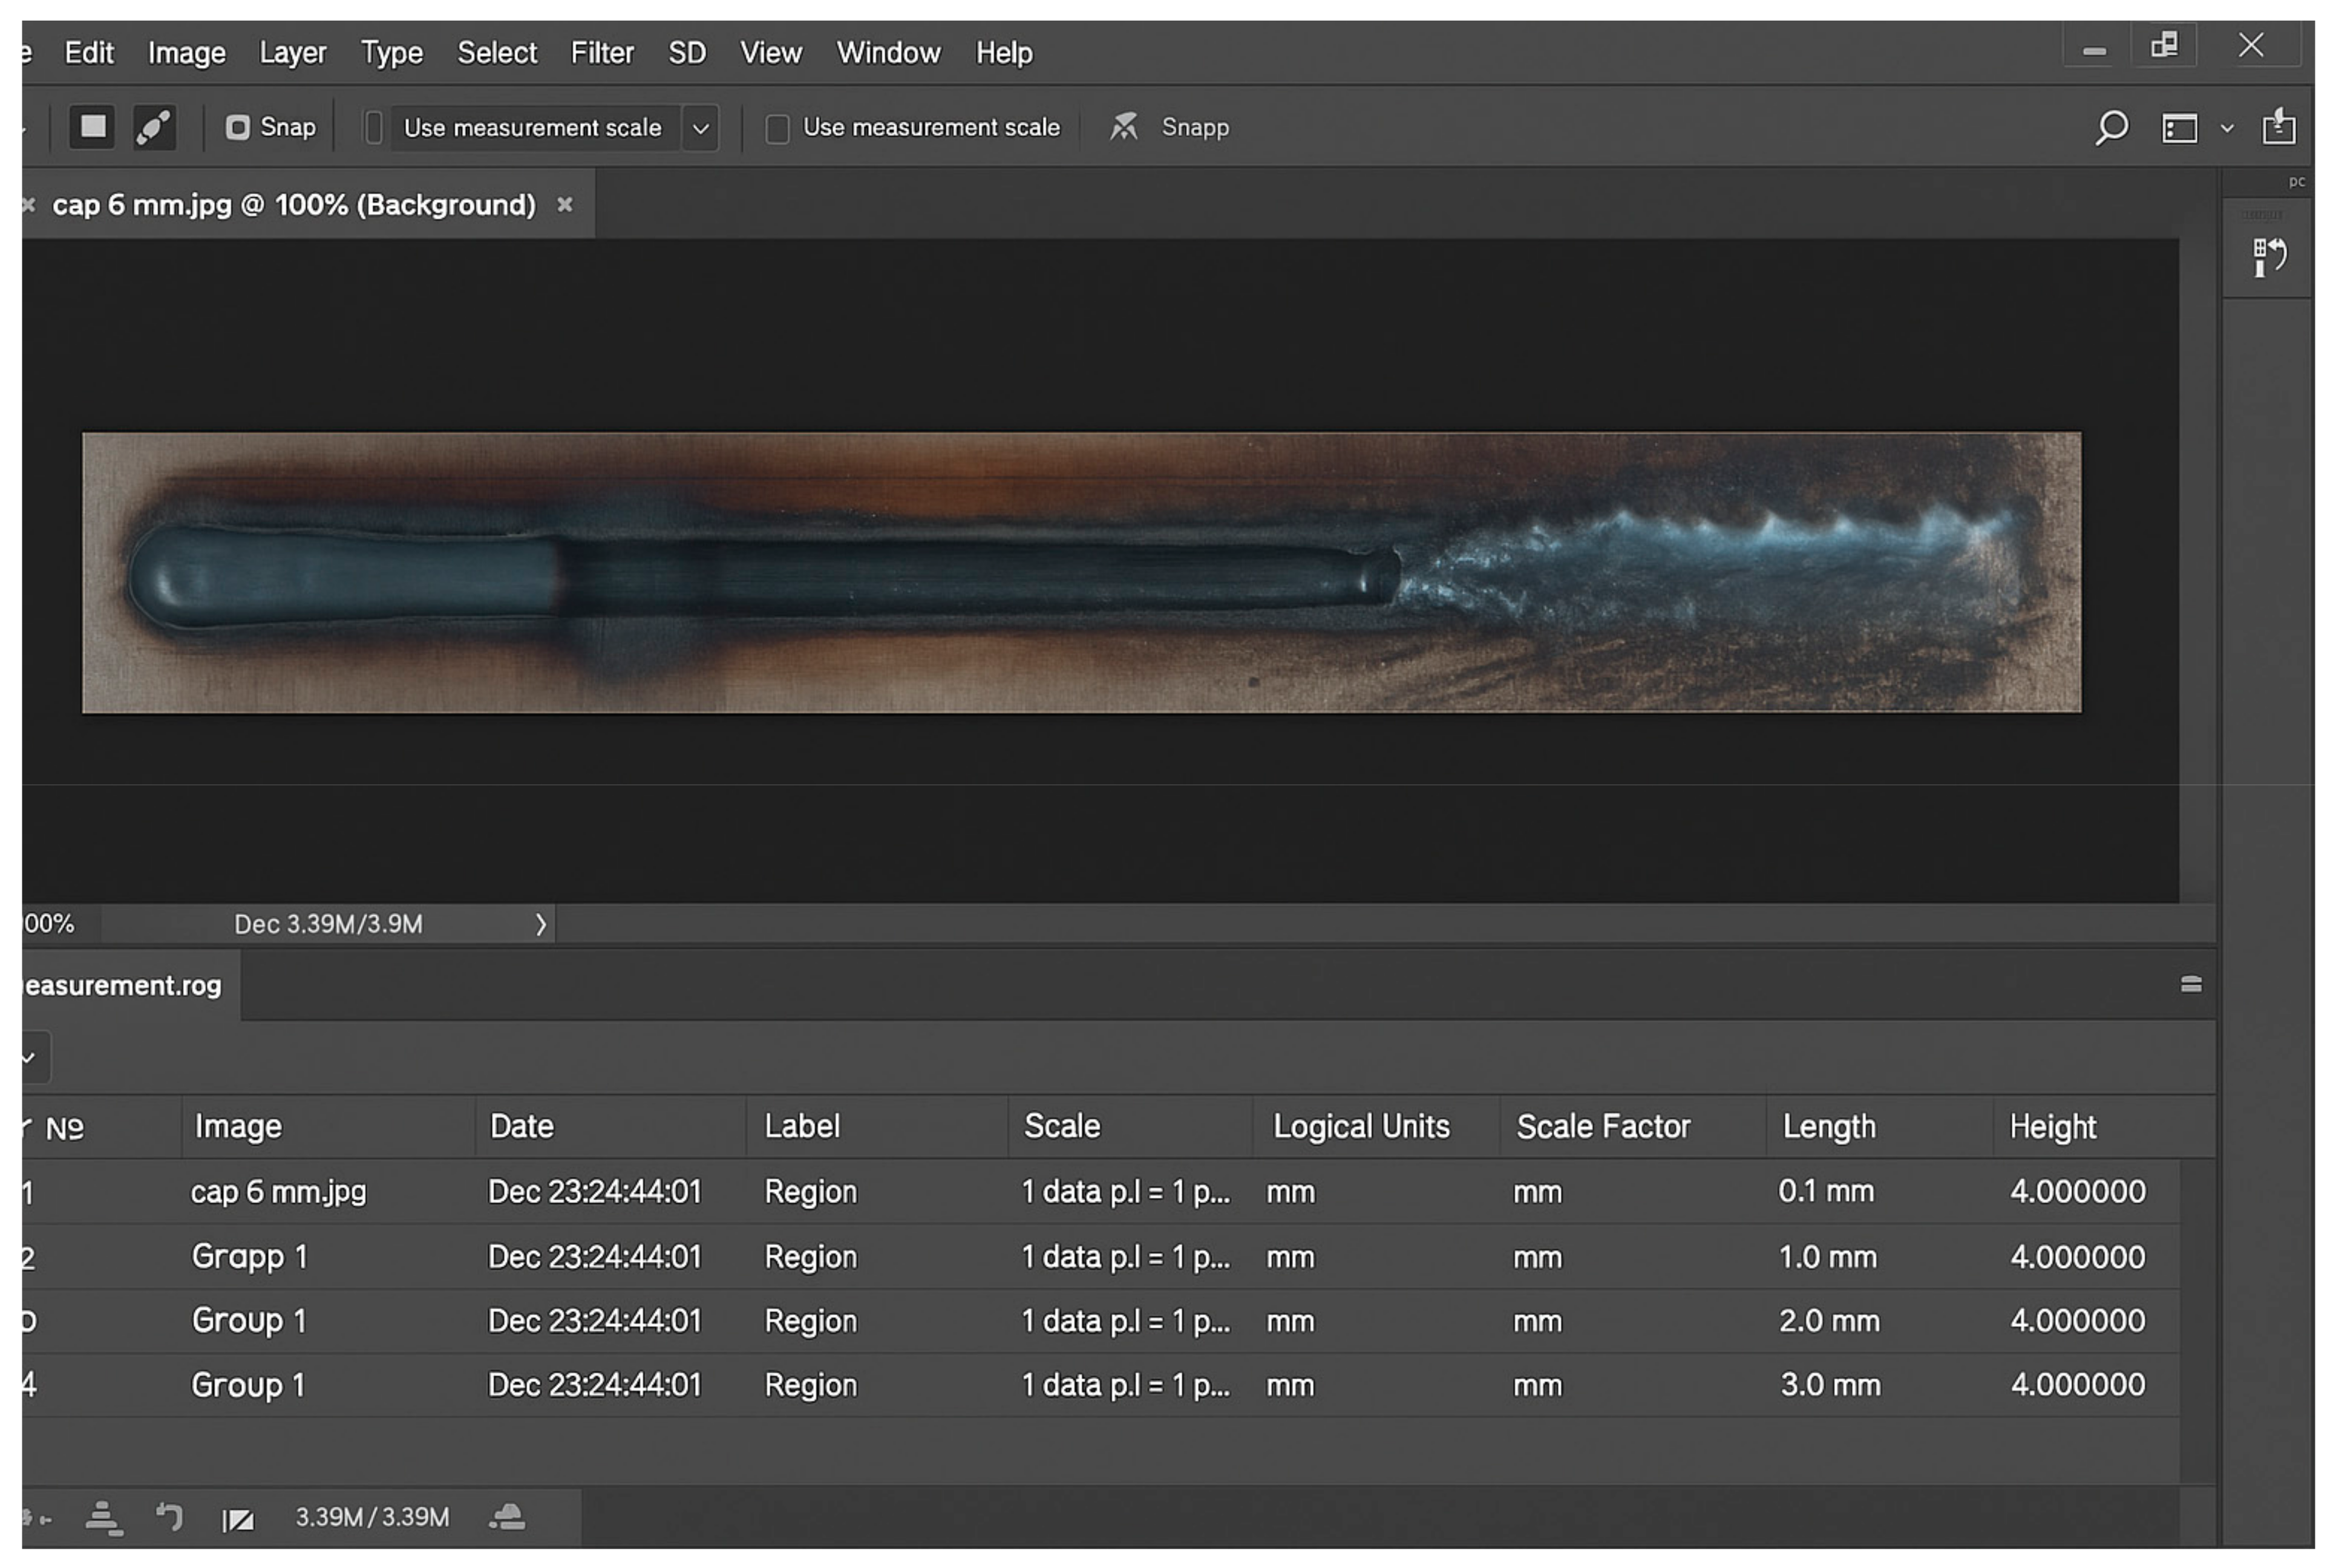
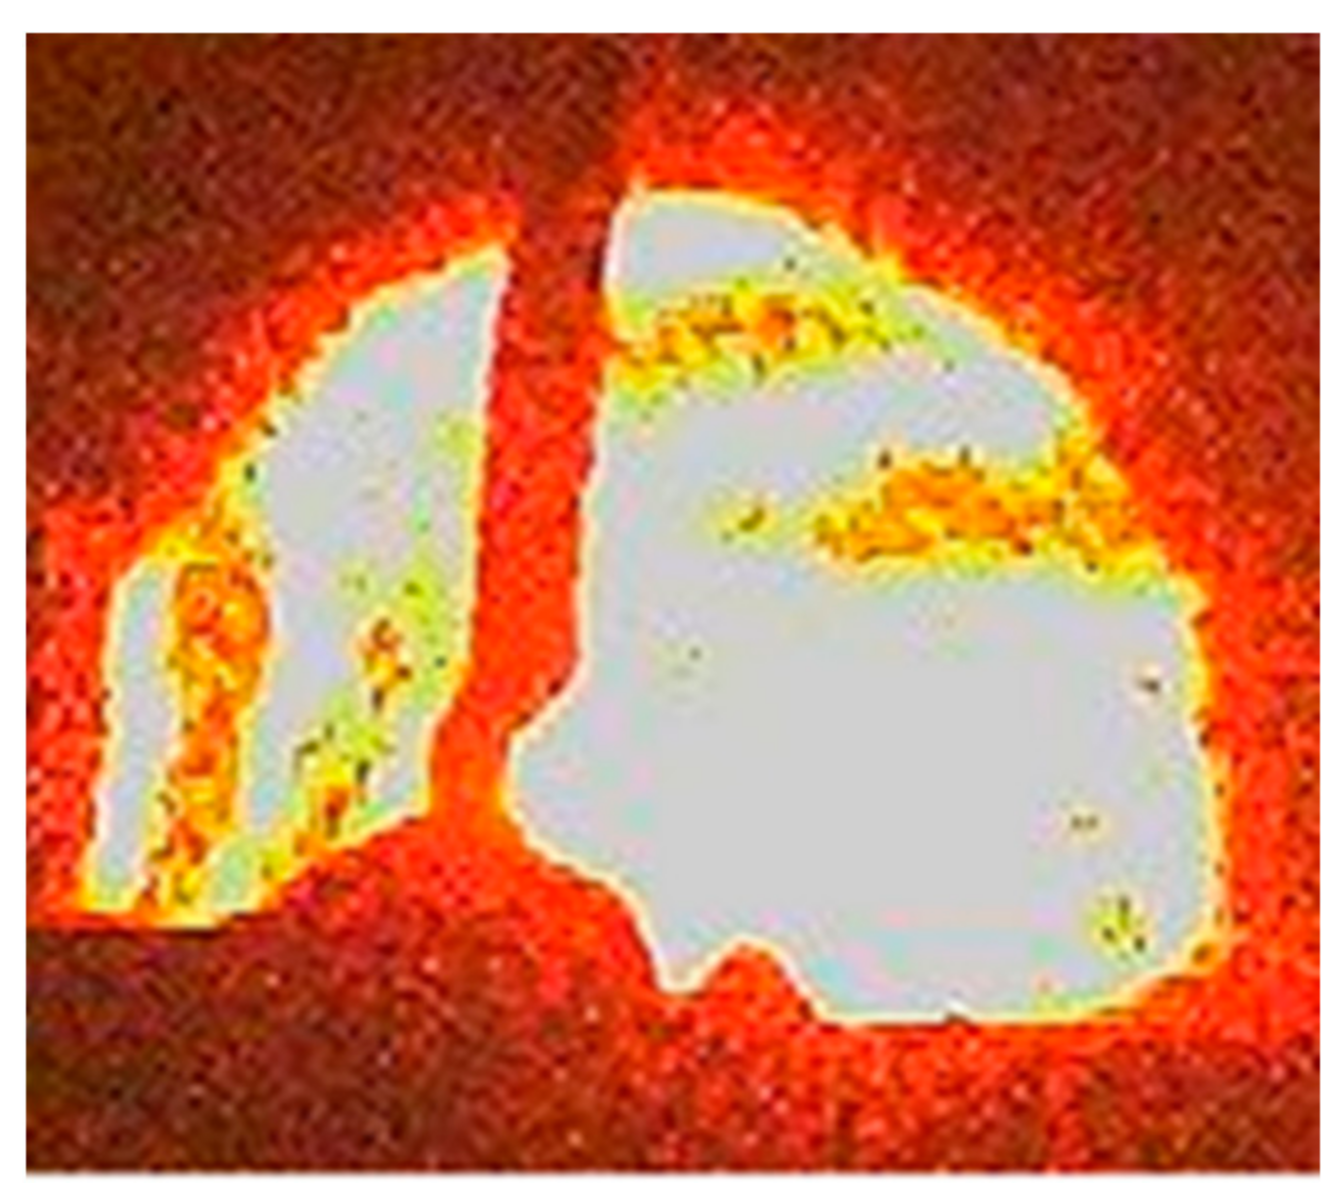
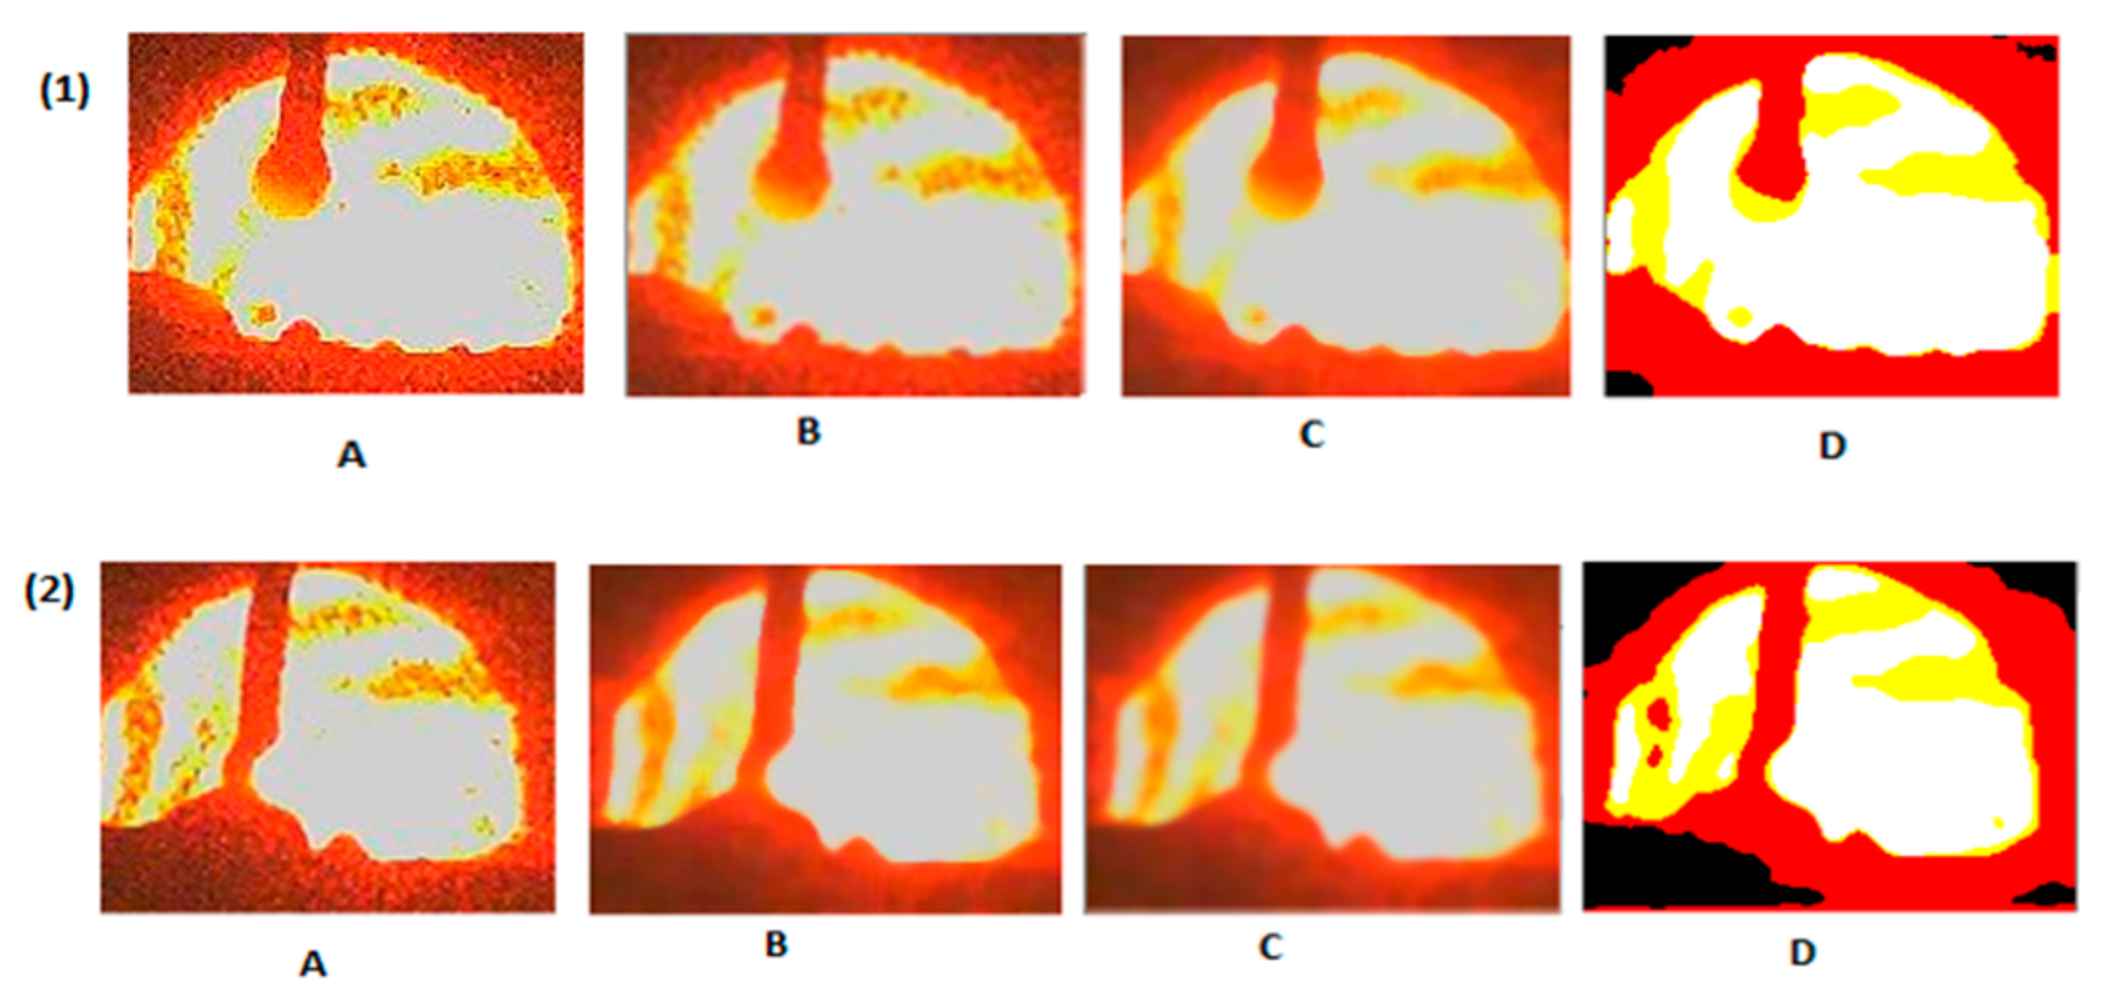
The results obtained for each experiment are presented below. The experiments were performed by changing the values of the input parameters to study the influence and dependence of those parameters on the resulting welding geometry. The acquisition frequency of current signals is 20 ms and for sound signals, it is 100 ms due to the configuration available in the equipment used.
To conduct a comprehensive statistical analysis, the collected data were divided into sections. Each section corresponds to a specific set of input parameters, ensuring stability within that range. When the input parameters changed, a new section was studied independently, enabling the analysis of output parameter variations.
For the welding data, statistical values including the mean, standard deviation, peak value, and background value were calculated at intervals of 200 ms. Similarly, for the sound data, these statistical values were calculated at intervals of 100 ms. The analysis of these statistical values provided deeper insight into the variations and characteristics of the welding and sound data.
Statistical analysis of the data involved calculating specific parameters. The background welding current (bkg) was determined as the average of all current transient samples that were less than or equal to the mean current (A_mean). Similarly, the background welding voltage (bkg) was calculated as the average of all voltage transient samples that were less than or equal to the mean voltage (V_mean). On the other hand, the peak welding current (pkv) represented the average of all current samples greater than A_mean, and the peak welding voltage (pkv) was the average of all voltage samples greater than V_mean. The time registers of the data were used to synchronize both signals according to the welded position.
Welding was performed along the sheet metal from 5 mm to 180 mm, with a fixed contact tip-to-workpiece distance of 18 mm.
3.1. Results Obtained for Tests
In the first experiment, the welding speed value remained constant, while the wire feed speed and voltage varied. In the second experiment, high voltage values were utilized to achieve the globular and spray transfer modes, with the wire feed speed also being increased. Experiment three involved systematically increasing and then decreasing the voltage and wire feed speed to model the structural differences in deposition and observe the resulting changes in geometry. Lastly, experiment four aimed to analyze the influence of increased voltage and welding speed on the welding process.
The conducted experiments revealed a direct correlation between voltage and current values, as demonstrated in Experiment 1. Increasing the voltage led to a rise in current values (as shown in
Figure 7 and
Figure 8), resulting in a greater deposition of material on the workpiece.
The behavior of the current, voltage, and sound pressure level (SPL) signals exhibited similar patterns. The current was dependent on the voltage supplied to the power source, while the SPL increased in tandem with the rising current, leading to more intense sound pressure levels. It is important to note that in
Figure 9, the frequency of peaks during transient current (Ipa) is lower than that observed in the globular transfer mode. However, in the transient current mode, the droplet detaches at a higher speed.
This behavior suggests that in short-circuit transfer mode, material transfer occurs more frequently but with smaller fluctuations in the SPL signal. In contrast, the globular transfer mode is inherently unstable due to the irregular detachment of large droplets, resulting in greater variations in the SPL signal. Consequently, the welding geometry underwent noticeable changes (
Figure 10).
Figure 11 and
Figure 12 present the geometric outcomes of the weld bead, corresponding to the conditions discussed above, and should be interpreted in the context of the electrical and acoustic behaviors shown in the preceding figures. Therefore, it is essential to carefully analyze this phenomenon to understand its impact on the overall stability of the welding process. An unstable transfer mode, such as globular transfer, can lead to irregular bead formation, inconsistent penetration, and an increased likelihood of defects, ultimately compromising the mechanical properties of the weld. Understanding these effects is crucial for optimizing welding parameters and ensuring high-quality joints.
In this context,
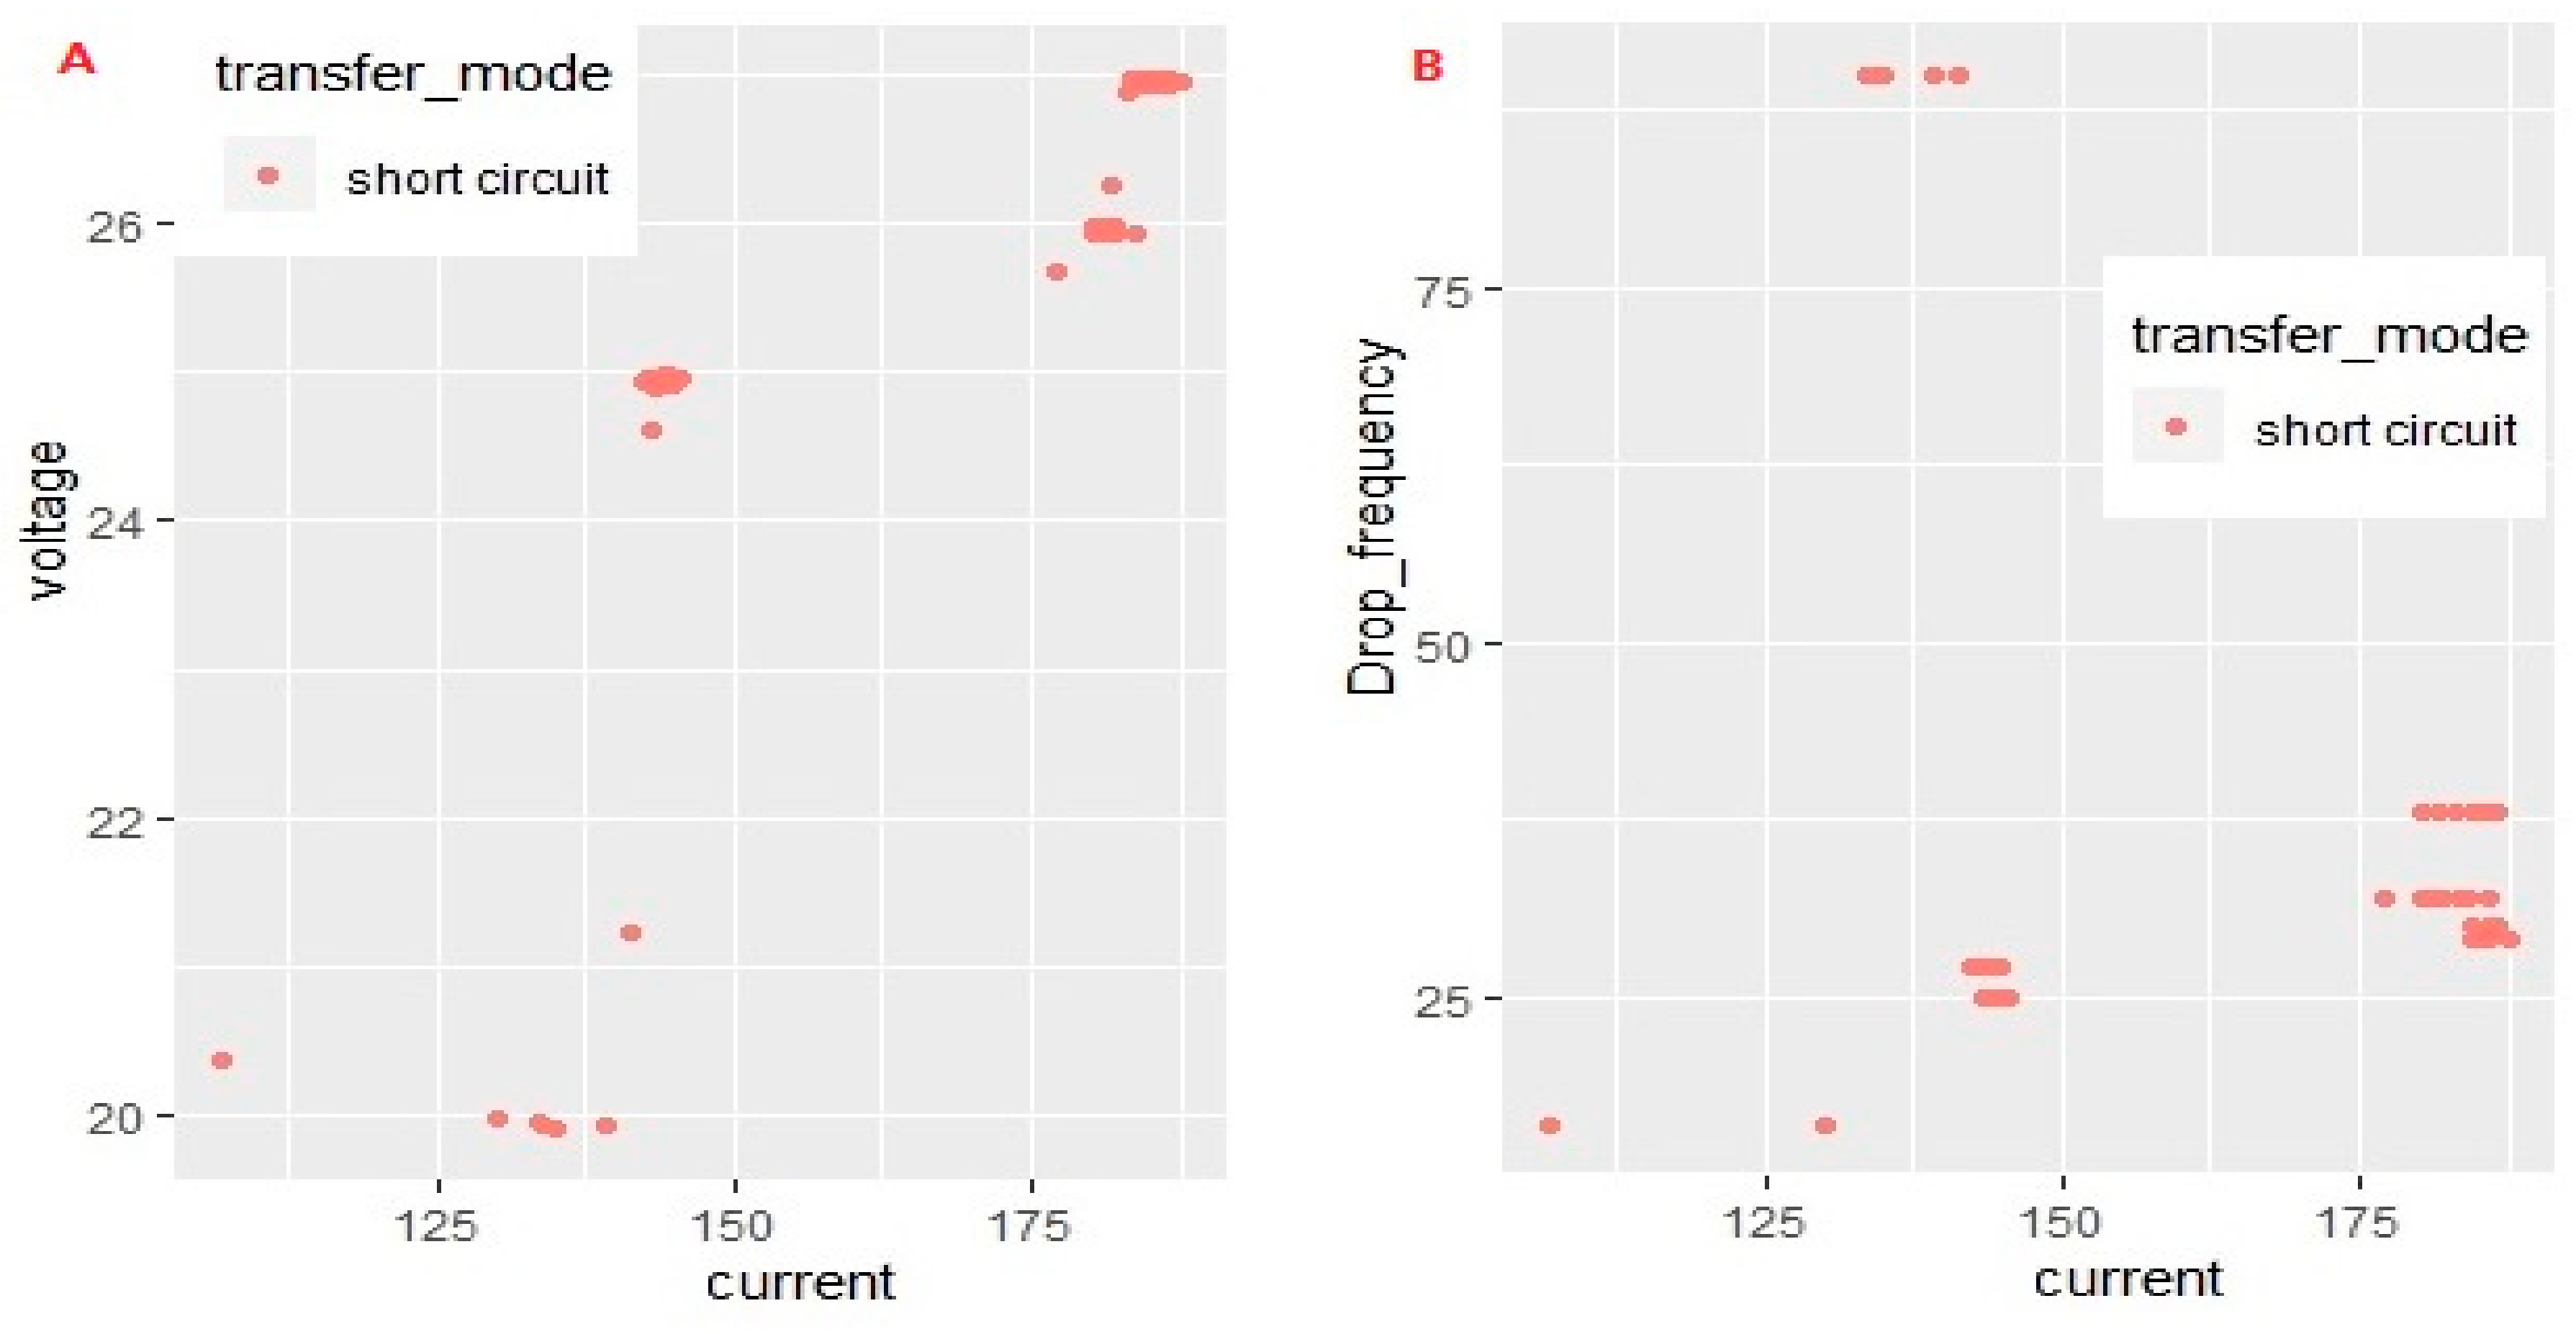
Figure 13 provides further insight by showing the transfer mode maps (A) and the droplet detachment frequency map (B). It is evident that the short-circuit transfer mode predominated under the analyzed conditions. Moreover, as the current increases, the droplet detachment frequency also tends to rise, suggesting greater arc stability and improved process efficiency.
In experiment 2, a distinct transition current mode was observed from position 50 to position 100 (as depicted in
Figure 14 and
Figure 15 respectively.). There was a significant increase in the sound pressure level (SPL) signal, reaching values of 90 dB, indicating a higher intensity of sound generated during this mode (as seen in
Figure 16). Additionally, this mode was characterized by fluctuating current values ranging from 180 to 220 A and a constant voltage of 32 V. These fluctuations in current resulted in noticeable changes in the welding geometry, as shown in
Figure 17 and
Figure 18, respectively.
Comparatively, the sound signal for the spray transfer mode exhibited lower decibel levels, with an average of 88 dB. The lower decibel levels suggest a relatively quieter sound produced during the spray transfer mode.
Furthermore, the irregularities observed in the weld bead geometry were particularly prominent in the region associated with the transition current transfer mode (as depicted in
Figure 18). These irregularities may be indicative of variations or disturbances in the welding process during this specific mode.
Figure 19 and
Figure 20 clearly illustrate the increased metal transfer observed during the experiment. This experiment was designed to vary the wire feed speed, increasing it from 6 to 8 m/min, as shown in the test parameters. Since the wire feed speed directly controls the amount of filler metal supplied, an increase in this parameter naturally results in greater metal deposition. These results confirm that the additional metal transfer and deposition are directly related to the controlled variation in wire feed speed.
In Experiment 3, an interesting phenomenon was observed when both the wire feed speed and voltage were increased, as illustrated in
Figure 21 and
Figure 22. The transition current mode exhibited a combination of exploding globular drops and fine spray droplets. This mixture of droplet sizes contributed to the fluctuations observed in the sound signal values, as shown in
Figure 23. These variations in the acoustic signal are attributed to the dynamic behavior of droplet detachment during the transition mode.
Notably, as the transfer mode shifted toward globular transfer, there was a measurable increase in the sound pressure level (SPL) in decibels. This indicates that globular transfer generates a higher intensity of sound compared to the short-circuit mode. The rise in SPL can be explained by the different droplet detachment mechanisms and the resulting acoustic characteristics inherent to globular transfer.
Overall, the findings suggest that the interaction between current, voltage, and droplet behavior directly influences the transfer mode, which in turn impacts the characteristics of the sound signal. The observations presented in
Figure 23 help elucidate the relationship between welding parameters, droplet detachment, and acoustic variations during the process. This transition in transfer mode—from short circuit to globular—led to a marked increase in both material deposition and reinforcement of the weld bead, as demonstrated in
Figure 24,
Figure 25 and
Figure 26.
Taken together, the results of Experiment 3 highlight the significant role of wire feed speed and voltage in affecting the transfer mode, weld bead geometry, and acoustic behavior in the GMAW process.
The two transfer modes identified were globular and short circuit, as shown in
Figure 27.
Finally, in Test 4, within the voltage range of 22–23 V and current range of 100–150 A (from position 0 to 60 mm), a mixed transfer mode combining both globular and short-circuit characteristics was observed, as demonstrated in
Figure 28 and
Figure 29. This combination resulted in a high occurrence of splashes, as reflected in the sound pressure level signal as shows in
Figure 30.
During the initial 60 mm of the weld in experiment 4, it was observed that a decrease in welding speed and an increase in voltage resulted in an irregular welding geometry, as depicted in
Figure 31 and
Figure 32. Specifically, a welding speed below 8 mm/s was found to cause instability, leading to a highly unstable transfer mode characterized by a mixture of globular and short-circuit transfer.
Additionally, with a decrease in voltage and an increase in welding speed (positions 60–120), a thinner weld bead was obtained, demonstrate in
Figure 33. This suggests that the manipulation of voltage and welding speed influences the geometry of the weld bead.
Overall, the findings from experiment 4 emphasize the impact of welding speed, voltage, and current on the transfer mode, welding geometry, and the occurrence of splashes in the GMAW process.
A mixture of globular and short-circuit transfer modes (transitional current) results in significant spatter, which is reflected in the sound pressure level signal. This transfer mode occurred due to the low wire feed speed. Additionally, other relationships were identified, such as increased current associated with higher wire feed speeds and greater welding speeds (see
Figure 34).
The text continues here.
The conducted experiments aimed to identify stable and unstable areas by varying the welding parameters. While the changes in parameters resulted in structural variations in the geometry of the welded bead, it is important to note that irregularities were not necessarily present in all welded sections. Each section underwent individual analysis to assess its stability. The findings and characteristics of the experiments are outlined below.
Table 1 provides a comprehensive overview of the mean and standard deviation values for each calculated parameter. Notably, the standard deviation of sound pressure values exhibited a distinct pattern. As the current increased and changes occurred in the geometry of the weld bead, the standard deviation of sound pressure values consistently decreased. This observation highlights the effectiveness of the sound signal in detecting these changes and its potential as a valuable indicator of welding stability. In particular, the sound signal demonstrated a notable decrease in standard deviation values, often approaching 2, during instances where parameters varied.
3.2. Influence of Metal Transfer Modes on Sound Pressure Levels
This section aims to clarify how the decibel levels are affected by the type of metal transfer mode and provide a deeper understanding of the acoustic characteristics associated with each mode.
The spray transfer mode exhibited relatively lower decibel levels, with an average of 88 dB. This suggests that the sound produced during the spray transfer mode is quieter compared to other modes. The reason behind this lower SPL can be attributed to the smaller and more consistent droplet detachment process in this mode, which generates less turbulence and, consequently, a less intense sound.
On the other hand, when transitioning to the globular transfer mode, a significant increase in SPL was observed. In this mode, the decibel levels increased, indicating a higher intensity of sound. The globular transfer mode involves larger droplet detachment, which leads to a more turbulent interaction between the molten metal and the weld pool, thereby producing a more intense sound. The higher SPL is a direct result of the increased energy and larger droplets associated with globular transfer, as opposed to the finer and more controlled droplets of the spray transfer mode.
Additionally, when comparing the sound levels in different phases of the welding process, the decibels recorded during closed-arc conditions—both before the process starts and after it finishes—ranged between 60 and 70 dB. These lower values are consistent with the absence of active metal transfer as the sound generated by the welding arc is minimal in these phases.
In contrast, during open-arc welding, the SPL averaged between 80 and 90 dB, indicating the presence of an active arc and metal transfer. This range is typical of welding processes where the arc is stable but not as turbulent as in modes like globular transfer.
Finally, during moments of high instability in the welding process, the SPL increased significantly, with values reaching up to 94 dB, as observed during Test 4 (positions 5 to 55). These high levels of instability likely correspond to irregular droplet detachment, arc instability, and fluctuations in the molten pool, all of which contribute to a more intense and variable sound signal.
In conclusion, monitoring the decibel levels during welding can provide valuable insights into both the type of metal transfer being used and the occurrence of instability in the process. By tracking the sound intensity, we can identify whether the process is operating in spray or globular transfer mode and, more importantly, pinpoint moments of high instability that could affect the quality of the weld. These findings suggest that acoustic monitoring can be an effective tool for the real-time assessment and optimization of welding processes.
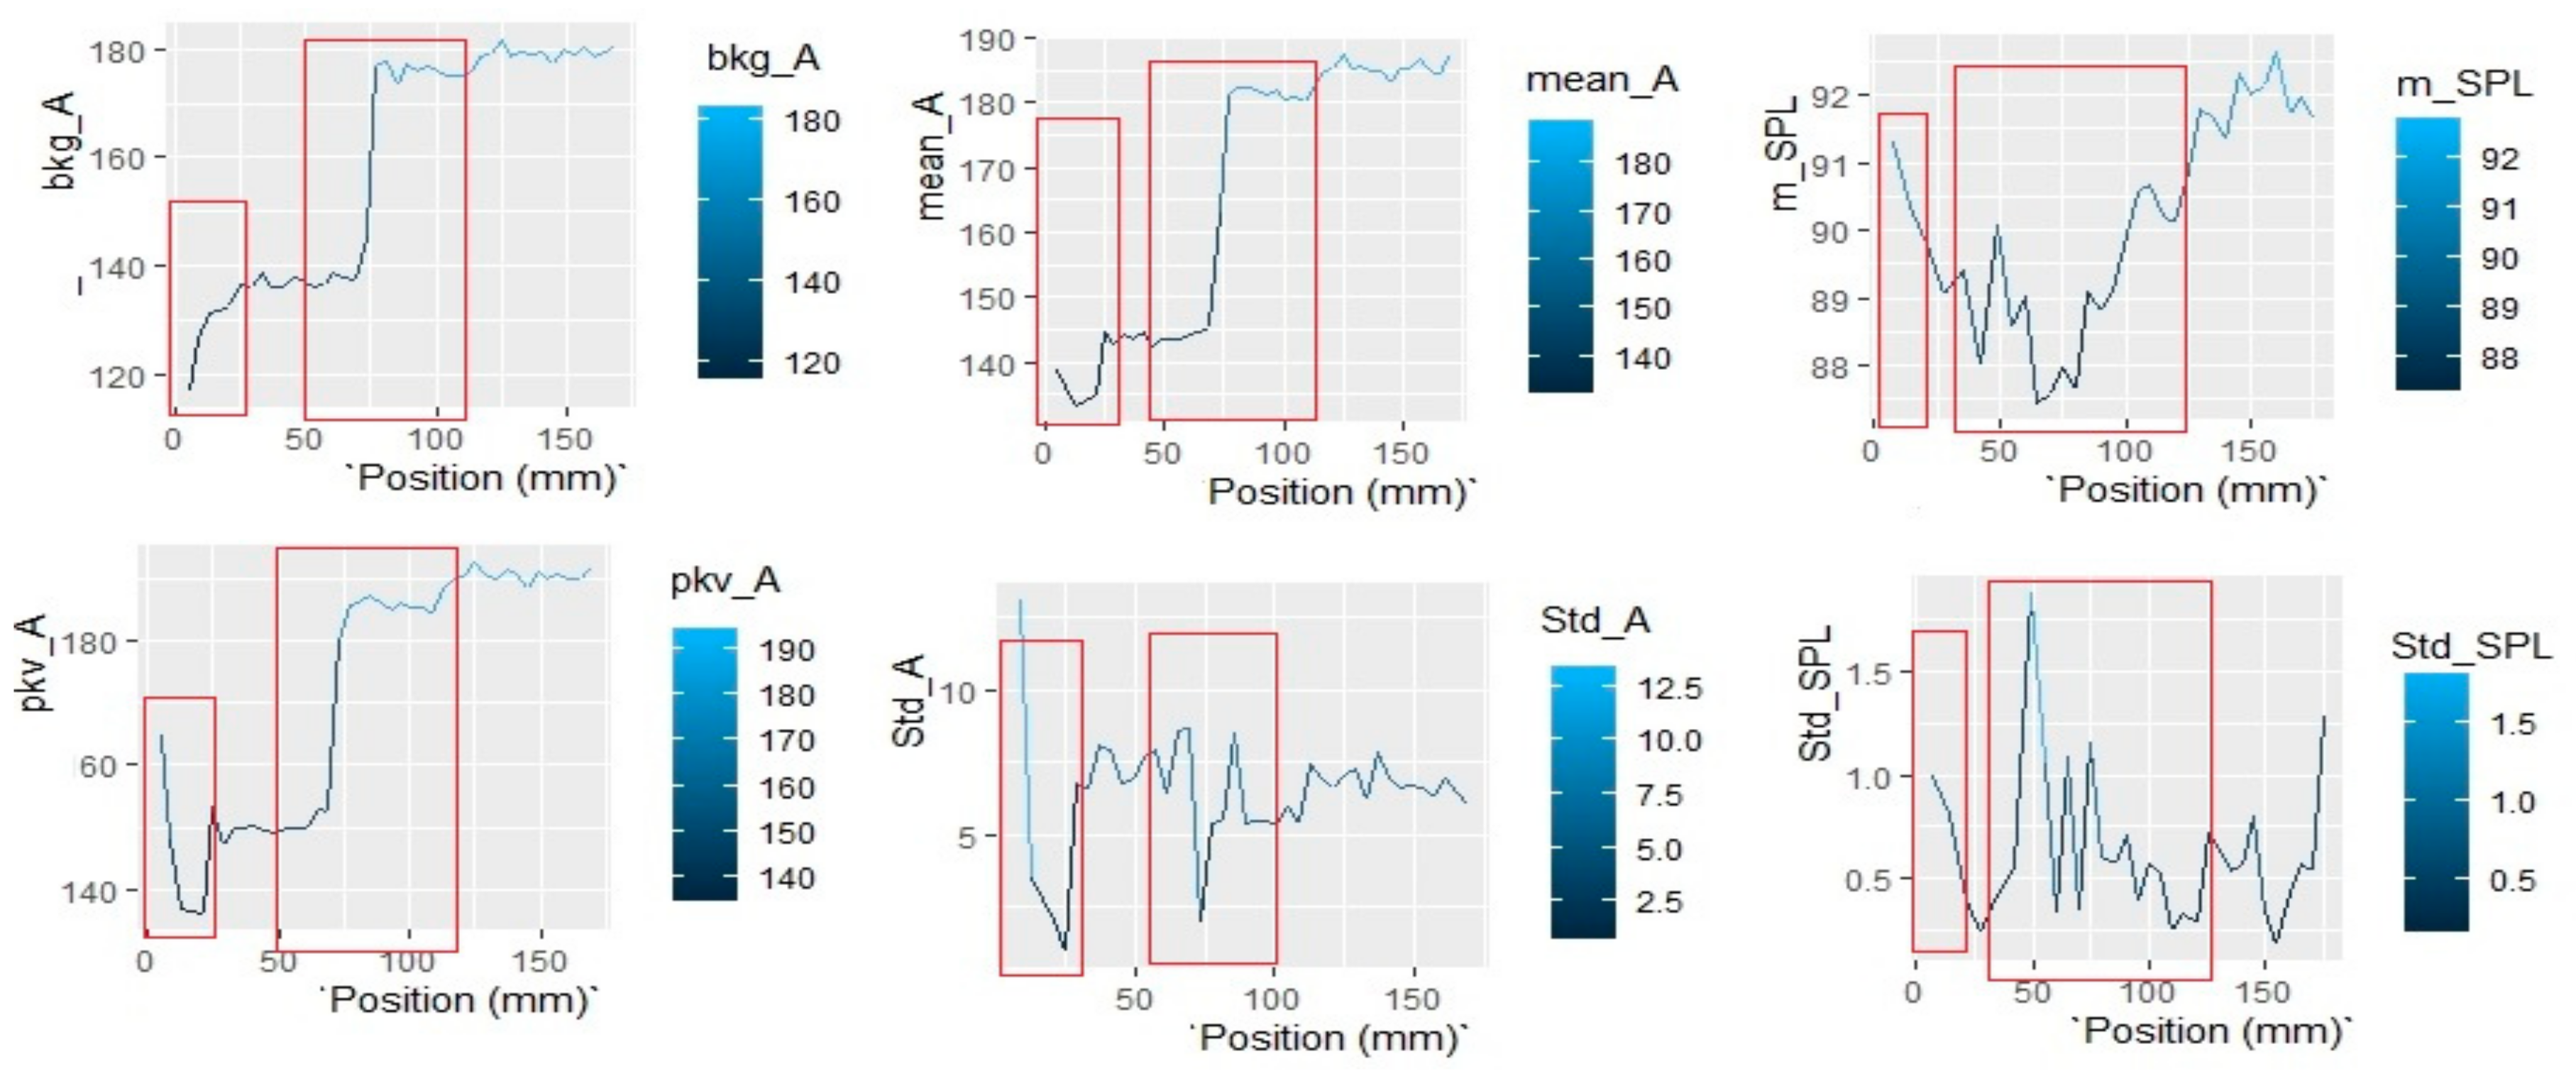
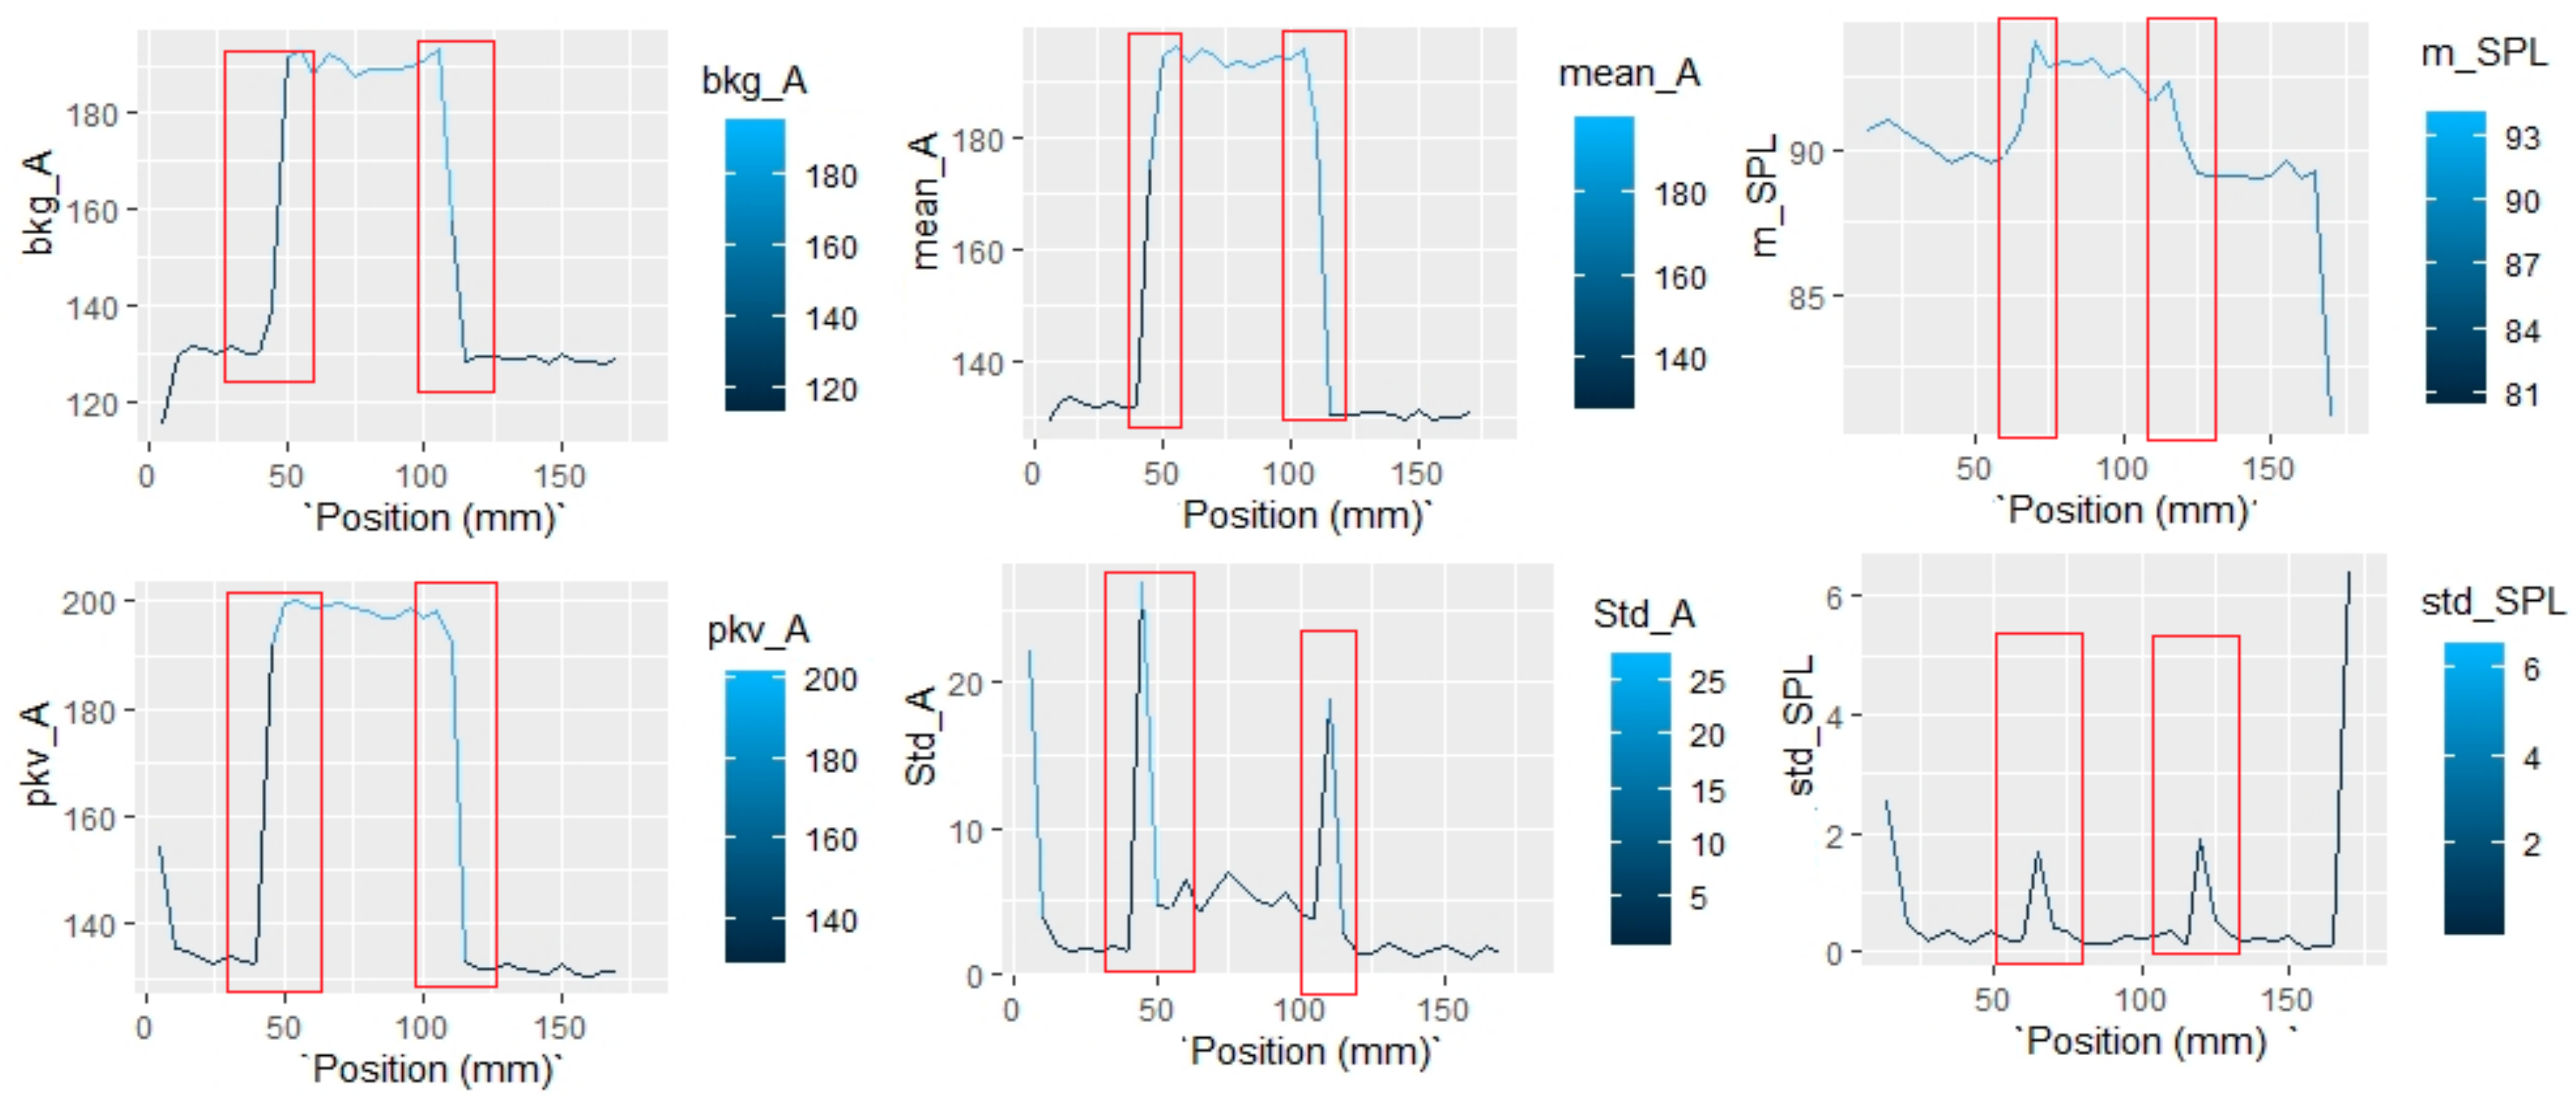
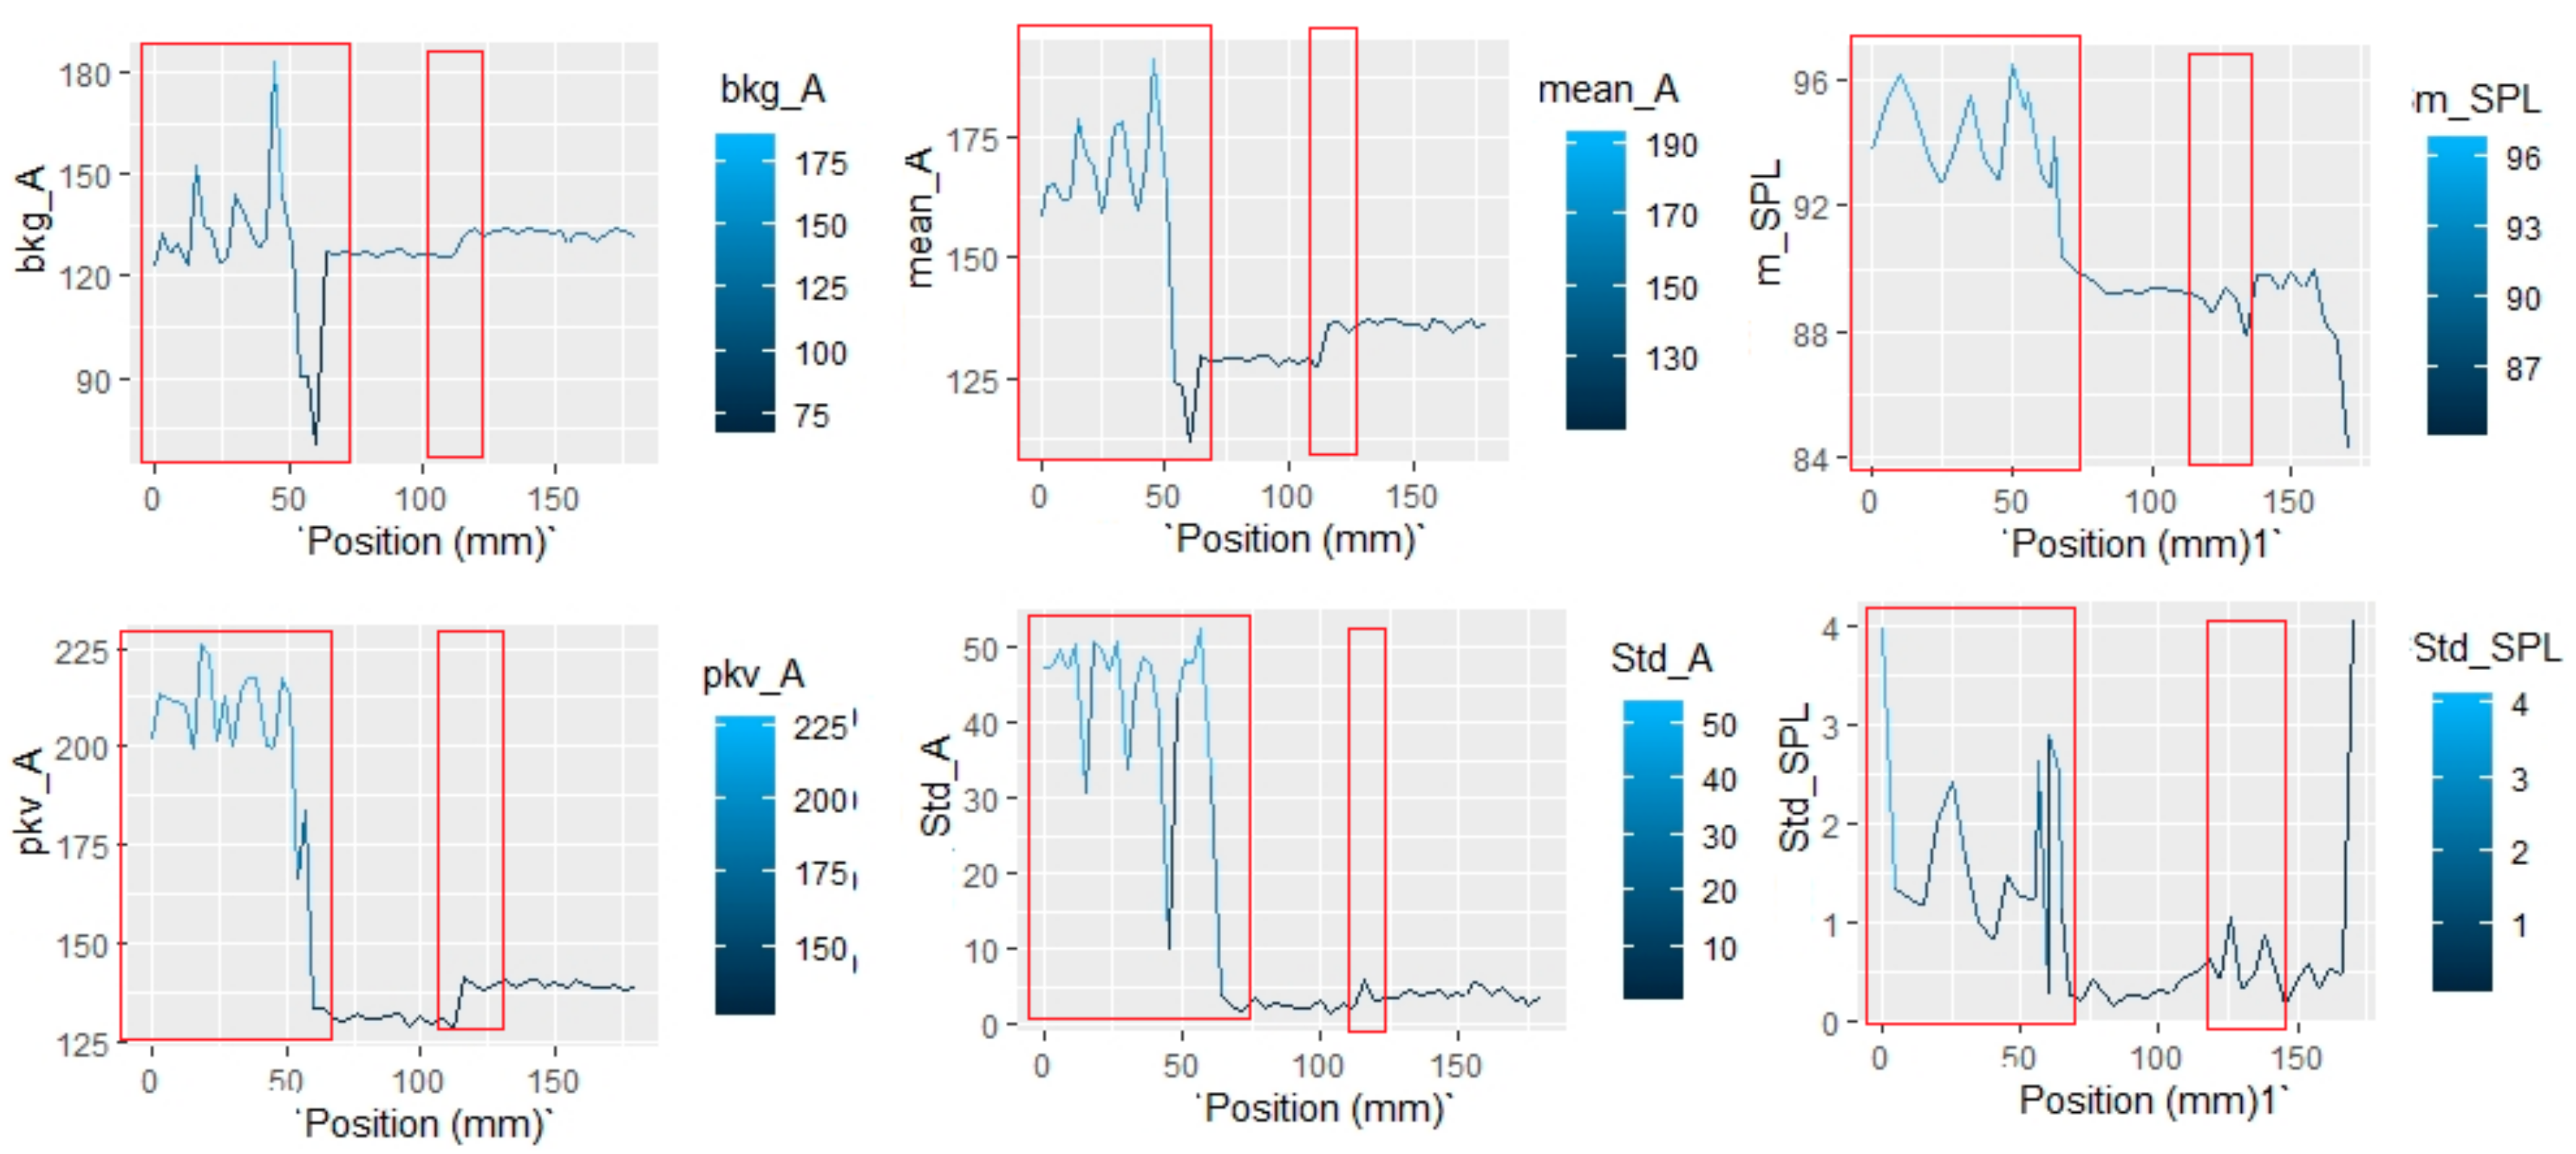
Statistical sequential graphs are presented, illustrating the evolution of key parameters along the welded sections. These include:
bkg_A: background current (A)
pkv_A: peak current value (A)
std_A: standard deviation of the current
mean_A: mean current
m_SPL: mean sound pressure level (dB)
std_SPL: standard deviation of the sound pressure level (dB)
These graphs provide a detailed visualization of how electrical and acoustic signals behave throughout the welding process. The red boxes in the figures highlight regions of instability, characterized by sudden changes in signal behavior and corresponding geometric irregularities in the weld bead, such as lack of fusion and excessive spatter.
It was observed that each welded section tended to reach a state of stability when the welding parameters remained constant. However, when the parameters varied, the sound signal effectively captured these transitions, as indicated by increased standard deviation values—often approaching or exceeding 2 units of standard deviation in the SPL signal (see
Figure 35 Std_SPL graph).
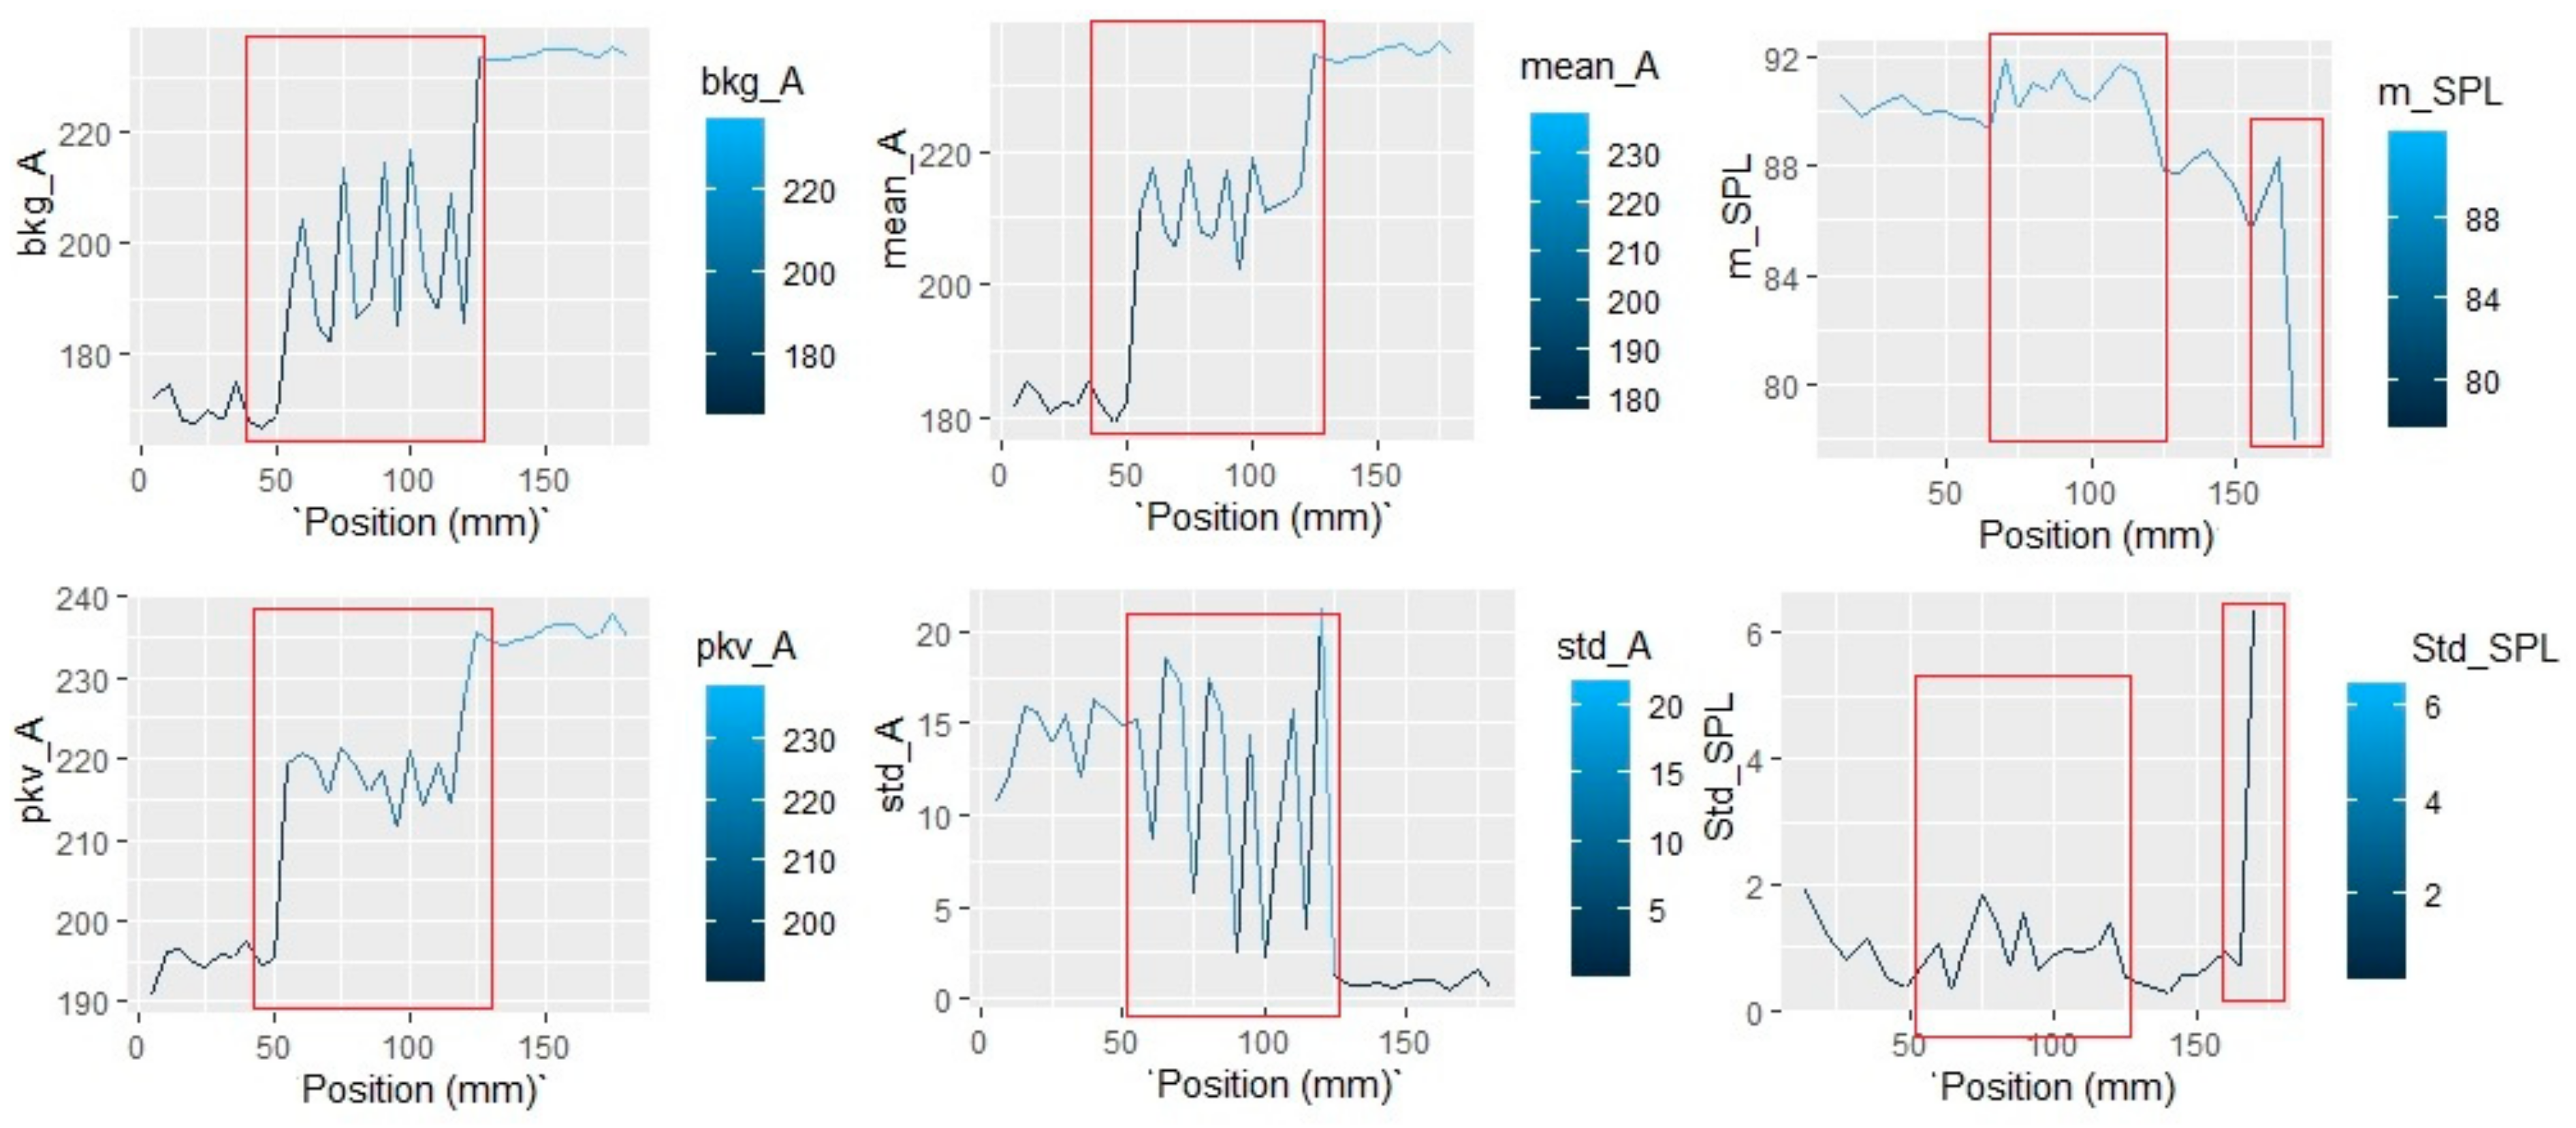
An interesting observation can be made regarding experiment 2 (
Figure 36), where the mean current in the area associated with the transition current exhibited a standard deviation exceeding 20.00. This high standard deviation value, surpassing the threshold of 15, signifies significant variations. Furthermore, an increase in the standard deviation of sound pressure values, approaching two, was indicative of changes in the weld bead’s geometry. The subsequent decrease in the SPL graph’s values towards the end of the process corresponds to the closing of the arc.
In experiment 3, a notable trend emerged as the standard deviation for the variables remained relatively low, indicating stable values in the corresponding areas. The observed variations in the sequential graphs presented in
Figure 37 were primarily attributed to the fluctuations in voltage and wire feed speed.
In Test 4, the statistical signals exhibited irregular patterns, particularly at the positions where transitional current occurred (see the highlighted area in
Figure 38). These regions coincide with moments of high instability and are associated with average SPL values of approximately 94 dB—significantly higher than the 80–90 dB typical of stable open-arc conditions, and much higher than the 60–70 dB observed during closed-arc moments before ignition and after the process ends.
In summary, these experimental findings emphasize the importance of analyzing stability states and detecting changes in welding parameters. The sound signal, in particular, proves to be a valuable tool for identifying variations in the welding process and can be used to assess stability and irregularities, with standard deviation values serving as reliable indicators.
In conclusion, the statistical indicators—especially the standard deviations of current and SPL—proved to be effective tools for identifying instability in the welding process and correlating electrical and acoustic behavior with weld quality.
The value ranges that cause instability are given in
Table 2.
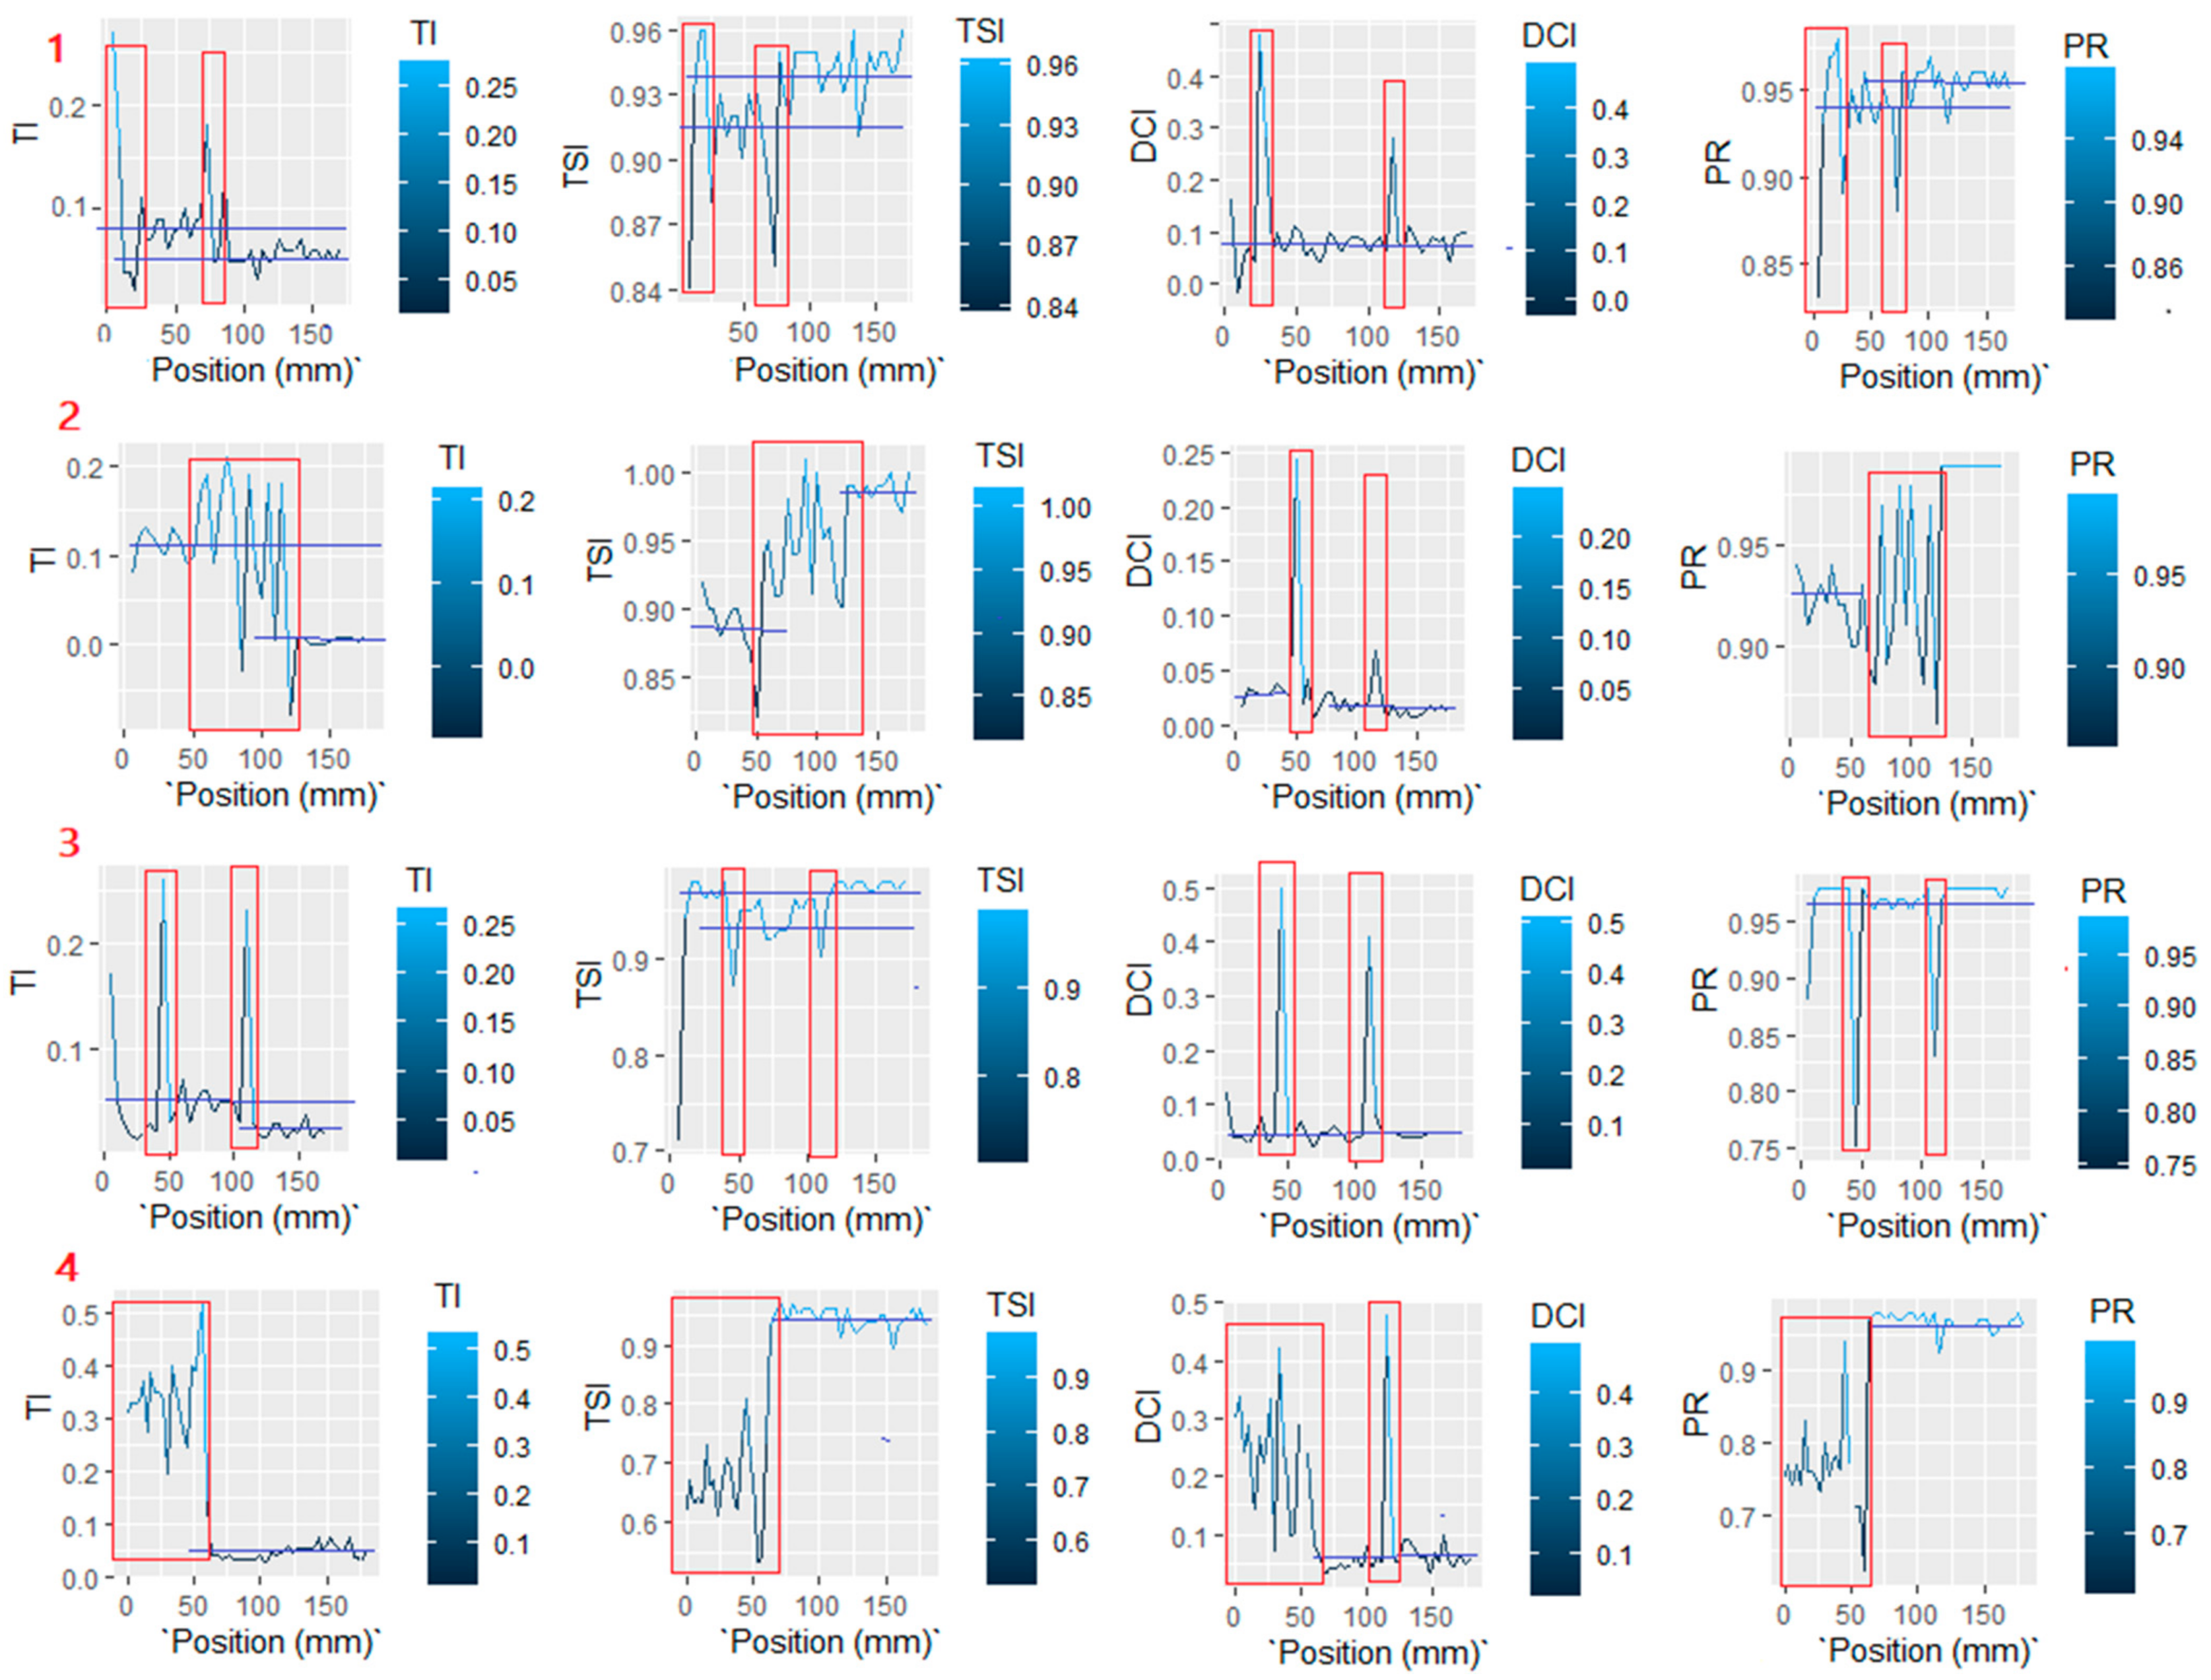
Subsequently, indices proposed in the literature by [
8] were calculated (see
Figure 39) to support the conclusions obtained in our work. The Transfer Stability Index (TSI) and Transfer Index (TI) were proposed for classifying stability based on the current waveform, while the DCI was based on the voltage waveform. Finally, the Power Ratio (PR) allows for combining current and voltage signal characteristics to monitor stability.
With the results obtained for the calculated indicators, we can conclude that instances of instability can be identified (instability moments highlighted in red). Note that the DCI value reflects the times when changes in the input voltage values were made. For TI, TSI, and PR values, It is possible to identify the moments when changes in the input parameters occur and when transition current zones are present. The transition current is observed in Experiment 2 (positions 55 to 125) and Experiment 4 (positions 0 to 60).
Table 3 summarizes the intervals in which stability and instability are presented in the experiments for each indicator.
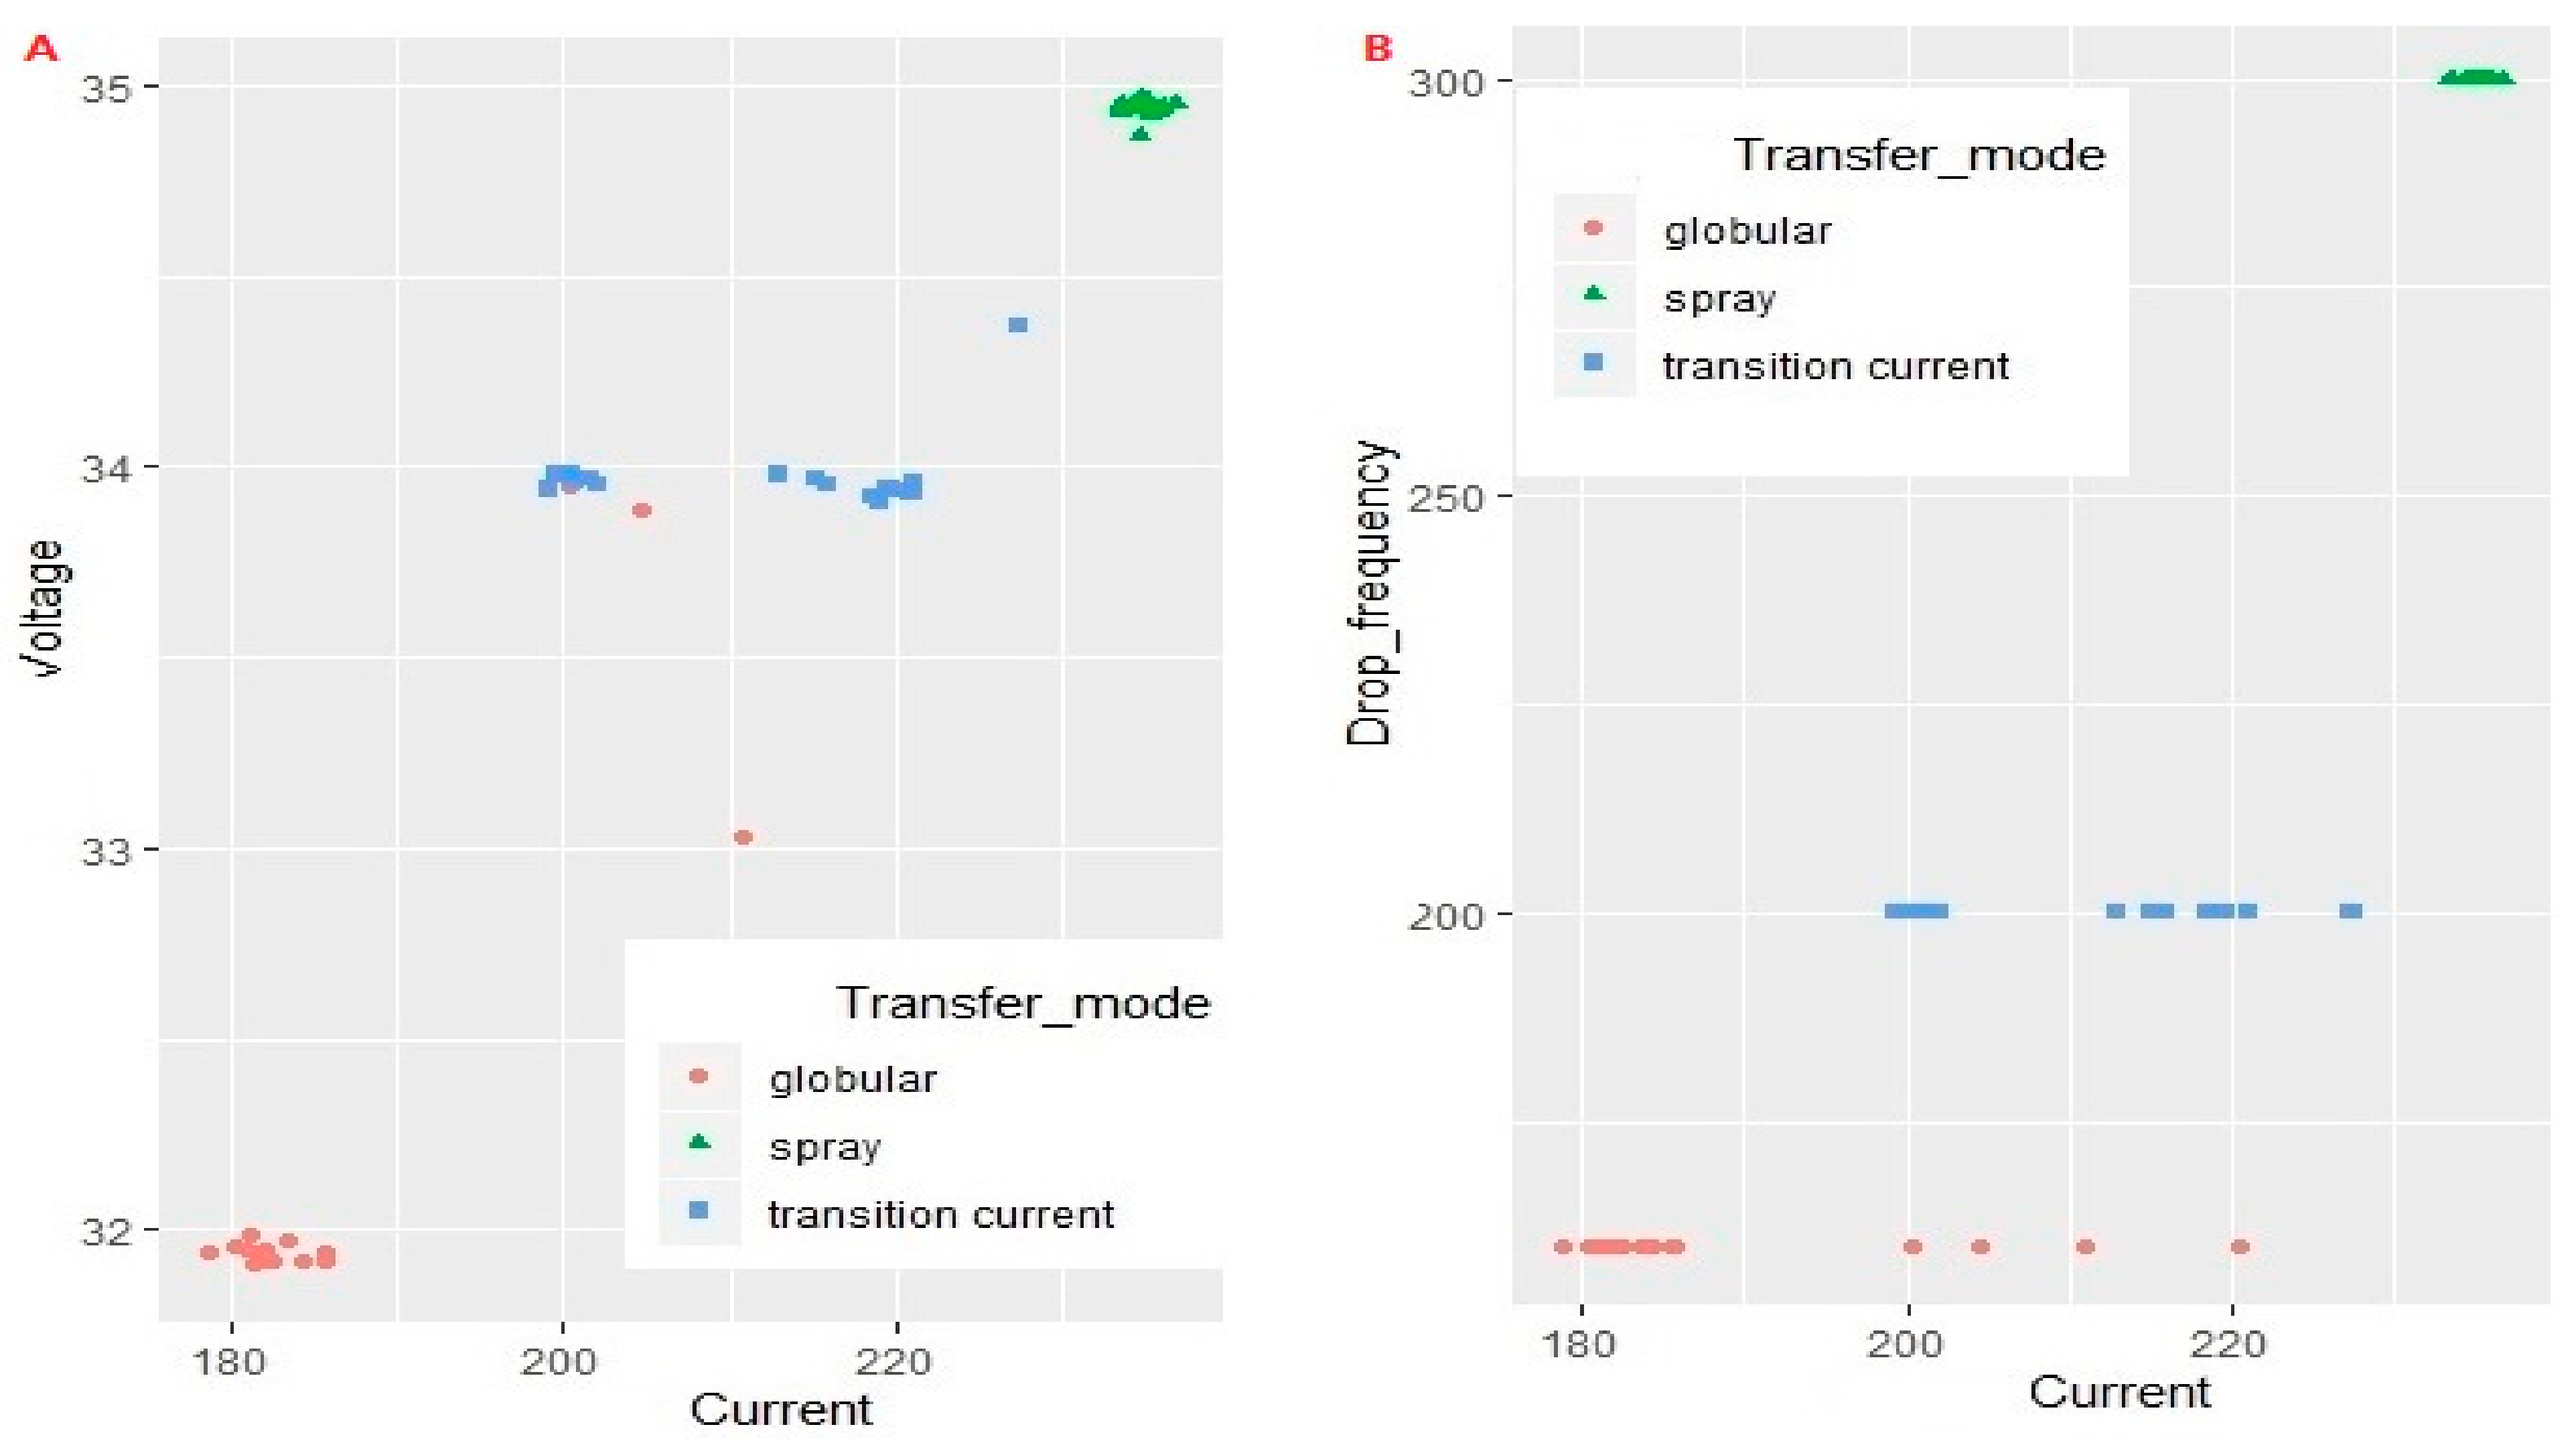
The short-circuit and globular transfer modes, in addition to being influenced by the process current and voltage, occur depending on variations in the wire feed speed and welding speed. If we look at the general map of the transfer modes for the four experiments (see
Figure 40), the globular and short-circuit transfer modes and the mixture of these two modes can occur in the same ranges of current and voltage. For Test 4, mixed globular and short-circuit transfer modes (transition current) cause a lot of spatters that are reflected in the sound pressure level. This mode of transfer occurred due to the low value of wire feed speed; Therefore, a correlation exists between the two variables.
Taking the transfer mode label as the objective variable, the following conclusions are reached.
The spray transfer mode occurs for current values greater than 231.07 A (in a sample of 53 values, this rule is 100% fulfilled). For values, less than 231 A, the short-circuit transfer mode is presented (441 cases, with a total of 889 values) if the welding speed is greater than 7.5 mm/s, the wire feed speed is less than or equal to 7.6 mm/s, and the voltage is less than or equal to 29.43 V.
For current values less than 231 A and welding speed less than 7.5 mm/s, globular and mixed short-circuit transfer modes are identified (defined in the image as transition current 1). If the welding speed is greater than 7.5 mm/s, the wire feed speed is greater than 7.65 mm/s, and the voltage is greater than 27.5 V, globular transfer occurs (this rule is true for 195 cases in a sample of 204 values).
Considering the SPL variable, the transfer mode identified as a mixture of globular and short-circuit modes (highly unstable) is observed for values greater than 94 dB. The other transfer modes did not reach that value.
To explore these dependencies, the data were integrated, and decision trees were created to separate and classify the data (see
Figure 41). The created decision tree was classified with an absolute mean error of 0.243 (see
Figure 42).
Decision trees were implemented with a regression model to establish correlations between numerical values. Regression analysis was performed using the geometry parameters (reinforcement and width) as the objective variables. The analysis revealed the following insights:
Regarding the reinforcement variable, it was found that when the wire feed speed exceeds 6.81 mm/s, an average reinforcement value of 3.30 mm is obtained. This value is influenced by the welding speed and wire feed speed variables, which are reflected in the SPL values. SPL values greater than 91.95 dB correspond to an average reinforcement of 3.68 mm. Notably, a significant increase in reinforcement is observed when the welding speed exceeds 11 mm/s, reaching an average of 4.18 mm. For SPL values less than 91.95 dB, the average reinforcement is 3.38 mm, with the wire feed speed variable influencing the results. An increase in wire feed speed above 9.4 mm/s leads to a decrease in reinforcement, reaching an average of 2.79 mm. Conversely, wire feed speeds below 6.8 mm/s result in an average reinforcement of 2.4 mm. It is worth mentioning that for currents below 131 A and SPL values below 90 dB, the reinforcement increases to approximately 3.13 mm.
As for the average width, it was found to be 5.75 mm across all four tests. The obtained decision tree revealed a direct association between higher current values (greater than 136 A) and larger width values, with an average width of 6.46 mm. Increasing the wire feed speed also influences the width growth. For wire feed speed values of 7.5 mm/s, an average width of 6.62 mm is observed, while values of 8.4 mm/s with currents below 136 A yield an average width of 5.67 mm.
A stability indicator derived from characteristics extracted from the dataset is proposed.
For training purposes, the following processed values were utilized as inputs: the mean current obtained during the process (mean_A), standard deviation of the current (std_A), peak values of current and voltage (pkv_A and pkv_V, respectively), background values of current and voltage (bkg_A and bkg_V, respectively), and computed metrics such as the Transfer Index (TI), Transfer Stability Index (TSI), Power Ratio (PR), Dip Consistency Index (DCI), mean sound pressure level (m_SPL), standard deviation of sound pressure level (std_SPL), and standard deviation of geometric parameters—reinforcement (std_R) and width (std_W). The network outputs were defined as binary values (0: stable processes, 1: unstable processes).
The stability classification system was developed using Python programming language, employing popular libraries and frameworks for machine learning and neural networks. The system leveraged the capabilities of the TensorFlow library, a widely used open-source platform for building and training neural networks.
For data preprocessing and analysis, the system utilized the NumPy and Pandas libraries, enabling efficient handling and manipulation of numerical data. The OpenCV library was employed for image processing tasks, including image enhancement and feature extraction.
The neural network model was implemented using the Keras API, a high-level neural network library built upon TensorFlow. Keras provides a user-friendly interface for constructing and training neural network architecture.
The training process involved feeding the preprocessed data into the neural network and optimizing the model using techniques such as backpropagation and gradient descent. The model was iteratively adjusted to minimize the classification error and enhance the accuracy of stability predictions.
Throughout the development process, standard practices of machine learning were followed, including data splitting for training and validation, cross-validation, and hyperparameter tuning to optimize the network’s performance. Various performance metrics, such as accuracy, precision, and recall, were evaluated to assess the effectiveness of the stability classification system.
Overall, the system combined the power of Python programming language and popular libraries such as TensorFlow, NumPy, Pandas, OpenCV, and Keras to create a robust and efficient solution for stability classification in welding processes.
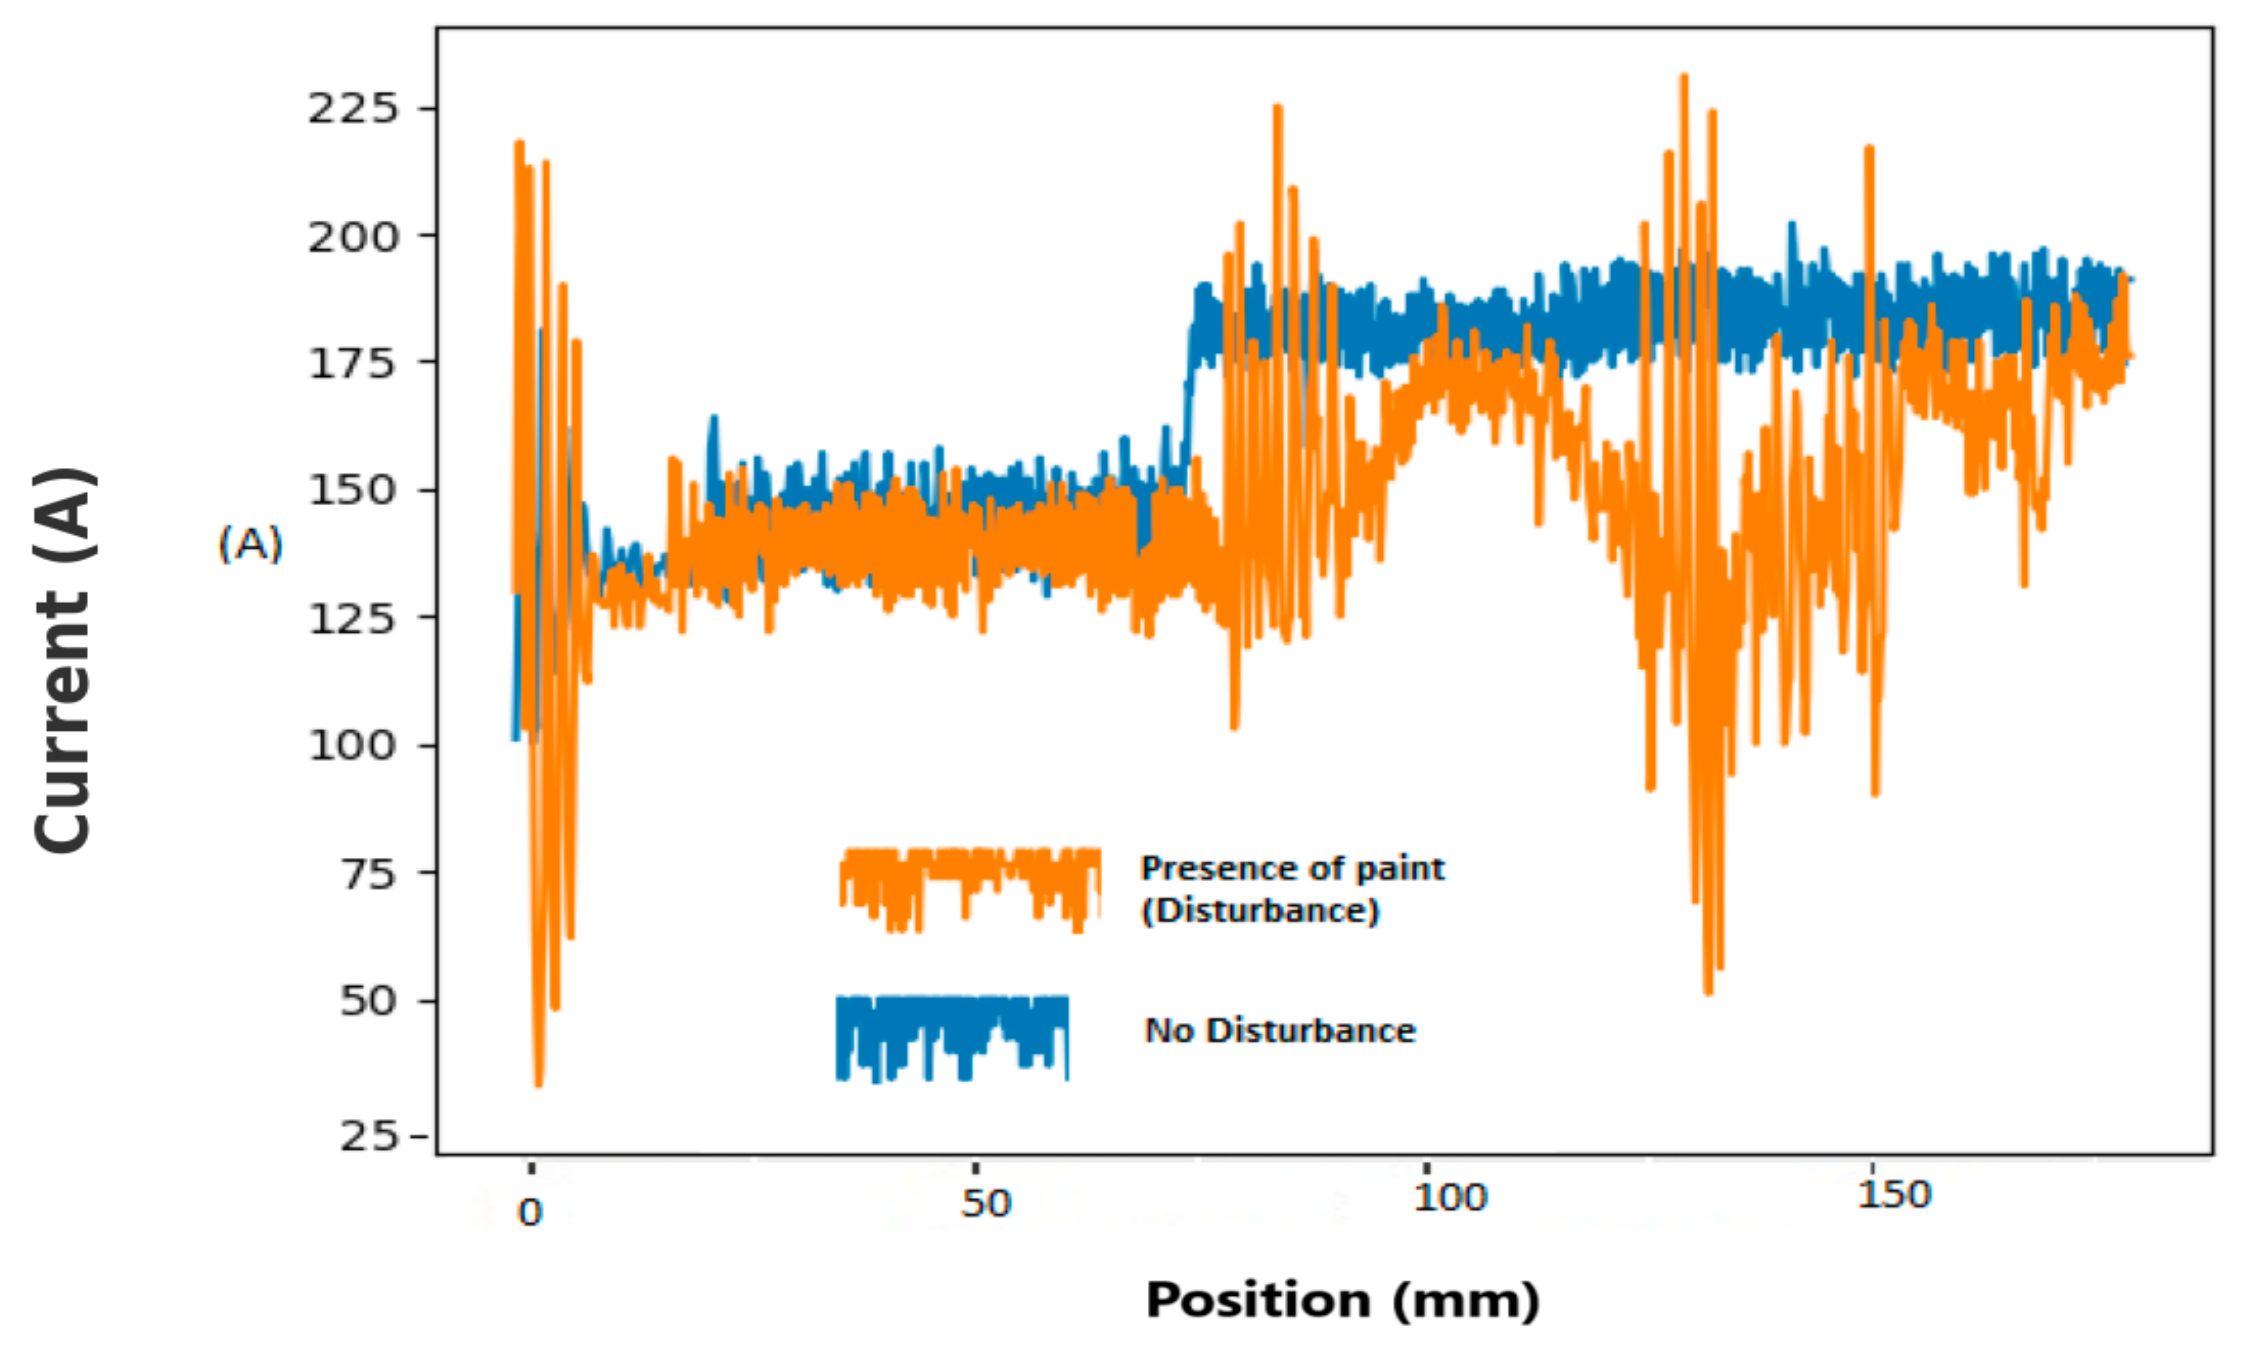
Data from two new experiments were used to validate the model. In these experiments, the test was conducted with the voltage and current configuration of Test 2 while intentionally subjecting the test specimens to oxidation and paint application to generate irregularities in the GMAW welding process. The presence of paint and rust on the welding surfaces introduces additional complexities and challenges to the welding process. Paint can negatively impact the adhesion of the welding material, resulting in decreased weld quality. Moreover, the emission of gases and particles from the paint during welding can affect the stability of the arc and the overall weld quality. Rust on the welding surfaces can impede the proper fusion of the materials, leading to compromised structural integrity of the weld. By incorporating these intentional irregularities, the model’s performance was further evaluated, specifically in its ability to accurately identify and predict issues in the welding process under adverse conditions.
As shown in
Figure 43 and
Figure 44, a significant change can be observed in the sound level signal when the welding process passes through areas affected by rust and paint. The presence of rust and paint introduces disturbances that impact the welding process. Additionally, the results of current and voltage variations obtained in Test 2 were compared to the results obtained when these disturbances were present. These comparisons allow us to evaluate the effects of rust and paint on the welding parameters and further assess the performance of the model under these challenging conditions.
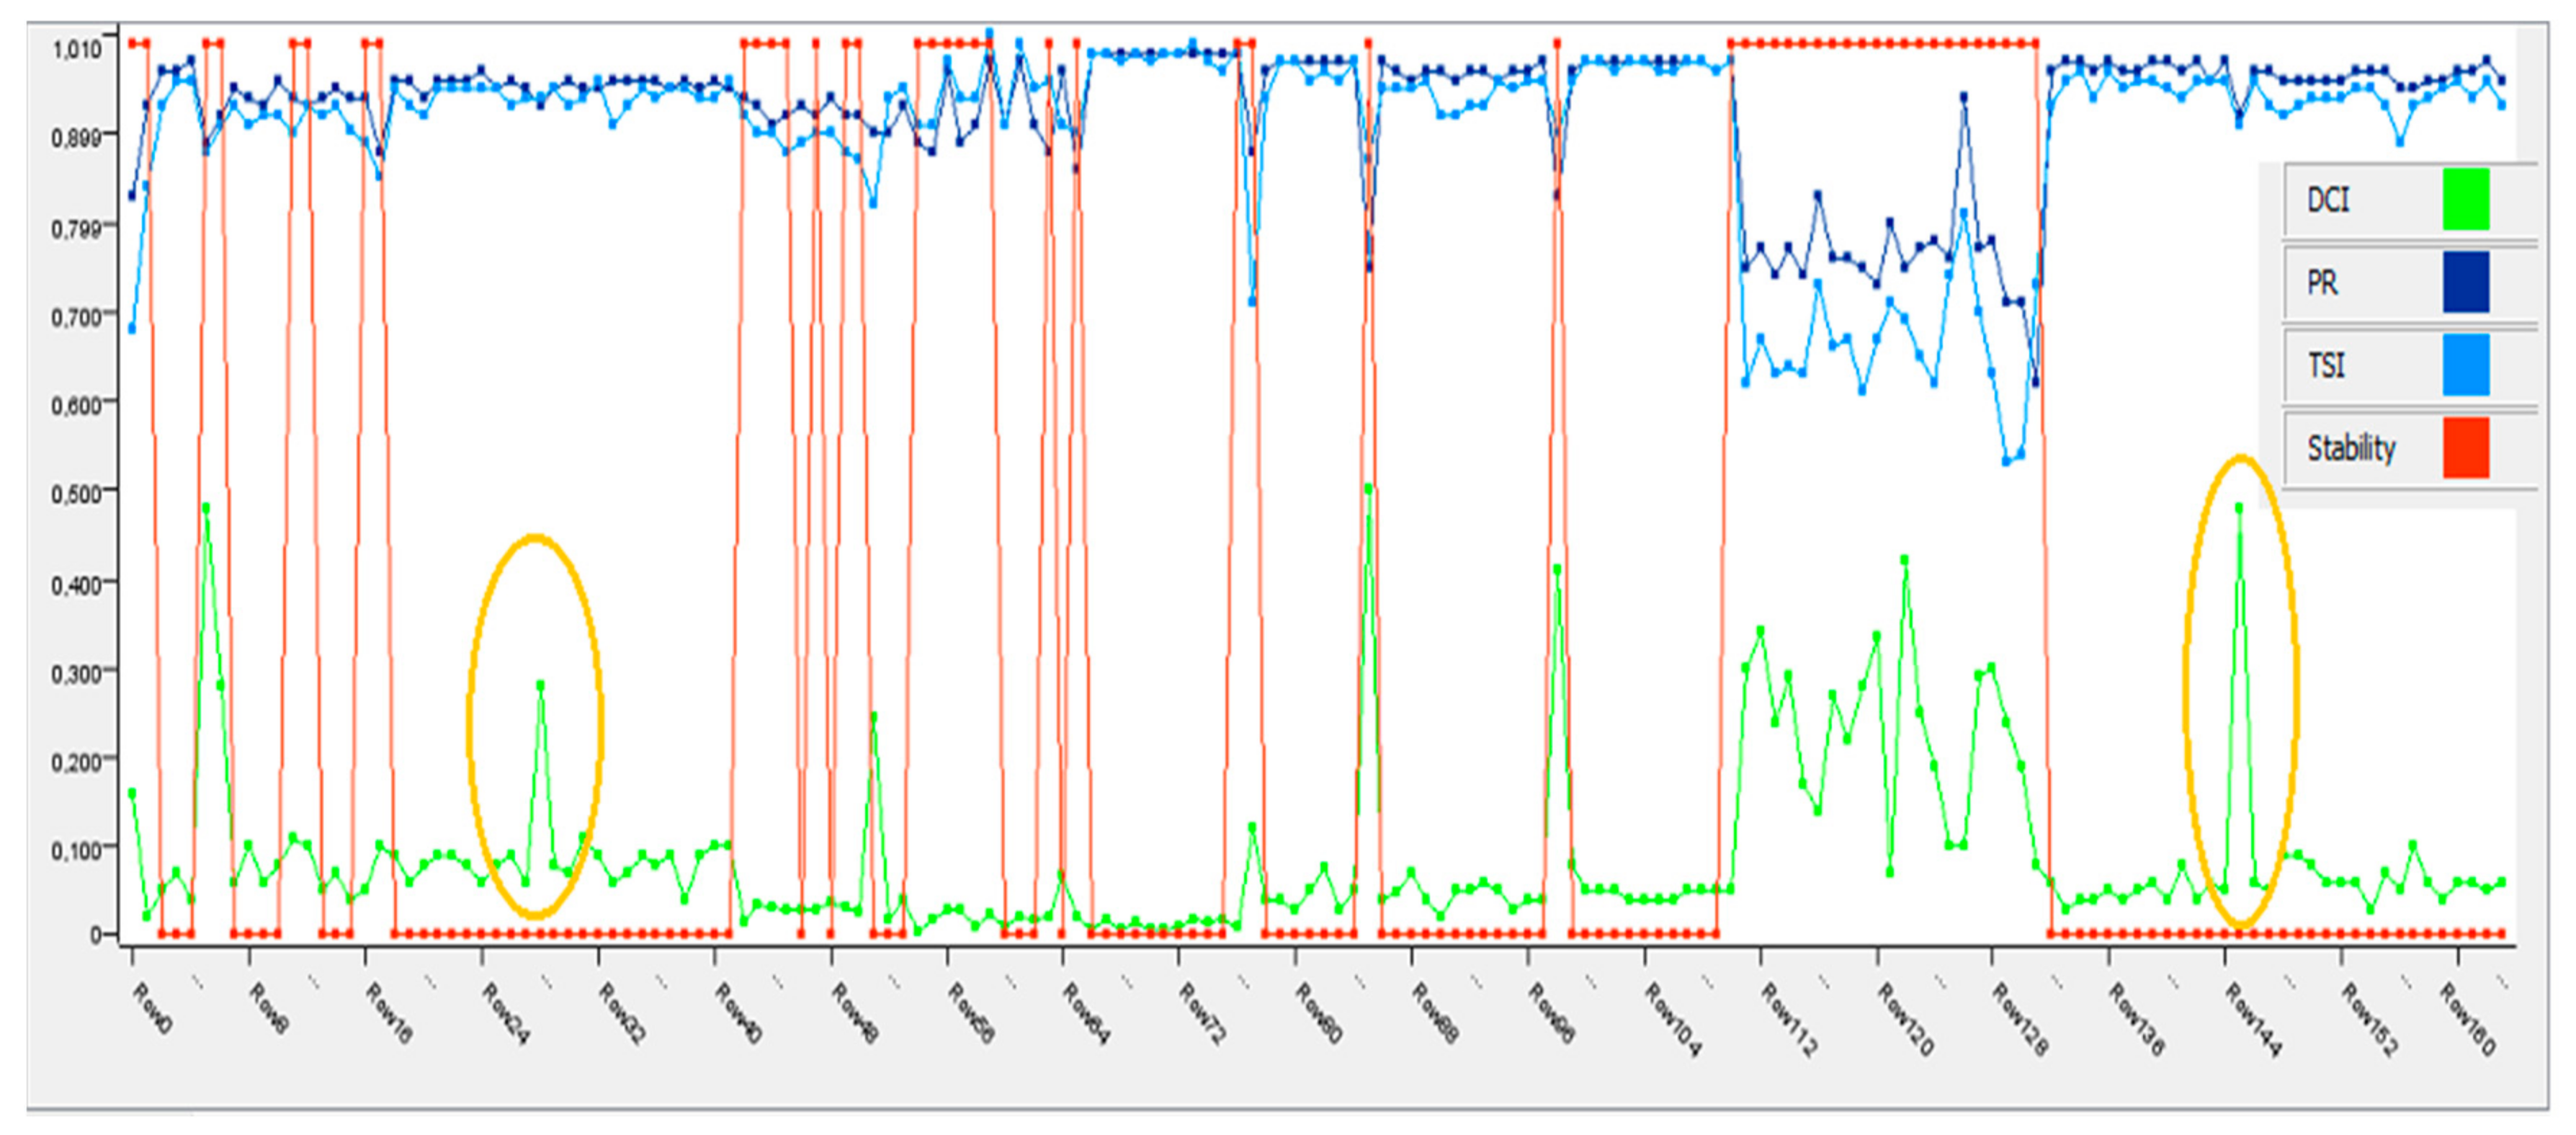
Figure 45 illustrates the classification results obtained for all tests based on the calculated indices. The red line represents the stability classification, with a value of 1 indicating unstable areas and a value of 0 indicating moments of stability. It is important to note that there are some values that fall outside the expected range (highlighted in orange in the image), particularly in the DCI parameter. These values were not identified in the model because the experiments involved changes in the reference voltage values supplied to the source. The presence of these out-of-range values highlights the need for further analysis and refinement of the model to account for such variations in the experimental setup.
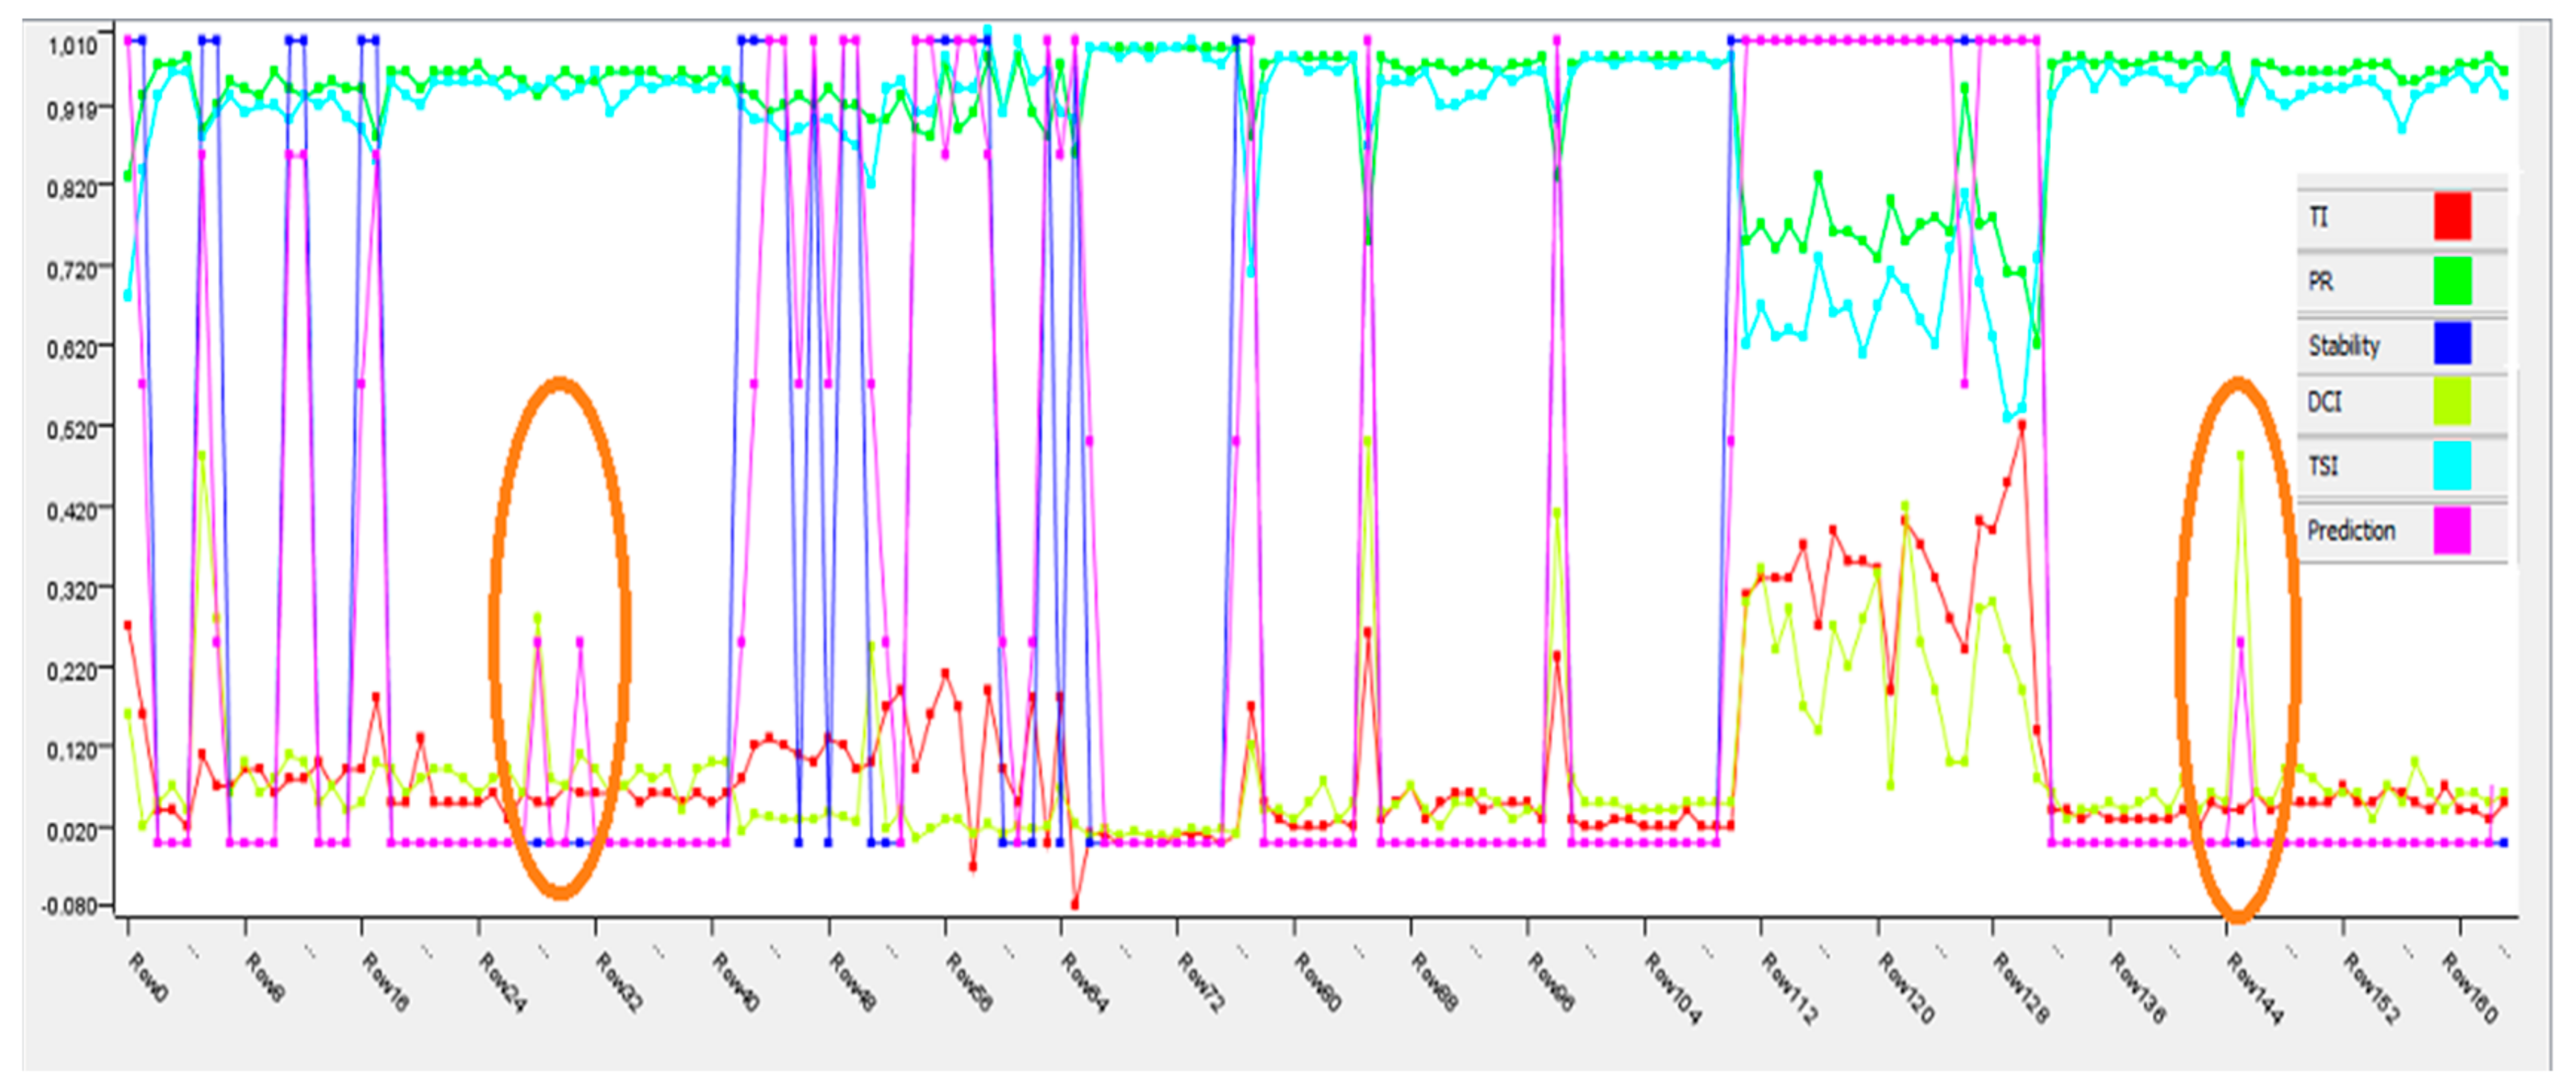
In
Figure 46, the pink line represents the prediction obtained from the neural network for the target variable of stability. The neural network’s prediction closely aligns with the initial classification line in blue, demonstrating its accuracy. Through the learning process, the model was able to identify areas of instability that were not initially detected in the classification due to the introduced disturbances, as indicated by the regions highlighted in orange. These disturbances, such as oxidation and paint application, had a noticeable impact on the sound pressure signal, and the neural network successfully captured these changes to predict the stability of the welding process.
