Article

Optimization and Prediction of Mass Loss During Adhesive Wear of Nitrided AISI 4140 Steel Parts

by
Ahmed Daghbouch
1,
Borhen Louhichi
2,* and
Mohamed Ali Terres
1,3
1
Higher Institute of Applied Sciences and Technology of Sousse (ISSATSo), University of Sousse, Taffala City, Ibn Khaldoun, Sousse 4003, Tunisia
2
Deanship of Scientific Research, Imam Mohammad Ibn Saud Islamic University (IMSIU), Riyadh 11432, Saudi Arabia
3
Laboratory of Mechanics, Materials and Processes (LMMP), National High School of Engineering of Tunis (ENSIT), University of Tunis, 5 Avenue Taha Hussein, Montfleury, Tunis 1008, Tunisia
*
Author to whom correspondence should be addressed.
Crystals 2025, 15(10), 875; https://doi.org/10.3390/cryst15100875
Submission received: 8 September 2025 / Revised: 3 October 2025 / Accepted: 4 October 2025 / Published: 10 October 2025
(This article belongs to the Section Crystalline Metals and Alloys)

Abstract

Adhesive wear has been identified as a significant cause of material loss, representing a substantial challenge across diverse industrial sectors. In order to address this issue, it is imperative to conduct studies with the aim of mitigating this degradation. The present study focuses on achieving a high-quality product with minimal mass loss during adhesive wear by utilizing gas nitriding treatment to optimize the wear parameters of AISI 4140 steel. The present study employed the Taguchi methodology and response surface methodology (RSM) in order to design the experiments. A comprehensive investigation was conducted into the key wear parameters, encompassing sliding speed (V), normal load (FN), and the microhardness of nitrided parts (HV). Furthermore, an artificial neural network (ANN) prediction model was developed to forecast the wear performance of 4140 Steel. The ANN model demonstrated an accuracy of approximately 99% when compared to the experimental data. In order to enhance the precision of wear estimation, prediction optimization was conducted using Bayesian and genetic algorithms. The findings demonstrated that the predicted R2 values exhibited a reasonable alignment with the adjusted R2 values, with a discrepancy of less than 0.2. The analysis demonstrated that the normal load is the most significant factor influencing wear, followed by hardness. In contrast, sliding speed was found to have the least significant impact.

1. Introduction

Wear remains a major challenge in many industrial sectors such as automotive, biomedical, aeronautics, and aerospace, as it compromises the performance and service life of mechanical steels [1,2,3]. Among the different wear mechanisms, adhesive wear is particularly critical. It occurs when two contacting surfaces slide against each other, leading to the detachment of particles from the softer material. This phenomenon results in material, shape, and functional losses, with direct consequences on the safety, reliability, and efficiency of mechanical systems. In industry, adhesive wear is frequently observed in gears, cams, bearings, and sliding surfaces of shafts and bushings, where severe contact conditions promote material removal and premature component degradation.
In order to mitigate such degradation, thermochemical surface treatments are employed on a wide scale. The surface layer of components is enriched with elements such as nitrogen, carbon, or boron through the application of these treatments, thereby enhancing their mechanical and tribological properties. Among these processes, nitriding is distinguished from carburizing or boriding in that it increases hardness, wear resistance, fatigue strength, and corrosion resistance while preserving the dimensional stability of components [4,5]. It is for this reason that nitriding has become one of the most widely utilized treatments in mechanical industries.
In this study, gas nitriding was selected, although alternative processes such as plasma nitriding and liquid nitriding exist. Gas nitriding was chosen due to its simplicity of implementation, industrial maturity, relatively low cost, and ability to treat large components. This process introduces nitrogen into the steel surface at moderate temperatures, leading to the formation of a compound layer (white layer) and a thicker diffusion layer, both of which have been shown to enhance hardness and improve resistance to wear, corrosion, and fatigue [6,7,8,9,10].
The steel AISI 4140 was selected as the material of interest, as it is one of the most commonly used steels in combination with nitriding according to the extant literature. Its employment in the manufacture of highly stressed mechanical components, such as gears, shafts, and crankshafts, is well documented, as is its reputation for good hardenability, fatigue resistance, and favorable tribological behavior [11,12,13]. Despite the fact that a considerable number of studies have been conducted on the enhancement of its properties through thermochemical treatments, the majority of these have concentrated on the optimization of treatment parameters. It is evident that no study has hitherto directly evaluated and optimized the influence of wear parameters (hardness, normal load, sliding speed) on mass loss under adhesive wear conditions.
In this context, the optimization of operating conditions becomes essential. Modern statistical and numerical approaches, such as response surface methodology (RSM), Taguchi design of experiments, and artificial intelligence techniques (artificial neural networks, genetic algorithms, Bayesian optimization), provide powerful tools for modeling and predicting the tribological behavior of materials [14,15,16,17,18]. Recent studies have demonstrated the effectiveness of these methods in optimizing coatings and surface treatments [19,20,21,22,23].
The objectives of this study are fourfold: The primary objective of this study is to evaluate and optimize the effect of gas nitriding on the adhesive wear of AISI 4140 steel under dry sliding conditions. To this end, the study will analyze the influence of key wear parameters such as hardness, normal load, and sliding speed. In contrast to the extant literature, which has chiefly concentrated on treatment parameters, this study is pioneering in its focus on the optimization of wear parameters. The second objective is to undertake a comparative analysis of disparate predictive models (i.e., RSM, ANN, GA, Bayesian optimization) with a view to identifying the dominant factors and determining the most suitable model for this type of study. The overarching ambition of this research is to provide researchers with a robust methodological framework. The third objective is to precisely predict mass loss as a function of wear parameters (hardness, sliding speed, normal load) before it occurs, using intelligent models. This will reduce the need for extensive experimental testing. The objective of this study is to optimize and analyze the internal parameters of artificial neural networks. The internal parameters in question are activation functions, learning algorithms, number of layers and neurons. The purpose of this analysis is to identify the most effective configuration. This study is pioneering in its proposal of a comprehensive optimization of ANN architectures applied to adhesive wear prediction, with the objective of attaining the highest possible level of accuracy.
This work therefore seeks to fill a gap in the literature by proposing an integrated approach that combines experimentation and advanced modeling to better understand and control the adhesive wear of nitrided alloy steels. The expected results are of direct industrial relevance, contributing to the extension of component lifetime and the improvement of mechanical system reliability.

2. Materials and Methods

2.1. Material and Treatments

AISI4140 steel, a low-alloy steel that complies with the European standard, was chosen as the study material for this research. The detailed chemical composition of this material is presented in Table 1.
The primary parameters of the gaseous nitriding treatments applied to a series of AISI4140 steel wear specimens are outlined in Table 2. The filiations of Vickers micro-hardness, as determined by the SHIMADZU HMV-2000 (SHIMADZU, Tokyo, Japan) under a 50 gf (HV\0.05) on cross-section, permit the control of the efficiency of each treatment through the determination of surface hardness (HV max) and the hardened depth. The results corresponding to each nitriding treatment are collated in Table 2.
Wear tests were performed by the double weighing method, on a wear bench, the specimens rubbing on a wheel animated by a constant speed rotation under the action of a load. The sample is fixed on the sample holder, the latter is free in translation, and the load is transmitted to it under the effect of a calibrated spring. The test bench, crafted from X160CrMoV12 material (Revolon, Tunis, Tunisia) , is distinguished by its hardness of 58 HRC and a roughness Ra of 0.4 µm. As for the test specimens used for the tests, they have an identical diameter and length of 15 mm (Figure 1). It should be noted that the wear test is carried out under dry friction conditions at room temperature, thus ensuring an accurate evaluation of the material’s resistance.

2.2. Methodology

The present study examines the influence of wear parameters on mass loss during adhesive wear. In order to facilitate an adequate analysis, three principal factors must be taken into account: firstly, the microhardness of the nitrided parts (HV); secondly, the normal load (FN); and thirdly, the sliding speed (V). Each of these factors is studied at different levels. The following factors are presented in Table 3, along with their respective types and levels.
To optimize the responses more efficiently, the Taguchi plan and the RSM method, both methods of experiment planning, were used. The Taguchi design was applied using Minitab Statistical Software 17, while the RSM method was implemented with Design-Expert 13. This method allows us to find the best result with the minimum possible tests [13]. A series of 24 tests was carried out, each identified by a distinct number from 1 to 24. The experiment plan that best matched the input parameters was selected, built and completed with the corresponding response mass loss (∆M/M (%)), which represents the mass loss following the wear test.
Each test was repeated three times to ensure reproducibility, and new specimens were used for each repetition in order to avoid any bias due to prior surface damage. The experimental program was organized three groups of nitrided specimens (NG12, NG24, and NG36), corresponding to different nitriding durations and hardness levels. The mass loss (∆M/M (%)) was calculated as the average of the three individual mass loss measurements obtained for each experimental condition, and this average value was retained for the analysis. The data relating to confidence intervals (measurement error) have been compiled in Table 4.

2.3. Prediction by Neural Network

The functionality of artificial neural networks (ANNs) is analogous to that of the human brain, using weights and biases to perform nonlinear operations [12]. Their application has demonstrated reasonably reliable predictions in many cases [15]. ANN methods are widely employed in modeling, simulation, learning, definition, and prediction [16], and have specifically been used to predict the wear behavior of materials, with substantial literature available in this field [22]. To enhance predictive accuracy, variations in network parameters have been explored, including changes in activation functions, algorithms, and the number of hidden layers and neurons.
It is evident from the analysis of the experimental results that the normal load (FN), the sliding speed (V), and the maximum surface microhardness (HV) are the most critical factors for studying the wear resistance of nitrided layers. These factors thus constitute the inputs of the neural network. The experimental data collected for this study is divided into three sets: a training dataset (70%), a test dataset (15%), and a validation dataset (15%) [22]. The experimental design encompasses 135 tests: A total of 95 samples are utilized for the training of the network, while an additional 20 samples are selected for the purpose of validation and testing. A fixed data split method was adopted rather than cross-validation, as the dataset size was sufficient to ensure stable and representative training, testing, and validation subsets. In the field of artificial neural network architecture, a range of structures have been advanced for process modeling. These include the multilayer perceptron (MLP) and the radial basis function (RBF). In this study, an artificial neural network (ANN) employing the feed forward-back propagation algorithm was adopted for modeling and testing using MATLAB software. In the subsequent analysis, architectures with varying numbers of hidden layers and neurons in each hidden layer for the three selected activation functions will be examined.
-
Hyperbolic: an S-shaped mathematical function, takes real values as input and returns values between −1 and 1, it improves data symmetry and often accelerates convergence.
t a n s i g x = e x i e x i e x j e x j
-
Sigmoid: also S-shaped, takes real values as input and returns values between 0 and 1, chosen for its ability to model nonlinear relationships and compress values into the [0, 1] range, which facilitates convergence and stabilizes the learning process.
l o g i s i g x = 1 1 + e x i
-
Linear: returns the same value that it receives as input and is often used in the last layer of a neural network for regression tasks. it allows the network to reproduce quasi-linear relationships and serves as a benchmark against nonlinear functions.
After choosing the activation function, we determine the variables measuring performance for each combination for the different learning algorithms [13]:
-
TRAINLM: learning by the Levenberg–Marquardt algorithm (quasi-Newton method), known for its speed and accuracy in nonlinear regression problems, particularly suitable for medium-sized networks.
-
TRAINSCG: learning by scaled conjugate gradient (SCG) that is more memory-efficient and suitable for larger or more complex networks,
-
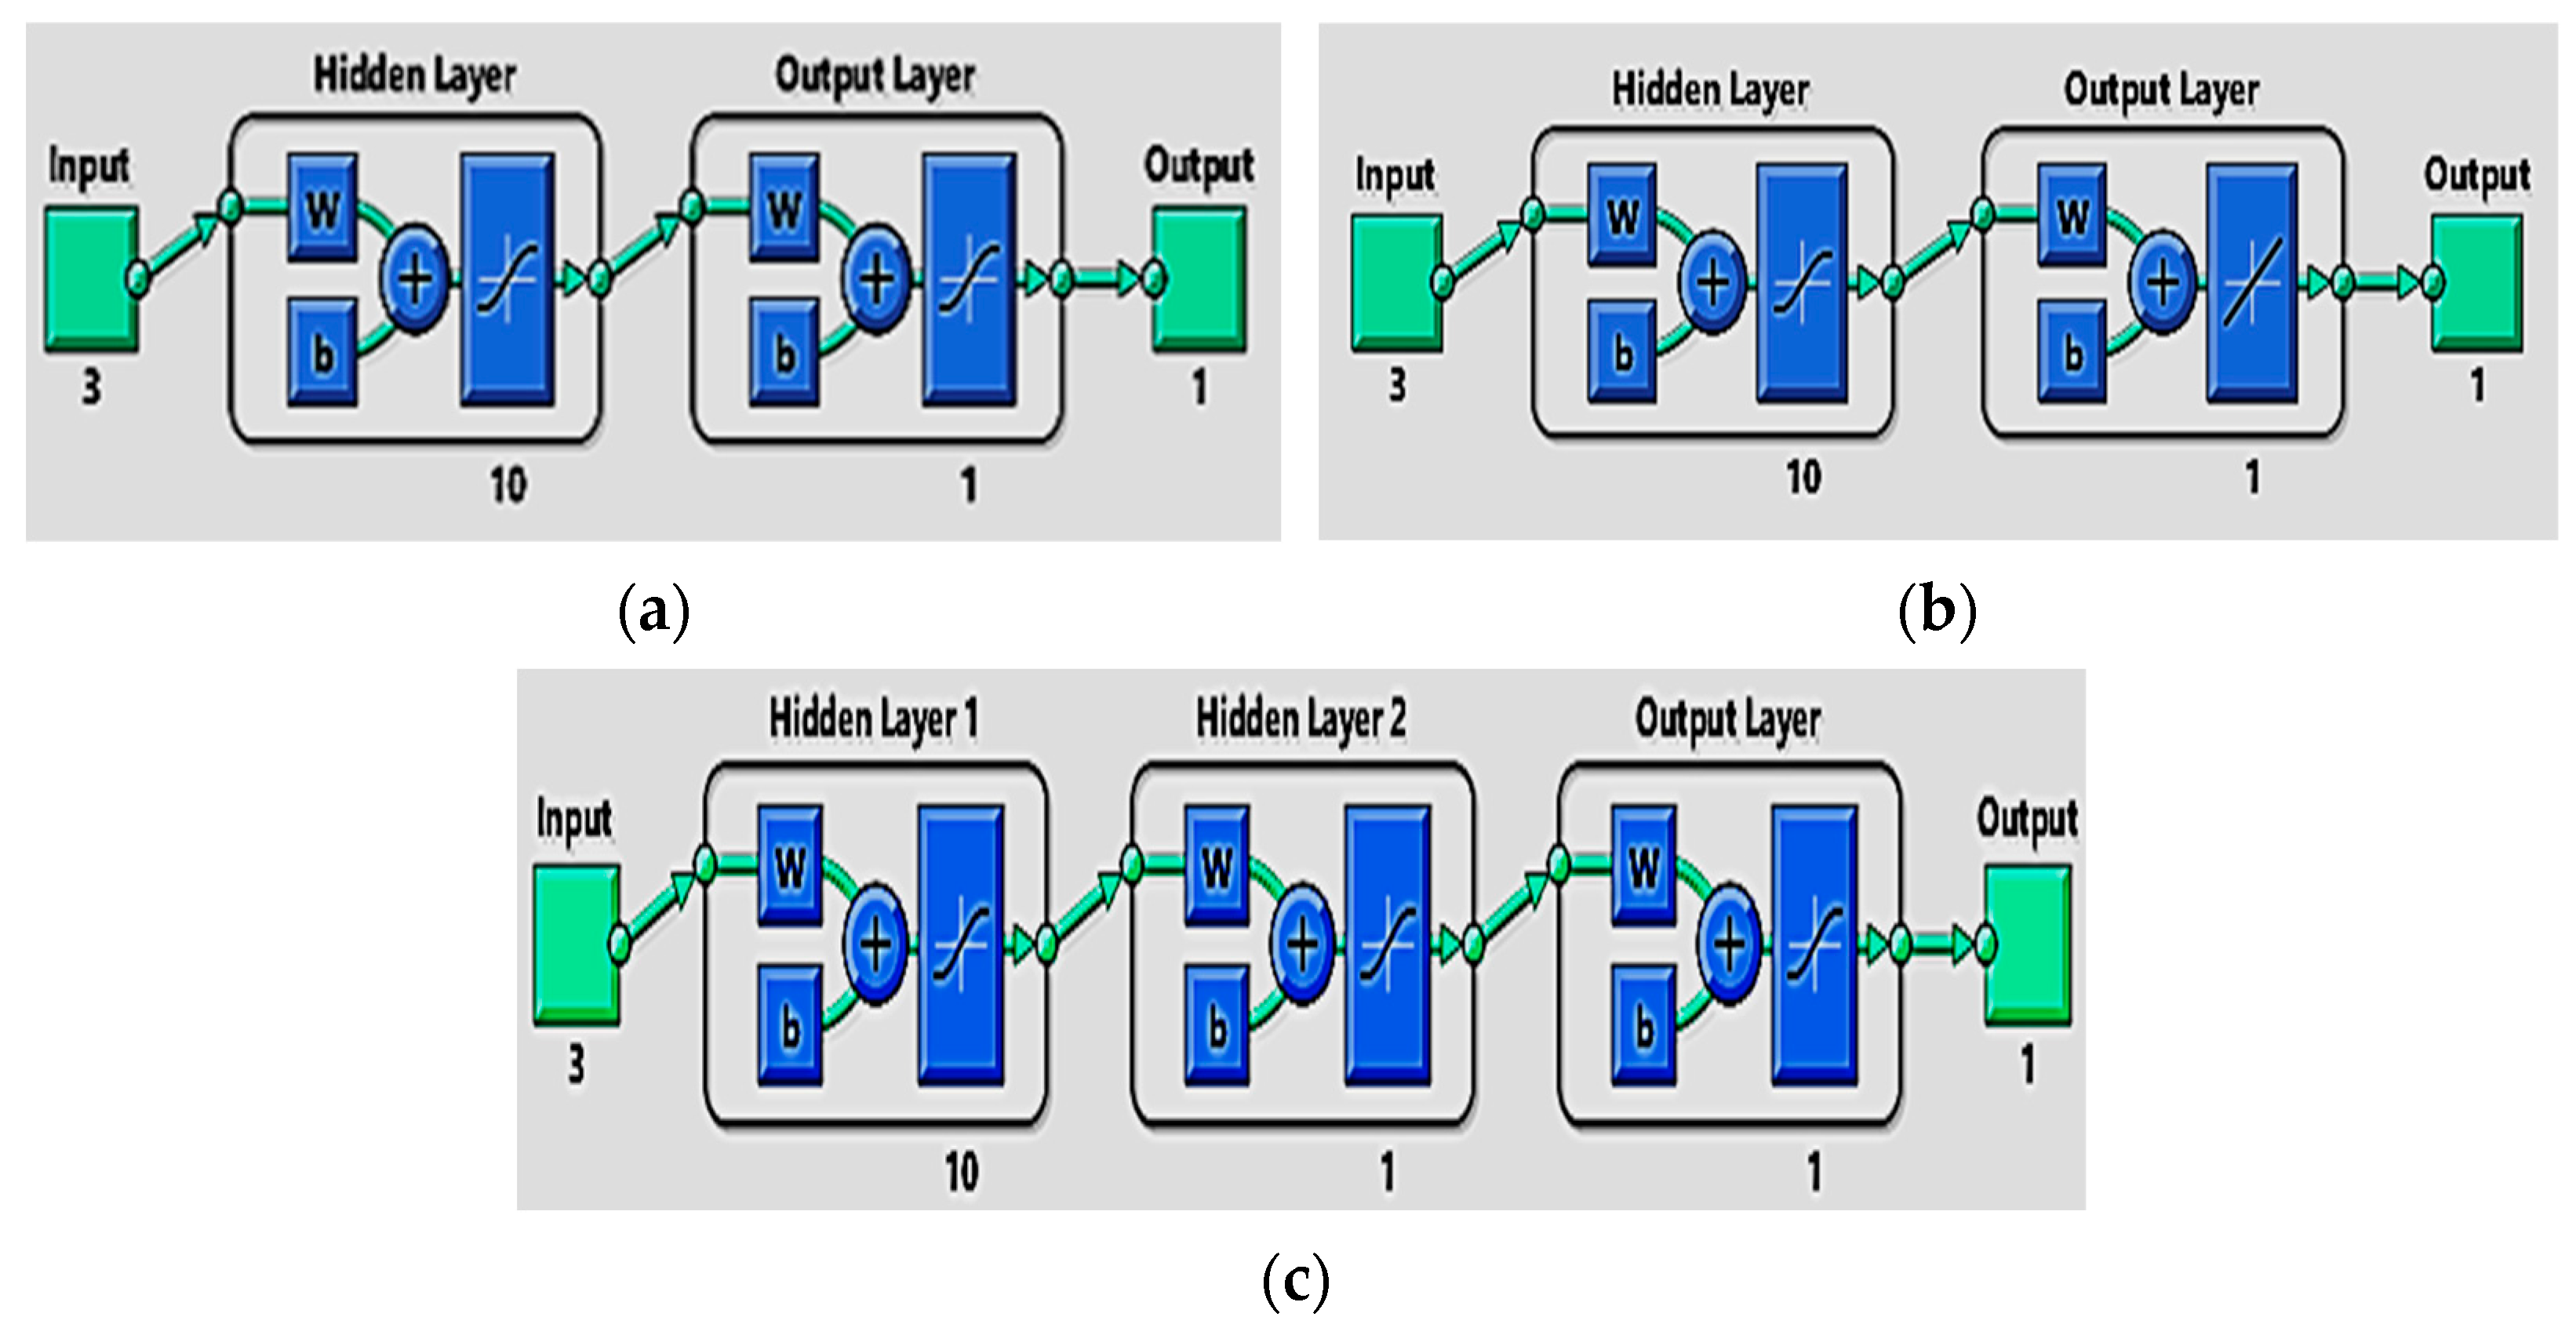
TRAINBR: version of trainlm but with automatic weight moderation, that incorporates automatic weight regularization, reducing the risk of over fitting and improving generalization capability. The architecture and details of the neural network are illustrated in Table 5. The internal architecture of the three layers is illustrated in Figure 2.
The performance of the algorithms will be measured for each combination of hidden layers and the number of neurons for each activation function. The results obtained from these combinations will be collected and compared, and the best possible result from each algorithm for the three hidden layers will be extracted. These data will be summarized in Table 4. The choice of architectures with 1 to 3 hidden layers and 10 to 12 neurons was guided by the need to balance model complexity and the risk of over fitting. One to three layers allow the exploration of increasing levels of nonlinearity without excessively increasing computational cost, while the range of 10–12 neurons ensures sufficient approximation capacity without numerical instability. Several random trials and repeated tests were carried out to confirm that these ranges provide the most reliable performance and guarantee the robustness of the results. These data will be summarized in Table 4.
In Table 4, the correlation coefficient R and the mean squared error (MSE) will be indicated. The MSE, used as a cost function, will help determine which combination best fits the problem of predicting mass loss. The expression for MSE is as follows:
MSE = 1 n k = 1 n y k t k 2
Thus, we calculated the square root RMSE (Root Mean Squared Error) to compare them and choose the best possible result. Its expression is indicated below:
RMSE = 1 n k = 1 n y k t k 2

3. Results

3.1. Surfaces Responses

The raw signal-to-noise ratios were calculated according to the Taguchi methodology. For each factor studied, the signal-to-noise (S/N) ratio was determined from the experimental values of the response (mass loss). In this case, the criterion “smaller-is-better” was adopted, since the objective was to minimize mass loss. The formula used is:
S N = 10 × l o g 10 ( 1 n i = 1 n y i 2 )
where yi represents the measured value of mass loss in experiment i, and n is the number of repetitions.
An analysis of the response table for raw signal ratios (Table 6) reveals that normal load is the most significant factor affecting material loss. This is followed by hardness and then sliding speed. This suggests that it would be prudent to prioritize normal load, followed by hardness, and finally sliding speed, in order to optimize experimental conditions and minimize mass loss.
The application of normal load exerts a direct effect on the contact surface, thereby increasing pressure, shear stress, and local temperature. This, in turn, leads to an intensification of adhesive wear mechanisms. In comparison, hardness enhances resistance to penetration and plastic deformation, though its efficacy is constrained under high loads. The influence of sliding speed is more variable, depending on thermal conditions and oxidation phenomena. In such cases, sliding speed can either accelerate or reduce wear. A number of recent studies have corroborated the notion that normal load remains the most decisive factor in adhesive and abrasive wear processes.
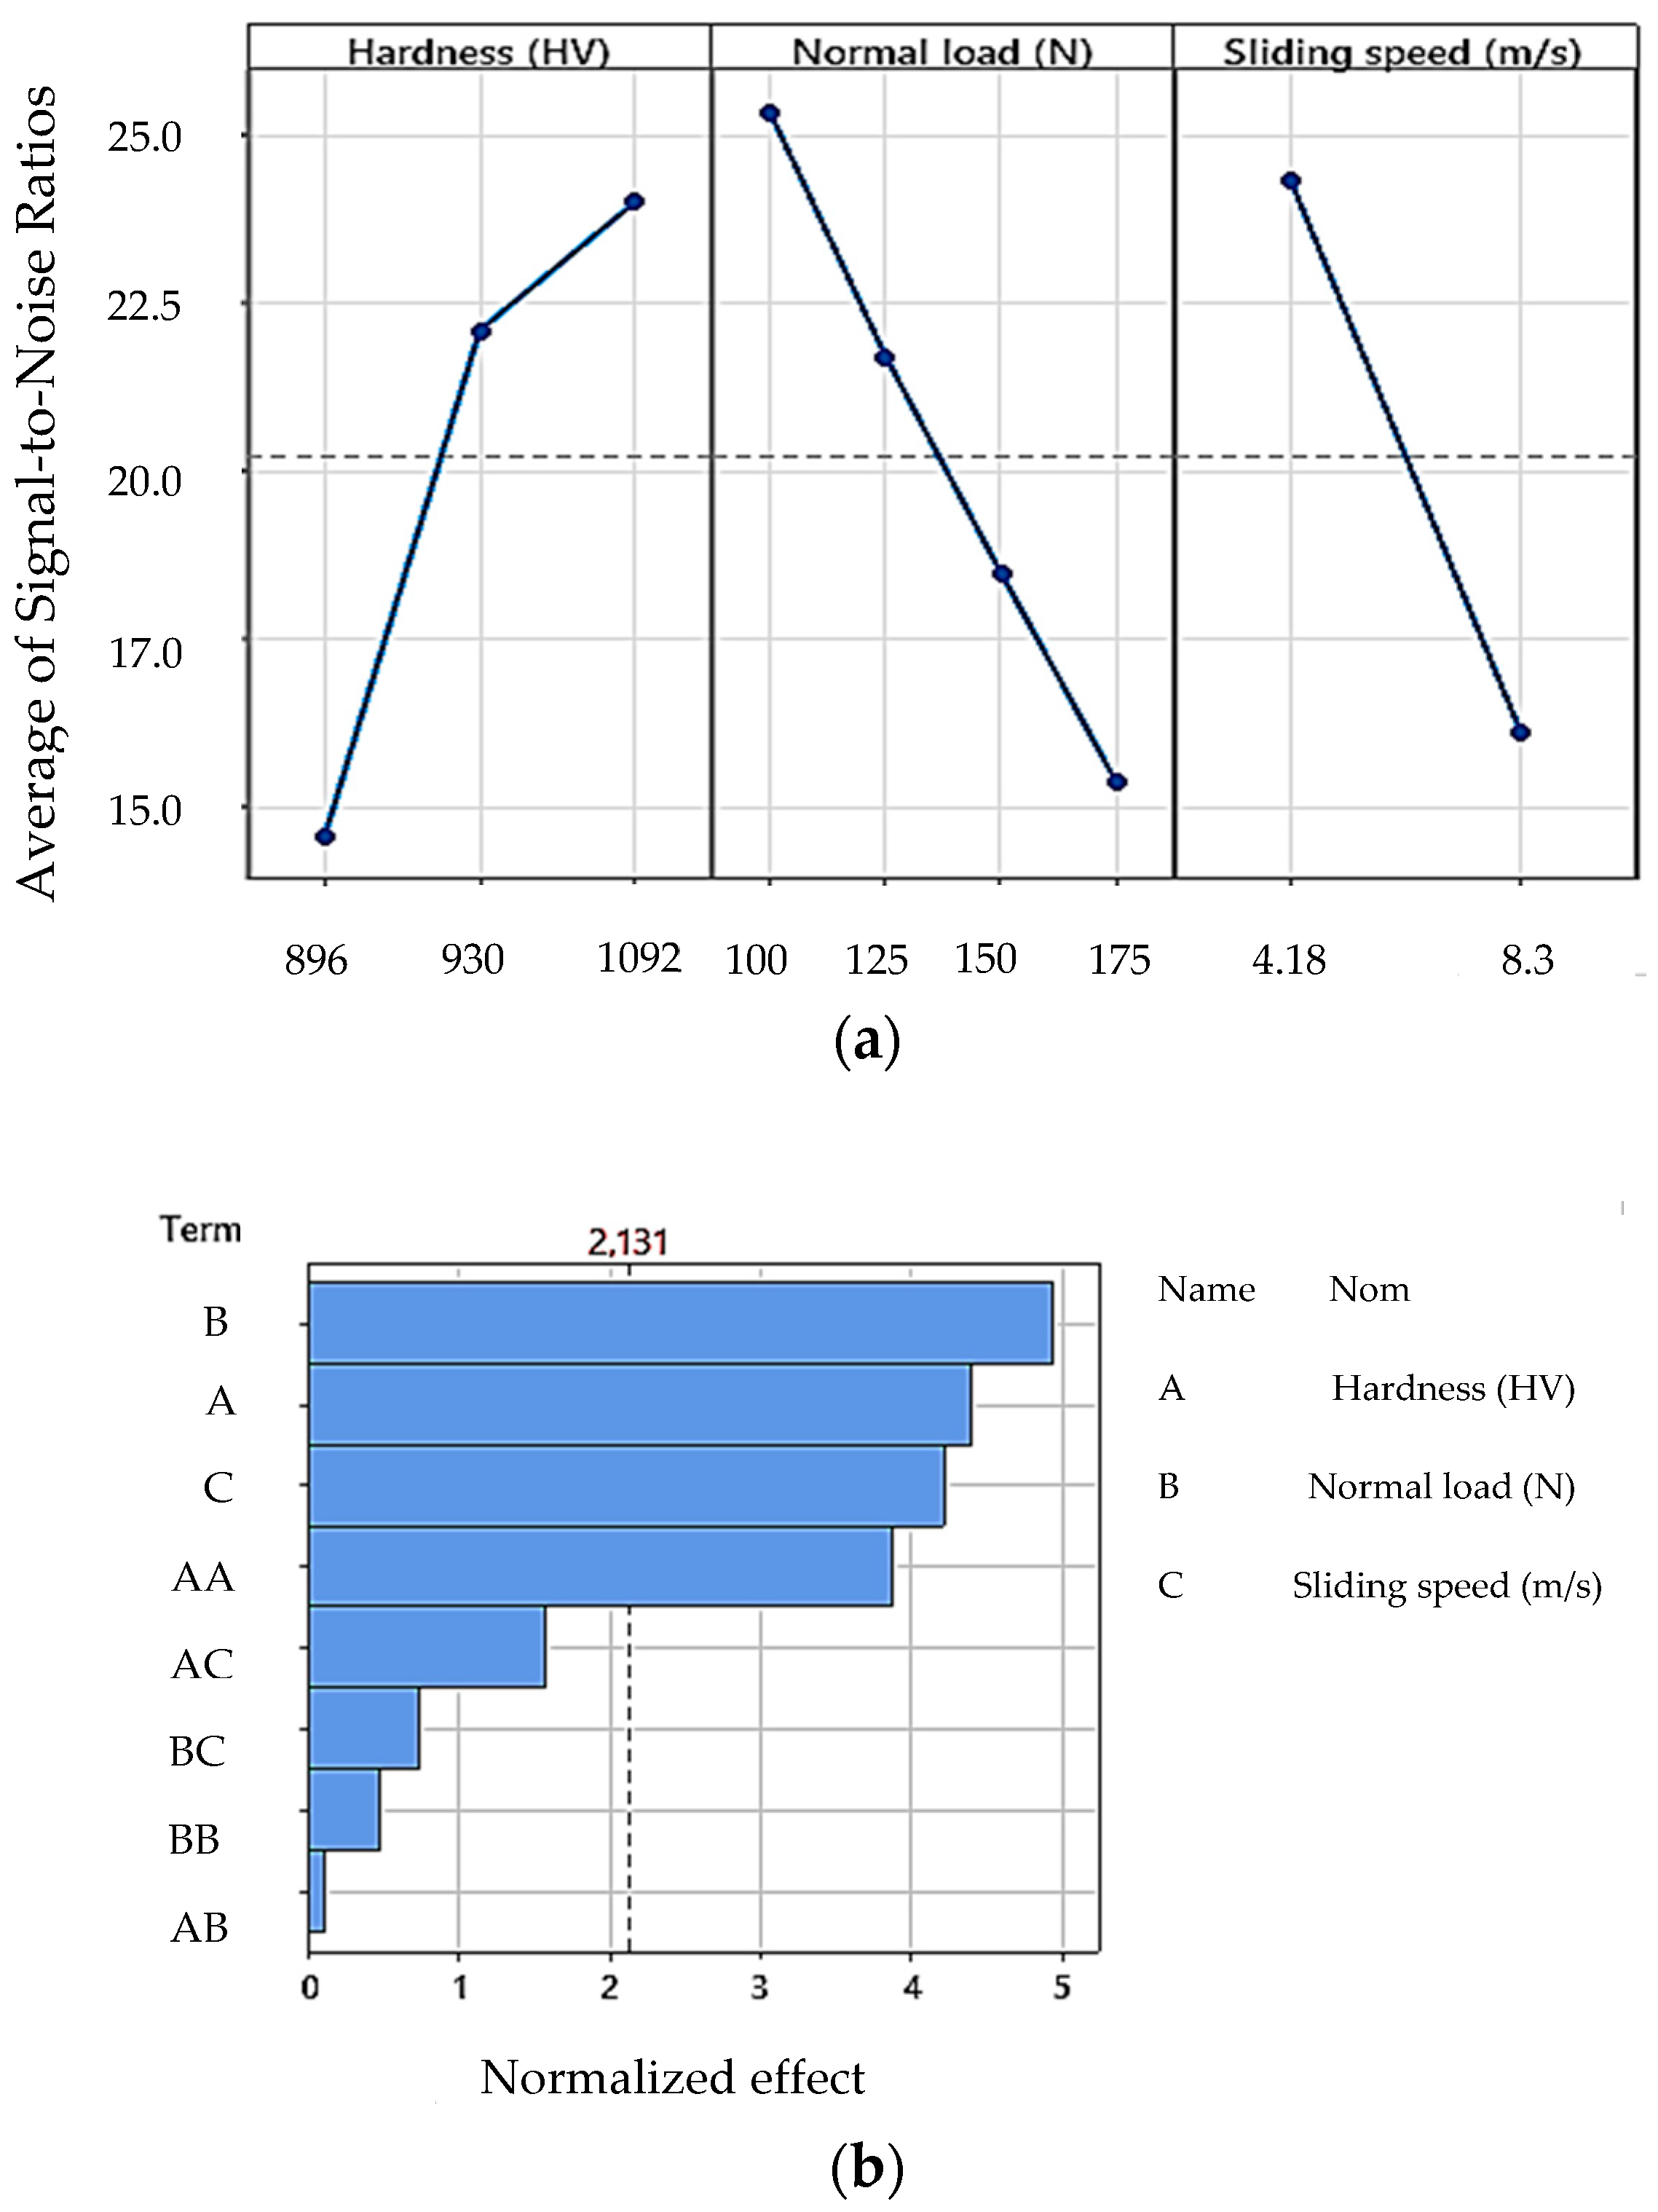
Indeed, the graphical analysis of the main effects for raw signal ratios (Figure 3a) demonstrates that the maximum mass loss is attained for a maximum normal load level of 175 N. In a similar manner, the minimum mass loss is attained for a minimum hardness of 895 HV.
It is therefore evident that these two factors have a significant impact on mass loss. In a similar manner, it was observed that the hardness of the steel, measured at 1092 HV and obtained by gas nitriding over a period of 24 h, allowed for minimization of the steel’s mass while achieving a satisfactory result in terms of resistance and durability. Conversely, when a component was subjected to nitriding for a duration of 36 h, resulting in a hardness of 930 HV, the outcome proved to be less optimal.
This can be attributed to a phenomenon known as nitrogen saturation, during nitriding, nitrogen is incorporated into the surface layer of the steel. However, there is a limit to the amount of nitrogen that the steel can absorb [24]. These results indicate that the increase in hardness obtained by gas nitriding is very significant and can positively influence the results by significantly reducing mass loss during adhesive wear. To do this, it is important to choose the nitriding conditions well, taking into account time constraints [25].
In the Pareto diagram (Figure 3b), a significance limit of 2.131 is established. The effects of factors considered statistically significant are represented by bars that exceed this limit. The limit of 2.131 corresponds to the critical value of Student’s t-distribution (t-value) at a 95% confidence level. It is determined from the degrees of freedom (df) of the residuals in the ANOVA, which represent the variability not explained by the model. The degrees of freedom are calculated as:
dfresiduals = Ntotal − Nestimatedparameters
where Ntotal is the total number of experiments and Nestimatedparameters is the number of factors and interactions included in the model.
Thus, the value 2.131 is directly obtained from Student’s distribution tables for α = 0.05 (95% confidence) and the corresponding degrees of freedom. Effects whose absolute t-value exceeds this threshold are considered statistically significant.
The most important factors, ranked in descending order of importance, are normal load, hardness, and sliding speed. The square of hardness is also considered statistically significant. The effects of factors that are not considered statistically significant are represented by bars that do not exceed the significance limit. These factors, having a lesser effect on the studied response, can be ignored from the analysis, it is important to note that the interactions between these factors are not statistically significant. This means that the combined effect of these factors on the studied response is not significant enough to be considered significant.

3.2. Regression Equation

An alternative approach was explored using the genetic algorithm to optimize the variables of the adjustment equation. From a methodological perspective, the hybrid approach adopted in this work (CCD-RSM, optimization by genetic algorithm, and ANN) aligns with the conclusions of Huang et al. [25] which show that combining statistical methods with artificial intelligence tools enhances predictive accuracy and model robustness. The genetic algorithm functions by means of the systematic modification of the variables of the adjustment equation, in accordance with a specific program. This process bears a resemblance to the gradual modification of genes over successive generations in the course of natural evolution. The objective of this systematic modification is to achieve the greatest possible accuracy between the experimental and optimal models, taking into account several factors simultaneously. The algorithm was able to further optimize the response, taking into account factors such as normal load, hardness, and speed. The regression equation that was obtained is presented herewith:
∆M/M(%) = 14.5 − 0.0276 × HV − 0.00005 × FN − 0.088 × V + 0.000013 × HV2 + 0.000008 × FN2− 0.0000009 × HV × FN + 0.000092 × HV × V + 0.000129 × FN × V.

3.3. RSM Method

3.3.1. Regression Models

Table 7 presents the multiple regression coefficients (R2) derived from the least squares technique to predict the model based on the second-order polynomial. The p values (p < 0.05) indicate that the effects resulting from hardness and normal load are significant. The R2 values demonstrate that the regressed models are satisfactory and adequately correspond to the experimental data. Furthermore, values greater than 0.1 indicate that the model terms are not significant. The experimental and predicted results were found to be approximately the same.
The F value of the model, 6.84, indicates that the model is statistically significant. The probability of such a large F value occurring due to noise is negligible, with a mere 0.24% chance according to Table 6. The predicted R2 of 0.3119 is in reasonable agreement with the adjusted R2 of 0.4323, with the difference being less than 0.2. The Adeq Precision, a measurement of the signal to noise ratio, has been calculated to be 8.999, indicating an adequate signal. It is considered that a ratio greater than 4 is desirable, and this model can be used to navigate the design space. The hardness, normal load, and wear speed are contingent on the effects obtained from the linear, quadratic, and the interaction of the studied variables. Subsequently, upon incorporating the determined coefficients, the expression of the coefficient provided in Equation (6) is as follows:
∆M/M(%) = 0.1379 − 0.0462 × HV + 0.0787 × F + 0.0250 × V

3.3.2. Effect of Independent Variables on Mass Loss

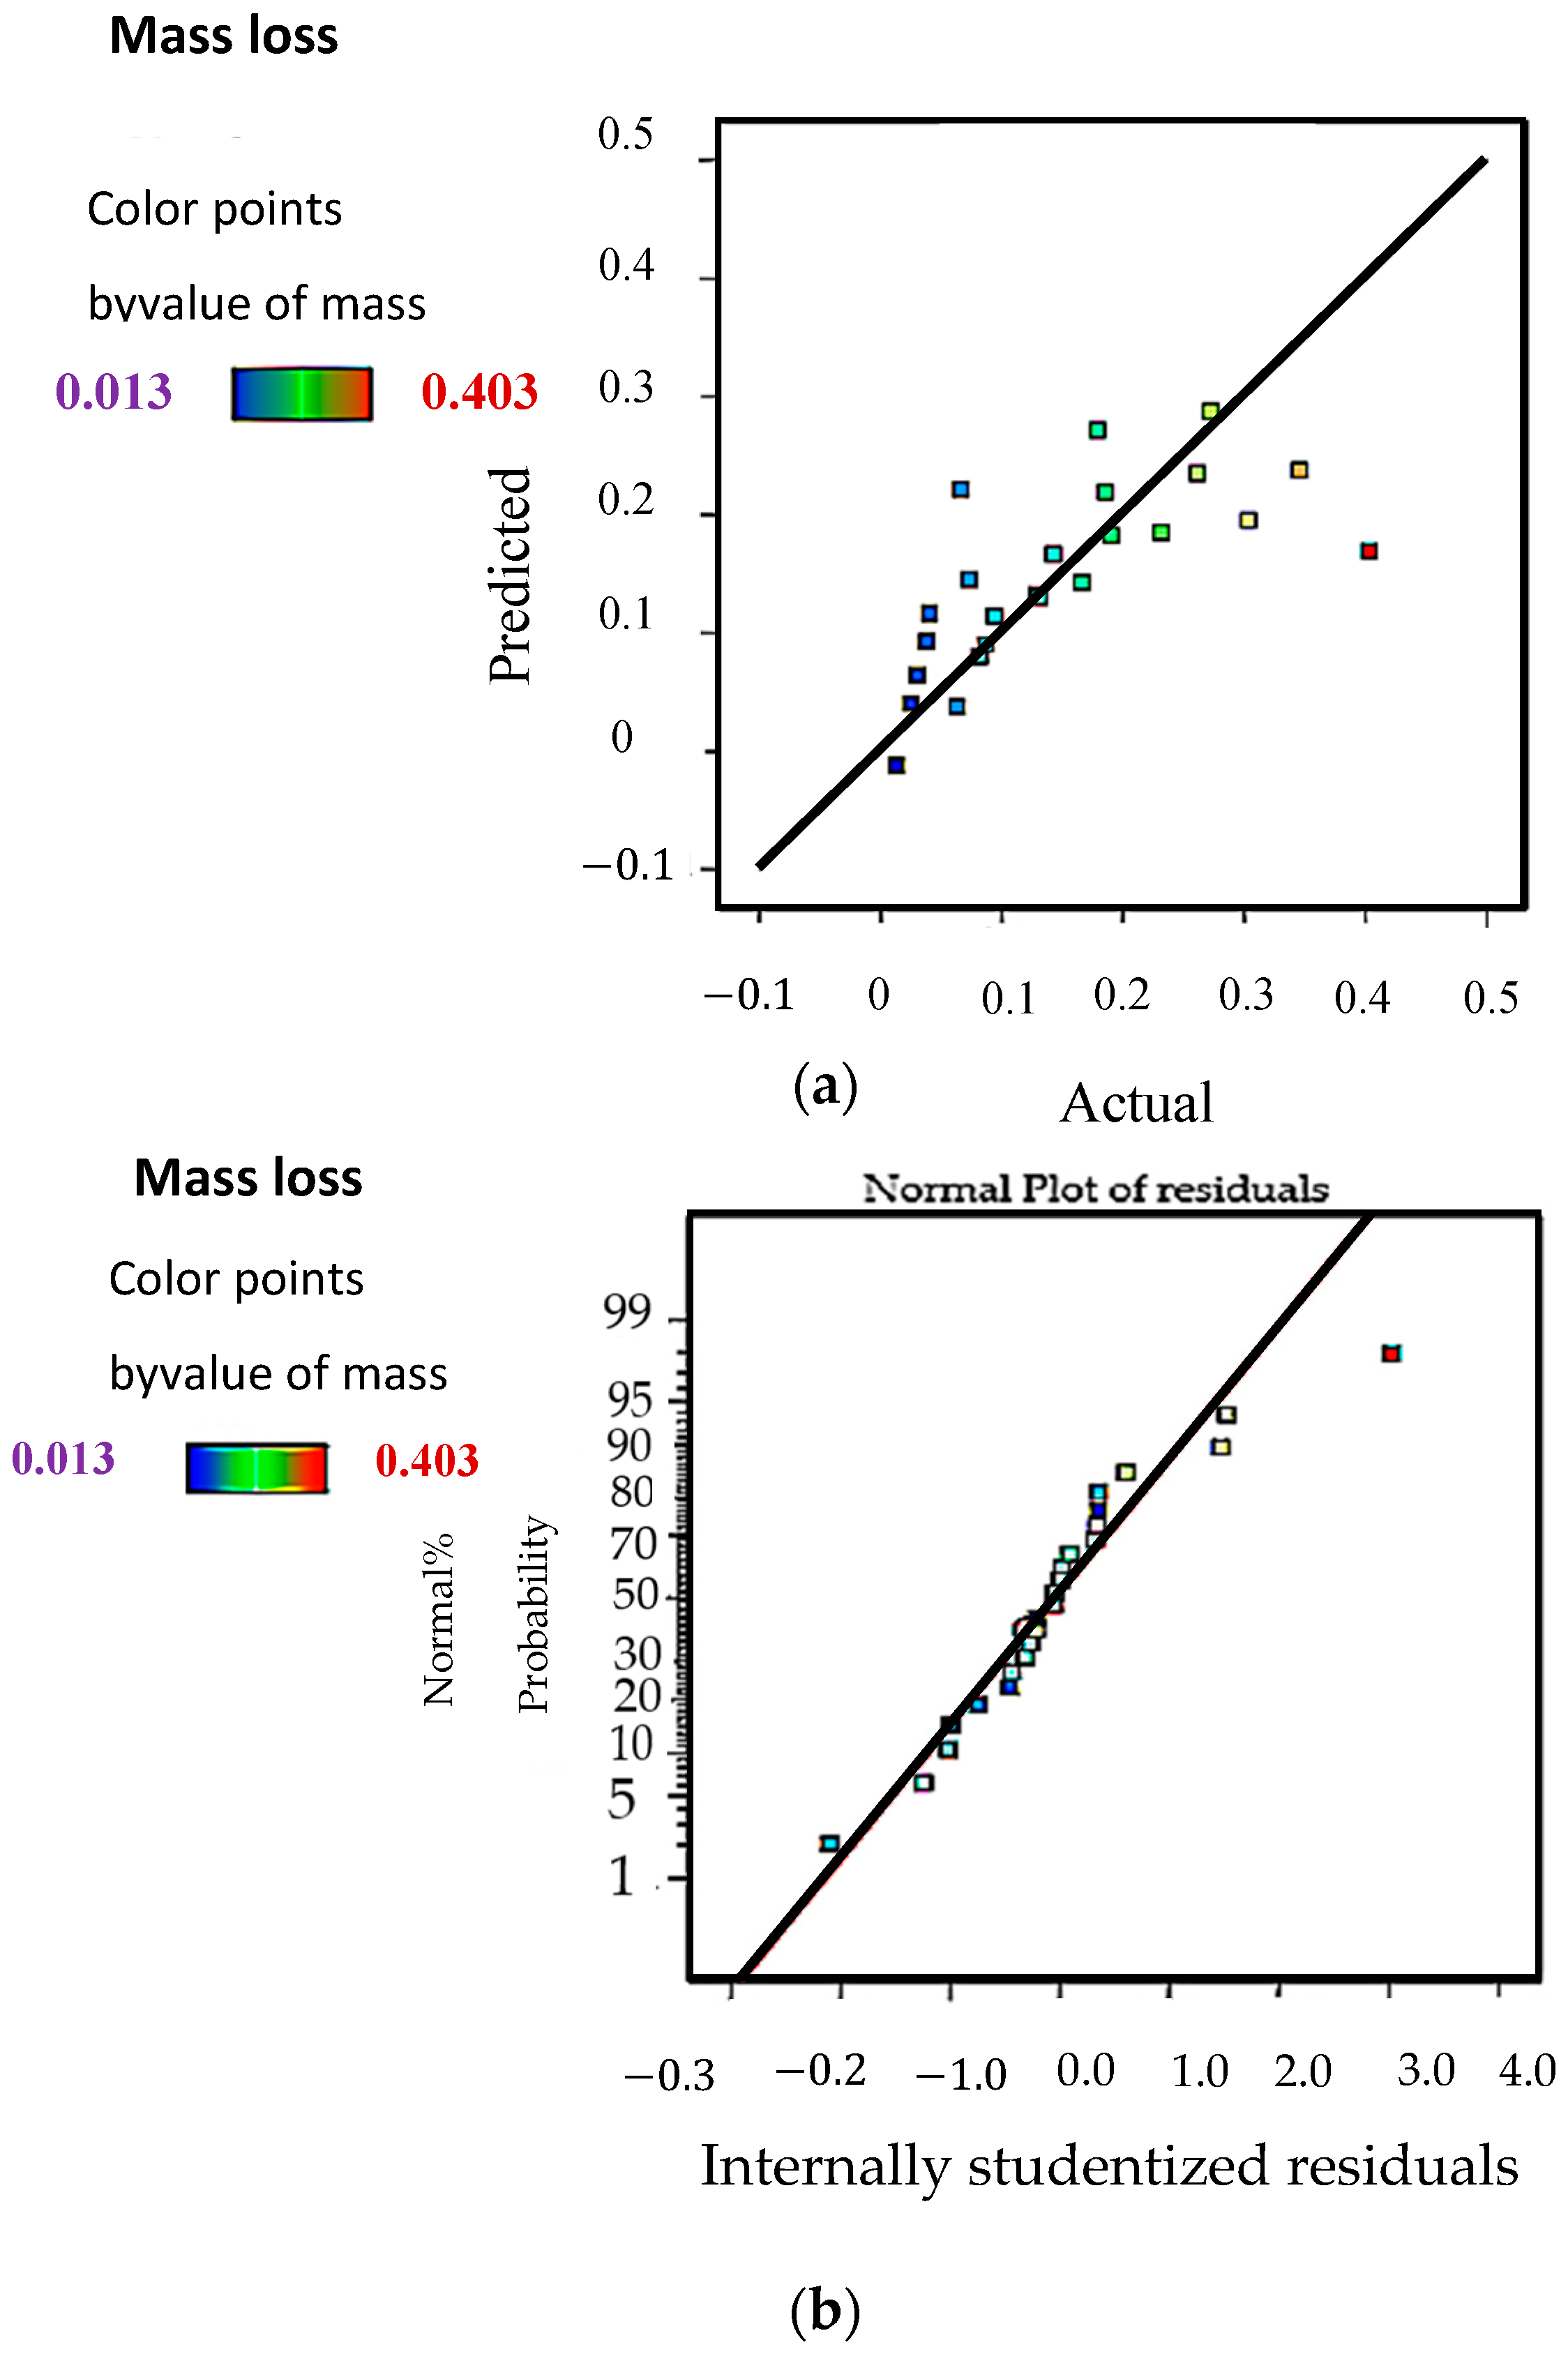
Figure 4 displays the normal probability plots of mass loss, generated from the CCD matrix. These plots reveal a pronounced linear trend with minimal deviations from the regression line, indicating a strong linear correlation. Even extreme values adhere to this trend, reinforcing the notion of a robust linear relationship. Additionally, no significant outliers were observed compared to the normal distribution, confirming the validity of the CCD matrix for parameter interaction (p > 0.05).
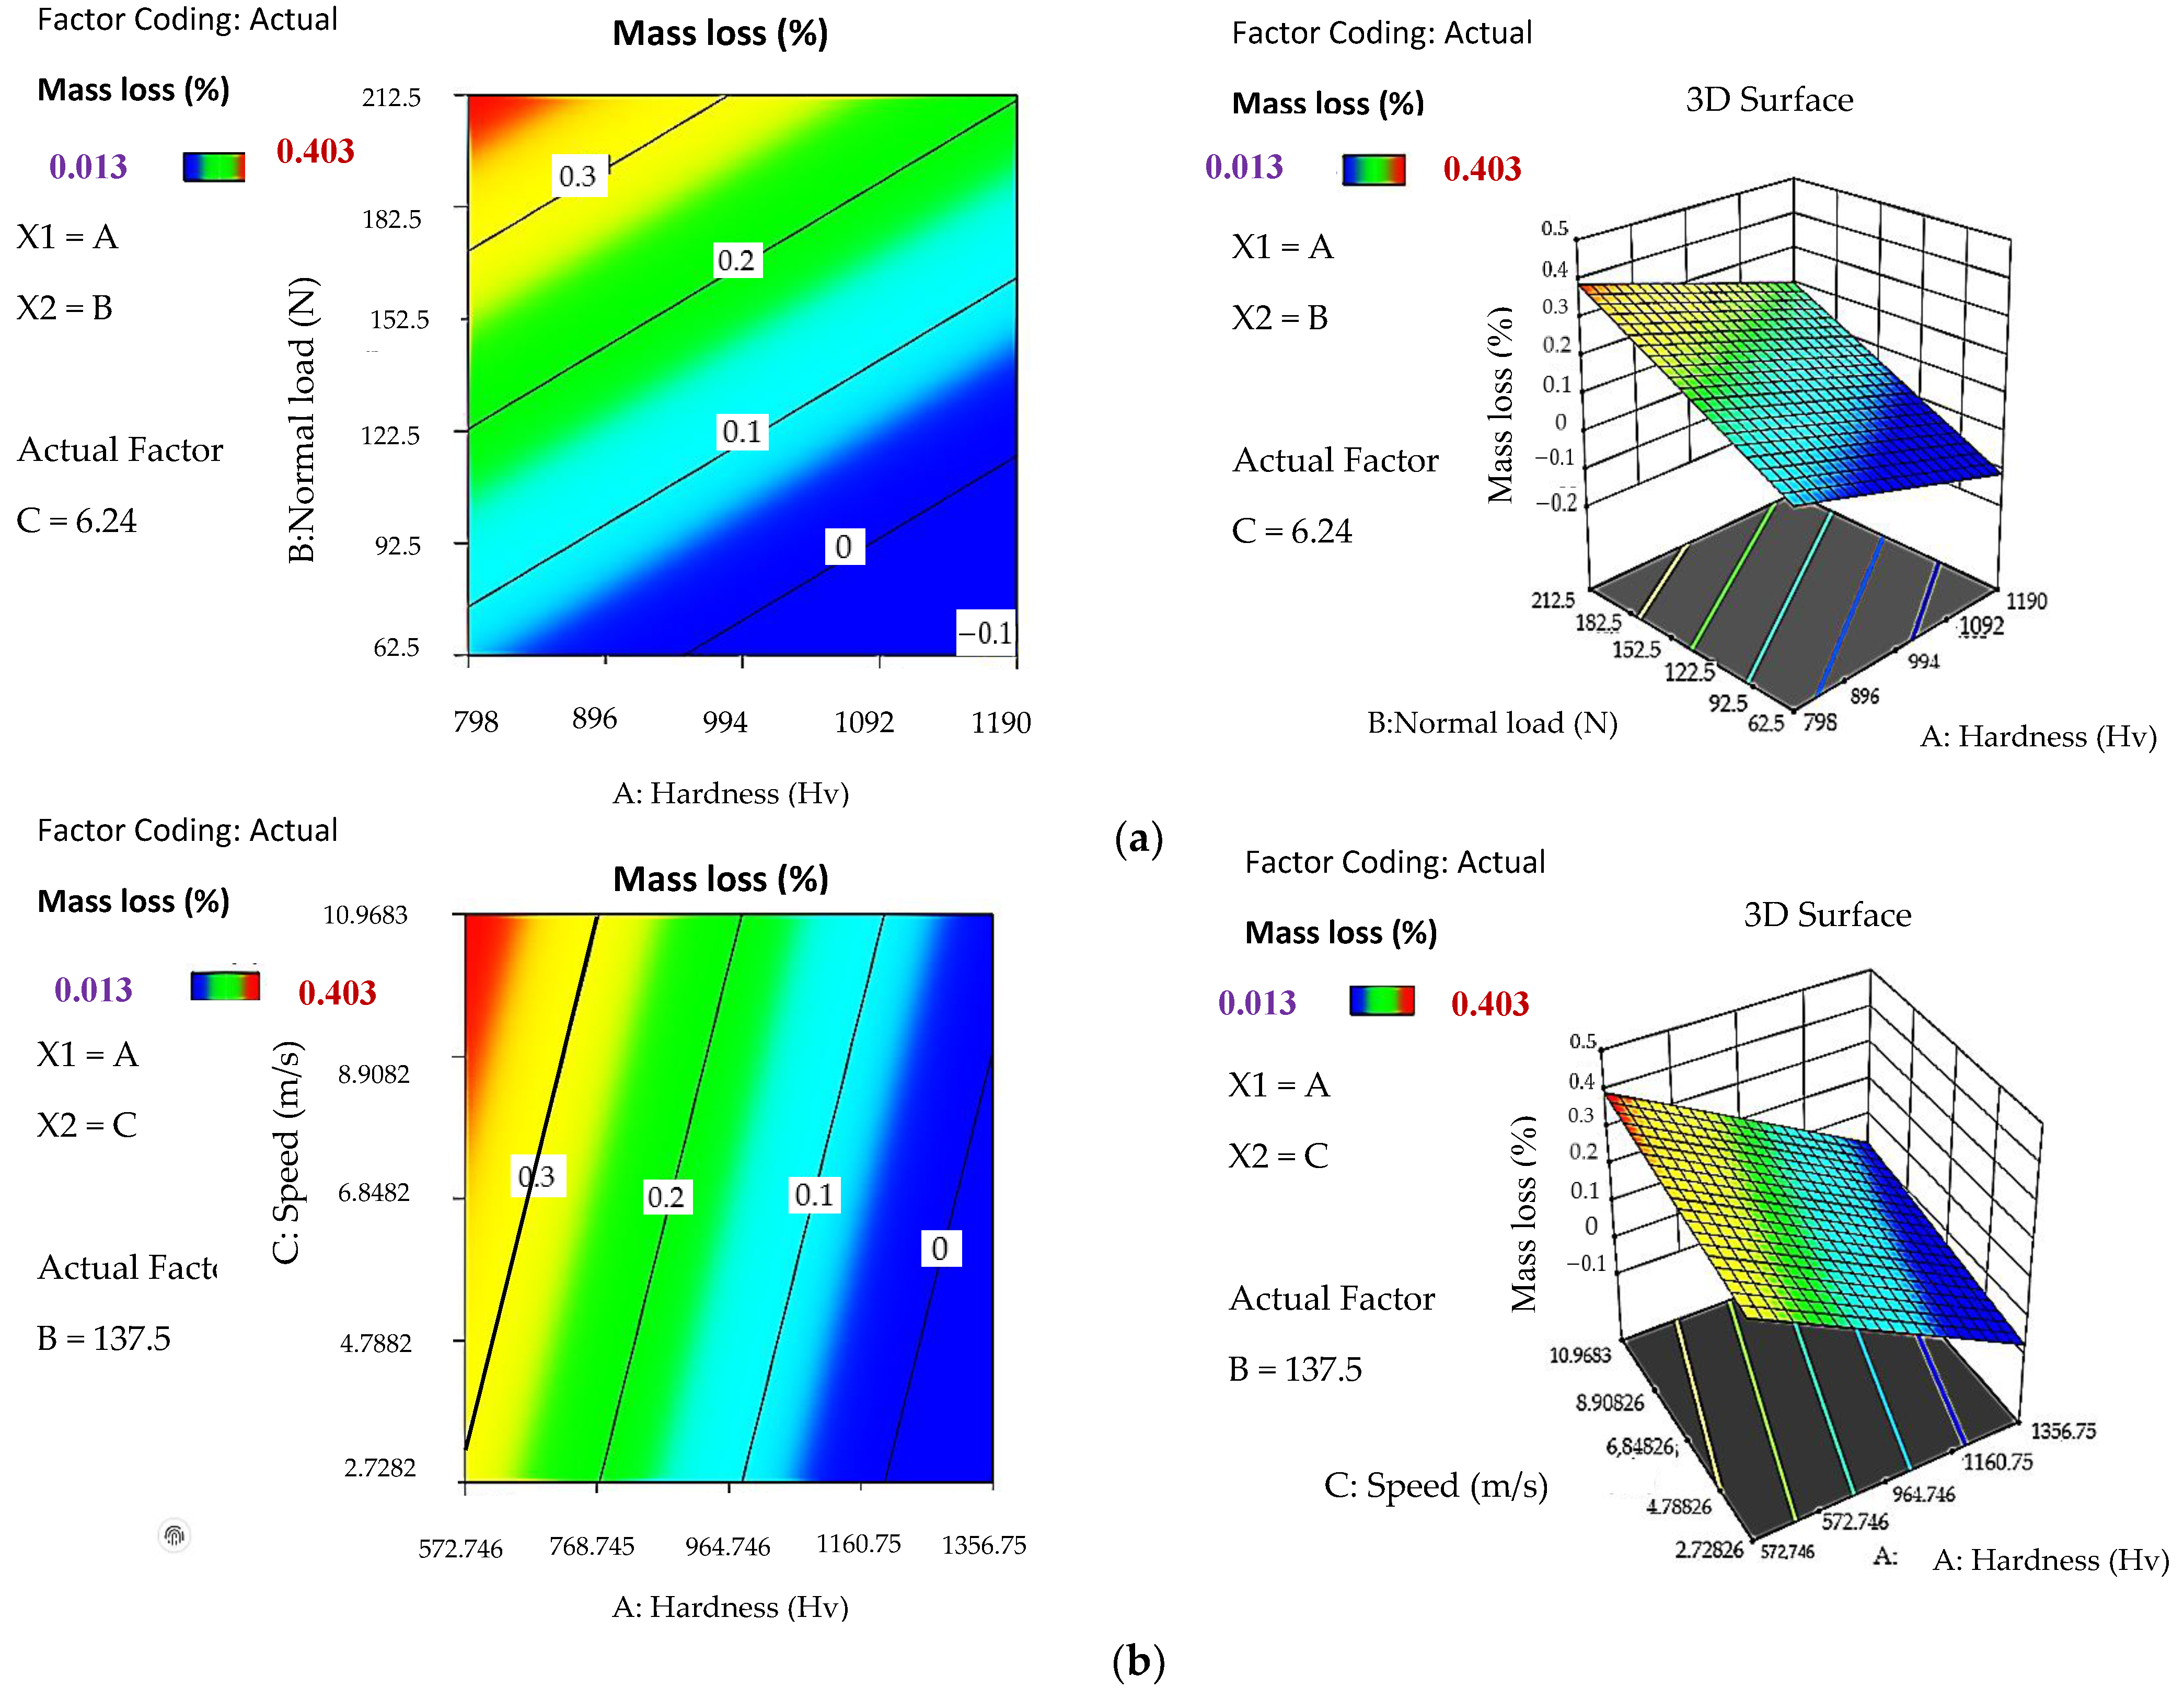
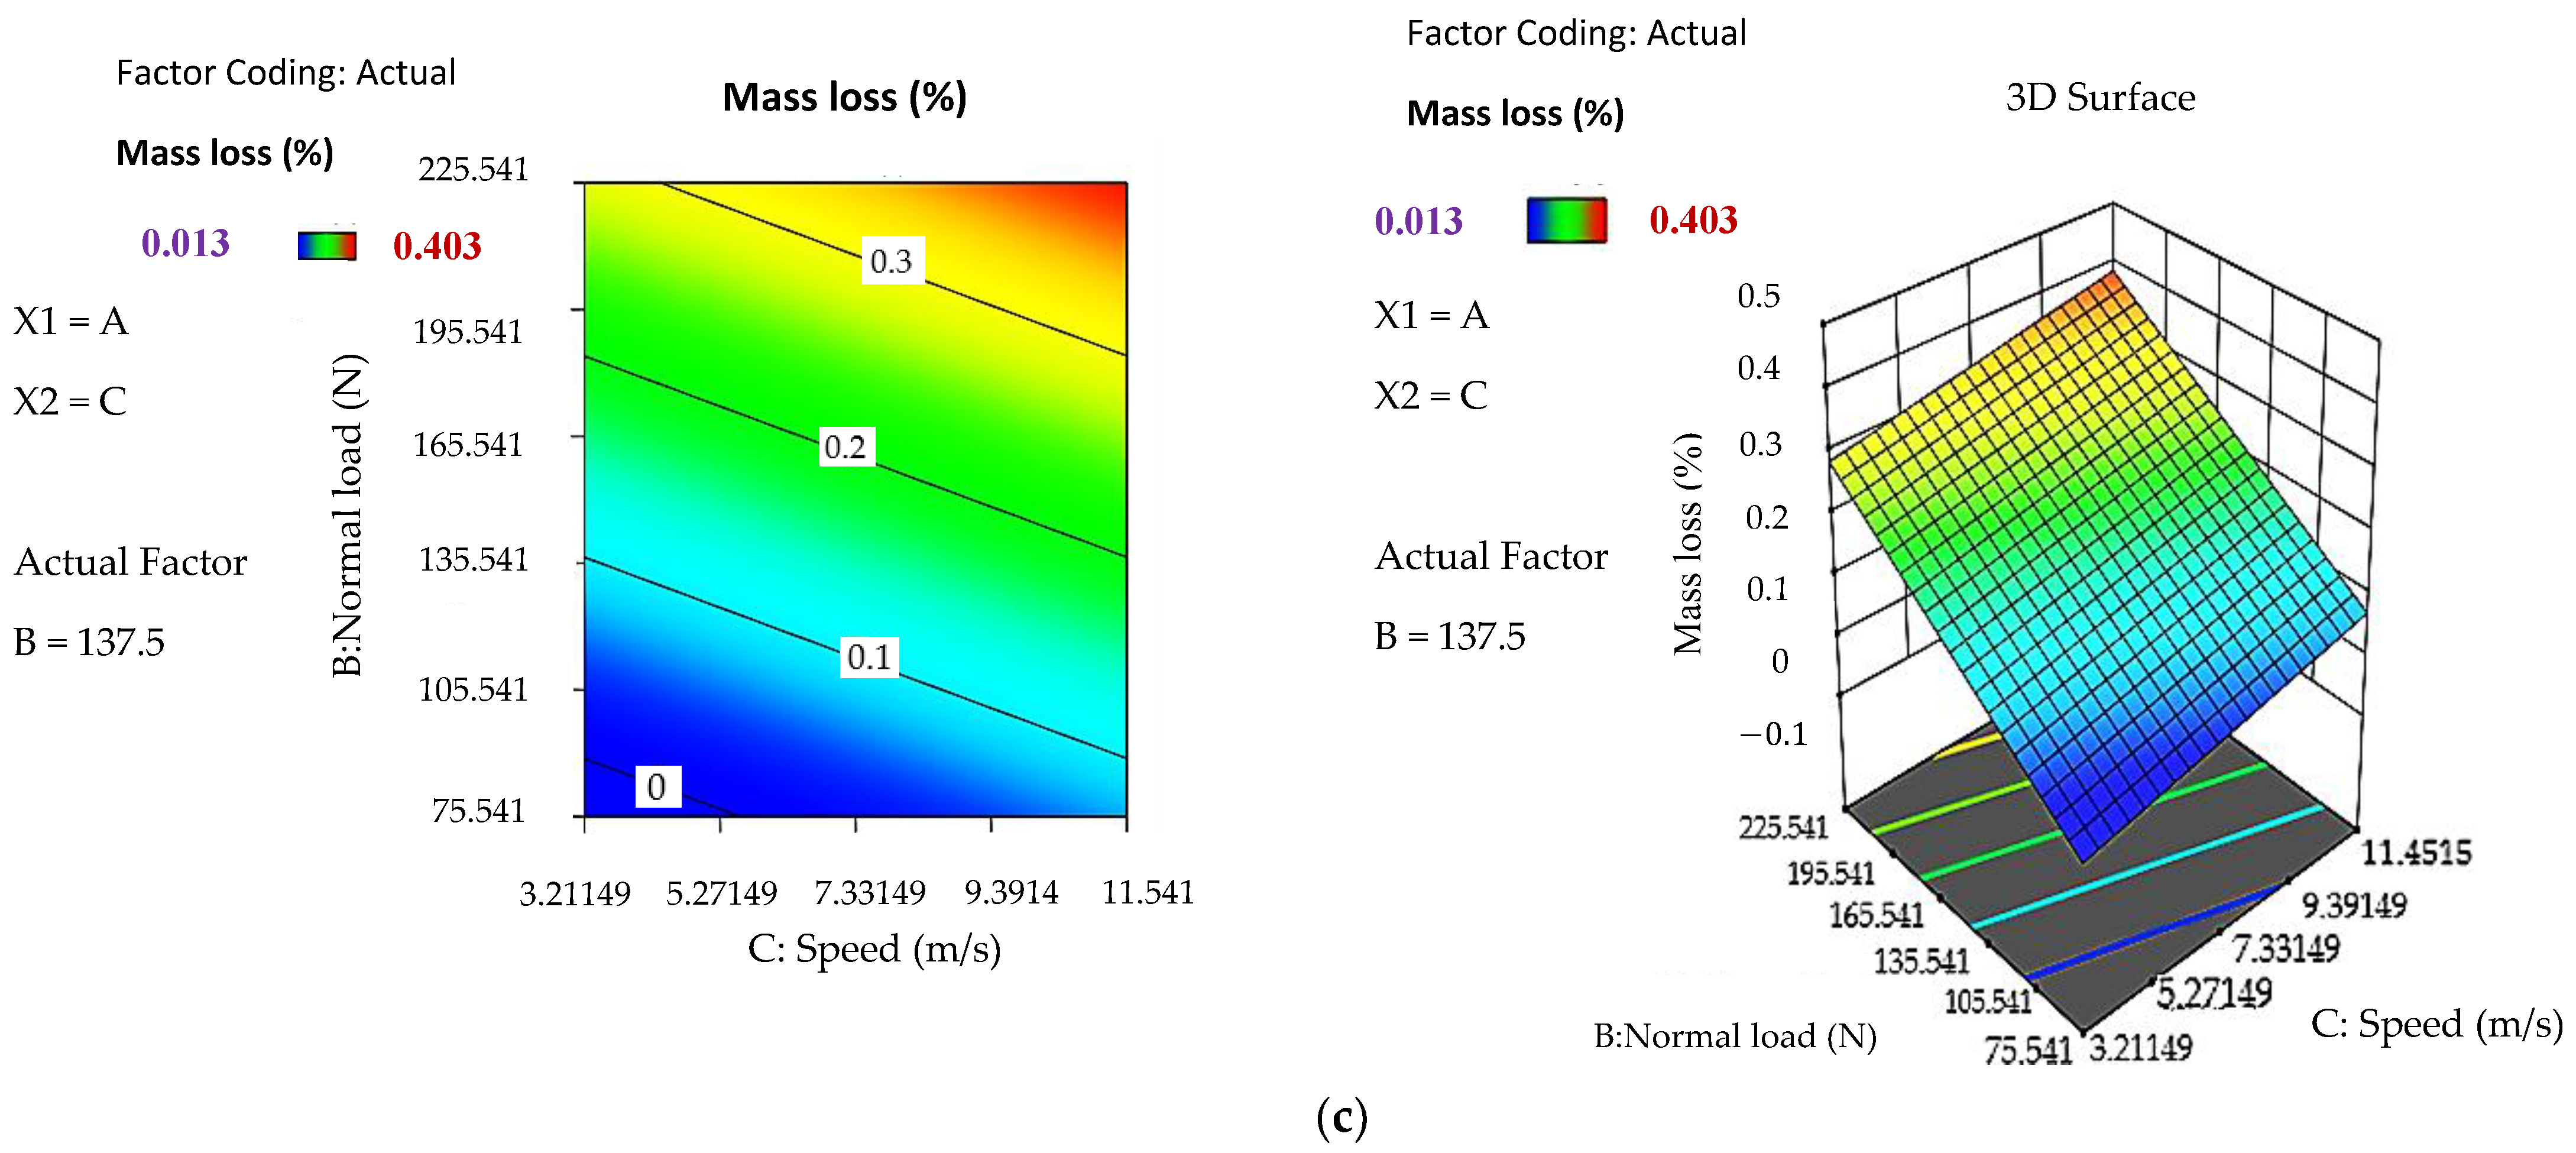
Figure 5 presents a three-dimensional (3D) model and plot surfaces, As shown in Figure 5a, increasing the hardness of the parts at a fixed sliding speed of 6.24 m/s and a fixed normal load of 137.5 N reduces mass loss to −0.1, due to the textural and morphological modification of the white layer and the nitriding diffusion layer, as confirmed by several authors [19]. Increasing the normal load for a fixed hardness of 798 HV up to 122.5 results in a mass loss of 0.2%, and a further increase to 182.5 leads to dangerous wear above 0.3% (Figure 5b). Similarly, increasing the sliding speed to 4.78826 m/s for a constant hardness of 572.746 HV also results in dangerous wear above 0.3%. However, For a hardness greater than 964 HV, the sliding speed does not have a notable influence. Figure 5c illustrates both the normal load and sliding speed at a fixed hardness of 994 HV. A wear force varying from 170 to 212.5 and a sliding speed varying from 5 to 10 m/s result in catastrophic wear and a mass loss reaching 0.4%. The interaction between these two variables led to a weak layer.
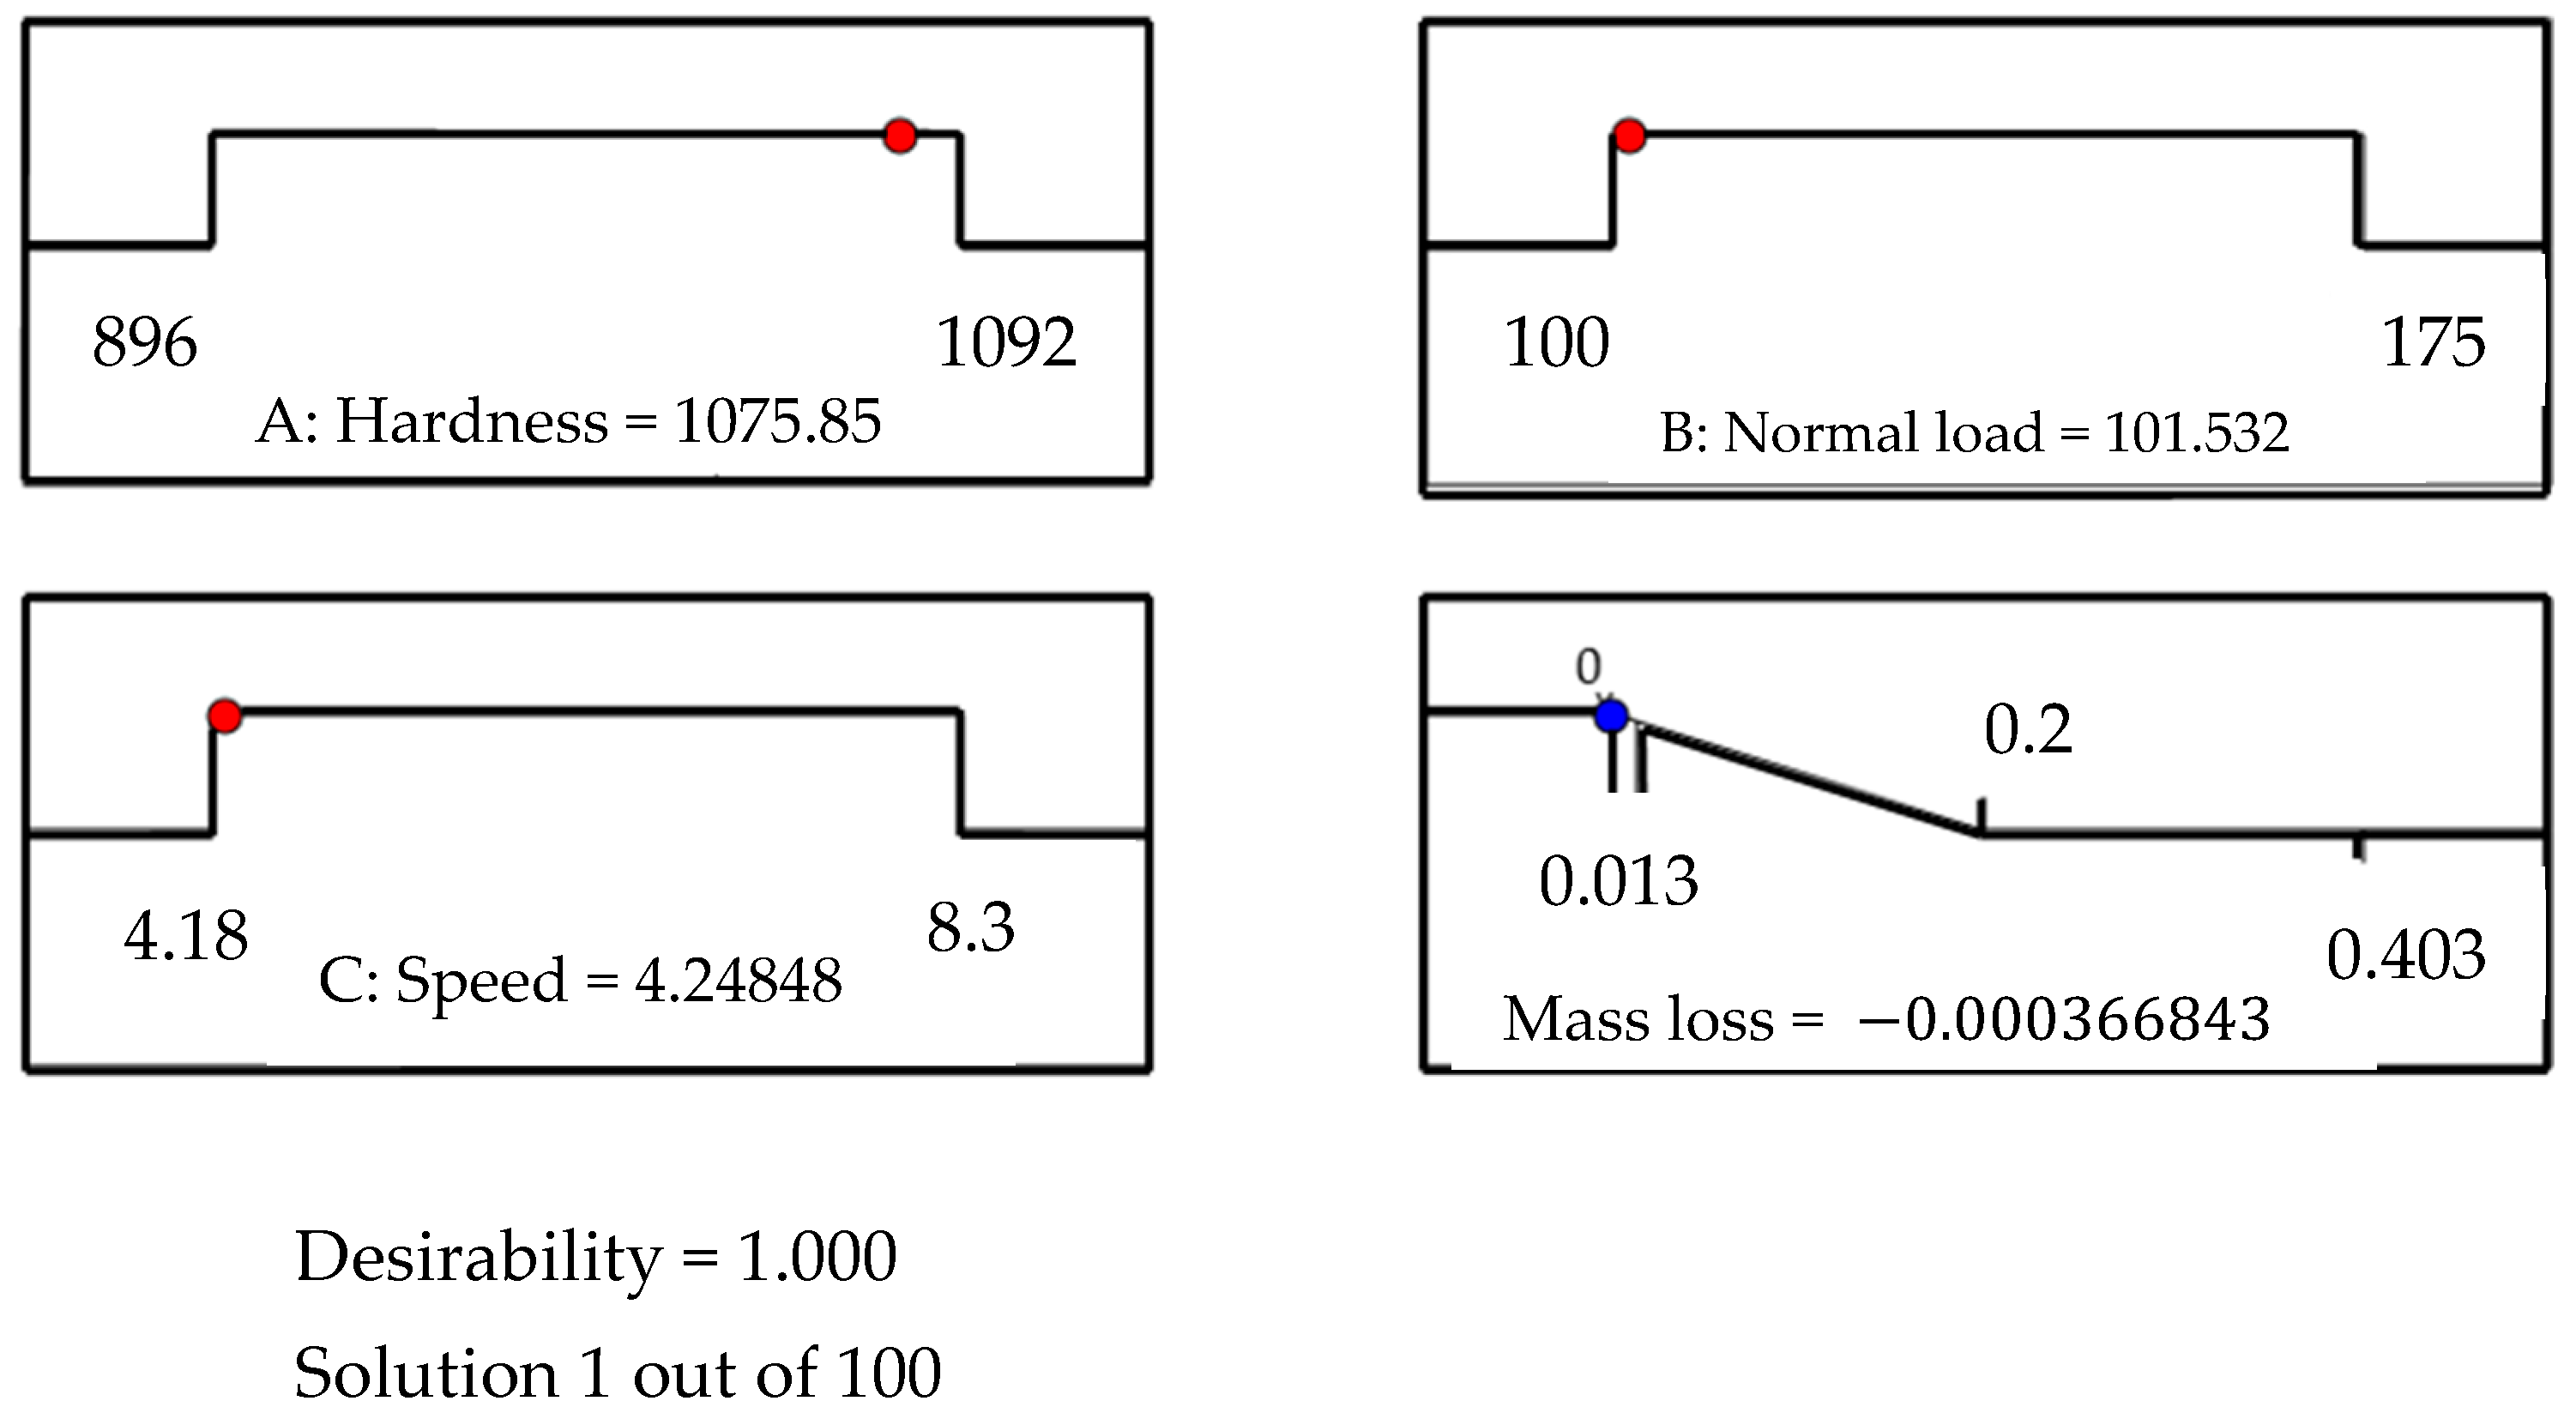
The response optimizer, illustrated in Figure 6, is an effective tool for determining the optimal values of several parameters, including hardness (H), normal load (F), and speed (V). To validate the predictions of this tool, confirmation experiments were carried out using the optimal parameters predicted represented by blue points according to the response surface method (RSM). The optimal values obtained were 1075.85 HV for hardness, 101.532 N for normal load, and 4.24848 for speed, producing a response of 0.00036, represented by a red point. These results confirm the effectiveness of the response optimizer in predicting optimal conditions.

3.4. Artificial Neural Network Models

3.4.1. Prediction

As illustrated in Table 8, a comprehensive analysis of the most reliable predictions is provided, with those predictions that display correlation coefficients approaching a maximum of 1 for each algorithm and each number of hidden layers for the three activation functions. The predictions are derived from the training, validation, and test phases. In order to circumvent the issue of over fitting (whereby the prediction model adapts excessively well to the training data, thereby compromising its capacity to generalize correctly to new data), the mean square error (MSE) and its square root (RMSE) are calculated subsequently. This approach ensures that the model’s performance is evaluated comprehensively, thus avoiding the issue of over fitting.
Following a thorough evaluation of the results, it was determined that the sigmoid function, in conjunction with the Bayesian regularization algorithm that employs the ‘trainbr’ function for learning, is most effective when utilized within the following network structure: The employment of 12 neurons at the input, in conjunction with two hidden layers (12 trainbr 2), has been demonstrated to facilitate the attainment of a correlation coefficient that approaches 1.0, in addition to achieving the minimization of the mean square error value, which is determined to be 0.000321.
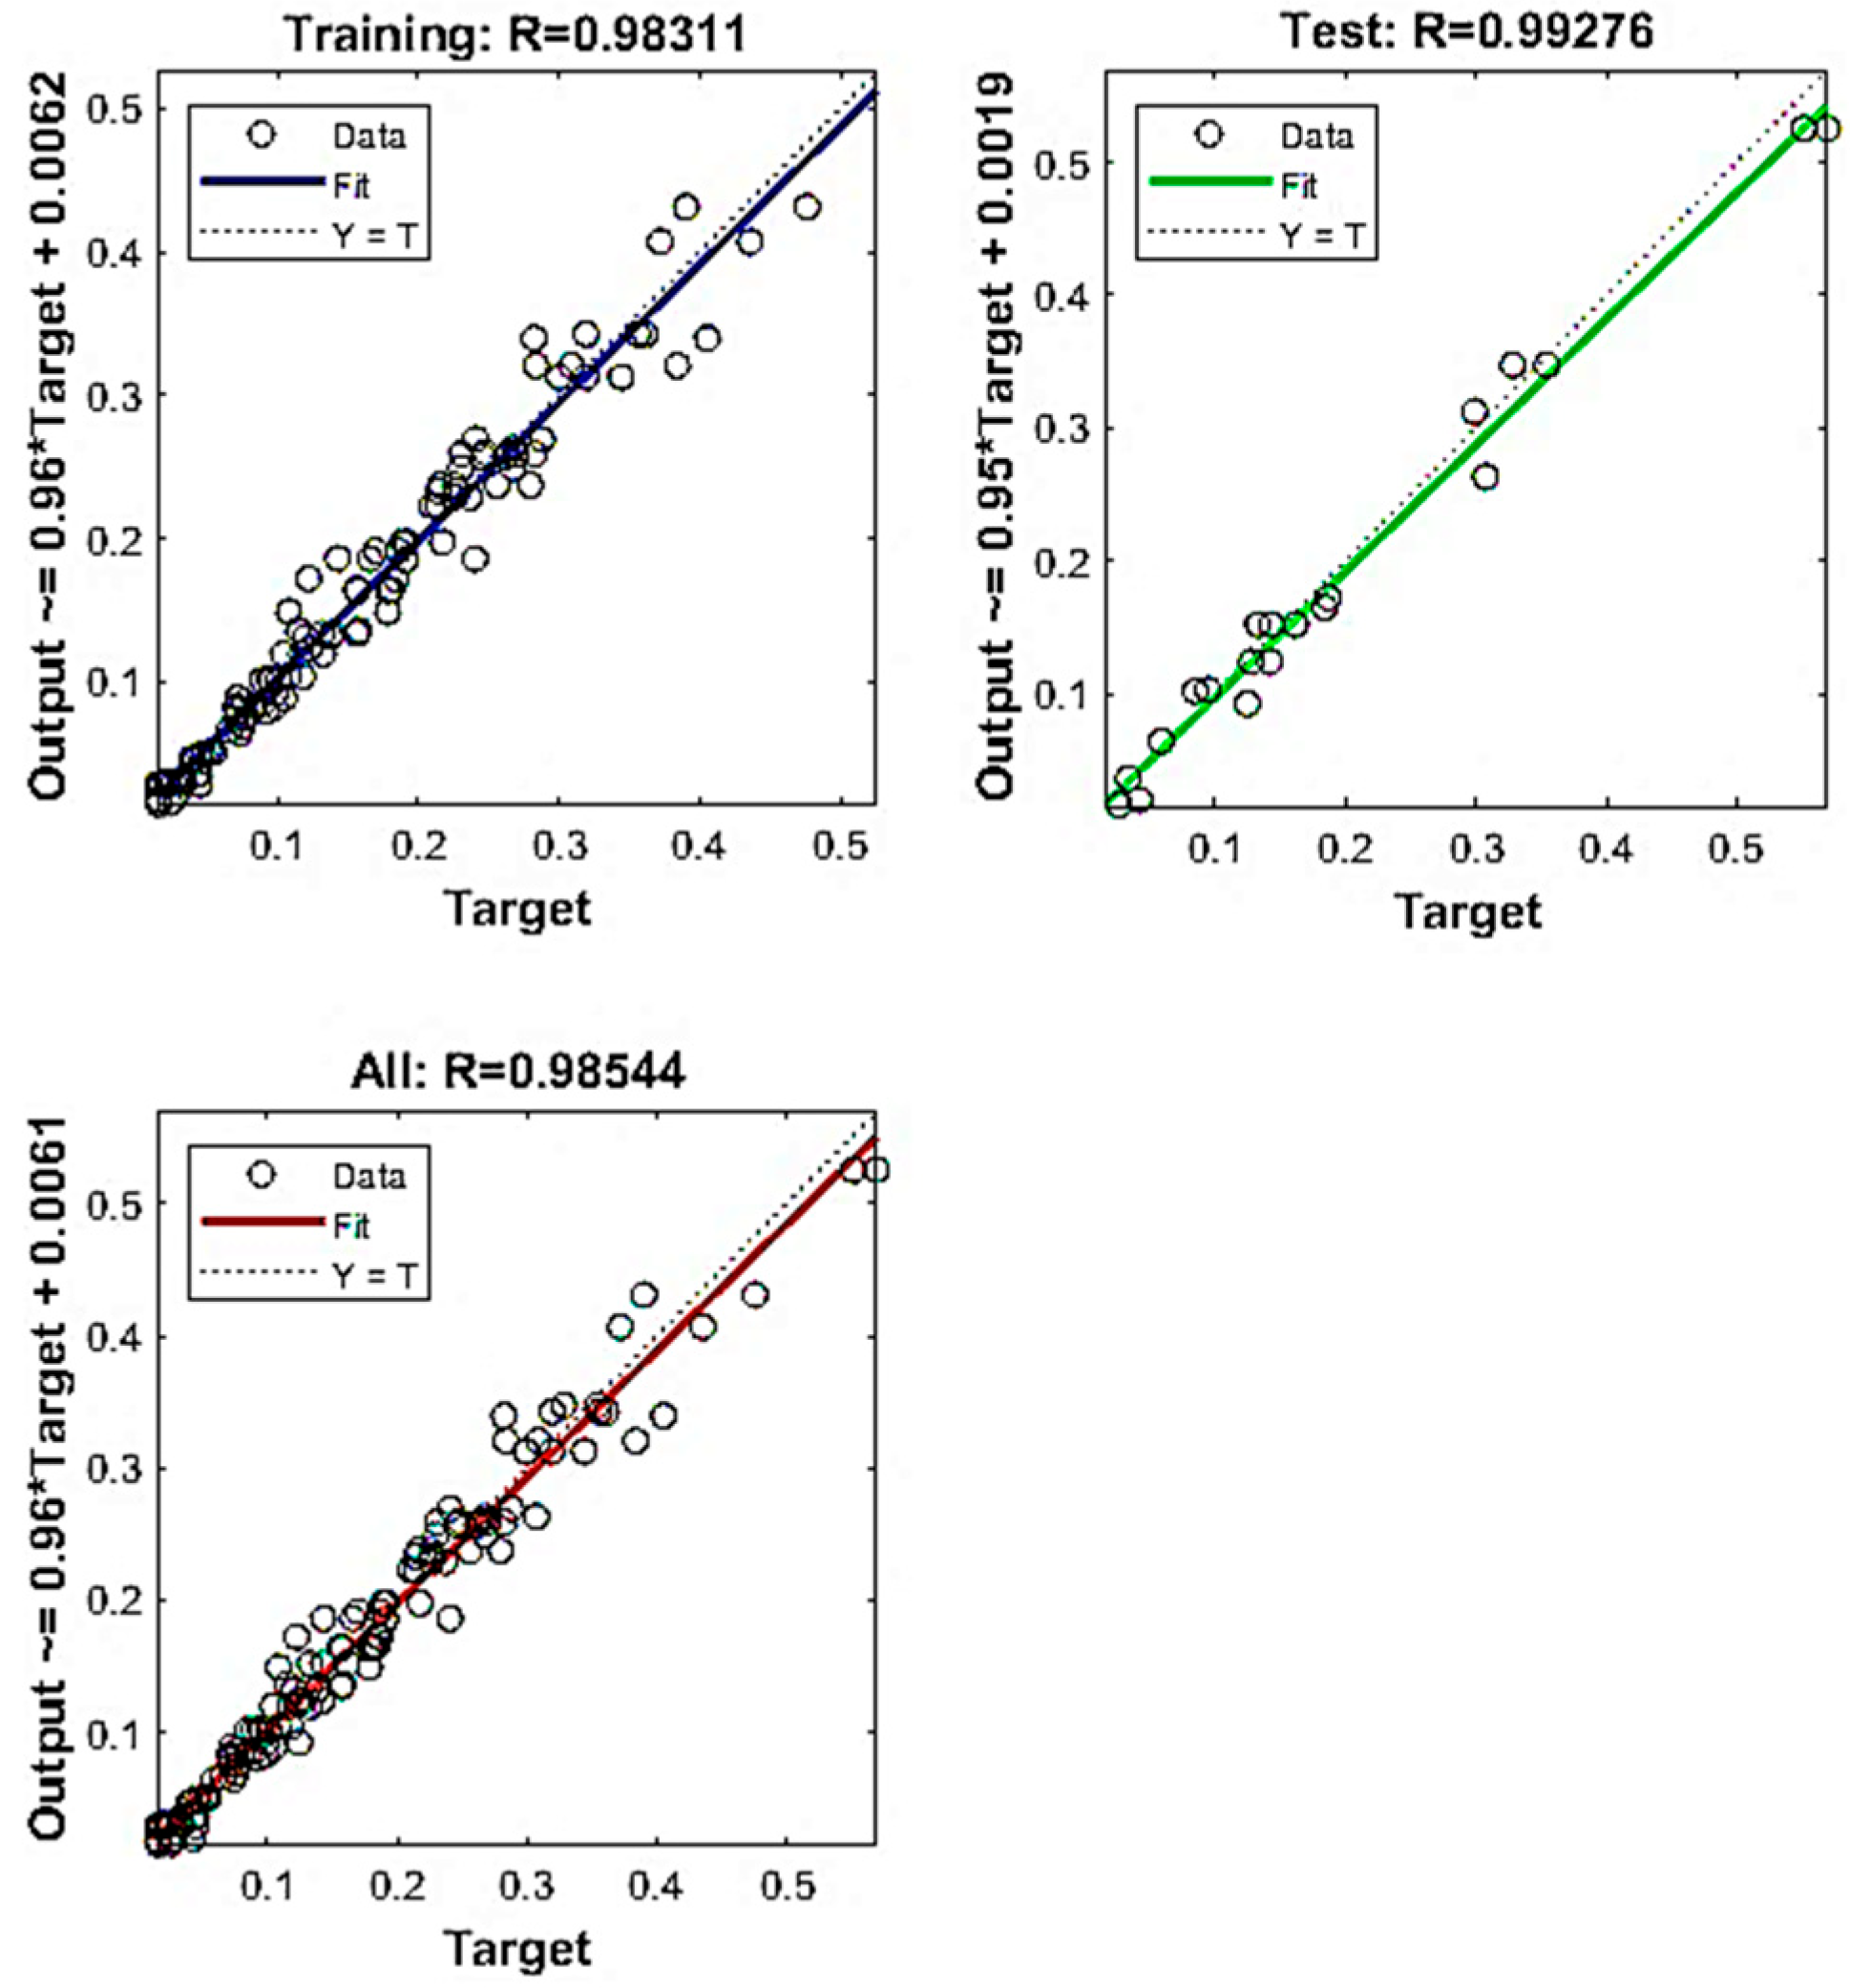
As illustrated in Figure 7, the experimental values are plotted against their corresponding predicted values. A thorough analysis of this figure reveals that the intersection points between the experimental values and the estimated values are in close proximity to the median line for the training and validation sets. This observation serves as a testament to the efficacy of the ANN model. Following the verification of the optimal result obtained by the neural network, a comparison was made between the value obtained by the prediction and that obtained through experimental means.
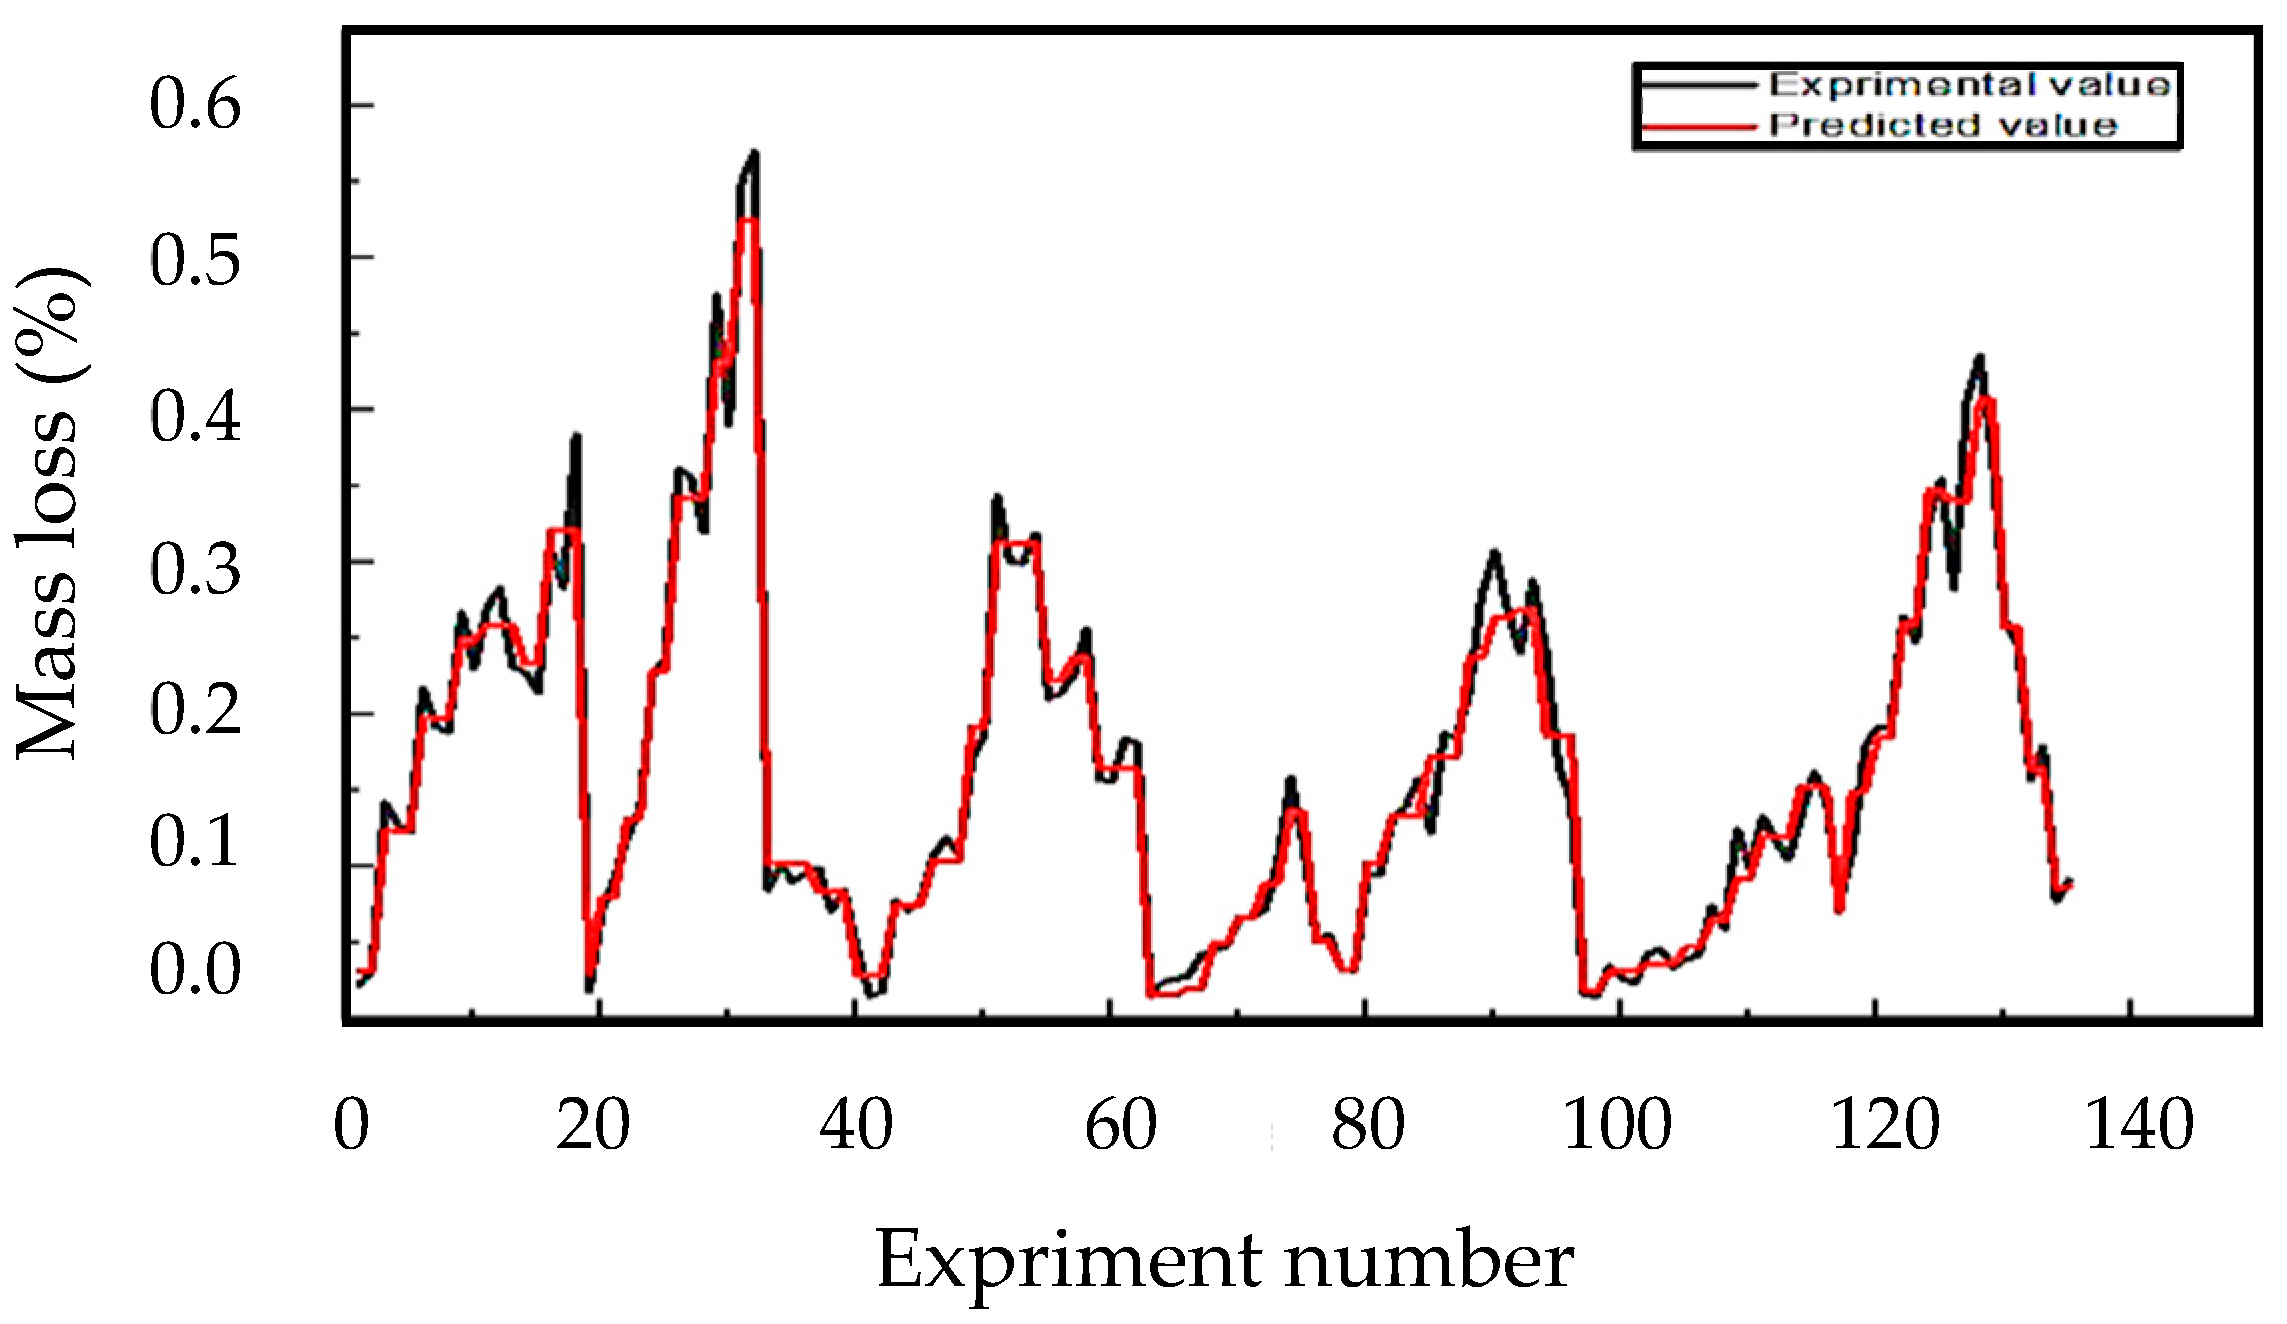
This comparison facilitated the verification of the prediction model’s accuracy in relation to the experimental data, as well as the analysis of the discrepancies between the two. The quality of the prediction model was thus able to be evaluated, and adjustments were made if necessary to improve its accuracy. In order to facilitate this comparison, a curve was plotted representing the values obtained by the prediction and the values obtained through experimental means. The utilization of this curve facilitated the visualization of the disparities between the two datasets, thereby enabling the assessment of the quality of the prediction model.
The prediction curve presented in Figure 8 is well adjusted to the experimental curve. This observation allows concluding that the prediction model is very accurate and reliable. Similarly, the curves representing the evolution of mass loss as a function of the test conditions of the experimental and predicted values are almost perfectly superimposed. This observation indicates that the prediction model is both accurate and reliable in line with recent trends in AI-based tribological modeling.
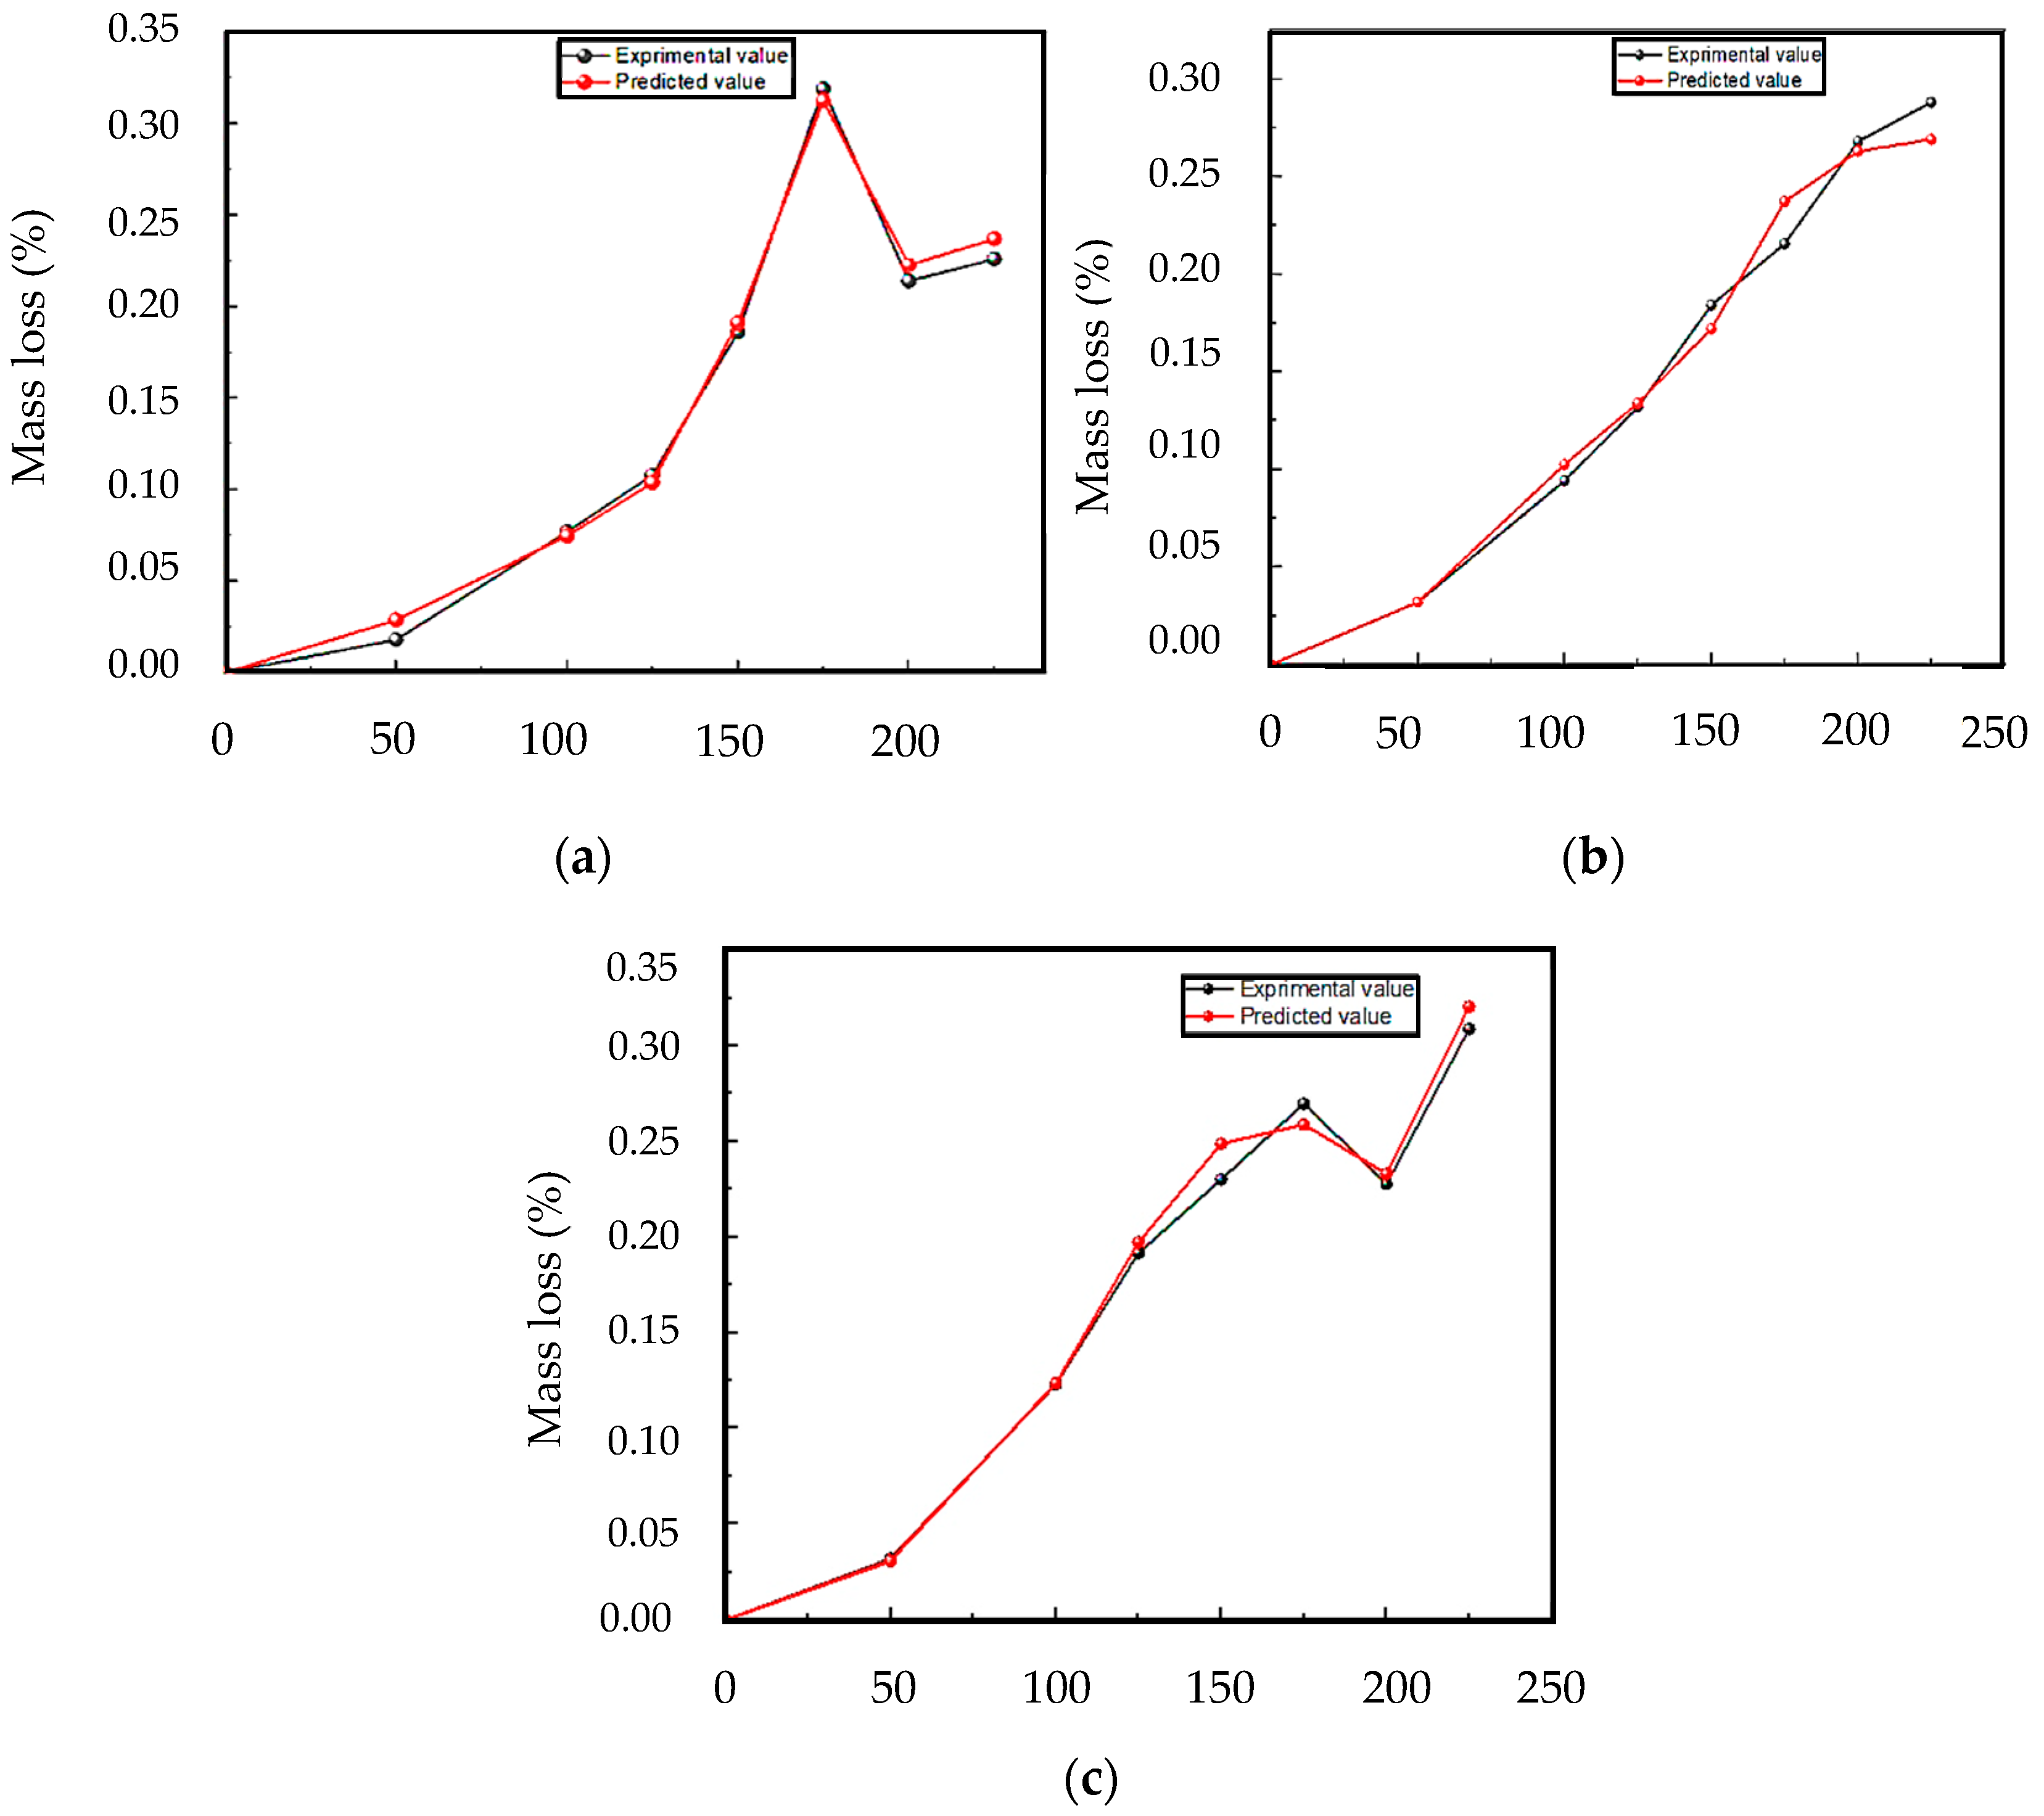
In what follows, Figure 9 presents the appearance of the variation in mass loss obtained by the experimental study and predicted by the retained neural system as a function of the test parameters that have a notable influence, namely: normal load F, wear speed Vg, and test duration for the different states of gas nitriding treatment studied (NG12, NG24, NG36).

3.4.2. Optimization of the Prediction by Neural Network

We will work with a plan of 27 trials, numbered from 1 to 27. After choosing the experimental plan corresponding to the input parameters and constructing this plan, we will fill it with the response correlation coefficient R, These factors, as well as their type and level, are presented in Table 9.
In this study, initial predictions were generated using MATLAB software. The primary objective was to optimize these predictions by identifying the most effective combination of parameters. These parameters included the activation function, the algorithm, the number of hidden layers, and the number of neurons, all of which were designed to maximize the correlation coefficient R. To this end, two distinct optimization algorithms were implemented: the Bayesian algorithm and the genetic algorithm. Bayesian networks (BNs) are notable for their status as robust probabilistic graphical models with regard to both modeling and reasoning [19,23,24,25].
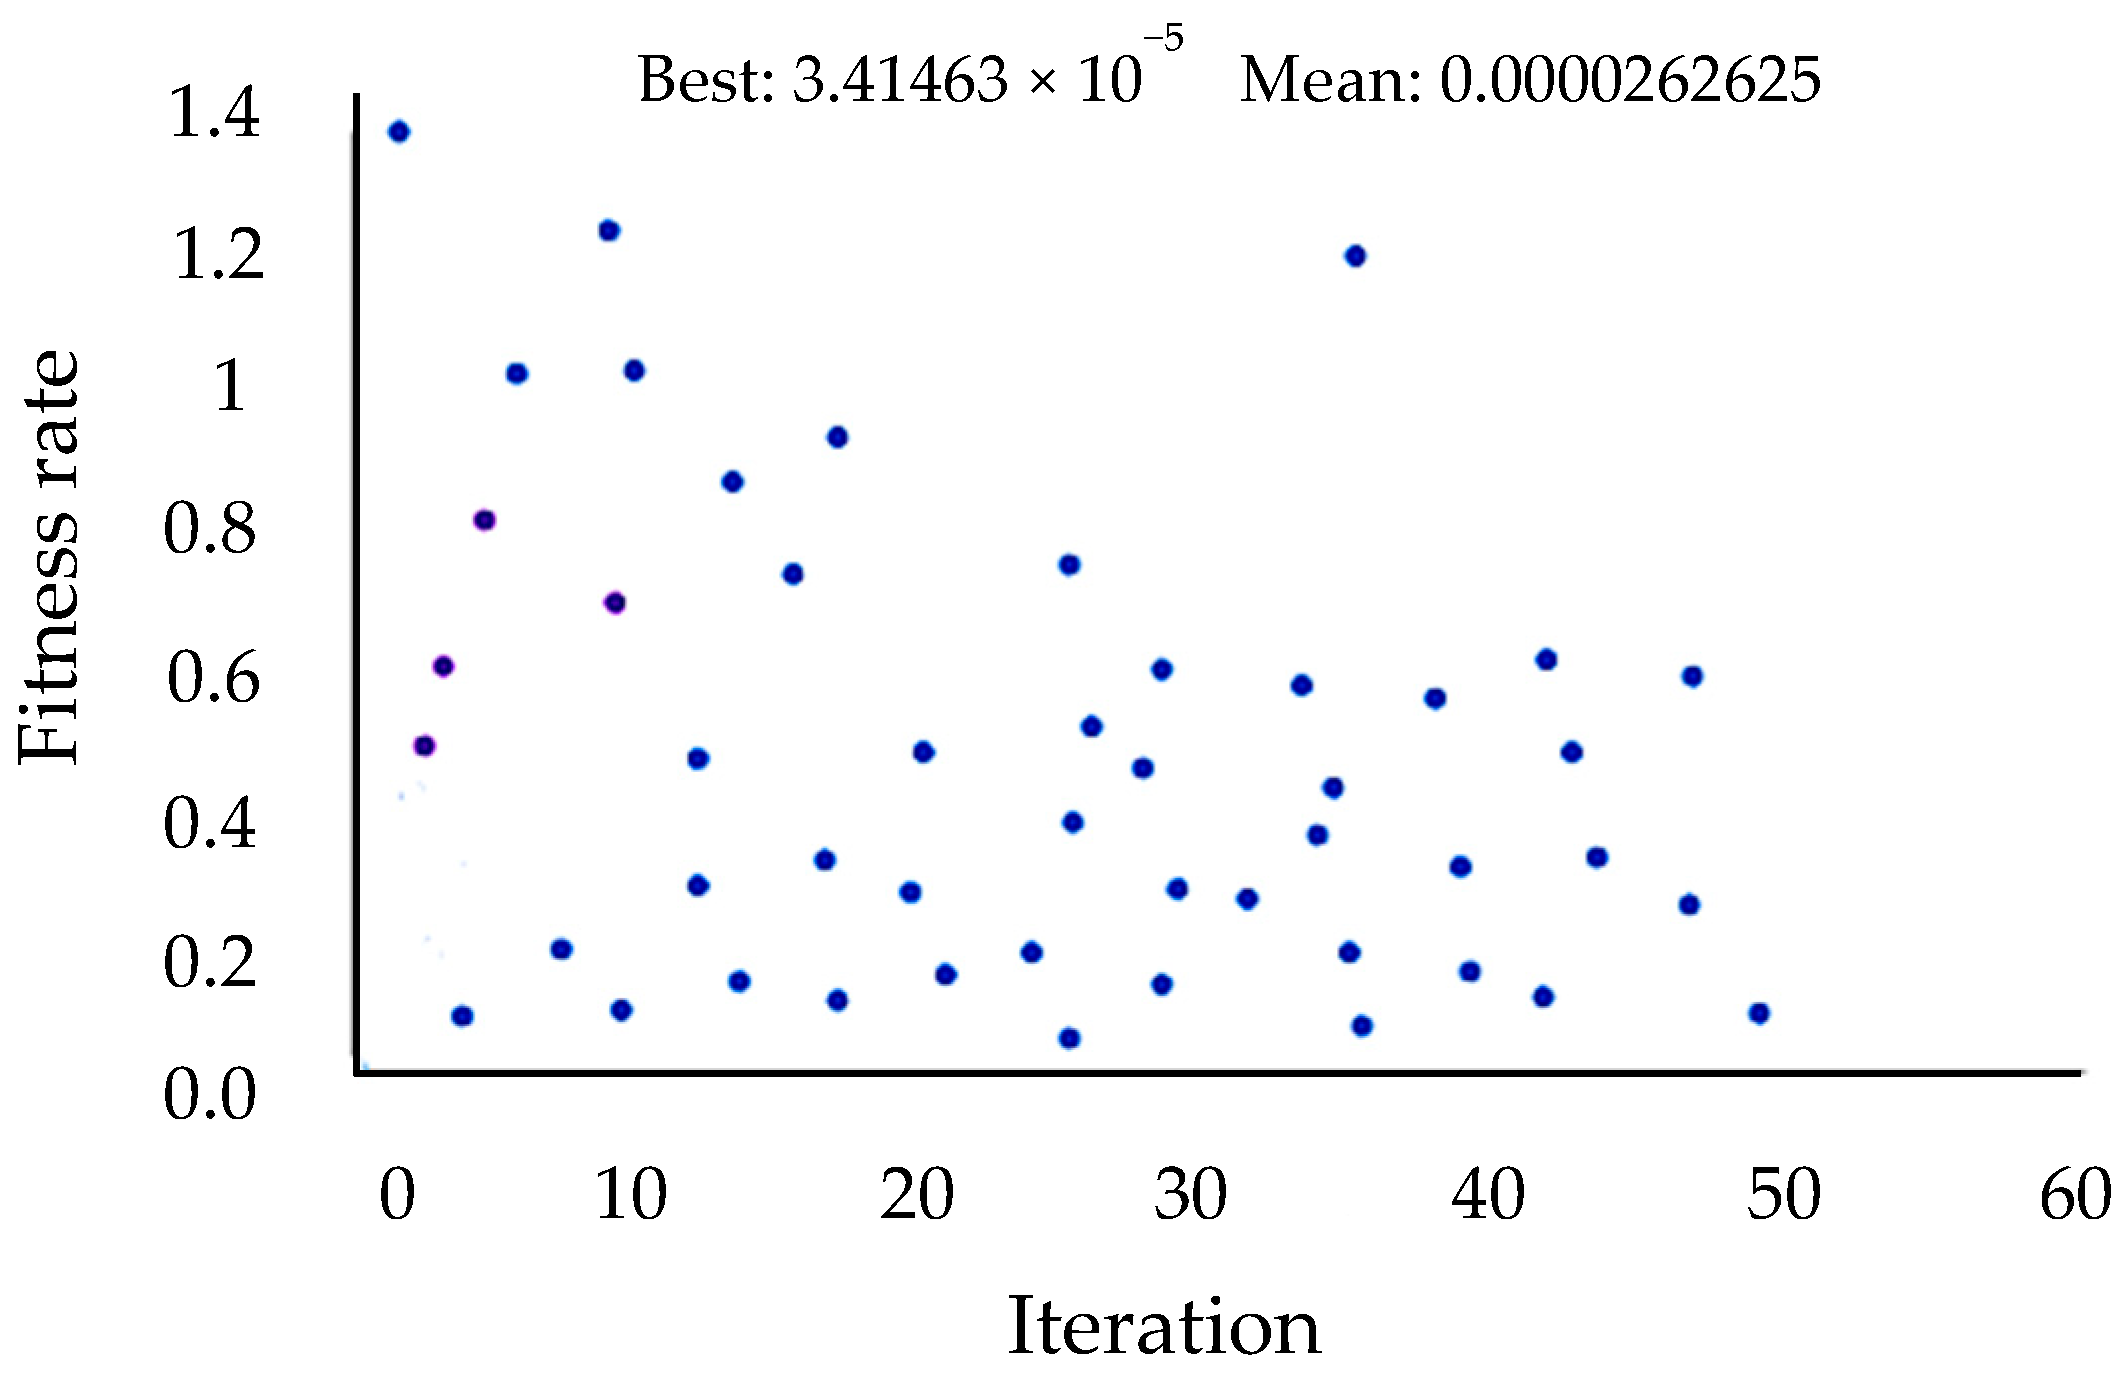
On the other hand, the genetic algorithm, an optimization method inspired by Darwin’s theory of evolution, was used to maximize the correlation coefficient R. This algorithm uses techniques such as selection, mutation, and crossover to generate a population of possible solutions. After 400 iterations, a correlation coefficient of 0.9962 was obtained (Figure 10) The optimal parameters were a hyperbolic activation function, the Trainbr algorithm, eleven hidden layers, and two neurons.
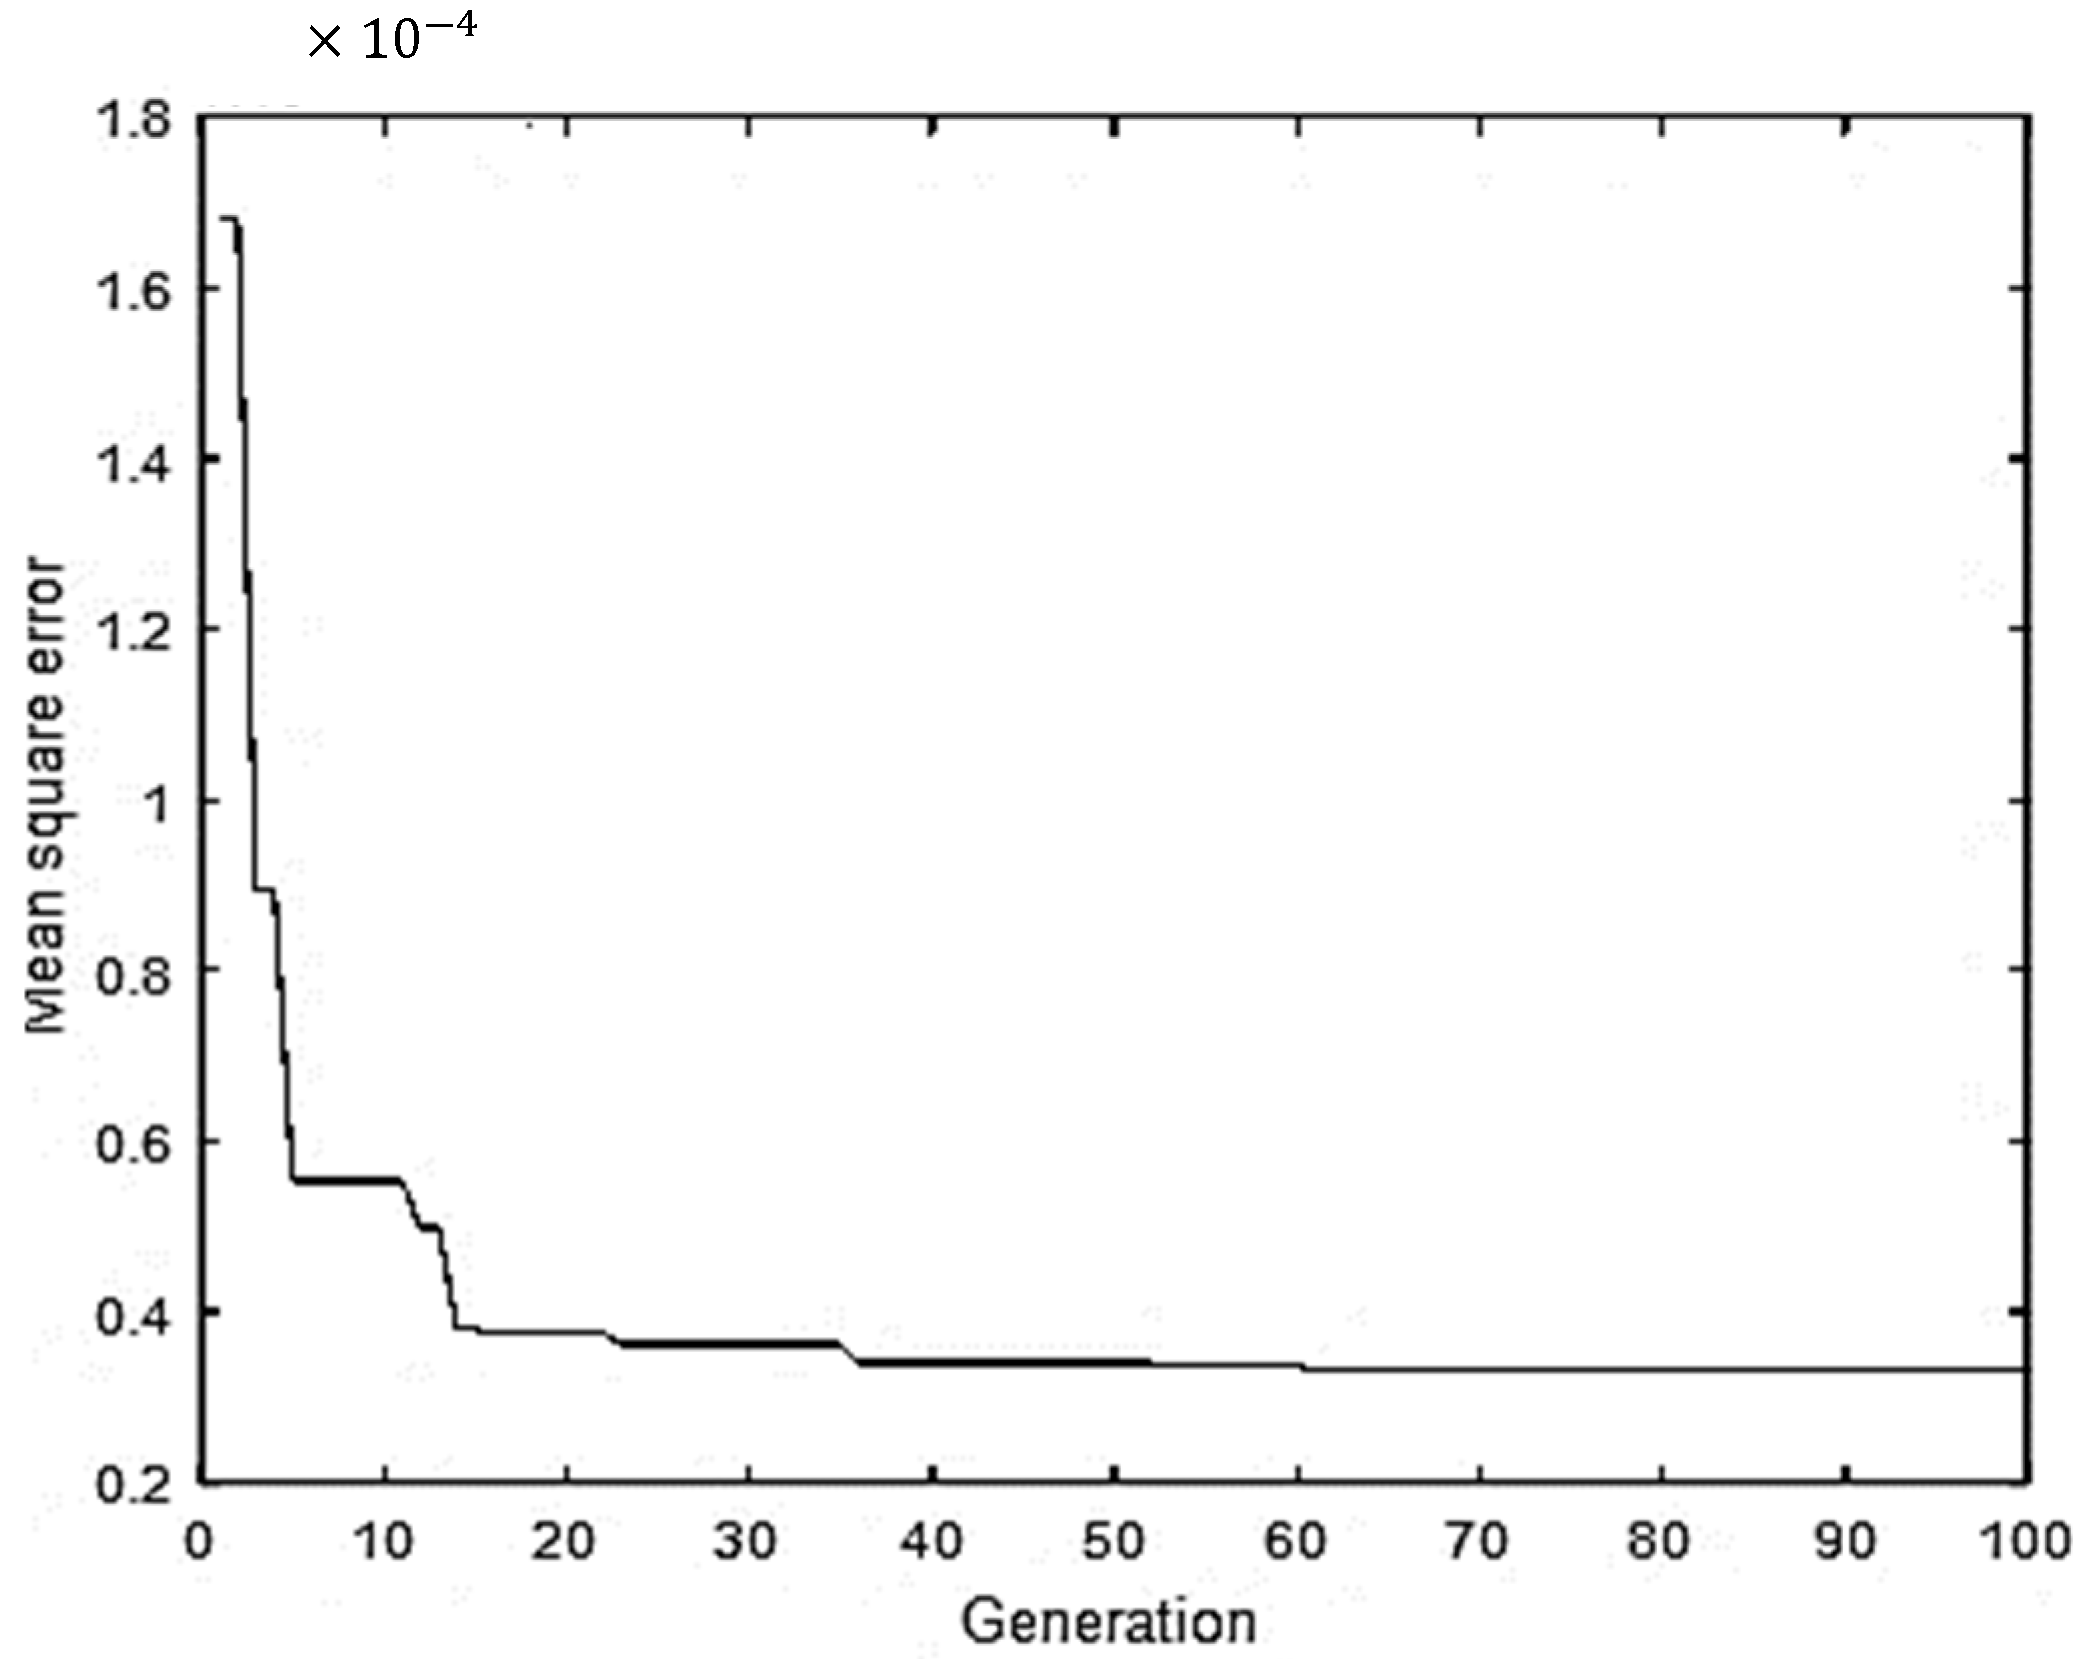
Figure 11 is a graph that shows the evolution of the mean square error over generations. There are error peaks at certain points, indicating a sudden increase in error at these specific generations.
The same optimal solution was found by these two algorithms, despite their different approaches. This highlights not only the efficiency of each individual algorithm, but also the power of their combined use. The hybrid approach adopted in this work (CCD-RSM, optimization by genetic algorithm, and ANN) aligns with the conclusions of Huang et al. [25] and recent studies on metallic composites, which show that combining statistical methods with artificial intelligence tools enhances predictive accuracy and model robustness. When comparing these two algorithms, it was observed that the Bayesian algorithm is more focused on exploiting existing information to make precise adjustments, while the genetic algorithm is more focused on exploring possible new solutions. The use of these two algorithms in parallel allows for both exploitation and exploration, leading to more robust and precise solutions.

3.4.3. Comparison of Predicted and Experimental Values

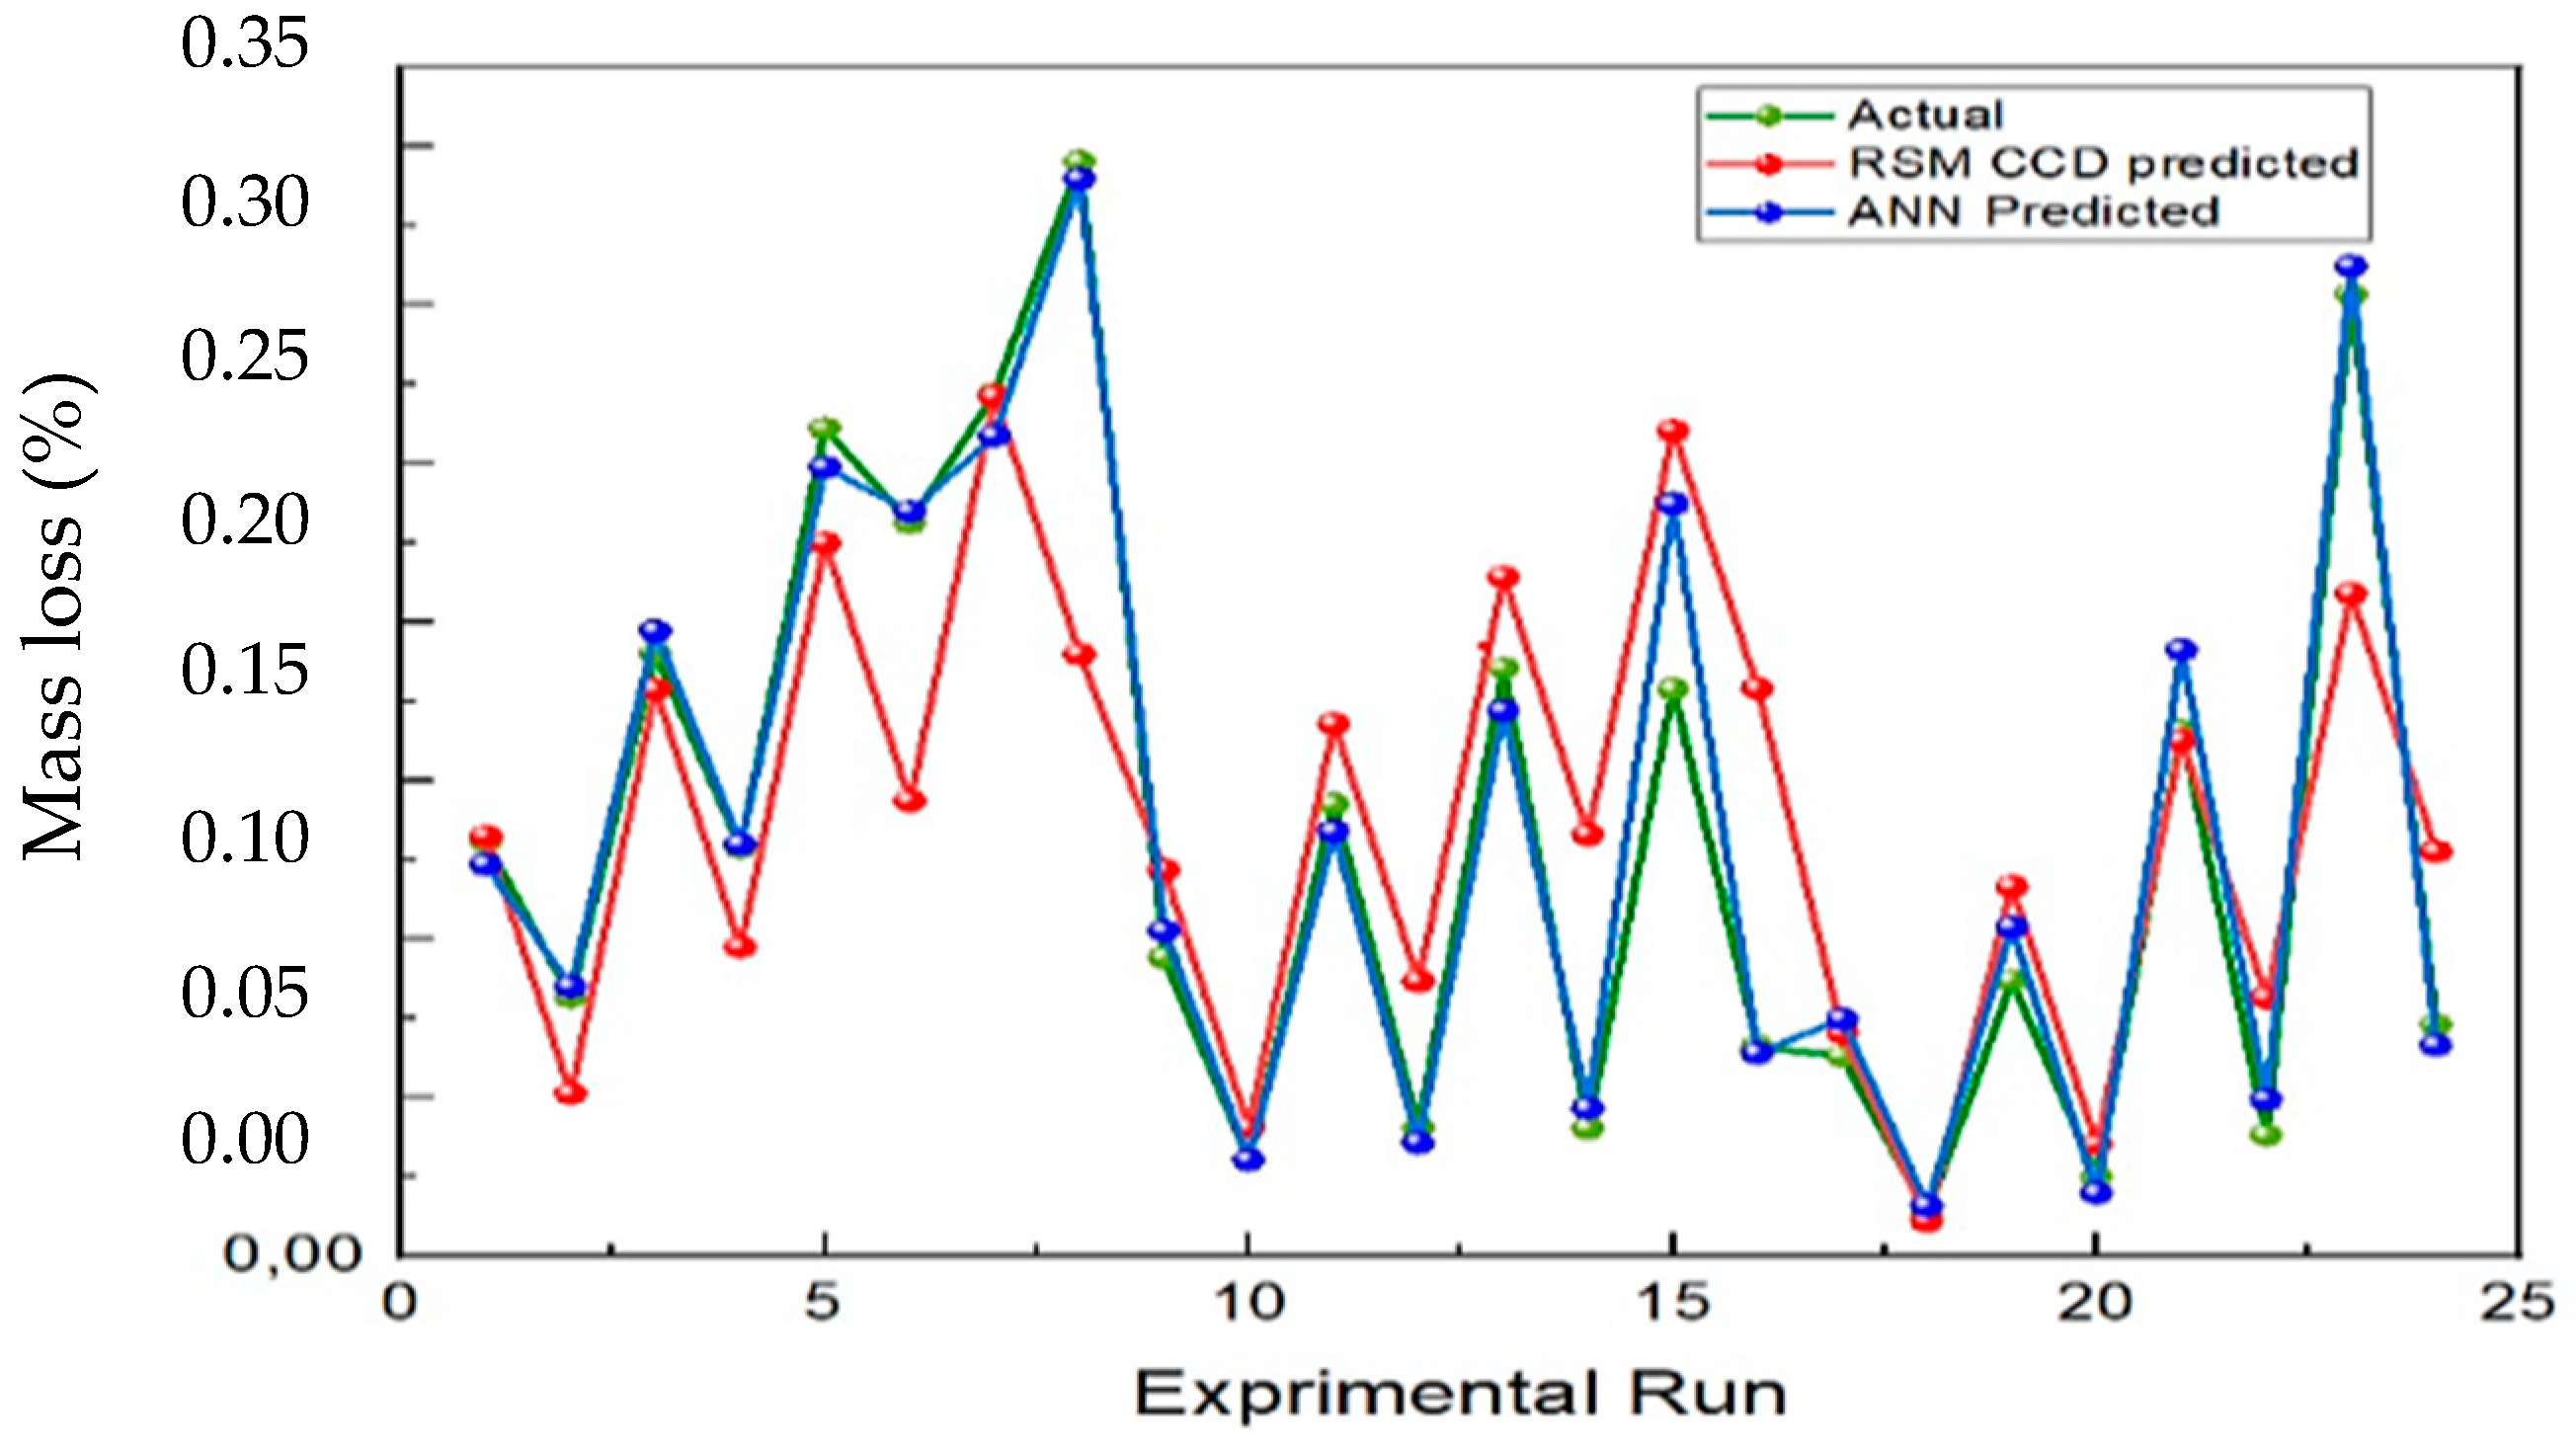
The ANN prediction curve shows a good fit with the experimental curve, which allows us to conclude that the accuracy of the prediction model is remarkably similar to the experimental data and very satisfactory. It is observed that the ANN method predicted the result more accurately than the RMS CCD method, which is also remarkable as can be seen from the error in Figure 12. On the other hand, a very large margin of error is observed for the linear regression method.

4. Conclusions

  • The objective of this study was to analyze the effect of normal load, hardness, and sliding speed on mass loss during the adhesive wear of AISI 4140 steel. The experimental method was based on a design of experiments, while the numerical approach relied on artificial neural networks. The analysis demonstrated that all three parameters were found to be significant. The normal load was identified as the most influential factor, followed by hardness and speed. The maximum mass loss was observed at a load of 175 N, whereas the minimum mass loss was obtained at a hardness of 895 HV.
  • The significance of hardness was highlighted by the observation that gas nitriding for 24 h enabled the attainment of an optimal hardness level, thereby minimizing mass loss while ensuring satisfactory resistance and durability. Conversely, excessive nitriding (930 HV for 36 h) resulted in nitrogen saturation, leading to the inefficient use of time and resources. These findings emphasize the importance of meticulously controlling nitriding parameters to circumvent inefficient and costly treatments.
  • In the initial phase, the quadratic regression equation was obtained by employing the Central Composite Design Response Surface Methodology (CCD RSM). However, the initial results did not achieve an acceptable level of accuracy. In order to enhance the efficacy of the aforementioned equation, a novel approach was adopted. This entailed the utilization of a genetic algorithm, a sophisticated computational methodology, to randomly vary the equation’s variables through a multitude of iterations, numbering in the hundreds. This optimization had a substantial impact on the robustness of the regression model, enabling it to attain a satisfactory level of precision.
  • The predictive analysis employing artificial neural networks (ANN) demonstrated that optimal outcomes were attained with a hyperbolic activation function, the trainbr algorithm, three hidden layers, and 11 neurons at epoch 27. The ANN method yielded highly accurate results, demonstrating excellent agreement with the experimental data. Conversely, the genetic algorithm, when utilized as a standalone predictive instrument, was determined to possess a reduced degree of accuracy in the context of modeling adhesive wear.
  • From an industrial perspective, the present study proposes a predictive tool capable of anticipating mass loss without the necessity for systematic experimental testing. This will result in time and cost savings for precision engineering industries. The findings can be directly applied to optimize nitriding conditions and wear parameters in real applications, particularly for gears, shafts, and components operating under dry sliding conditions.
  • In terms of future research, it would be valuable to extend this approach to other wear mechanisms (abrasive, corrosive), to different alloyed steels, and to integrate more advanced neural network architectures (deep learning, convolutional networks) to further improve predictive accuracy. Furthermore, experimental validation under real industrial conditions would enhance the transferability and practical relevance of the proposed methodology.

Author Contributions

Conceptualization, M.A.T. and A.D.; Methodology, B.L., M.A.T. and A.D.; Validation, M.A.T.; Formal analysis, A.D.; Data curation, A.D.; Writing—original draft, A.D.; Writing—review and editing B.L. and M.A.T.; Visualization, B.L. and M.A.T.; Supervision, M.A.T.; Project administration, B.L. All authors have read and agreed to the published version of the manuscript.

Funding

This work was supported and funded by the Deanship of Scientific Research at Imam Mohammad Ibn Saud Islamic University (IMSIU) (grant number IMSIU-DDRSP2503).

Data Availability Statement

The original contributions presented in this study are included in the article. Further inquiries can be directed to the corresponding author.

Conflicts of Interest

The authors declare that they have no known competing financial interests or personal relationships that could have appeared to influence the work reported in this paper.

References

  1. Wang, B.; Zhao, X.; Li, W.; Qin, M.; Gu, J. Effect of nitrided-layer microstructure control on wear behavior of AISI H13 hot work die steel. Appl. Surf. Sci. 2017, 431, 39–43. [Google Scholar] [CrossRef]
  2. Kumar, A.; Kaur, M.; Joseph, A.; Jhala, G.; Nanda, T.; Singh, S. High-Temperature Wear and Frictional Performance of Plasma-Nitrided AISI H13 Die Steel. Lubricants 2023, 11, 448. [Google Scholar] [CrossRef]
  3. Zambrano, O.A.; Aguilar, Y.; Valdés, J.; Rodríguez, S.A.; Coronado, J.J. Effect of Normal Load on Adhesive Wear Resistance and Wear Micro-mechanisms in FeMnAlC. Alloy and Other Austenitic Steels. Wear 2016, 348–349, 61–68. [Google Scholar] [CrossRef]
  4. González-Pociño, A.; Alvarez-Antolin, F.; Peral-Martinez, L.B. Effects of Nitriding and Thermal Processing on Wear and Corrosion Resistance of Vanadis 8 Steel. Coatings 2024, 14, 1066. [Google Scholar] [CrossRef]
  5. Straffelini, G.; Avi, G.; Pellizzari, M. Effect of three nitriding treatments on tribological performance of 42CrAlMo7 steel in boundary lubrication. Wear 2002, 252, 870–879. [Google Scholar] [CrossRef]
  6. Panfil-Pryka, D.; Kulka, M.; Kotkowiak, M.; Michalski, J.; Grochalski, K. Tribological Behavior of Gas-Nitrided 42CrMo4 Steel at Elevated Temperatures. Coatings 2025, 15, 18. [Google Scholar] [CrossRef]
  7. Terres, M.A.; Bechouel, R.; Ben Mohamed, S. Low Cycle Fatigue Behavior of Nitrided Layer of 42CrMo4 Steel. Int. J. Mater. Sci. 2017, 6, 18–27. [Google Scholar]
  8. Pérez, H.; Vargas, G.; Magdaleno, C.; Silva, R. Oxy-Nitriding AISI 304 Stainless Steel by Plasma Electrolytic Surface Saturation to Increase Wear Resistance. Metals 2023, 13, 309. [Google Scholar] [CrossRef]
  9. Terres, M.A.; Sidhom, H.; Larbi, A.B.C.; Ouali, S.; Lieurade, H.P. Influence de la résistance à la fissuration de la couche de combinaison sur la tenue en fatigue des composants nitrurés. Matériaux Tech. 2001, 89, 23–36. [Google Scholar] [CrossRef]
  10. Özkan, D.; Yilmaz, M.A.; Karakurt, D.; Szala, M.; Walczak, M.; Bakdemir, S.A.; Türküz, C.; Sulukan, E. Effect of AISI H13 Steel Substrate Nitriding on AlCrN, ZrN, TiSiN, and TiCrN Multilayer PVD Coatings Wear and Friction Behaviors at a Different Temperature Level. Materials 2023, 16, 1594. [Google Scholar] [CrossRef]
  11. Lu, X.; Jia, Z.; Wangand, H.; Liang, S.Y. The Effect of Cutting Parameters on Microhardness and the Prediction of Vickers Hardness Based on a Response Surface Methodology for Micro-milling Inconel 718. Measurement 2019, 140, 56–62. [Google Scholar] [CrossRef]
  12. Vikram, S.; Pradhan, S.K. Optimisation des paramètres WEDM à l’aide de la technique Taguchi et de la méthodologie de surface de réponse dans l’usinage de l’acier AISI D2. Procedia Eng. 2014, 97, 1597–1608. [Google Scholar]
  13. Singh, V.; Pradhan, S.K. Optimization of WEDM parameters using Taguchi technique and Response Surface Methodology in machining of AISI D2 Steel. Procedia Eng. 2017, 97, 1597–1608. [Google Scholar] [CrossRef]
  14. Singh, A.P.; Singh, D.K. SinghMulti response optimization for micro-EDM machining of AISI D2 die steel using RSM and neural network. Mater. Today Proc. 2023, 43, 1449–1455. [Google Scholar] [CrossRef]
  15. Shebani, A.; Iwnicki, S. Prediction of wheel and rail wear under different contact conditions using artificial neural networks. Wear 2018, 406–407, 173–184. [Google Scholar] [CrossRef]
  16. Palavar, O.; Özyürek, D.; Kalyon, A. Artificial neural network prediction of aging effects on the wear behavior of IN706 superalloy. J. Mater. Res. Technol. 2018, 7, 456–467. [Google Scholar] [CrossRef]
  17. Ebrahimi, M.; Mahboubi, F.; Naimi-jamal, M.R. RSM Base Study of the Effect of Deposition Temperature and Hydrogen Flow on the Wear Behavior of DLC Films; Elsevier: Amsterdam, The Netherlands, 2015. [Google Scholar] [CrossRef]
  18. Segu, D.Z.; Kim, J.-H.; Choi, S.G.; Jung, Y.-S.; Kim, S.S. Application of Taguchi Techniques to Study Friction and Wear Properties of MoS2 Coatings Deposited on Laser Textured Surface. Surf. Coat. Technol. 2013, 232, 504–514. [Google Scholar] [CrossRef]
  19. Ravikumar, K.S.; Chethan, Y.D.; Likith, C.; Chethan, S.P. Prediction of wear characteristics for Al-MnO2 nanocomposites using artificial neural network (ANN). J. Mater. Res. Technol. 2023, 12, 456–467. [Google Scholar] [CrossRef]
  20. Laouissi, A.; Nouioua, M.; Yallese, M.A.; Abderazek, H.; Maouche, H.; Bouhalais, M.L. Machinability study and ANN-MOALO-based multi-response optimization during Eco-Friendly machining of EN-GJL-250 cast iron. Int. J. Advan. Man. Technol. 2021, 117, 1179–1192. [Google Scholar] [CrossRef]
  21. Laouissi, A.; Yallese, M.A.; Belbah, A.; Belhadi, S.; Haddad, A. Investigation, modeling, and optimization of cutting parameters in turning of gray cast iron using coated and uncoated silicon nitride ceramic tools. Based on ANN, RSM, and GA optimization. Int. J. Advan. Man. Techol. 2019, 101, 523–548. [Google Scholar] [CrossRef]
  22. Sada, S.O. Improving the predictive accuracy of artificial neural network (ANN) approach in a mild steel turning operation. Int. J. Advan. Man. Techol. 2021, 112, 2389–2398. [Google Scholar] [CrossRef]
  23. Souid, A.; Jomaa, W.; Terres, M.A. Artificial neural network-based modeling and prediction of white layer formation during hard turning of steels. Matériaux Tech. 2024, 112, 304. [Google Scholar]
  24. Long, R.; Hou, J.; Zhang, Y.; Shang, Q.; Ma, C.; Pape, F.; Marian, M. From Experimentation to Optimization: Surface Micro-Texturing for Low-Friction and Durable PTFE–Steel Interfaces under Full-Film Lubrication. Polymers 2024, 16, 3505. [Google Scholar] [CrossRef]
  25. Huang, Q.; Shi, X.; Xue, Y.; Zhang, K.; Wu, C. Optimization of bionic textured parameters to improve the tribological performance of self-lubricating AISI 4140 composite using response surface methodology. Tribol. Int. 2021, 161, 107104. [Google Scholar] [CrossRef]
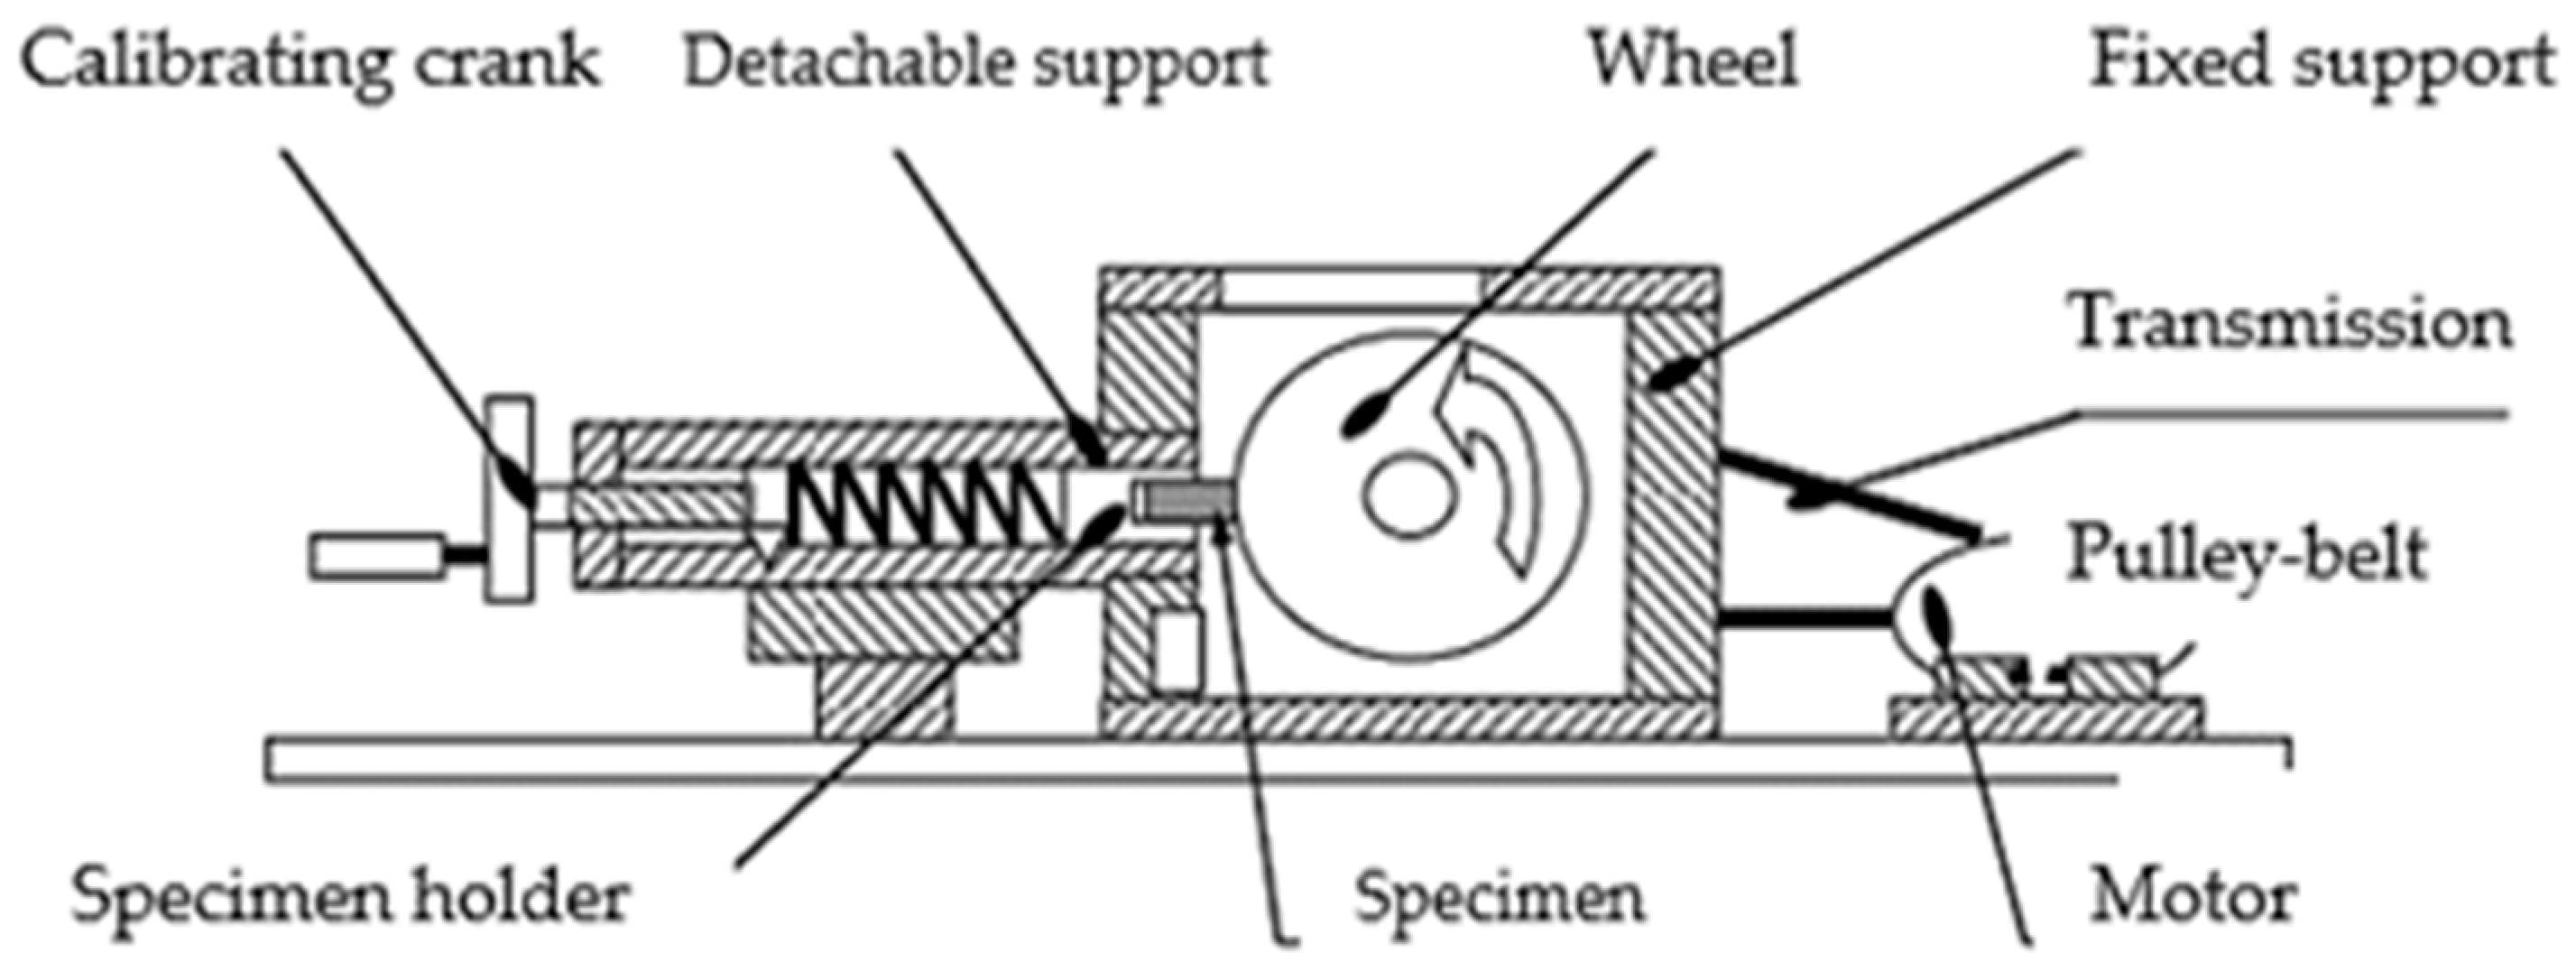
Figure 1. Wear test device based on mass loss measurement.
Crystals 15 00875 g001
Figure 2. Internal architecture of the neural network: (a) one layer, (b) two layers and (c) three layers.
Crystals 15 00875 g002
Figure 3. Main effects: (a) plot for signal-to-noise ratios and (b) Pareto diagram.
Crystals 15 00875 g003
Figure 4. Normal probability versus residual. (a) Predicted vs. Actual and (b) Normal plot of residuals.
Crystals 15 00875 g004
Figure 5. Surface plot and its corresponding contour plot showing the interactions between the variables affecting Mass loss: (a) interaction H-F, (b) interaction H-V and (c) interaction F-V.
Crystals 15 00875 g005aCrystals 15 00875 g005b
Figure 6. Specific value for all responses under the optimized conditions.
Crystals 15 00875 g006
Figure 7. Experimental values as a function of their predicted values.
Crystals 15 00875 g007
Figure 8. Evolution of mass loss as a function of experimental and predicted values.
Crystals 15 00875 g008
Figure 9. Evolution of mass loss as a function of test conditions, experimental and predicted values: (a) NG24; V = 8.3 m/s, (b) NG24; V = 4.18 m/s and (c) NG12; V = 8.3 N.
Crystals 15 00875 g009
Figure 10. Evolution of the mean square error over generations.
Crystals 15 00875 g010
Figure 11. Evolution of the mean square error.
Crystals 15 00875 g011
Figure 12. Comparison of predicted and actual values.
Crystals 15 00875 g012
Table 1. Chemical composition of AISI 4140 steel.
ElementsCrMnCSiCuMoNiSPFe
(%)1.020.770.410.280.250.160.160.0260.019Bal.
Table 2. Nitriding conditions and surface hardening of nitrided layers.
StateTreatment ConditionsMicrohardness
θn (°C)t (h)τ (%)HV
NG125251235895
NG24241090
NG3636930
θn represents the nitriding temperature (°C), t(h) the nitriding time (h), and τ the ammonia dissociation rate (%).
Table 3. Information on the various Factors and levels of the wear parameter.
FactorsTypeLevelsValues
Normal load (N)Continuous4100–125–150–175
Hardness (HV)Continuous3895–930–1092
Speed (m/s)Continuous24.18–8.30
Table 4. Statistical analysis of mass loss as a function of experimental parameters.
ParameterTested ValuesMean (g)Std. Dev.95% Confidence IntervalPooled Std. Dev.
Hardness (HV)8960.20520.0885(0.1434; 0.2670)0.0840
9300.09730.0638(0.0355; 0.1591)
10920.09610.0963(0.0343; 0.1578)
Normal load (N)1000.06880.0431(−0.0038; 0.1415)0.0853
1250.10240.0634(0.0297; 0.1750)
1500.15370.0948(0.0811; 0.2792)
1750.20650.1194(0.1338; 0.2792)
Speed (m/s)4.180.09280.0995(0.0398; 0.1458)0.0885
Table 5. Neural network architecture.
FactorsHardness (HV)–Normal Load (N)–Speed (m/s)
ResponseMass loss (%)
Activation functionSigmoid–Hyperbolic–Linear
Learning algorithmsTrainlm–Trainbr–Trainscg
Number of layers1–2–3
Number of neurons10–11–12
Data report70–15–15
ToolMatlab 2019a
Table 6. Responses for raw signal ratios.
LevelHardness (HV)Normal Load (N)Speed (m/s)
114.5725.3424.34
222.1021.7116.10
324.0118.48-
4-15.36-
Delta9.449.988.24
Rank213
Table 7. Estimated regression coefficients, corresponding p values and variance analysis for the final regression model.
SourceSum of SquaredfMean SquareF-Valuep-Value
Model0.136730.04566.840.0024
A-Hardness0.039110.03915.870.0251
B-Normal load0.082710.082712.400.0021
C-Speed0.014910.01492.240.1498
Residual0.133320
Cor total0.269923
p < 0.01 highly significant; 0.01 < p < 0.05 significant; p > 0.05 not significant.
Table 8. Summary of the best predictions of each activation function.
ConfigurationResults
Activation FunctionAlgorithmsNumber of LayersNumber of NeuronsTrainingTestValidationRMSERMSE
SigmoidTrainlm1120.97200.98050.97300.97210.00070.0275
Trainlm2120.98270.98160.98220.98140.00050.0022
Trainlm3100.98540.99490.98350.98780.00040.02
SigmoidTrainscg1110.93360.97950.95330.94190.00150.0398
Trainscg2100.96090.98700.97200.96490.00090.0308
Trainscg3120.95400.95250.98180.97500.00150.0039
SigmoidTrainbr1100.98360.9759-0.98430.00040.0213
Trainbr2120.98310.9927-0.98780.00030.0179
Trainbr3100.98670.9845-0.98590.00030.0195
HyperbolicTrainlm1100.98870.98100.97570.98420.00040.2147
Trainlm2120.98250.99380.99040.98390.00050.0229
Trainlm3100.98100.99730.99470.98590.00040.0219
HyperbolicTrainscg1100.96600.95730.96520.96160.00100.0318
Trainscg2120.95390.98690.97010.95960.00110.0336
Trainscg3100.95470.98080.98150.95830.00100.0327
HyperbolicTrainbr1120.98140.9731-0.98420.00040.0214
Trainbr2120.98770.9889-0.98540.00040.0200
Trainbr3110.98520.9903-0.98590.00030.0196
LinearTrainlm1110.80330.80330.80330.82470.00440.02
Trainlm2110.93350.93350.93350.84330.00380.0620
Trainlm3120.88110.88110.88110.82450.00440.0663
LinearTrainscg1120.80180.80180.80180.82450.00440.0039
Trainscg2120.90800.90800.90800.83450.00420.0653
Trainscg3110.94830.94830.94830.82460.00440.0663
LinearTrainbr1120.82490.8249-0.82460.00440.0211
Trainbr2120.93340.9334-0.85210.00340.0529
Trainbr3110.82490.8249-0.85010.00310.0559
Table 9. Order of trials.
OrderActivation FunctionAlgorithmsNumber of LayersNumber of NeuronR
1SigmoidTrainlm1100.9800
2SigmoidTrainlm1100.9820
3SigmoidTrainlm1100.9842
4SigmoidTrainbr2110.9817
5SigmoidTrainbr2110.9835
6SigmoidTrainbr2110.9862
7SigmoidTrainscg3120.9382
8SigmoidTrainscg3120.9417
9SigmoidTrainscg3120.9636
10HyperbolicTrainlm2120.9788
11HyperbolicTrainlm2120.9808
12HyperbolicTrainlm2120.9814
13HyperbolicTrainbr3100.9822
14HyperbolicTrainbr3100.9842
15HyperbolicTrainbr3100.9859
16HyperbolicTrainscg1110.9215
17HyperbolicTrainscg1110.9331
18HyperbolicTrainscg1110.9419
19LinearTrainlm3110.8219
20LinearTrainlm3110.8232
21LinearTrainlm3110.8246
22LinearTrainbr1120.8411
23LinearTrainbr1120.8475
24LinearTrainbr1120.8495
25LinearTrainscg2100.8014
26LinearTrainscg2100.8183
27LinearTrainscg2100.8213
Disclaimer/Publisher’s Note: The statements, opinions and data contained in all publications are solely those of the individual author(s) and contributor(s) and not of MDPI and/or the editor(s). MDPI and/or the editor(s) disclaim responsibility for any injury to people or property resulting from any ideas, methods, instructions or products referred to in the content.