Article

Impact of Laser Power on Electrochemical Performance of CeO2/Al6061 Alloy Through Selective Laser Melting (SLM)

1
School of Automation, Wuxi University, No. 333 Xishan Avenue, Wuxi 214015, China
2
School of Mechanical Engineering, Jiangnan University, No. 1800 Lihu Avenue, Wuxi 214122, China
*
Author to whom correspondence should be addressed.
Crystals 2025, 15(1), 84; https://doi.org/10.3390/cryst15010084
Submission received: 27 December 2024 / Revised: 11 January 2025 / Accepted: 15 January 2025 / Published: 16 January 2025
(This article belongs to the Section Crystalline Metals and Alloys)

Abstract

:
As a type of additive manufacturing technology, SLM has made significant progress in the aerospace sector because of its capacity to swiftly and effectively form metals and their composites. This work investigates the impact of laser power (260, 280, 300, 320, 340 W) on the performance of a 1.0 wt.% CeO2/Al6061 alloy prepared by SLM, including the forming quality (surface morphology and density), self-corrosion rate (SCR), and electrochemical behavior. The experimental outcomes suggest that as the laser power rises, the surface roughness exhibits an initial decline followed by an increase, whereas the density undergoes an initial increase and subsequently decreases. The SCR demonstrates a pattern of initial decrease followed by an increase as the laser power is incremented. When the laser power increases, the electrochemical activity shows the same trend. When the laser power is 280 W, the density of the sample is 98.63%, and the SCR is 2.243 × 10⁻⁴ g/cm2·min. The induced resistance of the sample caused by hydrogen evolution is small, at 7.827 × 10⁻²⁰ Ω·cm2, and the polarization resistance reaches 8.048 × 10⁻¹ Ω·cm2, suggesting superior resistance to corrosion on the part of the sample. The laser power affects the SCR and electrochemical performance of the sample by influencing its molding quality. At the laser power of 280 W, the formation quality of the sample is optimal, and the sample exhibits lower SCR and more stable electrochemical activity.

1. Introduction

Given the worldwide focus on environmental conservation and sustainable development, the utilization of 6061 aluminum alloy (Al6061) has garnered significant attention [1,2]. Aluminum alloy, as a recyclable metal material, has a high recycling rate and relatively low energy consumption in the production process. Therefore, Al6061 alloy has significant advantages in environmental protection and sustainable development [3,4,5]. In addition, Al6061 is a commonly used aluminum alloy material, which is extensively employed in diverse sectors, including automotive manufacturing and electronic equipment, especially for aerospace, due to its outstanding plasticity, weld ability, process ability, medium strength, and excellent corrosion resistance [6,7,8]. As the aforementioned industries undergo swift development, the demand for Al6061 alloy is also continuously increasing [9,10].
For the aerospace industry, with the increasing demand for lightweight and high-strength materials, Al6061 alloy, as an important structural material, will further expand its market demand. Al6061 alloy boasts a diverse array of applications within this field, encompassing the manufacture of aircraft skins, fuselage structures, beams, rotors, propellers, fuel reservoirs, wall panels, and landing gear supports, as well as rocket forging rings and spacecraft wall panels. This versatility stems primarily from its exceptional strength, corrosion resistance, and lightweight properties [11,12,13]. When applied in the aerospace field, consideration of corrosion resistance is crucial. Al6061 alloy, categorized under the Al-Mg-Si alloy series, exhibits excellent corrosion resistance. It mainly protects the substrate from corrosion by forming a dense oxide film. Nonetheless, environmental factors including temperature, humidity, and corrosive substances can potentially impair its corrosion resistance. In addition, components in the aerospace industry often need to withstand extreme environmental conditions. Although Al6061 alloy has certain corrosion resistance, its performance may be affected in certain extreme environments, resulting in reduced reliability and service life of the components. In addition, the casting, heat treatment, and processing of Al6061 alloy are difficult, which may increase manufacturing costs and production cycles. Especially in the aerospace field, the precision and performance requirements for components are extremely high, so advanced manufacturing processes and equipment are needed to ensure product quality. However, these advanced manufacturing processes and equipment are often costly and require high skill levels from operators [14,15,16,17,18].
Selective laser melting (SLM) technology has extremely high design freedom and theoretically can print any complex-shaped part, making it possible to manufacture complex structural components in the aerospace field [19,20,21]. This advantage breaks through the limitations of traditional manufacturing processes, allowing designers to freely express their creativity and design more complex and efficient structures, thereby meeting the demands of aerospace equipment to be high-performance, lightweight, and high-reliability [22,23,24]. In addition, the nano-reinforced-phase composite materials prepared using SLM technology have excellent properties. Incorporating a nano-reinforcement phase can markedly enhance the material’s corrosion resistance. At the same time, the rapid melting and cooling process of SLM technology can suppress the growth of grains and the segregation of alloy elements, thereby obtaining a microstructure with fine grains and uniform structure, further improving the properties of the material [25,26,27]. In addition, SLM technology can achieve good interfacial bonding between the nano-reinforced phase and the matrix material in the preparation of nano-reinforced-phase composite materials. This good interface bonding can ensure that the nano-reinforcement phase fully exerts its reinforcing effect in the composite material, while avoiding problems such as cracks and defects at the interface, thus meeting the usage requirements of the composite material in specific environments [28,29,30].
Research has shown that the cerium dioxide (CeO2) nano-reinforcement phase can significantly improve the operating characteristics of aerospace materials. Owing to the small size and surface effects of nanoparticles, they can be more effectively combined with matrix materials, thereby improving the corrosion resistance of materials, which is particularly important for high-temperature, high-pressure, and corrosive environments in the aerospace industry [31,32,33,34,35]. Peng et al. [36] investigated the set of optimal process parameters for the SLM fabrication of CeO2/Al6061 alloy, aiming to enhance forming quality and corrosion potential and minimize the self-corrosion rate. The results show that the optimal performance of this alloy is achieved when the scanning speed ranges from 985 to 1025 mm/s and the scanning spacing lies between 0.116 and 0.140 mm. Li et al. [37] fabricated CeO2/Al6061 composite materials through SLM and analyzed the effect of hatch spacing on both forming quality and corrosion resistance. Their findings revealed that as the hatch spacing increased, the density and corrosion resistance of the samples initially rose but subsequently declined. Specifically, at a hatch spacing of 0.13 mm, the density peaked at 98.39% and the self-corrosion rate diminished to 2.596 × 10⁻⁴ g·cm−2·min−1. At this point, the sample possessed the best molding quality. As can be seen, the above two reports involved the influence of scanning speed and scanning spacing on the quality of formed parts, but for SLM, laser power is also an important influencing factor, which was not mentioned in the above study. Although the application of the CeO2 nano-reinforcement phase in SLM technology has significant advantages, it still faces some challenges. For example, the agglomeration and dispersion of nanoparticles can influence their consistent distribution within the metal matrix. Meanwhile, the addition of nanoparticles may increase the brittleness and processing difficulty of the material. Therefore, future research needs to focus on how to better control the dispersion and distribution of nanoparticles, as well as optimize the process parameters of SLM technology to fully leverage the advantages of it.
Based on this, this work prepared CeO2/Al6061 composite powder materials using ball milling technology and formed them using SLM technology. This study investigated the corrosion resistance of the composite materials, focusing on self-corrosion and electrochemical properties, and analyzed how forming quality impacts this resistance. This study offers data to support the use of high-performance aerospace materials.

2. Materials and Methods

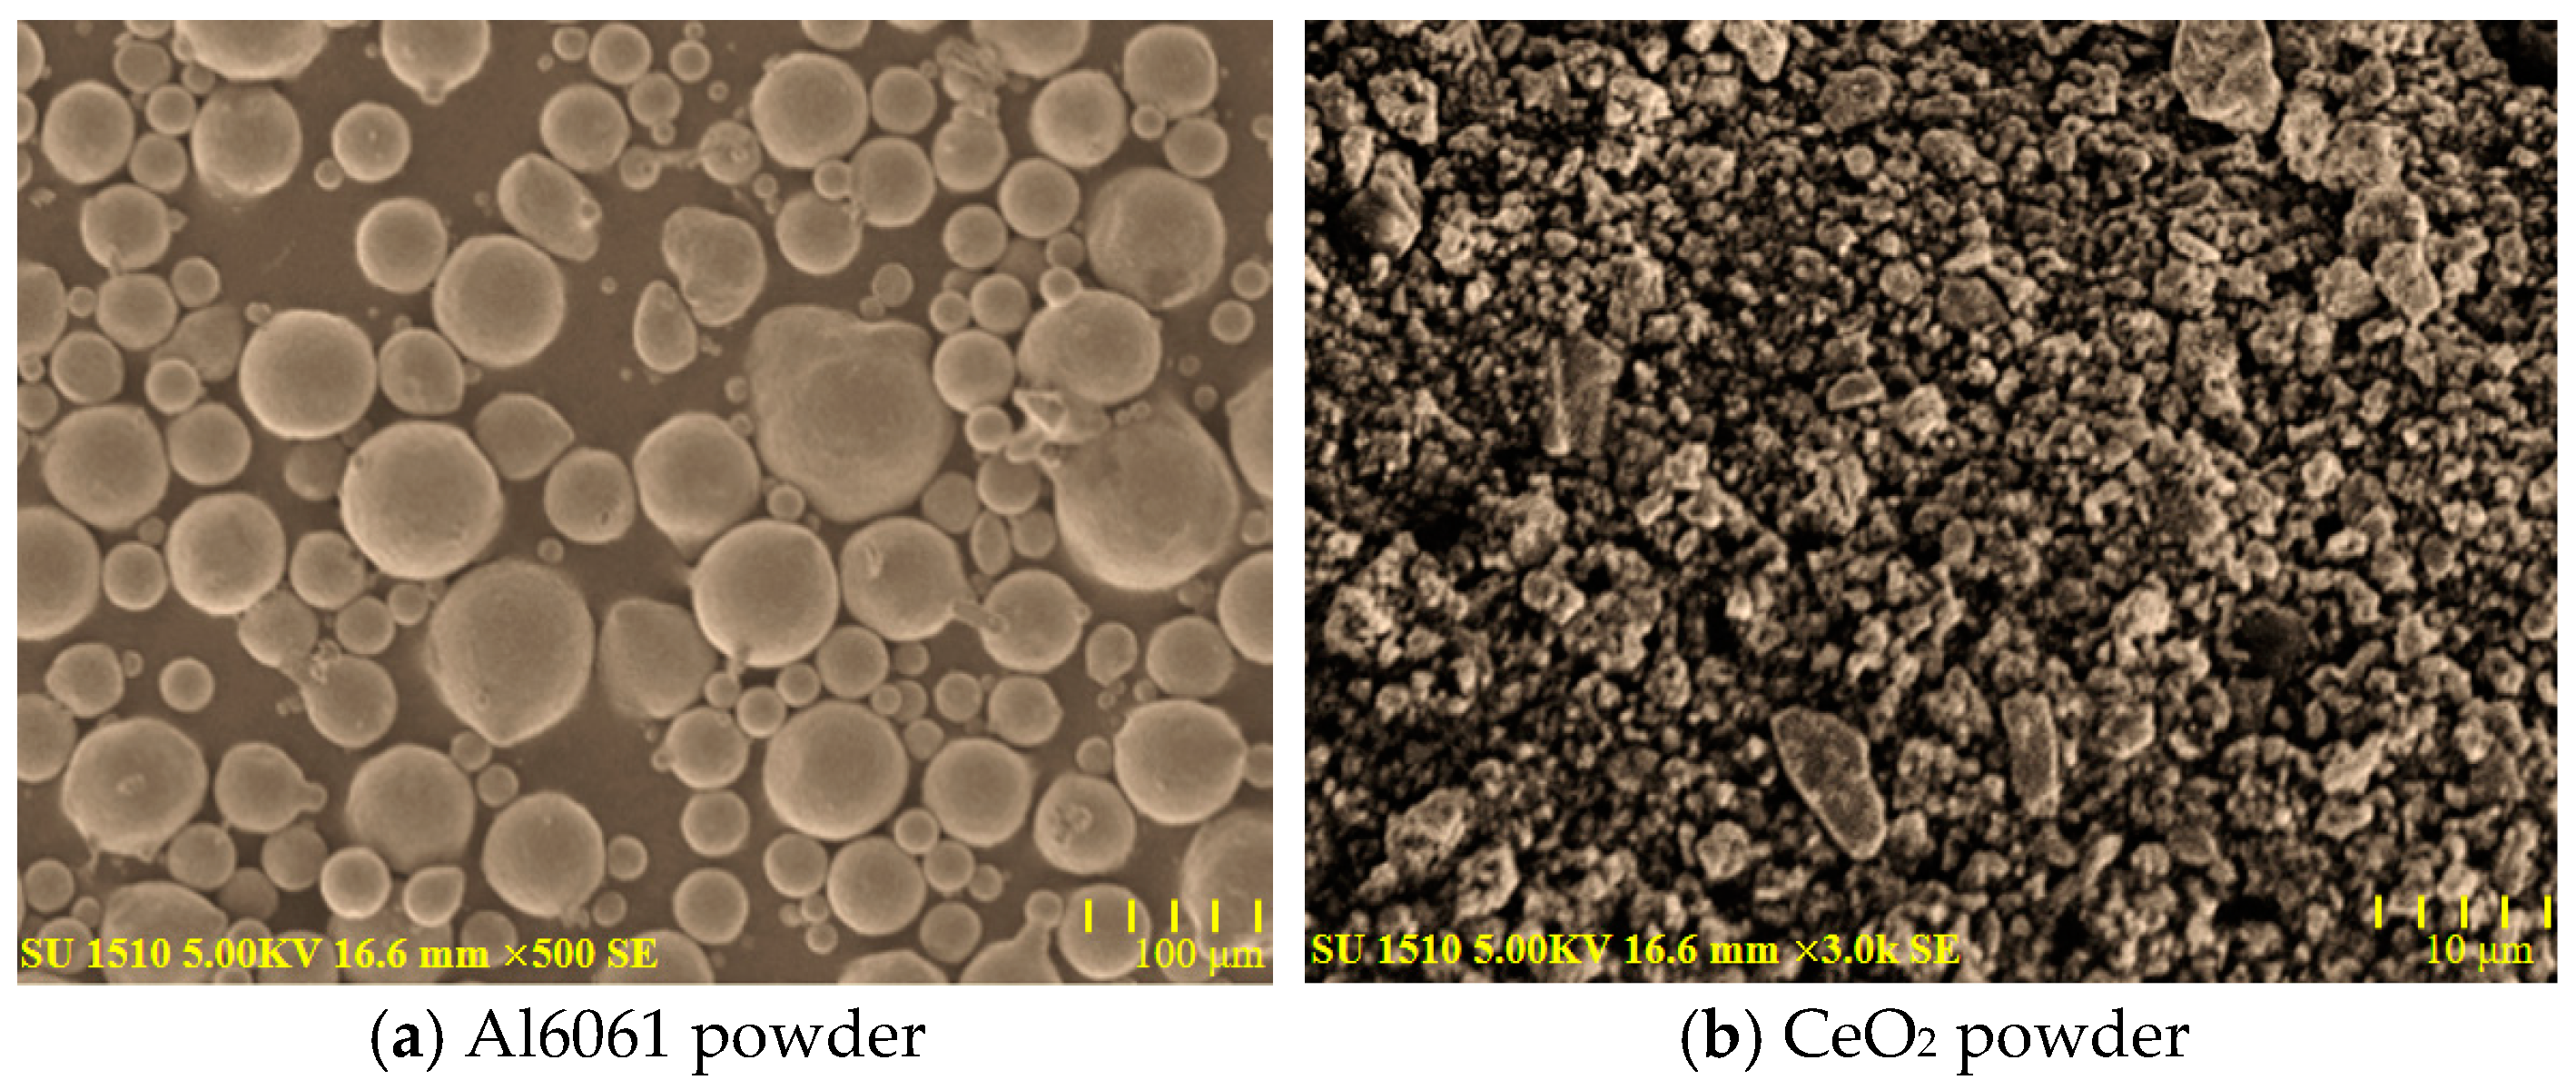
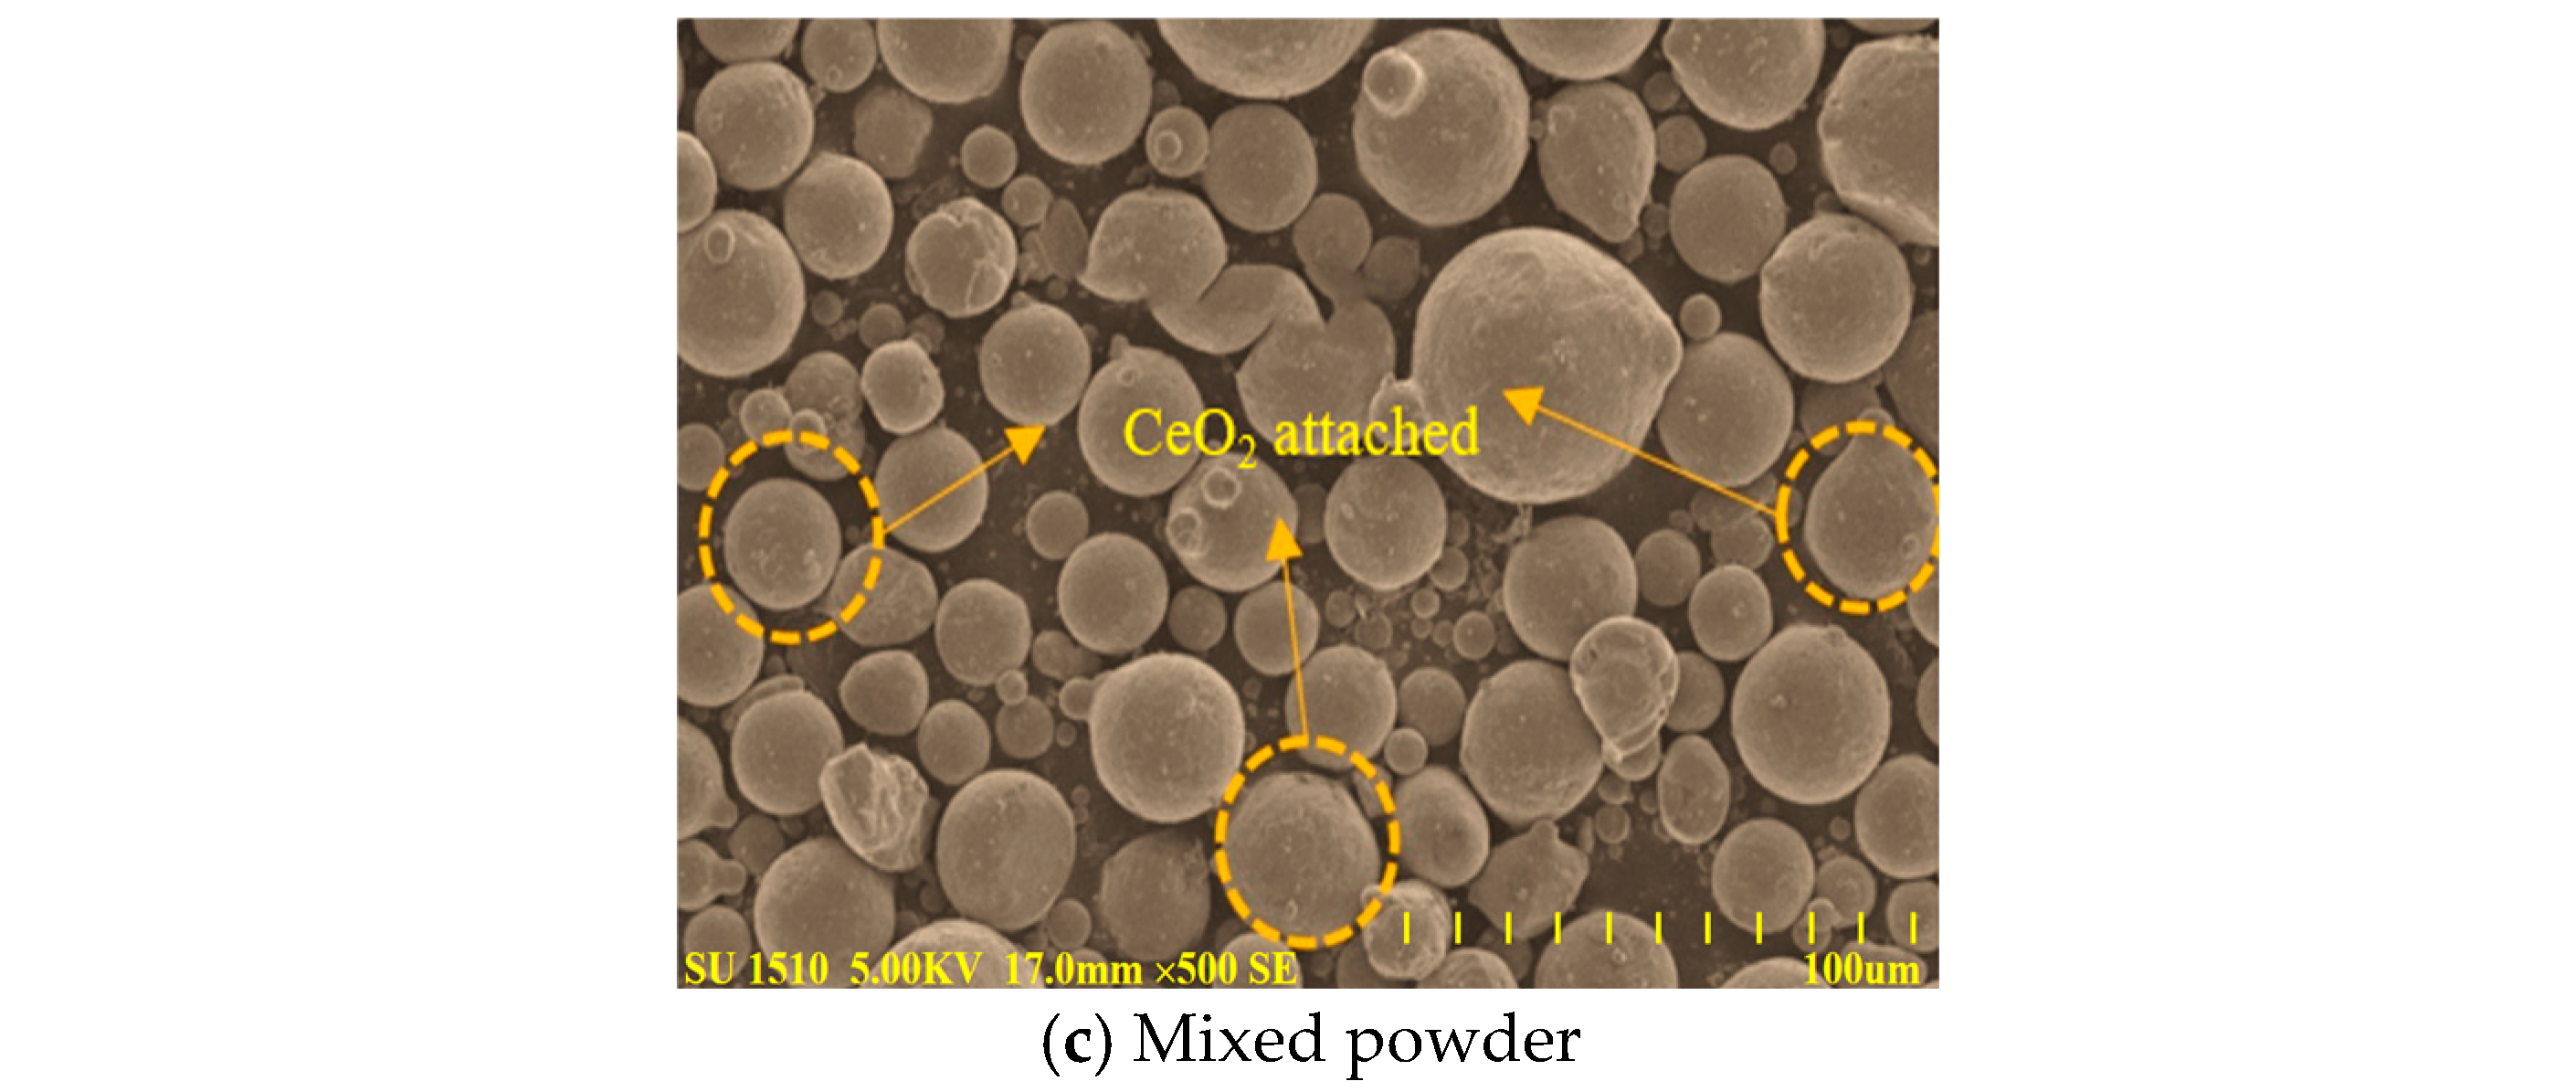
2.1. Materials and Process Parameters

The Al6061 powder was sourced from Avimetal Powder Metallurgy Technology Co., Ltd., located in Beijing, China, while the CeO2 powder was provided by Bangrui New Material Technology Co., Ltd., situated in Anqing, China.
A mixture of 1.0 wt.% CeO2/Al6061 powder was prepared based on its outstanding performance, as reported in the previous literature [36,37]. To enhance the forming quality of the specimen, a planetary ball mill (QM-3SP2, Nanjing Nanda Instrument Co., Ltd., Nanjing, China) was used for mechanical mixing of two types of powders. The ball milling process parameters employed were as follows: a rotational speed of 200 rpm, a milling time of 2 h, and a ball-to-powder ratio of 2.5:1. To improve the dispersion uniformity of the mixed powders, during the mixing process, the ball mill was first operated in the forward direction for 15 min, followed by a 5 min shutdown for static cooling. Subsequently, it was operated in the reverse direction for another 15 min, followed by static cooling. This forward and reverse operation was alternated in this manner. To examine the surface morphology of various powders, a scanning electron microscope (SEM), model su1510, manufactured by Hitachi in Japan, was utilized and the results are depicted in Figure 1.
A 10 mm × 10 mm × 10 mm CeO2/Al6061 specimen was fabricated using an SLM YMLASER YLM-120 machine with a laser wavelength of 1070 nm, provided by Suzhou XDM 3D Printing Technology Co., Ltd., located in Suzhou, China. Throughout the printing process, only the laser power was varied (specifically at 260 W, 280 W, 300 W, 320 W, and 340 W), while the scanning speed, scan spacing, and powder layer thickness remained consistent. The specific SLM laser parameters are detailed in Table 1.
After printing, wire cutting was used to separate the sample from the substrate. To examine the microstructure and surface appearance of various samples, this work also utilized a metallographic microscope (DM2700M, LEICA Instruments, Frankfurt, Germany). Prior to metallographic examination, all samples underwent polishing using sandpaper of grades ranging from 200 to 2000 (with a gradient grade of 200) on a grinding and polishing machine, MASTERLAM 3.0, Jiexing Biotechnology Co., Ltd., Shanghai, China.

2.2. Surface Roughness and Porosity Measurement

To measure the surface roughness of a specimen, a non-contact three-dimensional profilometer (MFD-D, Rtec Company, San Jose, CA, USA) was used (as detailed in this section) and the following steps were taken: Firstly, the specimen was placed in ethanol and ultrasonically cleaned for 5 min to ensure that the specimen surface was clean. Subsequently, the specimen was positioned and securely fixed on the measurement platform of the three-dimensional profilometer to prevent any movement during the measurement process. Finally, a 20× magnification lens was utilized to observe the surface and obtain its surface roughness. To determine the density, the porosity of the sample was assessed through the drainage technique, employing deionized water as the liquid. The volumes of deionized water in the measuring cylinders, before and after immersing the sample, were recorded as V0 and V1, respectively. The mass of the sample, denoted as M, was measured using a high-precision balance (XS205-DU, manufactured by Mettler Toledo in Zurich, Switzerland). Subsequently, the density was calculated using the following formula [36,37].
θ = M ρ ( V 1 V 0 ) × 100 %
where θ represents the volume porosity and ρ denotes the density of the sample.

2.3. Self-Corrosion Test

The weight loss method is one of the most commonly used methods for determining the corrosion rate of aluminum alloys. In this study, the self-corrosion rate (SCR) of the sample was evaluated using the weight loss method. Firstly, we placed the CeO2/Al6061 sample in ethanol solution for ultrasonic cleaning for 0.5 h and then immersed it in 4 M NaOH solution at room temperature for 1 h. Once the test was concluded, the sample was submerged in a solution consisting of 2% CrO3 and 5% H3PO4 at 80 °C for 5 min to eliminate any surface corrosion products. During this process, the weight of the sample was recorded every 10 min, starting with M0 (the initial mass) and continuing with Mi (the mass after each corrosion interval, where i = 1, 2, 3, 4, 5, 6). The SCR was then computed using the formula provided below.
S C R = M 0 M i S · T ( i = 1 , 2 , 3 , 4 , 5 , 6 )
where M0Mi represents the weight loss of the sample (mg∙cm−3), M0 and Mi denote the weight of samples before/after soaking (mg), S is the surface area, and T is the duration of the test.

2.4. Electrochemical Test

The electrochemical testing utilized a three-electrode setup (employing the CHI750E electrochemical workstation from Shanghai Chenhua Instrument Co., Ltd., Shanghai, China), featuring a Pt sheet as the counter electrode, Hg/HgO as the reference electrode, the sample as the working electrode, and a 4 M NaOH solution as the electrolyte. Prior to testing, all samples were subjected to sanding with sandpaper and subsequently cleaned using an ultrasonic bath in an ethanol solution for a duration of 0.5 h. Initially, the open circuit potential was measured until it stabilized, followed by the conduction of electrochemical impedance spectroscopy (EIS) across a frequency range of 105 Hz to 10−1 Hz. Ultimately, the polarization of the dynamic potential was assessed at a scanning rate of 1 mV/s. For data analysis, Zsimpwin3.6 software was utilized.

3. Results and Discussion

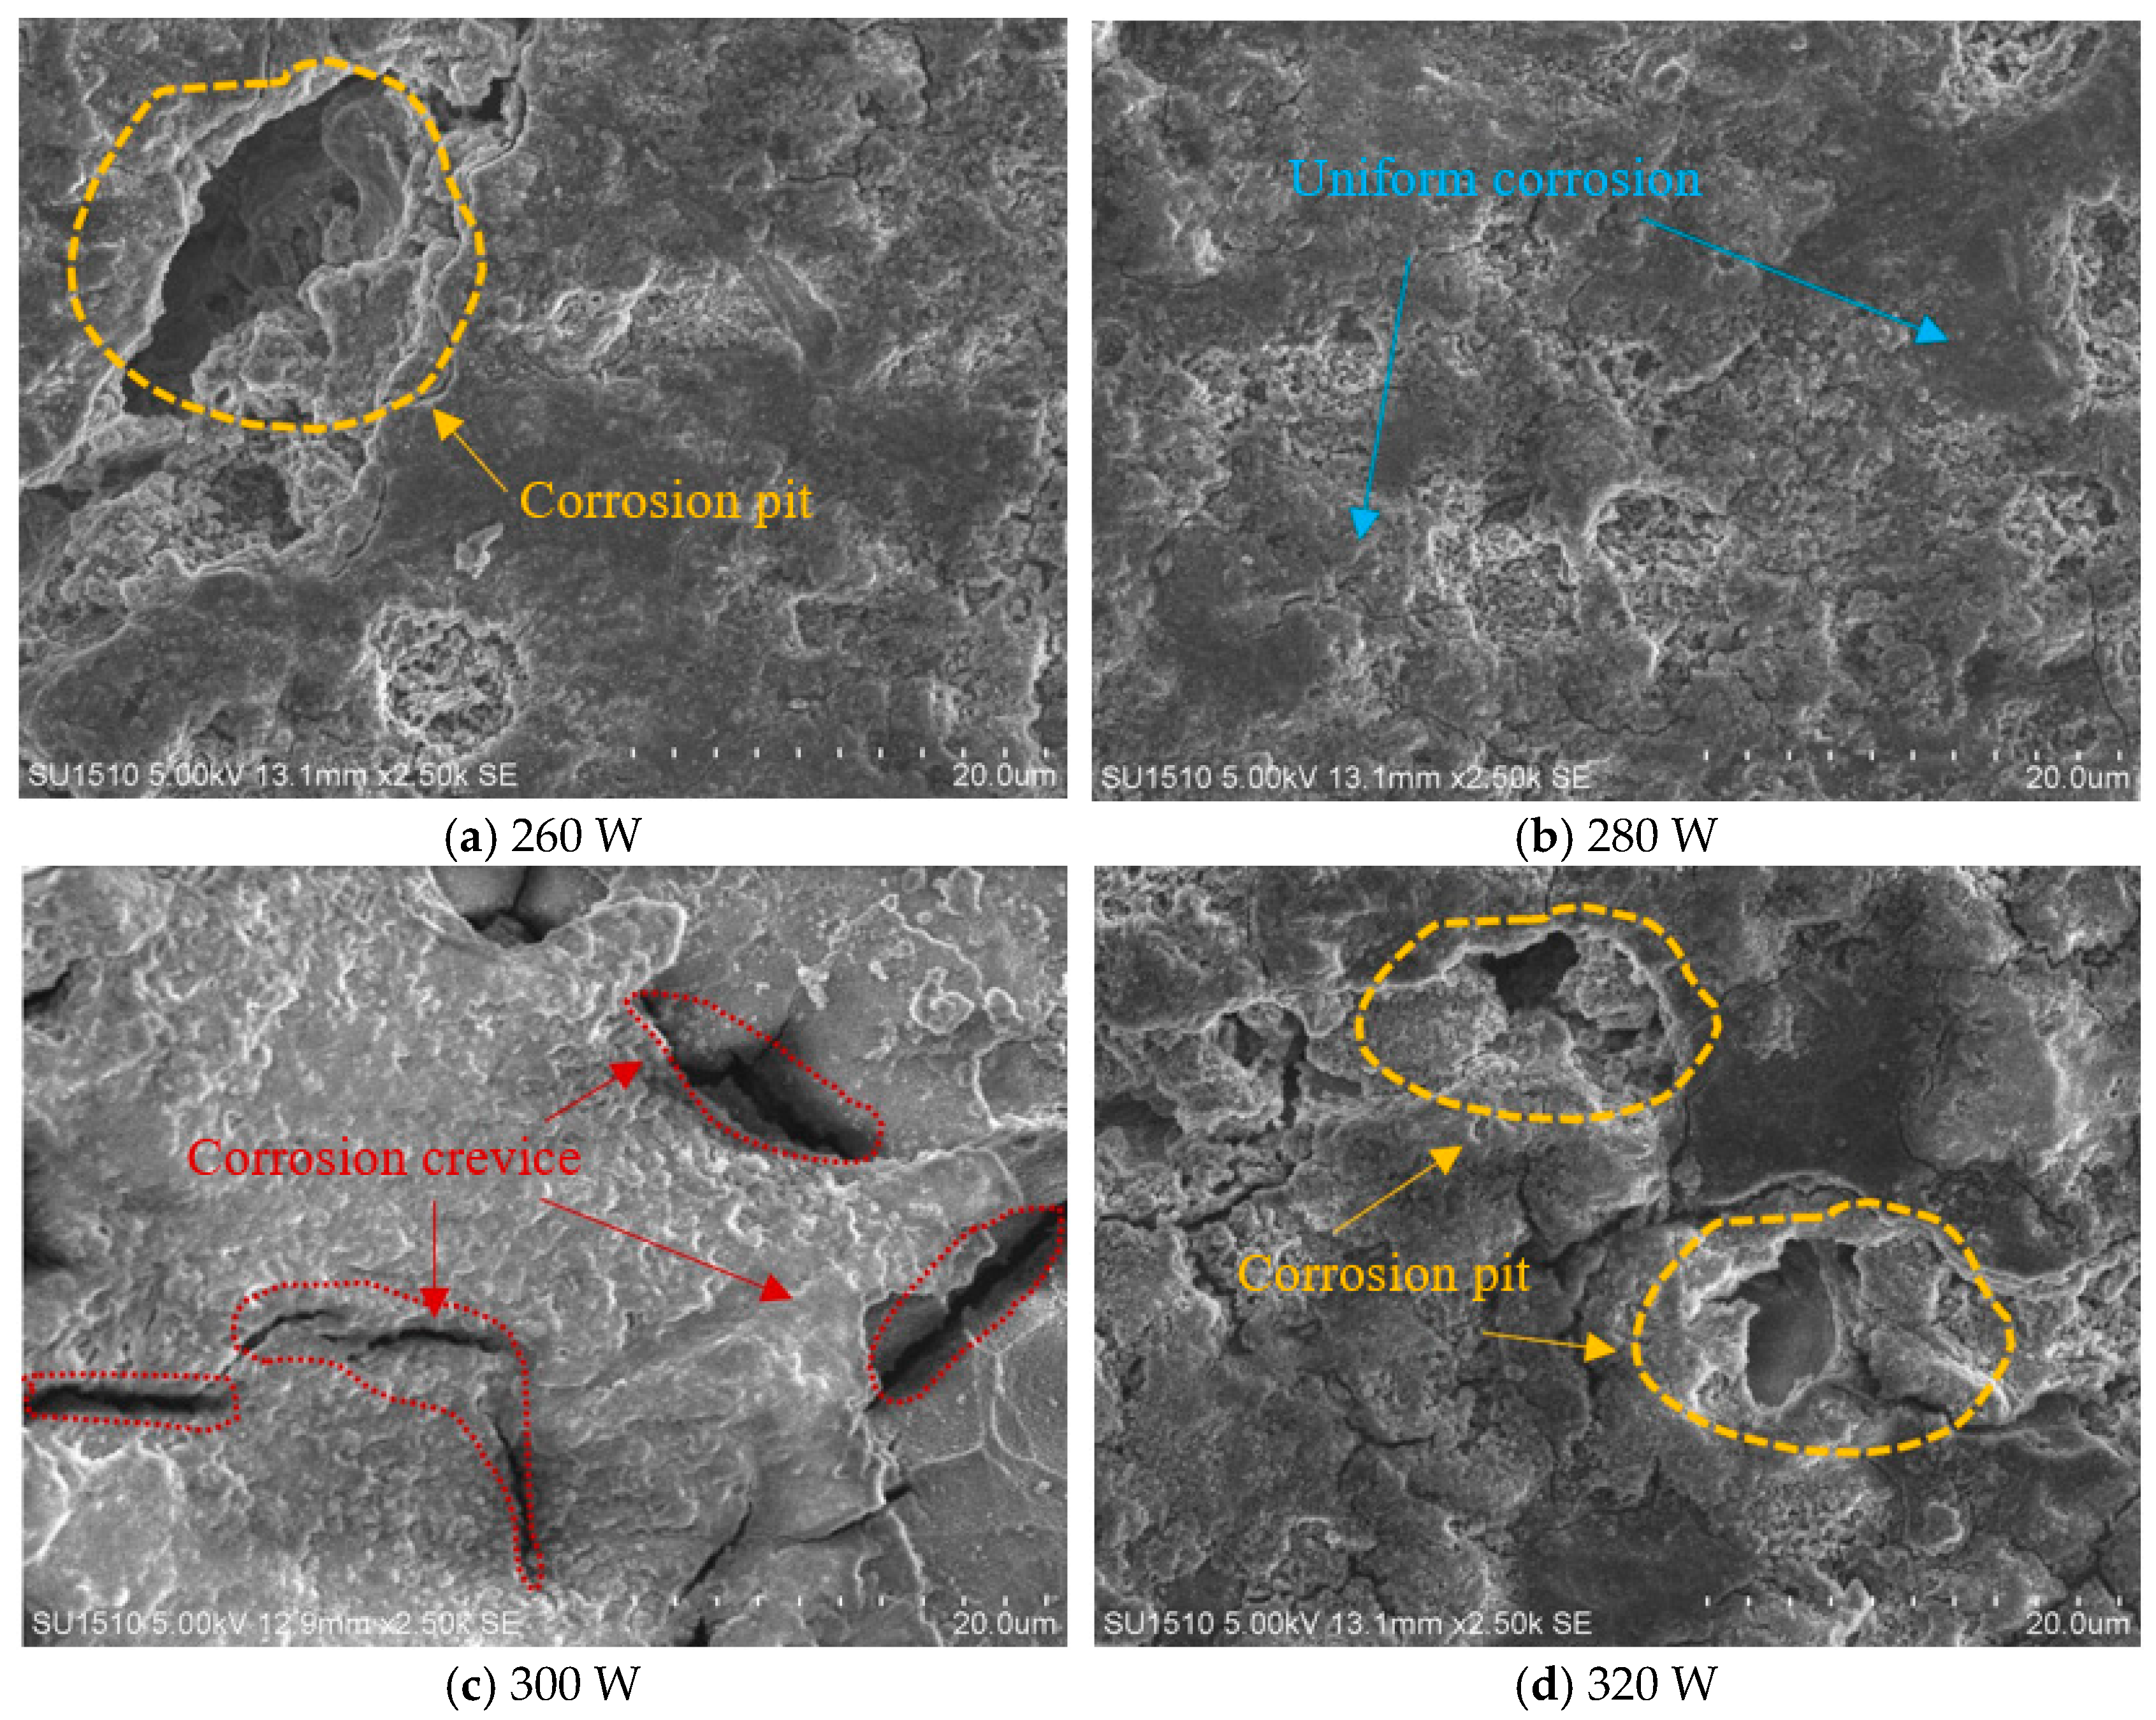
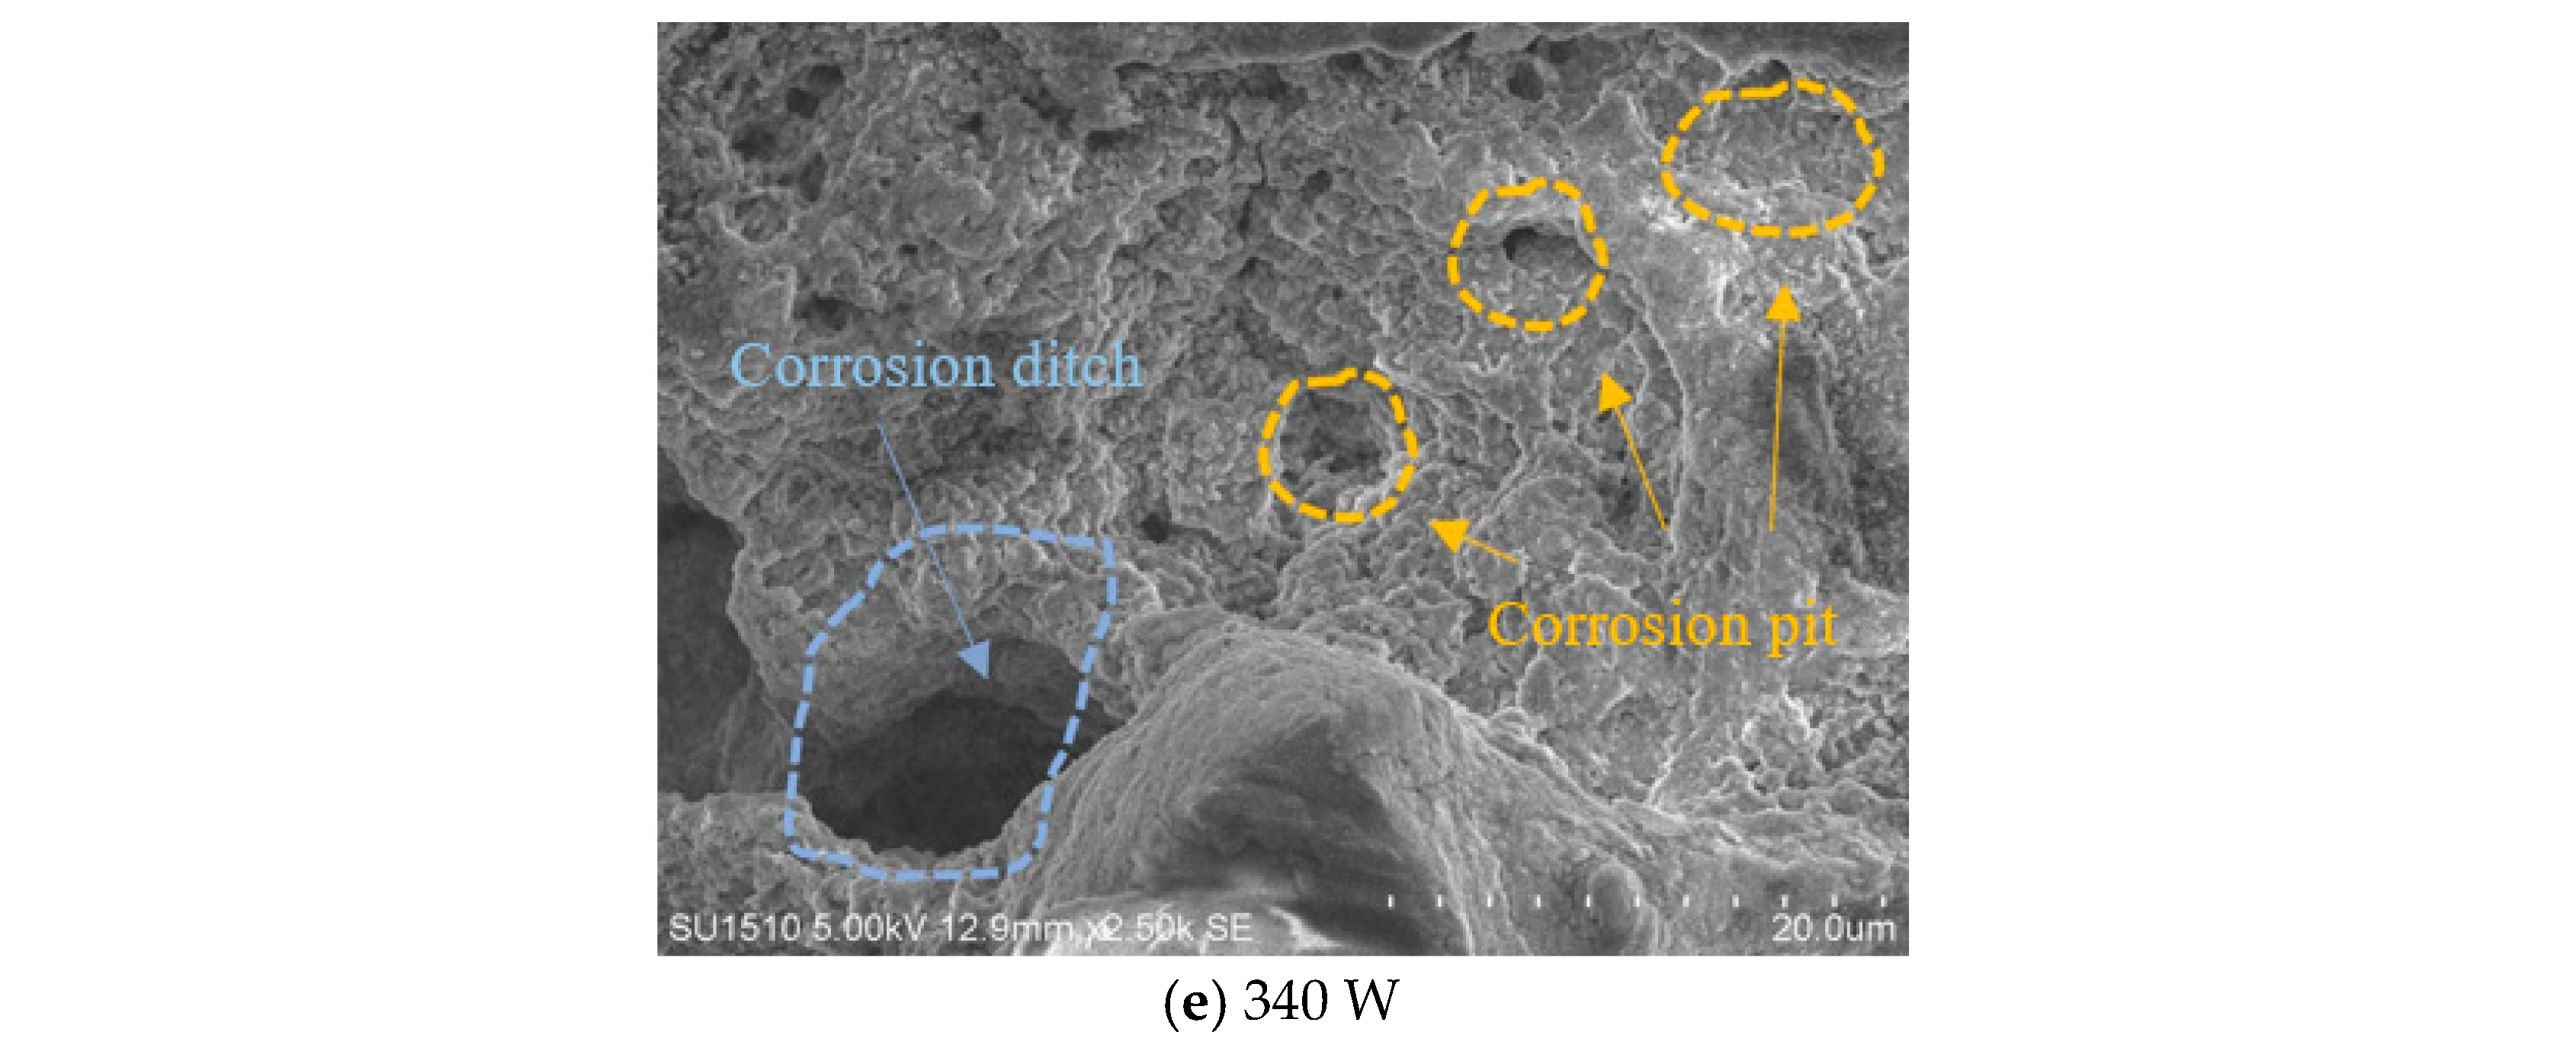
3.1. Surface Morphology and Density

Figure 2 and Figure 3 present the surface morphology and density of samples prepared using various laser powers. Upon observation, it is evident that a laser power of 260 W results in a surface roughness of 17.32 μm. The sample’s surface displays pores of different sizes, randomly distributed with a density of 97.01%. The primary causes for this phenomenon are outlined below. When the laser power is too low, the powder cannot absorb sufficient energy. At this time, the temperature of the molten pool is low, whereas the powder viscosity is high, causing poor fluidity of the molten pool, insufficient powder melting, and less liquid phase in the molten pool, resulting in an insufficient liquid phase to fill residual pores and gaps during the solidification process. For SLM processing, when there is a large amount of unmelted powder unevenly piled up on the formed surface, the next layer of powder also becomes uneven. This layer-by-layer stacking ultimately has a negative impact on the density of the sample. When the laser power increases to 280 W, the number of surface pores decreases, and the surface roughness and density reach 10.31 μm and 98.63%, respectively. This is because the input energy increases and the powder absorbs enough energy to fully melt. Consequently, the fluidity of the molten pool enhances, allowing it to spread effectively, which in turn hinders the formation of pore defects due to spheroidization.
As it further increases, the surface pores of the sample gradually increase, and the density of the sample also shows a decreasing trend. When it varies within the range of 300–340 W, irregular pores appear on the surface, and the surface roughness increases to 12.45, 15.79, and 18.64 μm. Contrary to surface roughness, the density decreases to 97.21%, 96.22%, and 95.11%, respectively. Especially when the laser power is 340 W, the maximum diameter of the pores reaches 50 μm. At this point, the input energy of the laser is too large, leading to severe element burning, and the viscosity of the molten pool undergoes a sudden and substantial reduction. The liquid molten pool flows excessively, with an excessive spreading area and even remelting in some areas. In addition, excessively flowing molten pools and high-energy laser shock can also cause powder splashing, resulting in insufficient melt filling of some gaps during matrix solidification, resulting in more spherical pores. When there are too many pores, they merge with each other to form large pores, impairing the quality of the sample’s formation.
In SLM, the density of parts is inversely proportional to porosity, meaning that the more pores there are, the lower the density. The magnitude of laser power directly influences the degree of melting of the metal powder during the melting process, which in turn affects the formation of pores. When the laser power is moderate, the metal powder can fully melt and form good metallurgical bonding. This helps reduce the formation of pores and increases the density of the parts. When the laser power is too low, the metal powder may not fully melt, leading to an increase in pores and a decrease in density. When the laser power is too high, although the metal powder can melt, excessively high temperatures may cause metal sputtering, vaporization, and other phenomena, which also increase pore formation and reduce density. Therefore, as the laser power increases gradually from 260 W to 340 W, the surface roughness of the specimens first decreases and then increases, while the density exhibits an opposite trend. When the laser power increases from 260 W to 280 W, the surface roughness decreases by 40.48%, while the density increases by 1.34%. Further, as the laser power continues to increase to 340 W, the surface roughness increases by 20.76%, 53.15%, and 80.79%, respectively. Conversely, the density decreases by 1.44%, 2.44%, and 3.57%, respectively. This is consistent with the explanations provided above.

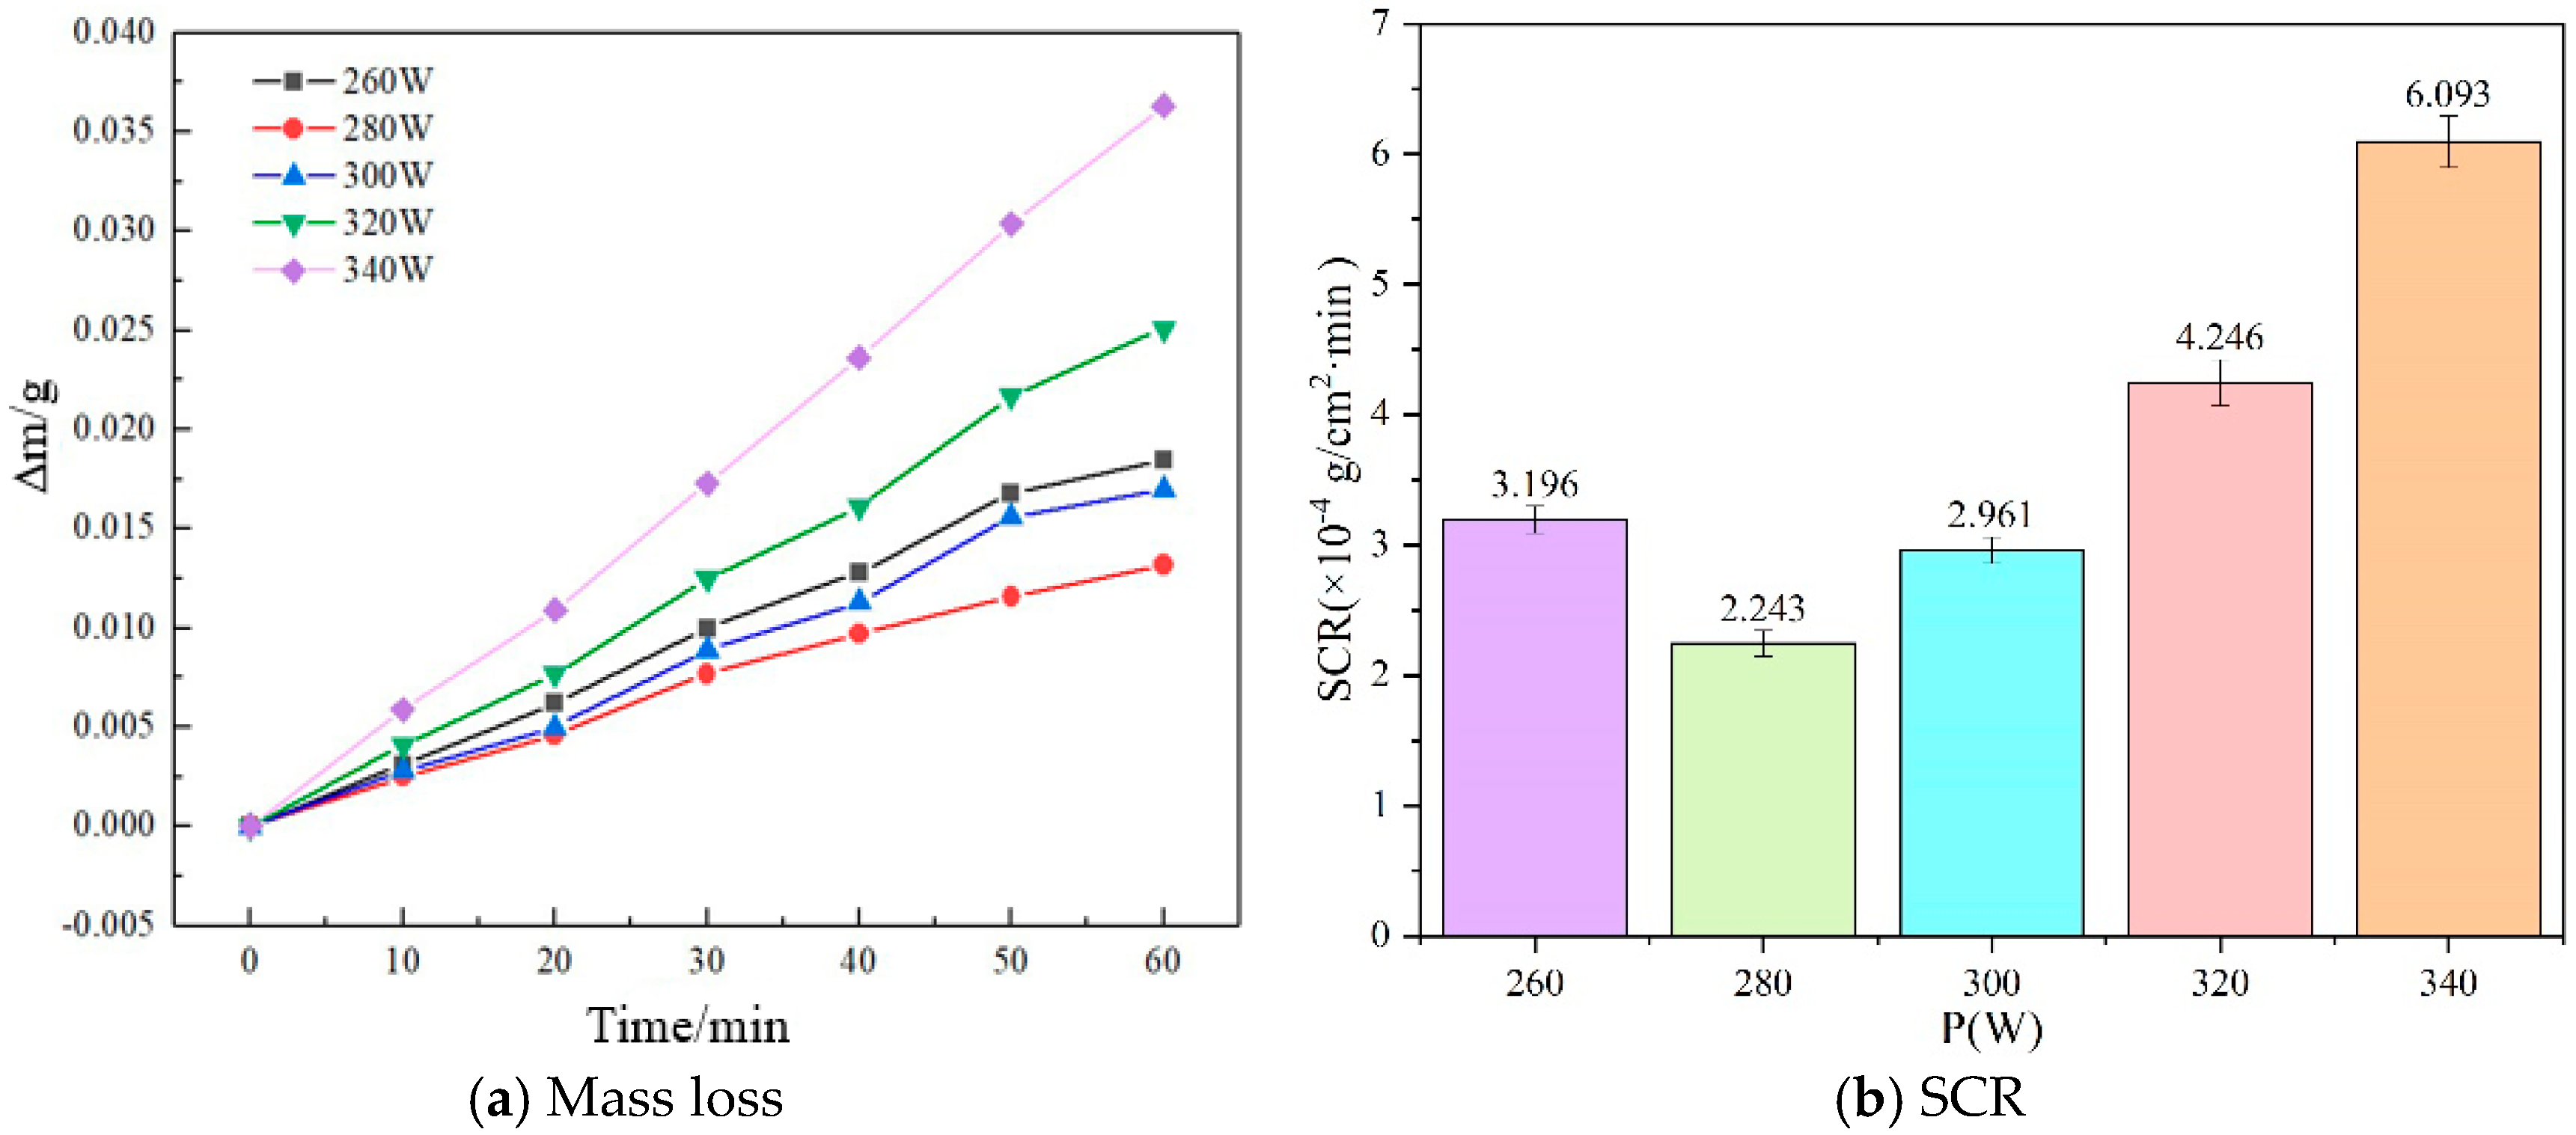
3.2. Self-Corrosion Rate

Figure 4 displays the self-corrosion of the sample when exposed to varying laser powers. The weight loss of composite material samples over time in a 4 M NaOH electrolyte is shown in Figure 4a. Observing the curve, it can be observed that as the soaking time increases, the weight loss of the sample gradually increases, and the weight loss of the sample is approximately linearly related to time. However, the steepness of the curve changes. Over time, the weight loss of certain samples experiences a notable increase, whereas the weight loss of others undergoes a significant decrease. In addition, it can be seen that under the same soaking time, the change in laser power has a significant impact on mass loss. When the soaking time is the same, the order of mass loss from large to small is as follows: 340 W > 320 W > 260 W > 300 W > 280 W, indicating that as the laser power rises, the sample’s mass loss initially diminishes and subsequently increases, reaching its lowest point at a laser power of 280 W.
As the laser power escalates from 260 to 340 W, the SCR of the sample exhibits an initial decline followed by an increase. Specifically, at a laser power of 340 W, the sample’s surface quality is compromised with the presence of large pore defects, leading to maximum weight loss due to self-corrosion and a corresponding SCR of 6.093 × 10⁻⁴ g/cm−2·min. Conversely, at a laser power of 280 W, the sample experiences the least weight loss with an SCR of 2.243 × 10⁻⁴ g/cm−2·min. This is attributed to the reduced pore distribution and higher density of the sample’s surface under optimal laser power, enhancing its corrosion resistance. In comparison, an increase in laser power from 280 W to 340 W results in a nearly threefold surge in the sample’s SCR.

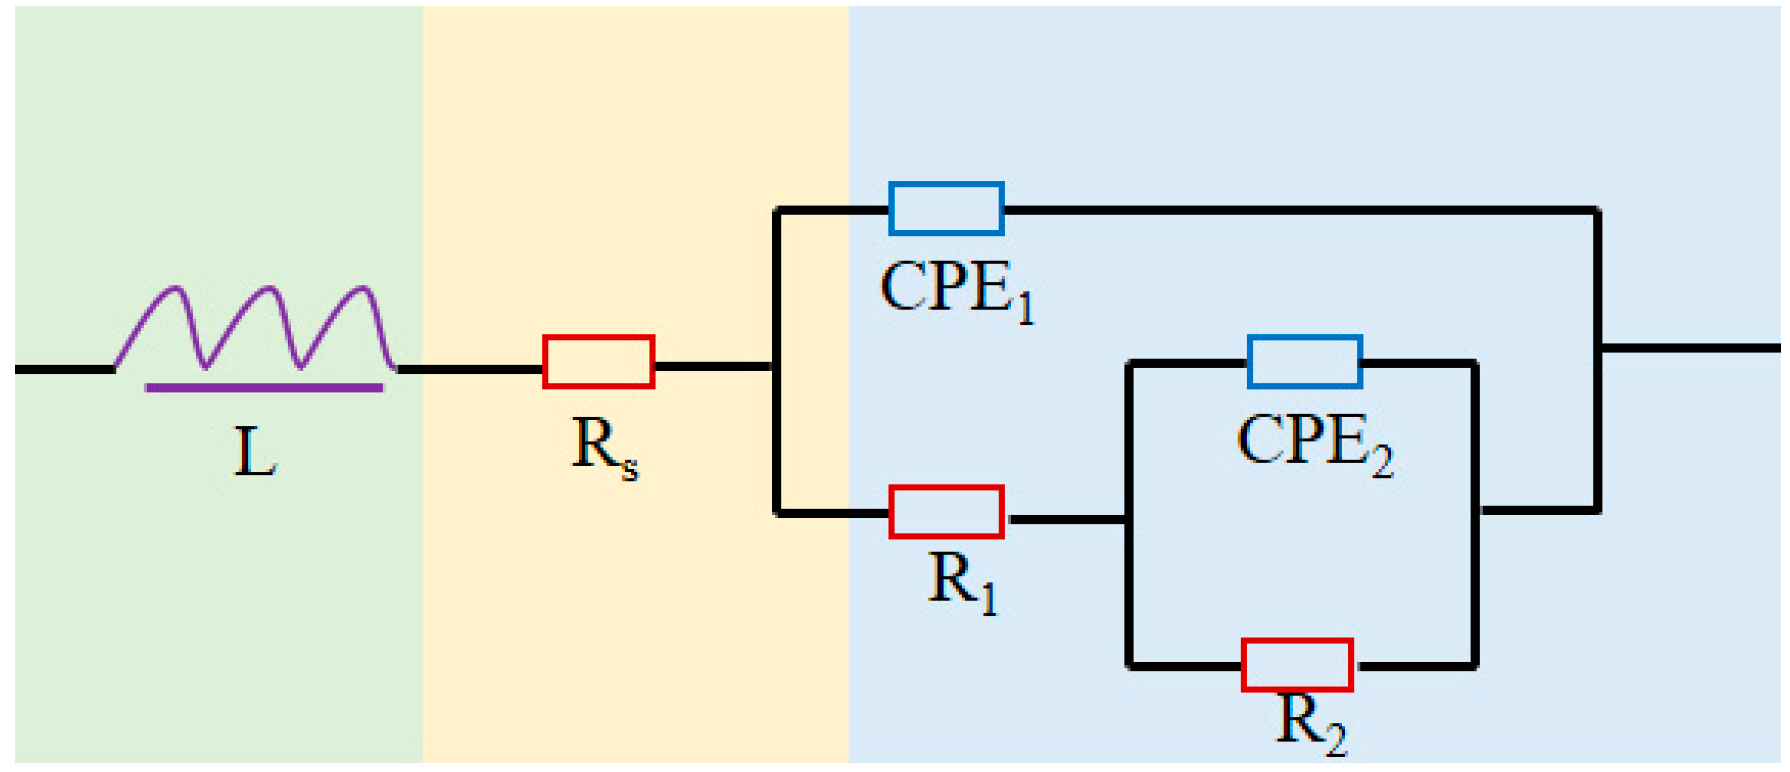
3.3. Electrochemical Behavior

Figure 5 depicts the trend of the open circuit potential (OCP) of the sample over time, subject to varying laser powers. Despite the alloy surface being polished and cleaned prior to the experiment, a slight roughness remains on the material surface, causing minor fluctuations in the OCP. Notably, these fluctuations are relatively minor, with the exception of the case at 280 W. As the laser power increases, the OCP initially undergoes a negative shift and subsequently returns to a more positive value. Specifically, at a laser power of 260 W, the OCP is recorded at −1.611 V. When the laser power is 280 W, it reaches a relatively negative value of −1.638 V. Due to the negative OCP reflecting the activation degree of the alloy to a certain extent, the sample exhibits significant electrochemical activity at a laser power of 280 W. As an alloy material, it is susceptible to polarization during the process, significantly impacting its overall performance. As the laser power increases to 300 W, 320 W, and 340 W, OCP shows relatively less noticeable movement, especially when the laser power is 320 W and 340 W. At this point, the two OCP curves almost overlap, which is due to the significant decrease in forming quality caused by the high laser power.
Figure 6 and Table 2 present the polarization curves and electrochemical parameters of the samples, respectively, when subjected to various laser powers. For metal samples, the more positive the corrosion potential, the greater the polarization degree. At the same time, the charge transfer resistance of the alloy in the solution will also increase with the increase in polarization degree, ultimately seriously hindering the electrochemical dissolution of the alloy. An increase in corrosion current density accelerates the SCR of the alloy, leading to severe self-corrosion, reduced alloy utilization rate, and decreased output voltage. At a laser power of 340 W, the corrosion potential is −1.624 V, and the sample exhibits the highest corrosion current density of 2.567 × 10⁻² A/cm2. As the laser power decreases to 320 W, 300 W, 280 W, and 260 W, the corrosion potentials of the aluminum alloy shift negatively to −1.626 V, −1.626 V, −1.632 V, and −1.615 V, respectively, displaying an overall trend of continuous negative shift before reversing to positive. Notably, at a laser power of 280 W, the sample’s corrosion potential reaches its most negative value of −1.632 V, suggesting optimal electrochemical activity.
In addition, by analyzing electrochemical parameters, it can be found that as the laser power gradually decreases, the corrosion current density shows a trend of decreasing first and then increasing. When the laser power gradually decreases from 340 W to 260 W, the corrosion current densities of the samples are 2.567 × 10⁻² A/cm2, 2.390 × 10⁻² A/cm2, 2.258 × 10⁻² A/cm2, 2.090 × 10⁻² A/cm2, and 2.345 × 10⁻² A/cm2, respectively. Upon examination, it is observed that at a laser power of 280 W, the sample demonstrates the most negative corrosion potential while simultaneously exhibiting the lowest corrosion current density. This signifies that the sample possesses enhanced electrochemical activity and a reduced SCR. This phenomenon occurs due to the improvement in the sample’s forming quality brought about by the optimal laser power, which subsequently decreases the rate of self-corrosion reactions. Additionally, the increased number of grain boundaries act as more reaction channels, boosting the electrochemical activity and mitigating the degree of anodic polarization.
Figure 7 shows the EIS curve of the sample, which was fitted using ZsimpWin3.6 tware. The equivalent circuit and its fitting parameters are illustrated in Figure 8 and Table 3. Observing the figure, we note that the EIS of each sample comprises one large and one small capacitive arc in the first quadrant. The radius of these arcs in the EIS exhibits a trend of initially increasing and then decreasing as the laser power is incremented. From Table 3, it can be seen that there are significant differences in the diffusion resistance R2 and hydrogen evolution inductance L of the charge between the corrosive medium or film layers during the electrochemical reaction process. R2 shows a trend of first increasing and then decreasing, while the inductance value of L decreases first and then increases. This is because when the laser power is not appropriate, the input energy of the laser is insufficient or too large, and the liquid melt pool cannot be effectively spread, affecting the forming quality. There are many pore defects on the surface, and the microstructure grain size is coarse, which seriously reduces the corrosion resistance of the material, leading to a serious hydrogen evolution phenomenon. In addition, it can be clearly seen that when the laser power is 340 W, its ElS diagram is different from the shape of other samples, especially the less obvious semicircle. This may be because the inductance, capacitance, and other components in the test circuit have an impact on the EIS test results, thereby affecting the clarity of the semicircle. At a laser power of 340 W, its hydrogen evolution inductance is the largest among all samples and CPE2 is the smallest among all samples. The combined effect of inductance and capacitance leads to results that are significantly different from other laser parameters. Moreover, when the laser power is 280 W, the inductive resistance of the sample caused by hydrogen evolution is relatively small, which is 7.827 × 10⁻²⁰ Ω·cm2, but with high polarization resistance, which reaches 8.048 × 10⁻¹ Ω·cm2. This suggests that the sample possesses satisfactory corrosion resistance, aligning with the outcomes of self-corrosion testing experiments and the findings derived from polarization curve analysis.
Based on a comprehensive analysis of electrochemical test results, including OCP, Tafel, and electrochemical impedance spectroscopy (EIS) curves, it is evident that variations in laser power significantly influence the outcomes of these tests. The Tafel curves reveal that when the laser power is relatively low (260 W), the corrosion current density of the sample is higher, and the polarization impedance is lower, indicating poorer corrosion resistance. Conversely, when the laser power is higher (340 W), the corrosion current density and polarization impedance of the sample remain similar to those observed at the lower laser power, suggesting equally poor corrosion resistance. The same trend can be observed from the EIS curves. As the laser power increases from 260 W to 340 W, the corrosion current density changes by −10.87%, 8.04%, 14.35%, and 22.82%, respectively, while the polarization impedance changes by 16.67%, −4.76%, −4.76%, and −19.05%, respectively.
Additionally, when the laser power is either too high or too low, the hydrogen evolution inductance of the sample is also higher, indicating severe hydrogen evolution corrosion and poorer corrosion resistance (in the order of 10−7). When the laser power is 280 W, the sample exhibits lower corrosion current density and higher polarization impedance, suggesting better corrosion resistance. The hydrogen evolution inductance is related to hydrogen evolution corrosion. As a common electrochemical corrosion phenomenon, poor performance in this regard by a sample may lead to decreased performance and shortened lifespan of components during use, subsequently adversely affecting the overall performance of aerospace vehicles. Aerospace components often operate in extreme environments, such as high temperatures, high pressures, and strong corrosion, thus demanding extremely high resistance to hydrogen evolution. Inadequate hydrogen evolution resistance of a sample will make it difficult to meet the high material performance requirements of the aerospace industry. Furthermore, hydrogen evolution corrosion can result in the degradation of mechanical properties of metallic materials, such as reduced strength and toughness, which directly impacts the structural integrity and safety of aerospace vehicles. Especially in critical components like engine blades and turbine disks, hydrogen evolution corrosion can lead to component failure and subsequently serious safety accidents. Therefore, the hydrogen evolution resistance of samples is of great significance in ensuring the safety of aerospace vehicles.
From the surface morphology, as shown in Figure 9, it can be observed that when the laser power is 260 W, deep corrosion pits with a diameter of approximately 20 μm form on the surface of the sample, indicating relatively severe corrosion of the alloy. When the laser power is set to 280 W and 300 W, the surface of the sample appears relatively flat, suggesting uniform dissolution of the alloy. At this point, there are fewer active sites in the self-corrosion reaction, and the hydrogen evolution phenomenon is weakened. Therefore, the electrochemical stability of the alloy is relatively high. As the laser power further increases, the corrosion of the alloy gradually intensifies, leading to the appearance of larger corrosion gaps at certain locations. Especially when the laser power reaches 340 W, deep corrosion grooves and pits are evident on the surface of the sample, with the length of the corrosion grooves reaching approximately 20 μm. This is closely related to the poor forming quality of the sample at this specific laser power.

4. Conclusions

This work examines the impact of laser power on forming quality (including surface morphology and density), self-corrosion rate, and electrochemical behavior. The main conclusions are summarized below.
(1)
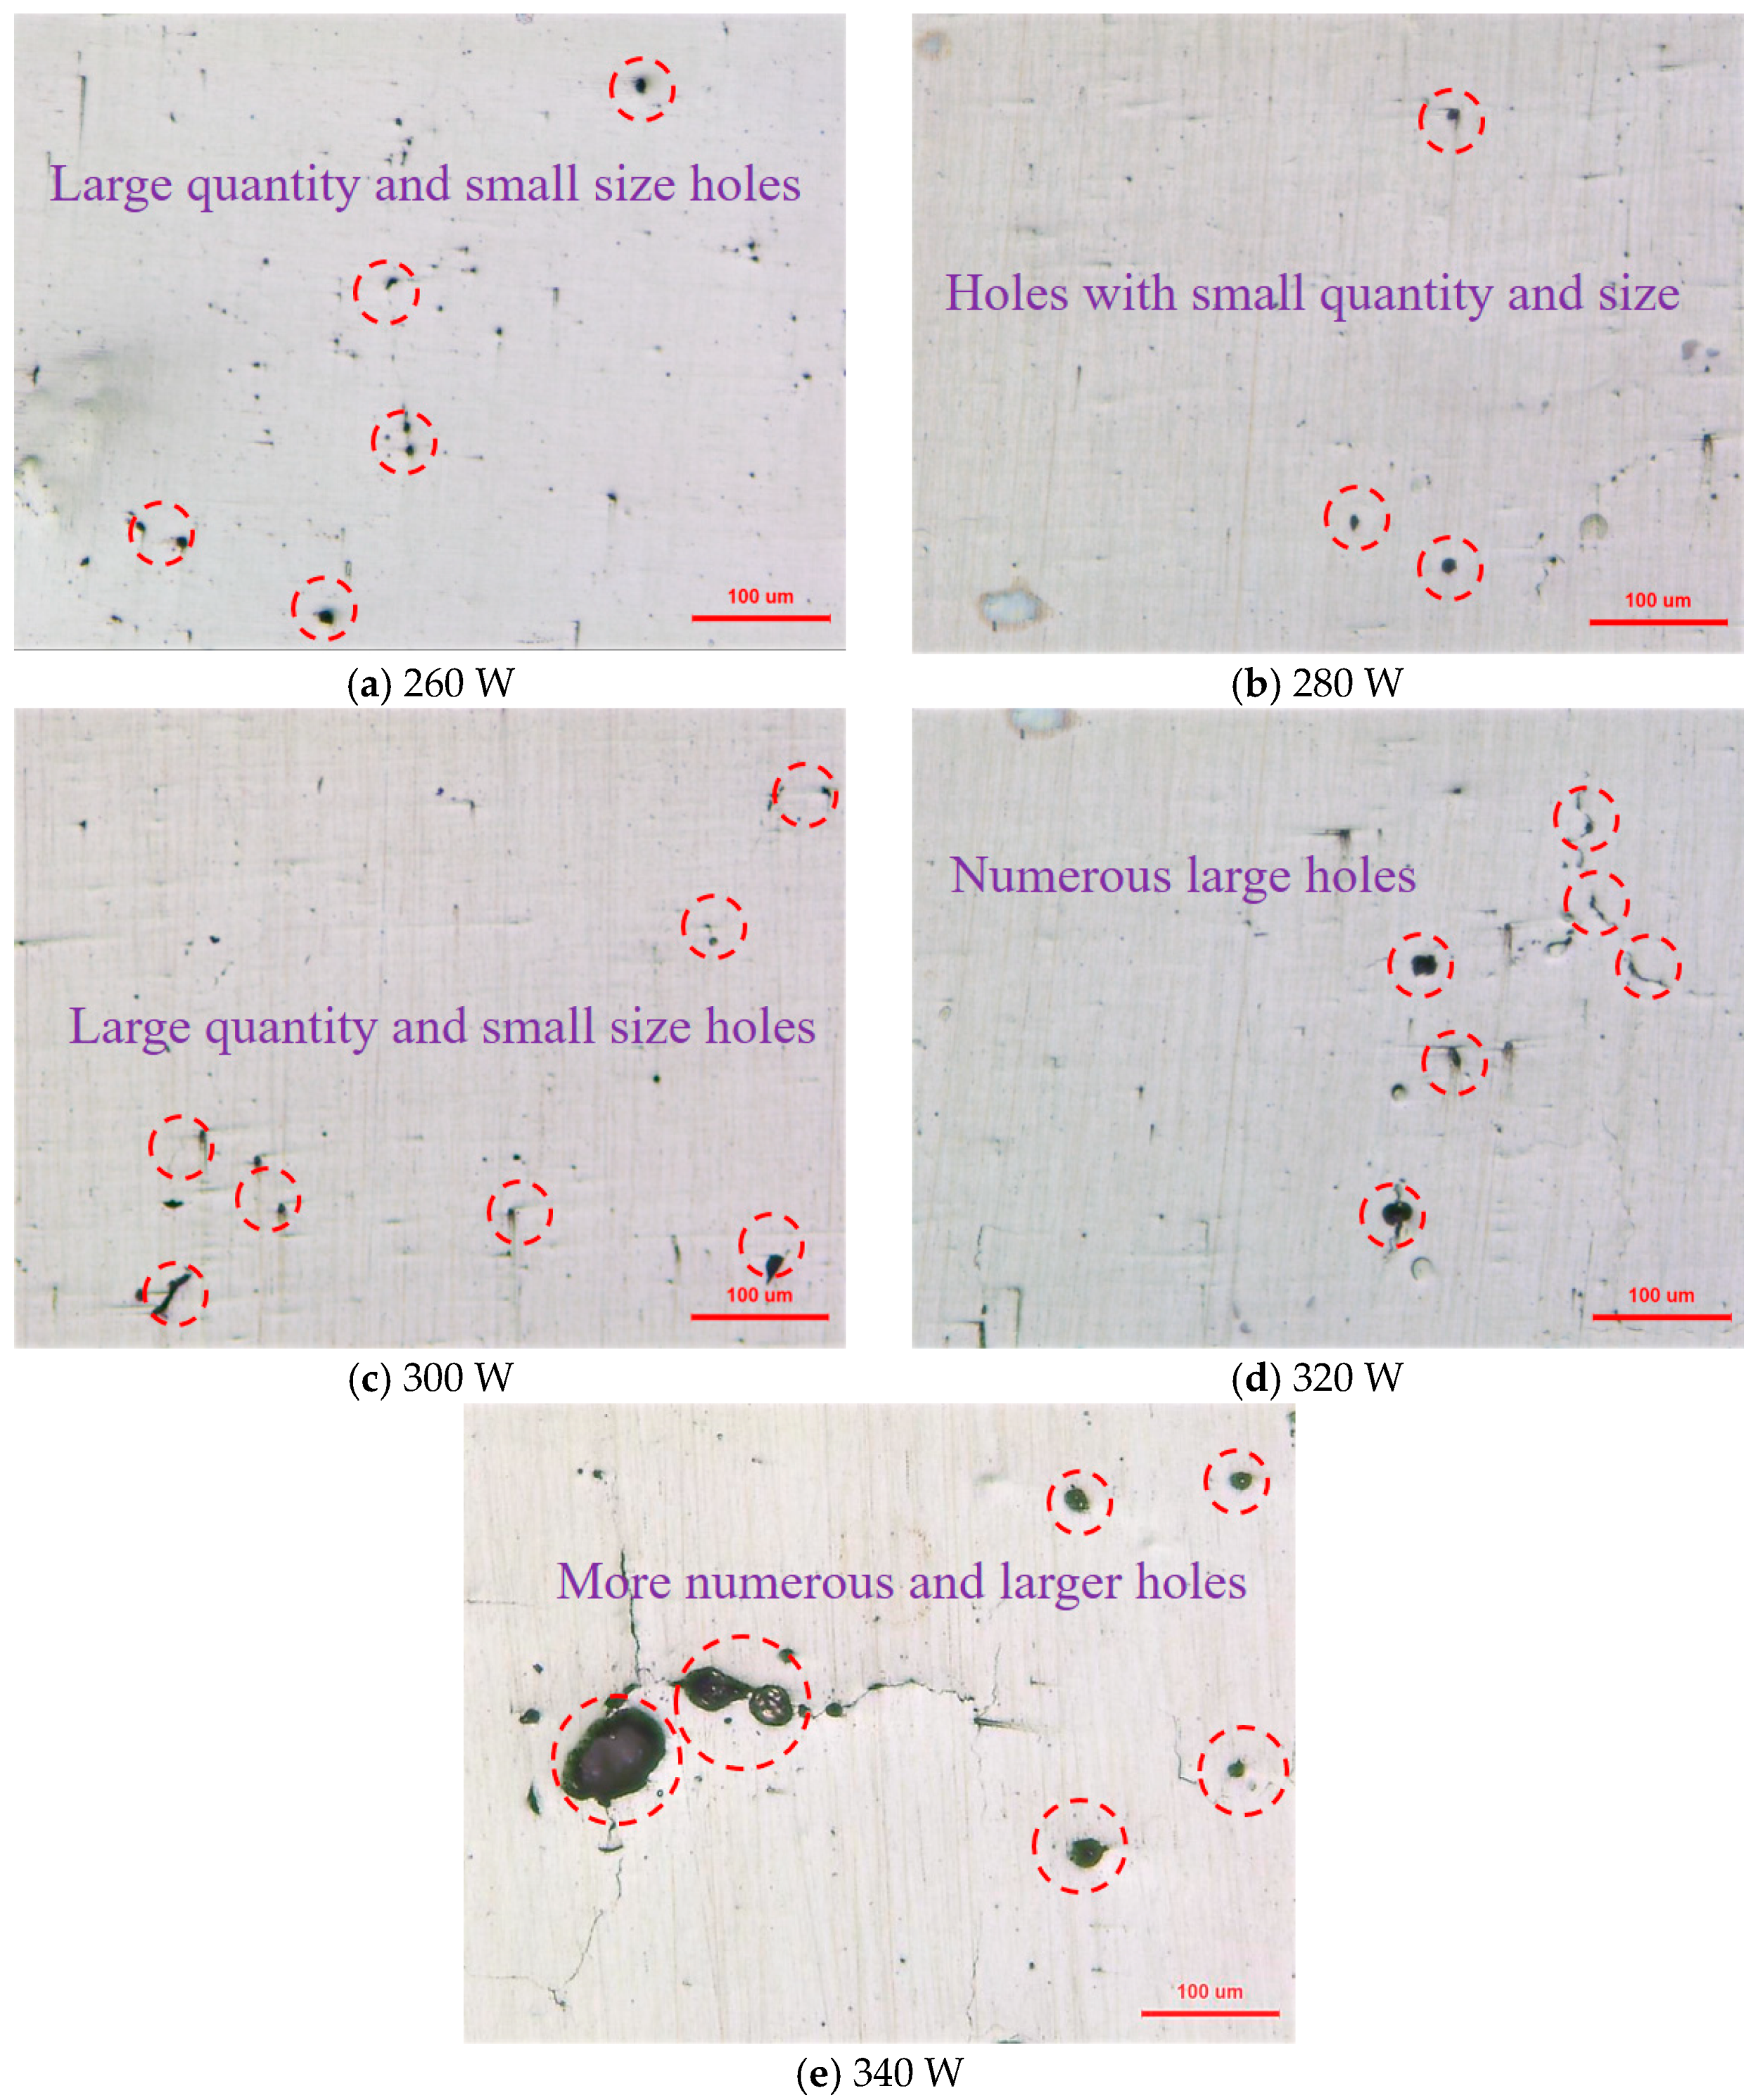
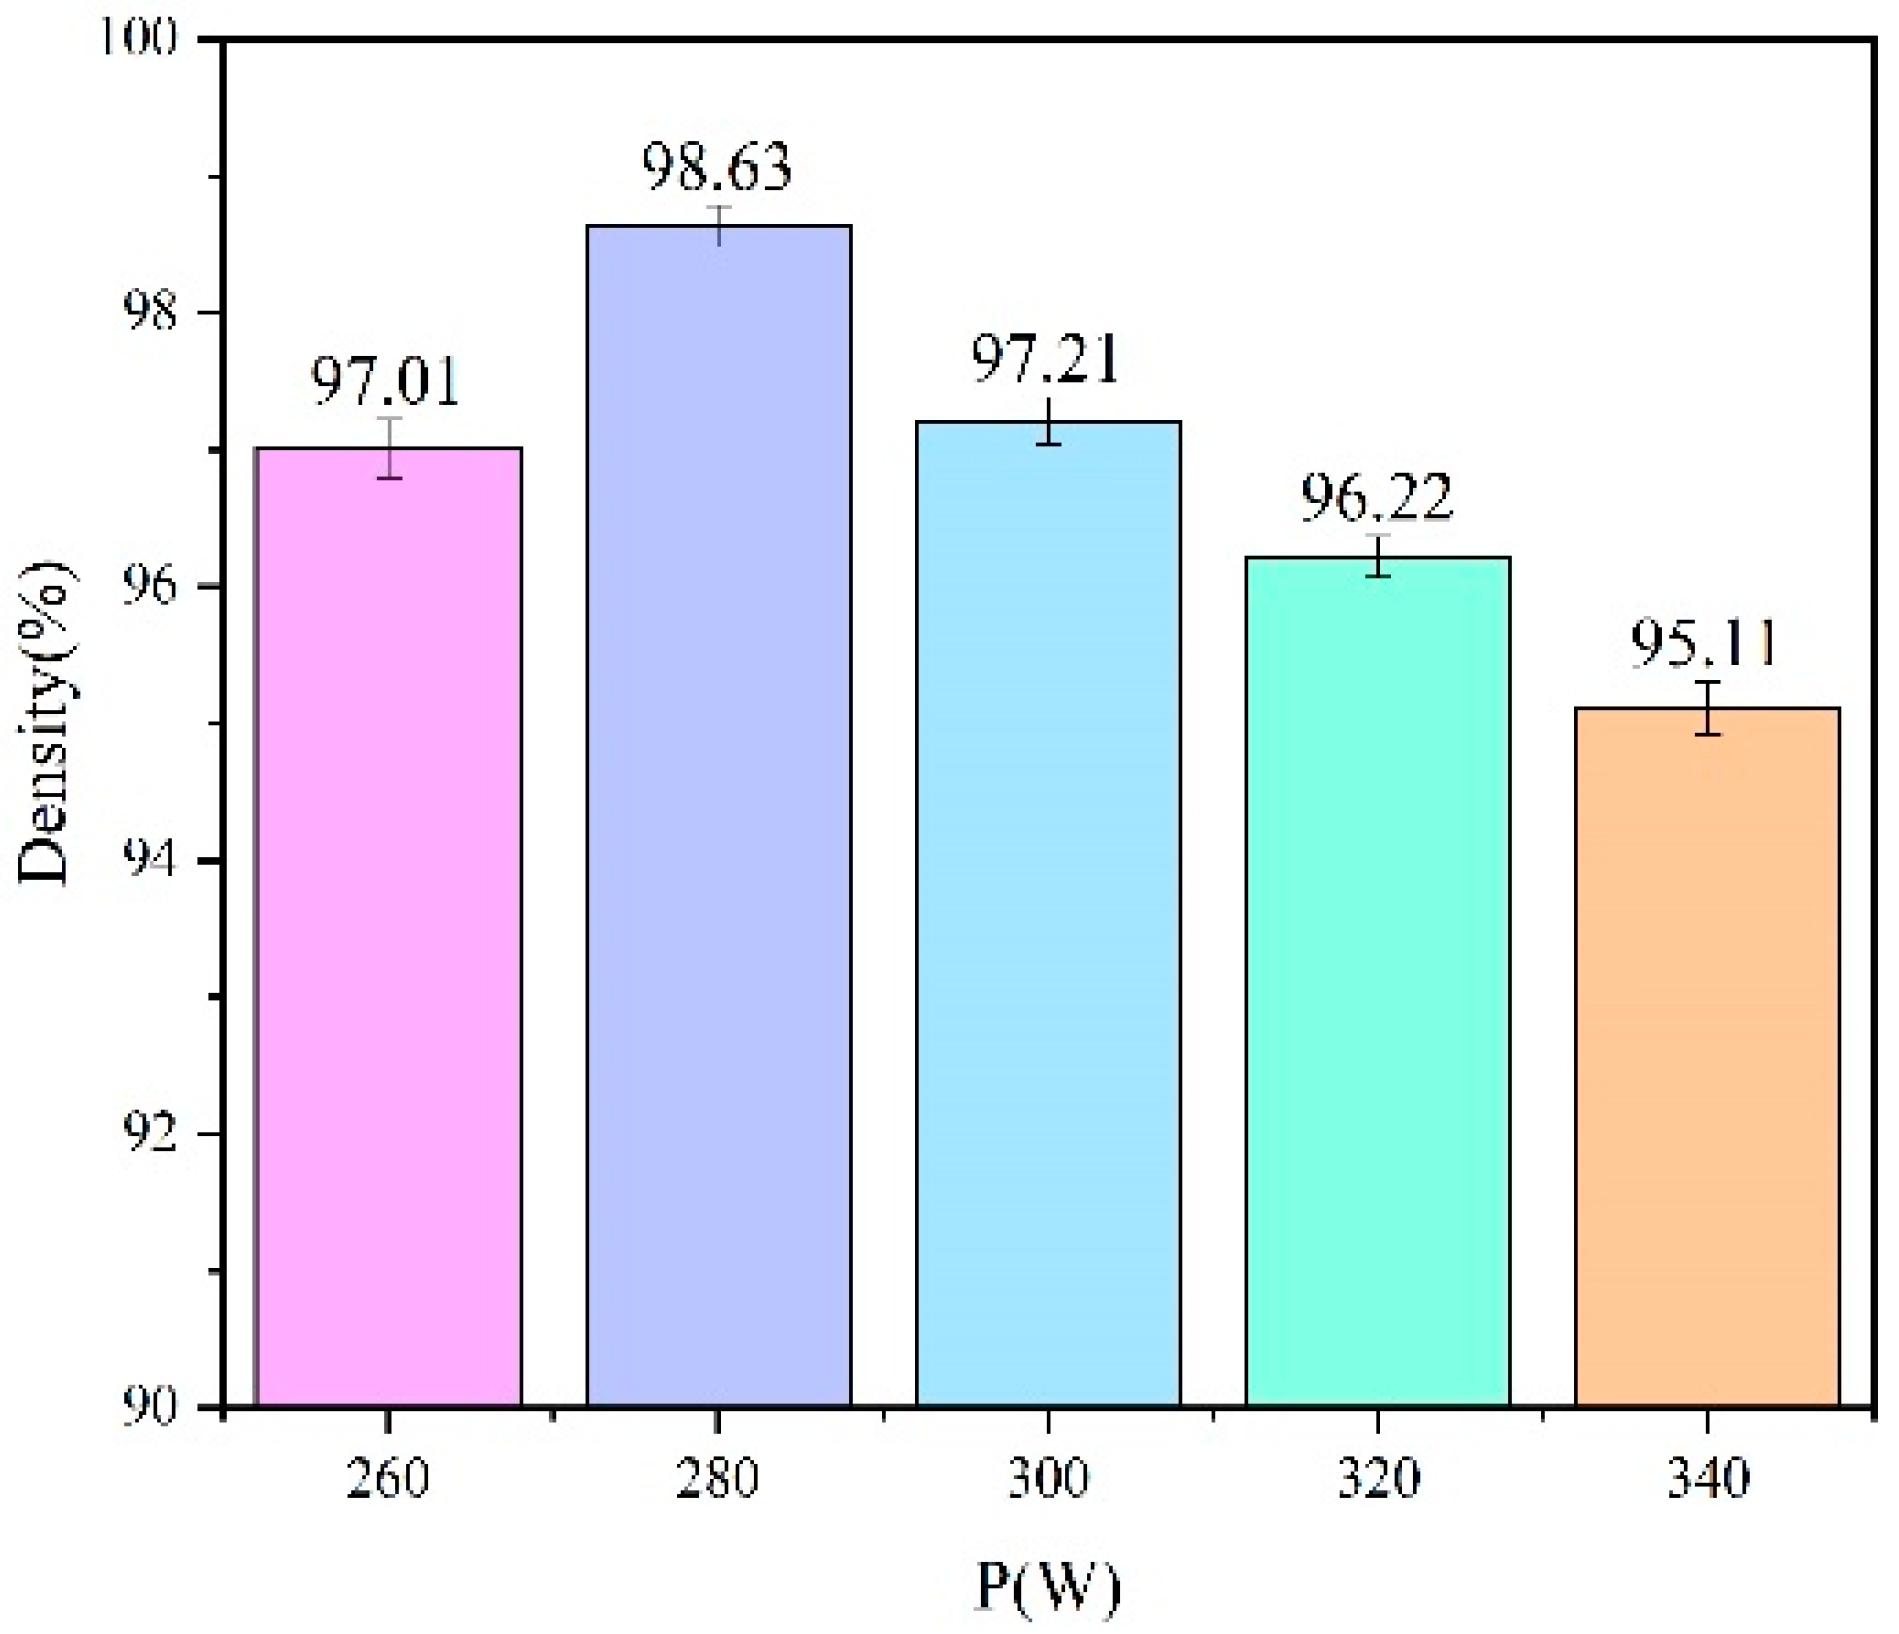
As the laser power rises, the surface roughness of the sample initially decreases but then increases, and correspondingly, the sample’s density exhibits a trend of first rising and then falling. At a laser power of 280 W, the sample achieves optimal forming quality, with a surface roughness of 10.31 μm and a density of 98.63%, respectively.
(2)
As the laser power is increased, the self-corrosion rate of the sample exhibits a trend of initially declining and then rising. This is related to the surface quality of the sample. Under appropriate laser power, the surface of the sample has fewer pores and higher density, resulting in improved corrosion resistance.
(3)
Under different laser powers, the electrochemical behavior exhibits the same trend as the self-corrosion rate. As the laser power increases, OCP shows a trend of first negative shift and then positive shift. At a laser power of 280 W, the sample attains the most negative corrosion potential and exhibits the lowest corrosion current density, suggesting a high level of electrochemical activity.
(4)
In summary, variations in laser power influence the forming quality of the sample, resulting in alterations to its self-corrosion rate and electrochemical characteristics. Specifically, when the laser power is set to 280 W, the sample achieves the best forming quality, accompanied by a reduced self-corrosion rate and more stable electrochemical behavior.
The forming quality of specimens in SLM of metal matrix composites is closely related to the content of reinforcing phases. Due to the high absorptance of reinforcing particles to laser, the viscosity and surface tension of the molten pool vary with changes in the addition ratio, thereby affecting the forming quality. For instance, the addition of reinforcing particles can refine the microstructure of the metal matrix, reduce the formation of defects, and subsequently enhance corrosion resistance. Subsequent sections of this work will delve into the study of composites with different CeO2 contents, while incorporating deep learning algorithms and other methods to further optimize them, aiming to improve their corrosion resistance.

Author Contributions

Conceptualization, F.S.; methodology, all authors; software, F.S.; validation, J.H.; formal analysis, F.S.; investigation, F.S.; resources, F.S.; data curation, J.H.; writing—original draft preparation, F.S.; writing—review and editing, F.S.; visualization, all authors; supervision, J.H.; project administration, all authors; funding acquisition, F.S. All authors have read and agreed to the published version of the manuscript.

Funding

This work was co-funded by “Light of Taihu Lake Scientific and Technological Research Plan, grant number K20231025” and “The Startup Foundation for Introducing Talent of Wuxi University, grant number 2021R003”.

Data Availability Statement

The authors do not have permission to share data.

Conflicts of Interest

The authors declare no conflicts of interest.

References

  1. Nandhakumar, R.; Venkatesan, K. A process parameters review on selective laser melting-based additive manufacturing of single and multi-material: Microstructure, physical properties, tribological, and surface roughness. Mater. Today Commun. 2023, 35, 105538. [Google Scholar] [CrossRef]
  2. Zhang, T.; Zhang, K.; Pang, C.Y. Study on the effects of the processing parameters on the single tracks and the block support structures fabricated by selective laser melting. J. Laser Appl. 2024, 36, 012024. [Google Scholar] [CrossRef]
  3. Liu, W.; Huang, S.; Du, S.; Gao, T.; Zhang, Z.; Chen, X.; Huang, L. The effects of heat treatment on microstructure and mechanical properties of selective laser melting 6061 aluminum alloy. Micromachines 2022, 13, 1059. [Google Scholar] [CrossRef]
  4. Jerrard, P.; Hao, L.; Dadbakhsh, S.; Evans, K. Consolidation behaviour and microstructural characteristics of Al and a mixture of Al-Cu alloy powders following selective laser melting processing. Laser Eng. 2012, 22, 371. [Google Scholar]
  5. Carter, L.N.; Martin, C.; Withers, P.J. The influence of the laser scan strategy on grain structure and cracking behaviour in SLM powder-bed fabricated nickel superalloy. J. Alloys Compd. 2014, 615, 338. [Google Scholar] [CrossRef]
  6. Gürkan, K.; Fatih, Y.; Ilyas, H. Characterization of the structural and tribological properties of medical Ti6Al4V alloy produced in different production parameters using selective laser melting. 3D Print. Addit. Manuf. 2019, 6, 253–261. [Google Scholar]
  7. Xiao, X.; Liu, Y.; Cheng, W.; Liu, X. Microstructure and mechanical property of titanium-containing 6061 aluminum alloy prepared by selective laser melting. J. Mater. Eng. 2023, 51, 36. [Google Scholar]
  8. Zhang, X.Z.; Chen, L.; Zhou, J.; Ren, N.F. Simulation and experimental studies on process parameters, microstructure and mechanical properties of selective laser melting of stainless steel 316L. J. Braz. Soc. Mech. Sci. Eng. 2020, 42, 402. [Google Scholar] [CrossRef]
  9. Niaraki, M.; Torabian, H.; Rousta, S. Experimental Investigation on low cycle Fatigue Behavior of Al6061/SiC composite Fabricated by Friction Stir Processing. Technol. Aerosp. Eng. 2023, 14, 157. [Google Scholar]
  10. Bisht, M.; Gaur, V.; Singh, I. On mechanical properties of SLM Al-Si alloy: Role of heat treatment-induced evolution of silicon morphology. Mater. Sci. Eng. A 2022, 10, 144157. [Google Scholar] [CrossRef]
  11. Desai, V.; Badheka, V.; Zala, A. Fabrication of Al6061/Ti3AlC2 MAX phase surface composite by friction stir processing and investigation of wear properties. Tribol. Int. 2024, 14, 195. [Google Scholar] [CrossRef]
  12. Nanjunath, B.; Mishra, A.; Jayaprakash, H.S.; Karthik, D.V.; Kiran, N. Studies on Inconel 625 and Al6061 bimetallic joints produced by CMT-based welding process. Mater. Lett. 2024, 355, 1355431. [Google Scholar]
  13. Beal, M.; Azzougagh, M.N.; Pourchez, J.; Bertrand, P.; Cabrol, E.; Si-Mohand, H.; Keller, F.X. Effect of powder reuse on physical, chemical and toxicological properties of 6061-Zr aluminum alloy processed by laser powder bed fusion (L-PBF). Master Tech. 2023, 111, 103. [Google Scholar] [CrossRef]
  14. Carluccio, D.; Bermingham, M.J.; Zhang, Y.; StJohn, D.H.; Yang, K.; Rometsch, P.A.; Wu, X.; Dargusch, M.S. Grain refinement of laser remelted Al-7Si and 6061 aluminium alloys with Tibor and scandium additions. J. Manuf. Process. 2018, 35, 715. [Google Scholar] [CrossRef]
  15. Ramoni, M.; Shanmugam, R.; Ross, N.S. An experimental investigation of hybrid manufactured SLM based Al-Si10-Mg alloy under mist cooling conditions. J. Manuf. Process. 2021, 08, 045. [Google Scholar] [CrossRef]
  16. Aridi, R.; DiNova, V.; Zhang, T.Y.; Karna, S.; Yuan, L.; Krentz, T.; Hitchcock, D.; Gross, A.J. Characterization of defects in additively manufactured materials from mechanical properties. Mater. Sci. Eng. A 2024, 898, 146390. [Google Scholar] [CrossRef]
  17. Li, C.; Wu, M.; Duan, W. Effect of laser power on the forming quality of Al6061 alloy manufactured via selective laser melting. Proc. Inst. Mech. Eng. Part E J. Process Mech. Eng. 2024, 1, 238. [Google Scholar] [CrossRef]
  18. Vishwakarma, A.K.; Debnath, D.; Pawar, M.D. Laser welding of additively manufactured AlSi10Mg and conventionally manufactured Al6061 alloy. Weld World 2024, 68, 1731. [Google Scholar] [CrossRef]
  19. O’Keeffe, C.; Kotlarz, M.; Gonalves, I.F. Chemical etching of Ti-6Al-4V biomaterials fabricated by selective laser melting enhances mesenchymal stromal cell mineralization. J. Biomed. Mater. Res. A 2024, 112, 9. [Google Scholar] [CrossRef]
  20. Jeong, J.U.; Lee, K.K.; Ahn, D.G. Study of surface roughness change of AlSi10Mg based on selective laser melting (SLM) using electro-polishing technique. J. Mech. Sci. Technol. 2024, 38, 9. [Google Scholar] [CrossRef]
  21. Arvieu, C.; Galy, C.; Le, G.E. Relative density of SLM-produced aluminum alloy parts: Interpretation of results. J. Manuf. Mater Process 2020, 4, 4030083. [Google Scholar] [CrossRef]
  22. Zhou, X.; Zhang, Q.; Lu, J. Enhanced corrosion resistance and biofilm inhibition of functionally graded TC4/TC4-5Cu fabricated by selective laser melting against streptococcus mutans. Acta Metall. Sin. Engl. 2023, 36, 1961. [Google Scholar] [CrossRef]
  23. Zhang, M.; Xu, M.; Li, J. Compressive behavior of hollow triply periodic minimal surface cellular structures manufactured by selective laser melting. Rapid Prototyp. J. 2023, 29, 569. [Google Scholar] [CrossRef]
  24. Li, Y.; Liao, H. Selective laser melting of novel SiC and TiC strengthen 7075 aluminum powders for anti-cracks application. J. Mater. Sci. Chem. Eng. 2024, 12, 136. [Google Scholar] [CrossRef]
  25. Tang, H.; Geng, Y.; Bian, S. An ultra-high strength over 700 MPa in Al-Mn-Mg-Sc-Zr alloy fabricated by selective laser melting. Acta Metall. Sin. 2022, 35, 466. [Google Scholar] [CrossRef]
  26. Wen, X.L.; Wang, C.B.; Liu, W.B.; Ren, H.W. Experimental study on the microstructure of FeCoNiCr high-entropy alloys by selective laser melting. J. N. Univ. 2023, 44, 536. [Google Scholar]
  27. Al, H.; Hiba, J.; Kassis, J.; Zaidani, W.B.T. The effect of repeated baking of porcelain on its bonding strength to a Co-Cr alloy 3D-printed by selective laser melting. Saudi Dental J. 2024, 36, 296. [Google Scholar]
  28. Wang, G.; Zhang, S.; Liu, T. The intrinsically quasi-isotropic tensile properties of as-fabricated Al-Mg-Si-Sc-Zr alloy produced by selective laser melting. J. Alloys Compd. 2023, 947, 169707. [Google Scholar] [CrossRef]
  29. Sathishkumar, A.; Soundararajan, R.; Sivasankaran, S. Effect of direct aging on the microstructure and mechanical behavior of AlSi10Mg alloy: Casting versus selective laser melting. J. Mater. Eng. Perform. 2023, 32, 3215. [Google Scholar] [CrossRef]
  30. Yan, X.; Tang, X. A novel method for early fatigue damage diagnosis in 316 L stainless steel formed by selective laser melting technology. Materials 2023, 16, 3363. [Google Scholar] [CrossRef] [PubMed]
  31. Lum, L.; Xiang, Y.; Liu, P.; Ho, J.Y. Micro/nanostructuring of metal additively manufactured aluminum alloy for enhanced pool boiling of dielectric fluids. Int. J. Heat Mass Tran. 2024, 10, 221. [Google Scholar] [CrossRef]
  32. You, S.; Jiang, C.; Wang, L.; Zhan, K. Effect of CeO2 nanoparticles on the microstructure and properties of the NiCo-CeO2 composite coatings. Vacuum 2022, 196, 196. [Google Scholar] [CrossRef]
  33. Sharma, V.; Kumar, V.; Joshi, R.S. Investigation of rare earth particulate on tribological and mechanical properties of Al-6061 alloy composites for aerospace application. J. Mater. Res. Technol. 2019, 4, 3504. [Google Scholar] [CrossRef]
  34. Kumar, D.; Singh, S.; Angra, S. Synergistic corrosion protection of stir-cast hybrid aluminum composites reinforcing CeO2 and GNPs nano-particulates. Aircr. Eng. Aerosp. Technol. 2023, 95, 1706–1715. [Google Scholar] [CrossRef]
  35. Rajasekaran, S.; Udayashankar, N.K.; Nayak, J. Effect of heat treatment on pitting corrosion resistance of 6061 Al/SiCP composite coated by the cerium oxide film in 3.5 N NaCl solution. Surf. Eng. Appl. Electrochem. 2011, 47, 176. [Google Scholar] [CrossRef]
  36. Peng, G.; Niu, C.; Geng, Y.; Duan, W.; Cao, S. Multi-objective optimization for the forming quality of a CeO2/Al6061 alloy as an aluminum–air battery anode manufactured via selective laser melting. Crystals 2024, 14, 784. [Google Scholar] [CrossRef]
  37. Li, Y.; Duan, W. The effect of hatch spacing on the electrochemistry and discharge performance of a CeO2/Al6061 anode for an Al-air battery via selective laser melting. Crystals 2024, 14, 797. [Google Scholar] [CrossRef]
Figure 1. SEM images of powders used in this work.
Crystals 15 00084 g001aCrystals 15 00084 g001b
Figure 2. The surface appearance of samples exposed to differing laser powers.
Crystals 15 00084 g002
Figure 3. Density of samples in different laser powers.
Crystals 15 00084 g003
Figure 4. Self-corrosion of samples under different laser power.
Crystals 15 00084 g004
Figure 5. OCP of samples under different laser power.
Crystals 15 00084 g005
Figure 6. Polarization curves of samples exposed to different laser powers.
Crystals 15 00084 g006
Figure 7. EIS analysis of samples subjected to varying laser powers.
Crystals 15 00084 g007
Figure 8. Equivalent circuit of alloy under different laser powers.
Crystals 15 00084 g008
Figure 9. Surface morphology after electrochemical test under different laser powers.
Crystals 15 00084 g009aCrystals 15 00084 g009b
Table 1. The laser power utilized in this work.
Laser Power (W)Scan Speed (mm/s)Scan Spacing (mm)Powder Thickness (mm)
260, 280, 300, 320, 34010000.130.03
Table 2. Electrochemical parameters of samples exposed to different laser powers.
Laser PowerElectrochemical Parameters
E(v)Icorr (A/cm2)Rp (Ω∙cm2)
260 W−1.6152.345 × 10−21.8
280 W−1.6322.090 × 10−22.1
300 W−1.6262.258 × 10−22.0
320 W−1.6262.390 × 10−22.0
340 W−1.6242.567 × 10−21.7
Table 3. EIS fitting parameters under different laser power.
Laser Power260 W280 W300 W320 W340 W
L/Ω·cm28.204 × 10−77.827 × 10−205.625 × 10−77.900 × 10−77.352 × 10⁻⁵
Rs/Ω·cm21.1721.4696.687 × 10−11.1741.507
CPE1/F·cm−22.835 × 10−43.540 × 10−45.190 × 10−62.119 × 10−41.716 × 10⁻⁴
R1/Ω·cm25.021 × 10−18.048 × 10−17.892 × 10−16.472 × 10−14.752 × 10−1
CPE2/F·cm−29.729 × 10−12.8672.729 × 10−34.978 × 10−22.613 × 10−4
R2/Ω·cm22.264 × 10−21.939 × 10−14.829 × 10−12.035 × 10−12.641 × 10−1
χ24.818 × 10−46.143 × 10−43.890 × 10−45.298 × 10−45.902 × 10⁻⁴
Disclaimer/Publisher’s Note: The statements, opinions and data contained in all publications are solely those of the individual author(s) and contributor(s) and not of MDPI and/or the editor(s). MDPI and/or the editor(s) disclaim responsibility for any injury to people or property resulting from any ideas, methods, instructions or products referred to in the content.

