Article

The Nature of High-Temperature Peaks of Thermally Stimulated Luminescence in NaCl:Li and KCl:Na Crystals

by
Kuanyshbek Shunkeyev
,
Shynar Sagimbayeva
*,
Adelya Kenzhebayeva
and
Zarina Serikkaliyeva
Scientific Center “Radiation Physics of Materials”, K. Zhubanov Aktobe Regional University, 34 A. Moldagulova Ave., Aktobe 030000, Kazakhstan
*
Author to whom correspondence should be addressed.
Crystals 2025, 15(1), 67; https://doi.org/10.3390/cryst15010067
Submission received: 14 December 2024 / Revised: 3 January 2025 / Accepted: 10 January 2025 / Published: 12 January 2025
(This article belongs to the Section Inorganic Crystalline Materials)

Abstract

:
For the first time, thermally stimulated luminescence spectra in the region of high-temperature peaks (up to 770 K) have been measured in NaCl:Li and KCl:Na single crystals (with impurity cations of small ionic radii) exposed to isodose irradiation by X-rays irradiated uniformly. Comparative analysis of these spectra with the spectra of X-ray and tunnel luminescence of the same crystals showed that the luminescence associated with exciton-like formations near impurity cations dominates in all three cases. The formation mechanisms of such bound excitons during a thermal dissociation of complex radiation defects are considered. Integral light sums of high-temperature TSL in NaCl:Li and KCl:Na crystals are significantly higher than that of a standard LiF:Mg, Ti dosimetric crystal (a TLD-100 luminescent dosimeter).

1. Introduction

In alkali halide crystals (AHCs), it is possible to study two competing processes of the decay of self-trapped excitons (STEs), which determine the efficiency of luminescence (radiative channel) and the formation of crystal lattice defects (nonradiative channel) [1,2,3].
Such studies have been stimulated by the active development of next-generation scintillators and the improvement of classical ones to exploit them in computed and positron emission tomography or for image visualization systems with high spatial resolution [4,5,6,7,8]. In addition, there is an ongoing search for novel dosimetric materials for ionizing radiation monitoring. Note that thermoluminescent dosimeters based on LiF single crystals, which are tissue-equivalent to gamma rays, are successfully used in radiobiology, radiation therapy, and biological protection from neutrons of nuclear fission reactors [9,10,11,12,13]. In LiF-based dosimeters, the maxima of the main dosimetric peaks of thermally stimulated luminescence (TSL) are located at 473 K (TLD-100) and 490 K (TLD-700 H) [7,8,9,14,15,16].
Moreover, widespread application of modern functional materials (cryodetectors, nanotubes of various shapes [17,18,19,20]) stimulates fundamental studies of materials under conditions of deliberate lattice symmetry reduction induced by local [21,22,23], uniaxial [24,25,26,27], or hydrostatic deformation [28,29,30].
In pure NaCl single crystals, the luminescence of STEs at 4.2 K consists of two bands peaked at 5.35 eV (σ-polarization, singlet emission) and 3.36 eV (π-polarization, triplet emission), both of which undergo thermal quenching—the luminescence intensity decreases by about two orders of magnitude with a temperature rise from 4.2 to 100 K [31,32].
In pure KCl crystals, the STE luminescence at 4.2 K has only a triplet component with a maximum at 2.3 eV, which is quenched already by 40 K [31,32]. The luminescence of exciton-like formations (ELFs, bound excitons), localized near single anion vacancies, divacancies, or vacancy quartets, is also observed in KCl [21,22,23,33,34,35]. In KCl:Na crystals, the luminescence of bound excitons localized near single (2.8 eV) or paired (3.1 eV) sodium impurity ions has been established [22].
Despite the extensive study of NaCl and KCl crystals [36,37,38,39,40,41,42,43,44,45,46,47], the spectra of high-temperature TSL peaks in the 300–800 K range have not been recorded yet. Additionally, the influence of light impurity cations (Li+ and Na+) on radiative relaxation and radiation-induced defect formation during the decay of impurity-associated ELFs remains poorly understood.
In this study, for the first time, spectroscopic investigations of high-temperature TSL peaks in NaCl:Li and KCl:Na crystals were conducted to determine their luminescent nature during the formation of impurity-associated ELFs (Li and Na). Temperature dependencies of the jump frequencies of cationic and anionic vacancies in pure and doped NaCl and KCl crystals were calculated, and the contribution of vacancy diffusion to the appearance of TSL peaks in various temperature ranges was analyzed.

2. Materials and Methods

NaCl, NaCl:Li, KCl, and KCl:Na single crystals were grown at the Institute of Physics, Tartu University, Estonia, using the Stockbarger method in evacuated quartz ampoules [21,22,23]. The crystal growth technology [36] included comprehensive raw material purification: drying the powder-form raw material, treating the melt in a halogen flow, and multiple zone refining. After completing the purification procedures, the quartz ampoule was evacuated and sealed, and crystal growth was performed by the Stockbarger method, which involved lowering the quartz ampoule from the hot zone to the cold zone at a rate of 0.1–0.2 mm/hour. The spectral registration was performed with sample plates of 6 × 7 mm2 and thickness of 1.0–1.3 mm.
NaCl:Li crystals were grown using purified NaCl raw material with additives of LiCl powders, which had been pre-dried in vacuum prior to doping at concentrations ranging from 500 to 2000 ppm. Considering the incorporation coefficient, the concentration of lithium ions in the grown NaCl:Li crystals was within 100–400 ppm. The actual concentration of sodium ions in KCl:Na single crystals was estimated to be 1000 ppm. The evaluated impurity ion concentrations in NaCl:Li and KCl:Na are compatible with the data obtained from flame photometric analysis.
Right before experiments, the doped crystals under study were additionally quenched in a Programix TX 25 electric muffle furnace (Ugin-Dentaire) to ensure an initial homogeneous distribution of small-radius impurity cations in the lattice, which is lost with the storage duration of the grown single crystals (for details, see [21,22,23]). The crystals were heated at a rate of 15 °C/min to a prescribed temperature (650–700 °C), kept at this temperature for 15 min, and then rapidly cooled to room temperature on a quartz substrate (in air).
Radiation defects were created at room temperature by bremsstrahlung X-rays from the RUP-120 setup (W-anticathode, 3 mA, 100 kV) at an exposure dose of 10 mGy. Unlike characteristic X-rays, bremsstrahlung causes a uniform coloration (defect concentration) throughout the entire thickness of the crystals (1.0–1.3 mm).
In AHCs, the primary radiation defects are F-centers and H-centers [32]. The F-center (an anion vacancy with a single trapped electron,  υ a + e ) derives its name from the German word Farbzentrum (color center). The concentration of F-centers determines the coloration of irradiated crystals, which remains stable up to 400 K. The H-center (an interstitial halogen atom localized at a single anion lattice site,  X 2 a 0 ) is named after Hopkins University and represents a thermally unstable radiation defect, with a decomposition temperature around 50 K. As a result, the associative mechanism of halogen interaction becomes activated, leading to the formation of more stable radiation defects,  V 2 = X 3 aca -centers. Consequently, above room temperature, the complementary pairs of  V 2 = X 3 aca - and F-centers remain the only stable radiation defects in AHCs. During the recombination of products of  V 2 = X 3 aca - and F-centers’ thermal dissociation, TSL signals are expected, which will be discussed in the Results and Discussion section.
High-temperature TSL was recorded at a constant heating rate of β = 5.0 K/s in a temperature range of 300–850 K using a Harshaw model 3500 thermoluminescent dosimetric setup with WinREMS software (S-26732.8.2.4 version).
During the registration of high-temperature TSL spectra, heating at a constant rate (β = 5.0 K/s) was conducted using a special quartz furnace. The spectra of the TSL, XRL, and TL were scanned in the range of 1.8–6.0 eV using a high-aperture MSD-2 monochromator, a H 8259 photomultiplier tube from Hamamatsu, and a special SpectraScan program.
When comparing the TSL light yield of the crystals under study, their sizes and exposure to X-ray irradiation were strictly taken into account. The integral light sum (S), characterized by the area under the TSL curve (integral) in the specified temperature range, served as a measure of TSL efficiency. Standard LiF:Mg, Ti dosimetric crystals (TLD-100) were used in order to evaluate the relative efficiency of high-temperature TSL.

3. Results and Discussion

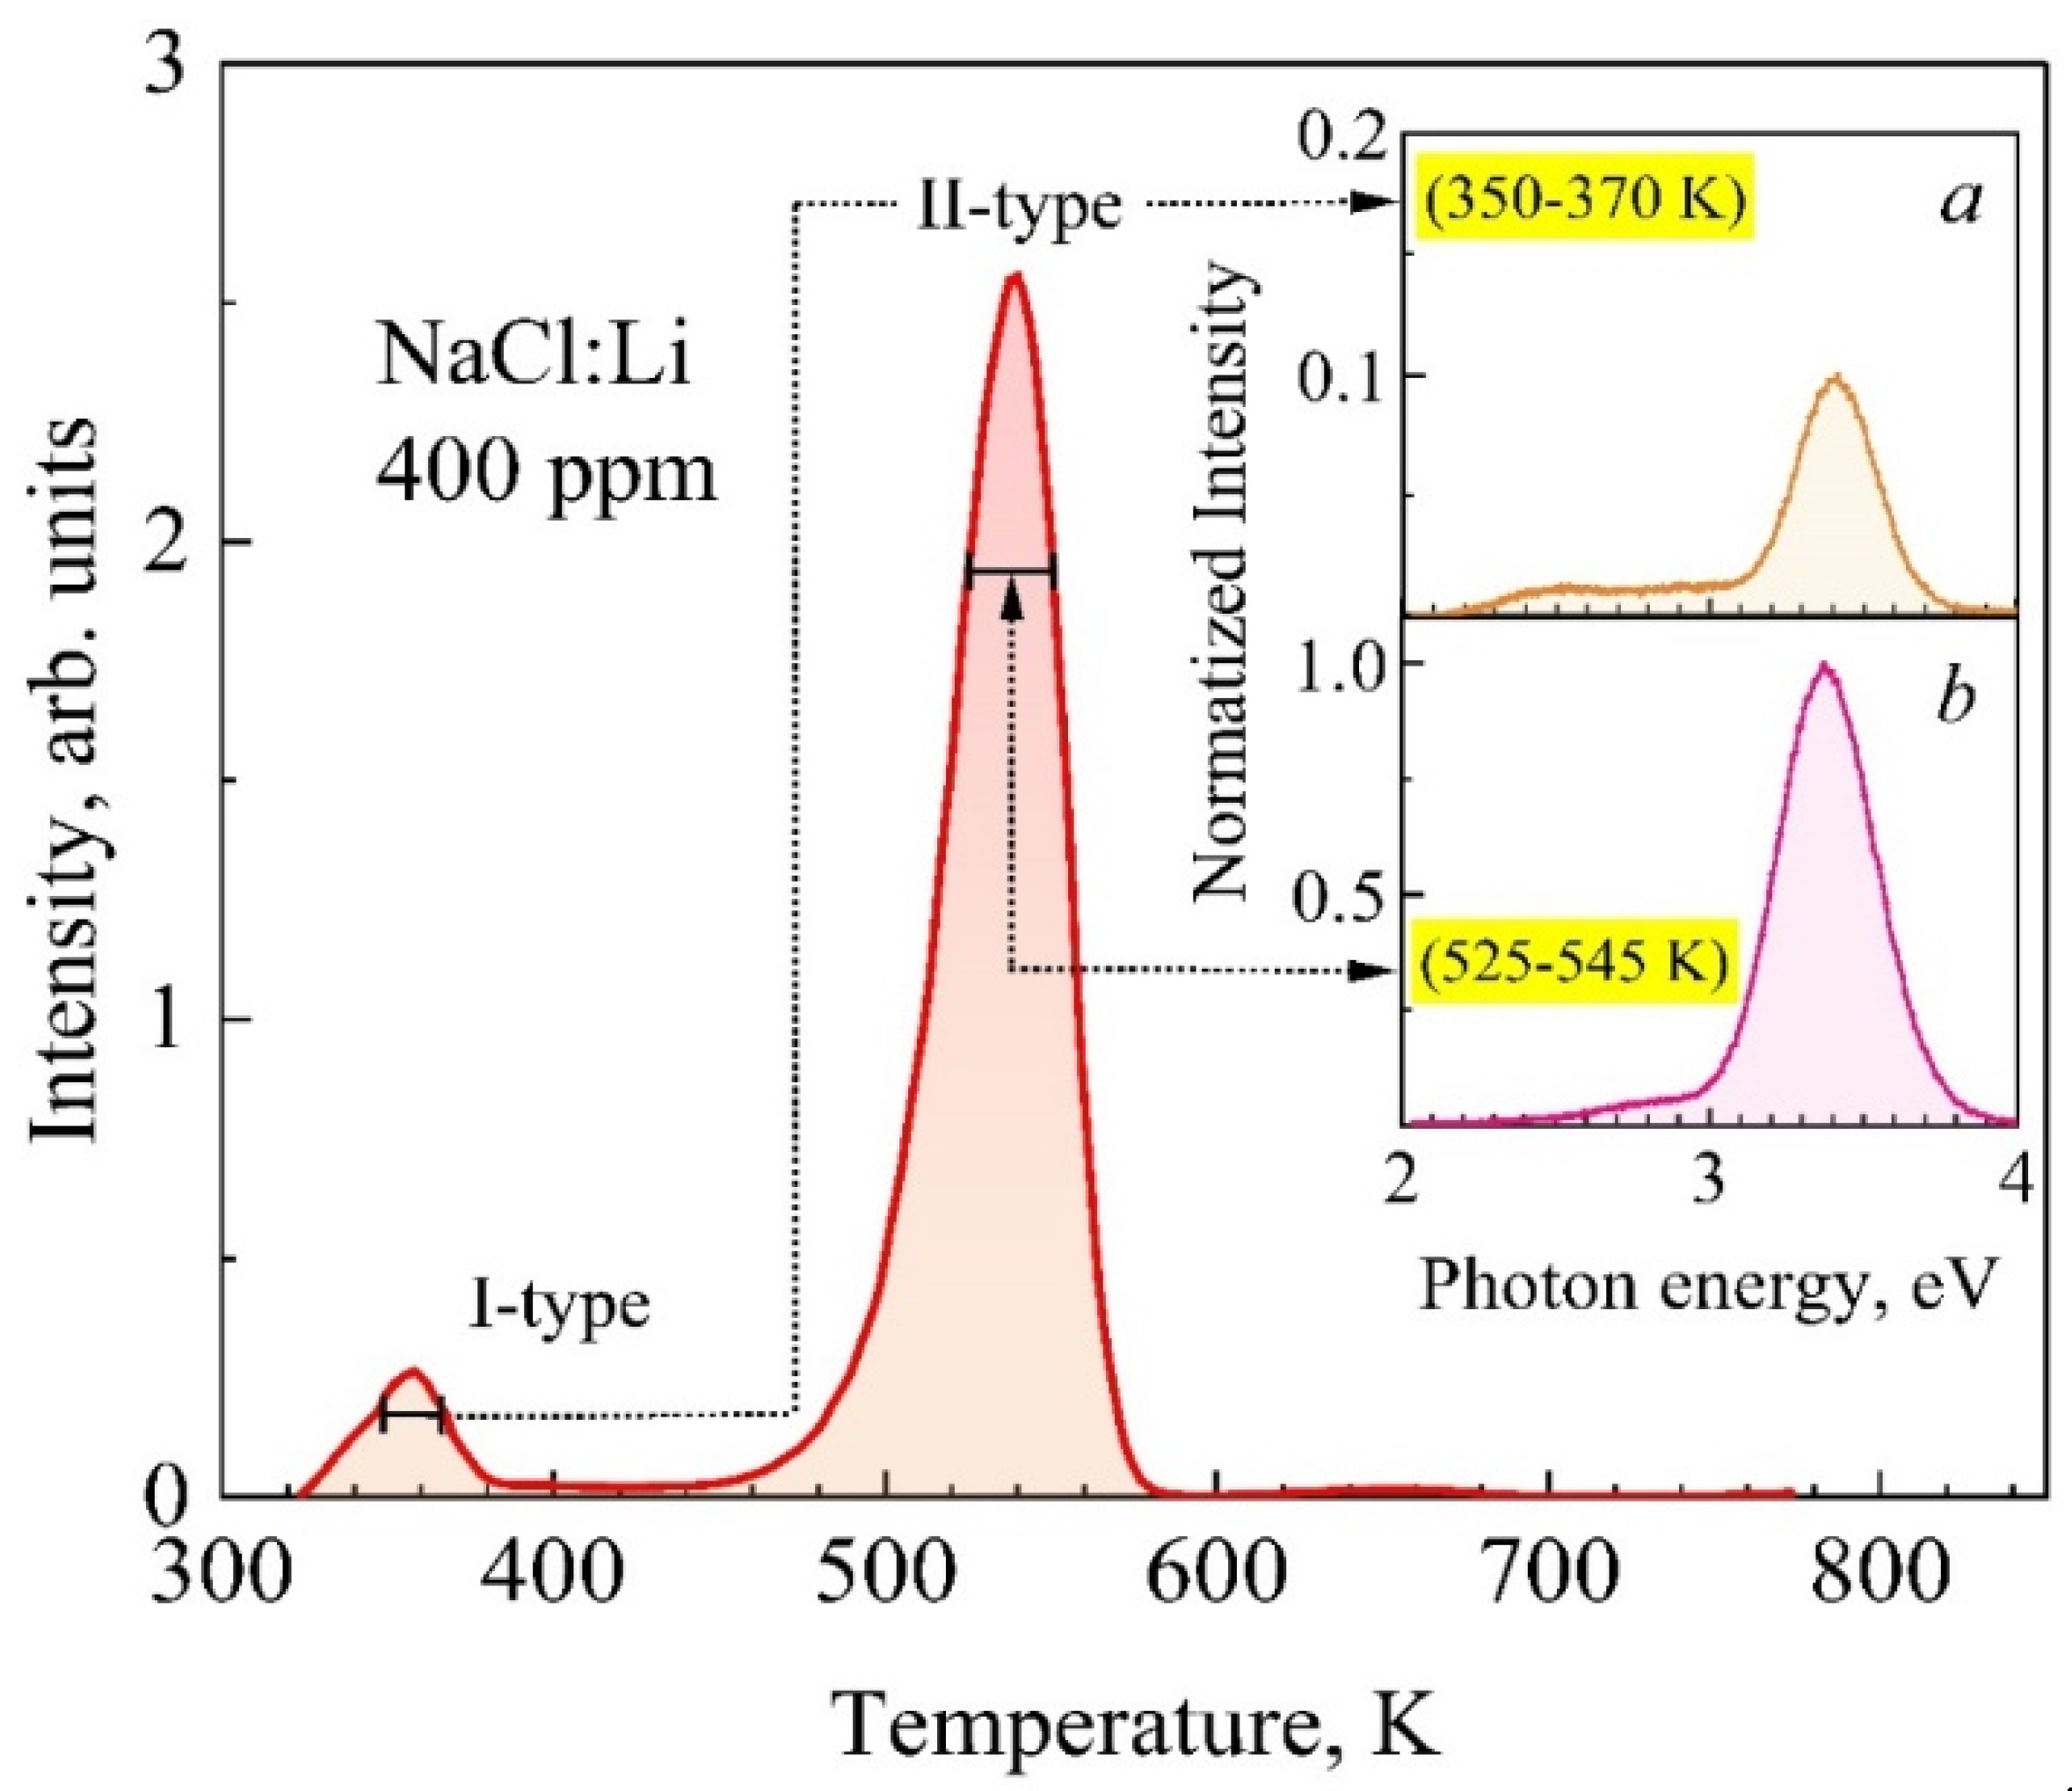
3.1. High-Temperature TSL of NaCl and NaCl:Li Crystals

TSL is an example of the recombination luminescence of electron-hole pairs (e-h), which emerges upon heating of an irradiated crystal due to the sequential release of charge carriers from traps/defects and their radiative recombination.
At present, the delocalization temperatures of self-strapped holes (VK-center, a di-halide molecule  X 2  [37,38]) have been established for all AHCs [2,21,22,23,26,39]. Their mobility and interaction with other radiation defects result in recombination luminescence. Analysis of the experimental data [2,21,22,23,26,39,40,41] shows that a decrease of the delocalization temperature of VK-centers (indicated in brackets) is attributable to a decrease of the ionic radii of cations in the series NaCl (168 K) → KCl (208 K) → RbCl (240 K). Low-temperature TSL (85 K → 300 K) typically arises from the recombination of thermally delocalized (becoming mobile) hole defects (the so-called VK-family) with an electron-type defect, the F-center [2,21,22,23,26,39,40,41]. The VK-family includes holes localized in the field of a cation vacancy— V F = υ c + e + ; in the field of an isoelectronic light single cation (e.g., Na+)— V KA = e + ( Na + ) ; and in the field of paired cations— V KAA = e + ( Na + ,   Na + ). The structure of the  V F -center is assumed to be analogous to an anti-F-center ( υ a + e). The indices A in the designations VKA and VKAA refer to single and paired light cations (e.g., Na+ or Li+).
Above room temperature, stable radiation defects in AHCs, as complementary pairs, are  V 2 = ( X 3 ) aca  and F-centers [2], the thermal annealing of which is accompanied by TSL at 365–420 K [32,33,42,43,44,45]. Moreover, the higher the ratio of anion/cation radii, the larger is the shift of the corresponding TSL peak toward low temperatures [2,21,22,23,46,47,48,49,50,51]: in KI crystals, the TSL peak is recorded at 365–370 K; in KBr, at 375–385 K; in KCl, at 390–400 K; and in NaCl, at 400–420 K. The shift of the TSL peak maximum depends on many factors, but the most significant ones are temperature, irradiation dose, concentration of recombining pairs of radiation defects, and the heating rate of the irradiated crystal.
According to the literature [42], thermal dissociation of V2-centers in KBr crystals generates mobile VF- and H-centers, which are positively charged with respect to the lattice and with a high probability recombine with F-centers, thus forming TSL peaks at 360–420 K—a common mechanism for all AHCs.
Figure 1 depicts the integral TSL curves of a pure NaCl crystal (inset a), as well as NaCl:Li (100 ppm, inset b) and NaCl:Li (400 ppm, main graph). In NaCl, the peak at 395 K is dominant, while a weaker multicomponent TSL at 520–620 K is seen as well. All these TSL peaks contribute to the integral light sum S (integral of the TSL signal over intensity in the temperature range from 300 to 750 K). In future analysis, we will classify TSL into type-I (380–400 K) and type-II (520–620 K) for convenience.
High-temperature TSL peaks (type-II) are activated by lithium impurities doped into the NaCl lattice. As the lithium concentration increases in NaCl:Li crystals (100 ppm), a previously unobserved TSL peak at 552 K becomes dominant (Figure 1b). With a higher lithium concentration in NaCl:Li (400 ppm), the intensity of the type-II TSL peak at 570 K significantly increases (Figure 1).
Thus, for NaCl:Li crystals, a proportional dependence of the intensity of type-II TSL peaks on the lithium ion concentration has been experimentally established, as indicated by the area under the TSL curve presented in Table 1.
Table 1 compares the integral light sum S values of TSL for the three crystals shown in Figure 1: Sa in NaCl, adopted as a unit of comparison and with the dominance of type-I TSL; Sb in NaCl:Li (100 ppm), where the peak at 525 (type-II) dominates at 525 K; and Sc in NaCl:Li (400 ppm), with a significant role of the type-II peak at 575 K. It clearly follows from Table 1 that the ratio of the S value in the doped crystals to Sa in the pure NaCl, Sn/Sa, increases drastically as the Li+ concentration reaches 100 ppm (Sb/Sa = 7.2) and 400 ppm (Sc/Sa = 252). Thus, the Li+ impurity ions cause a sharp increase of the type-II TSL at 570 K and a certain increase of the type-I TSL peak at 390 K, which correlates with the literature data on enhanced defect creation efficiency in NaCl:Li [32,36,52].
Table 1 also presents the activation energies ( E a ) of the TSL peaks (type-I and type-II) for NaCl, NaCl:Li (100 ppm), and NaCl:Li (400 ppm) crystals. The TSL peaks of type-I have a lower activation energy ( E a  = 0.71–0.87 eV) than the high-temperature TSL peaks of type-II ( E a  = 1.1–1.3 eV).  E a  values were calculated using parameters of the measured TSL curves according to the Lushchik formula (see, e.g., [32,47] and references therein):
E a = 2   k B T max 2 Δ
where  k B  is the Boltzmann constant, Tmax is the maximum of the TSL peak, and Δ is its halfwidth (FWHM).

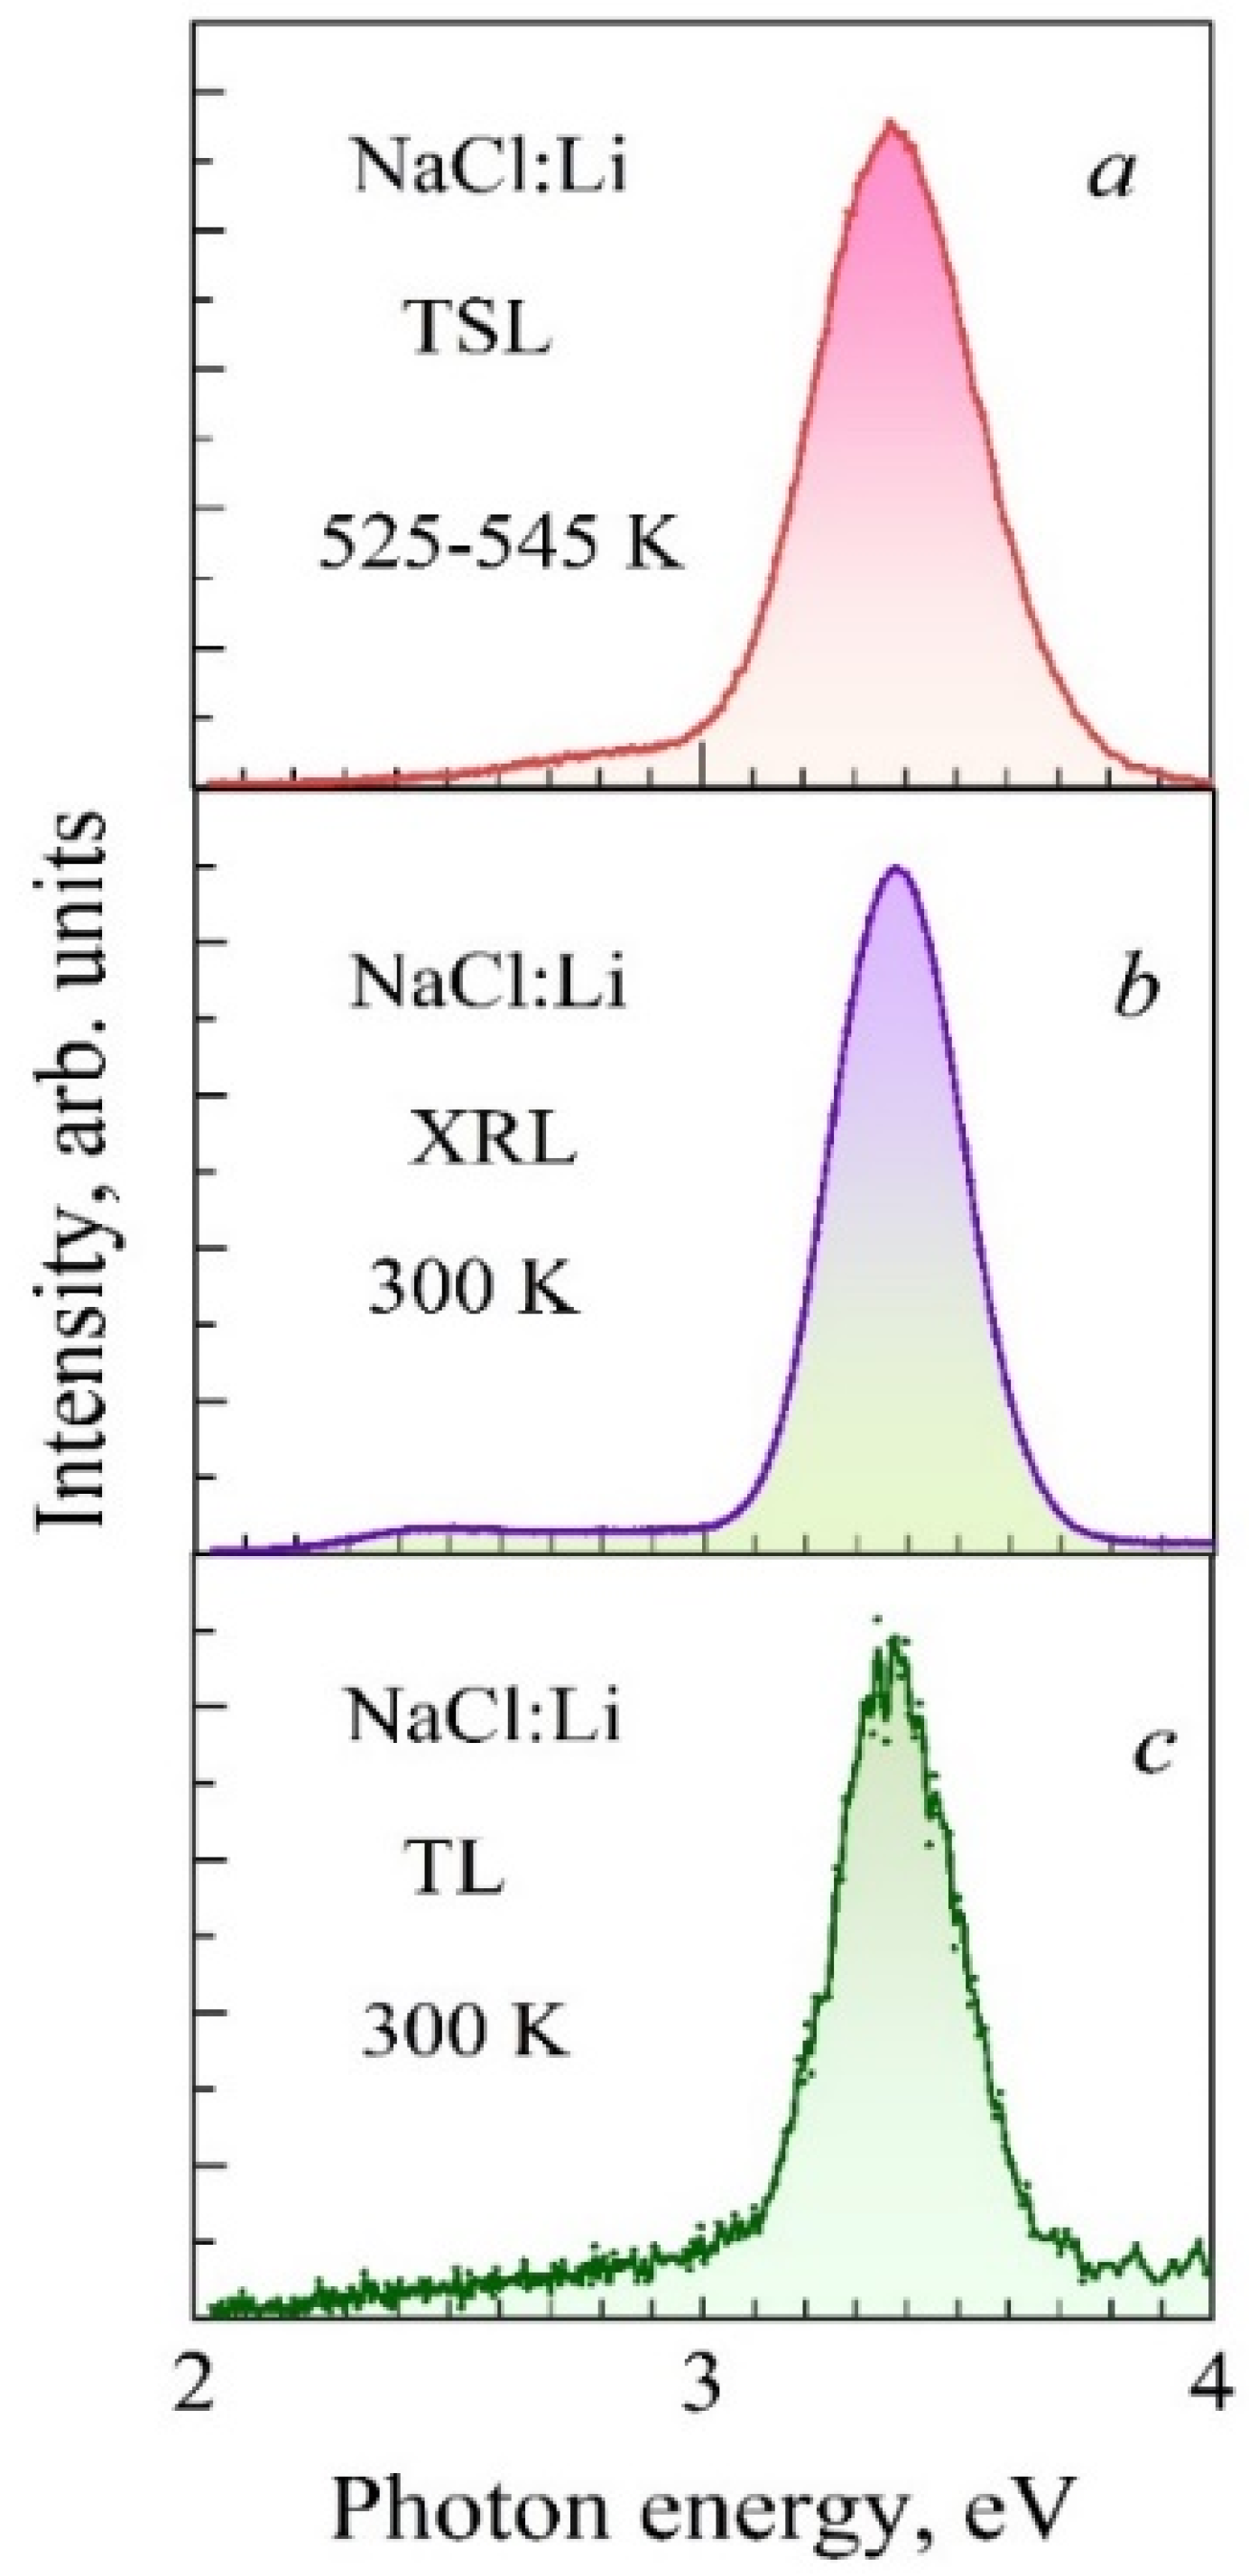
3.2. Spectra of High-Temperature TSL of NaCl:Li Crystals

Figure 2 shows the emission spectra measured in the region of the main TSL peaks of the irradiated NaCl:Li (400 ppm) crystal. The spectra in the 2–4 eV region were scanned at a rate of 50 nm/s in 6 s, which corresponds to the changes in sample temperature by about 10 K. Thus, it was possible to measure several emission spectra during the peak passage.
The spectra of the high-temperature TSL of a NaCl:Li (400 ppm) crystal contain a dominant band peaked at 3.38 eV with ∆ = 0.38–0.4 eV (Figure 2, insets a and b). As mentioned above, the TSL light sum is clearly dependent on the concentration of the lithium impurity ions.
According to [32,46,47,48,53,54], the destruction of trihalide V2-centers in NaCl crystals occurs at 380–400 K, and the dissociation products are mobile holes (e+) and interstitial halogen atoms ( i a 0 , H-centers):
V 2 + T , K ( V 2 ) * e + υ c i a 0 e +
The resulting mobile defects may interact with still stable (immobile) electronic defects, the F-centers. Upon recombination of the H- and F-centers, a non-radiative restoration of the perfect crystal lattice takes place,  i a 0 + υ a + e R .
On the other hand, the mobile holes with a path length of up to 1000a (a is the lattice constant) can become localized near Li+ impurity ions ( e + e S + L i + ) or interact with the F-centers. The latter process might result in the so-called α-luminescence (emission associated with the bound exciton near an anion vacancy) with a maximum at 2.95 eV [32,52]:
e + + υ a + e e S 0 ( υ a + ) α
However, such luminescence was not recorded in the TSL spectra, probably due to temperature quenching.
In NaCl:Li crystals, the thermal destruction (ionization) of F-centers occurs simultaneously with that of V2-centers, at 380–400 K:
F + T , K ( υ a + e ) * υ a + e e
The released electrons can recombine with  e S + L i +  via the state of ELFs (bound excitons). Recently, such processes have been considered in KCl:Na [21,22,23].
Therefore, the dominant ~3.4 eV emission in the TCL spectra of the NaCl:Li (400 ppm) crystal can be explained by the radiative decay of the near-lithium ELFs:
e + e S + L i + e SL 0 L i + h ν = 3.38   eV
where  e SL 0 L i +  indicates a bound exciton near a lithium impurity ion.
Note that the e-h pairs are predominantly formed during the crystal irradiation by X-rays, and their recombination in the regions of local lattice deformation nearby light impurity cations (e.g., Na in KCl) can create near-impurity ELFs [21,22,23]. Therefore, the TL and XRL spectra in the same NaCl:Li (400 ppm) crystals have been measured, in addition to the TSL spectra.
Figure 3 demonstrates the spectrum of type-II TSL (a, peak at 535 K) as well as the spectra of XRL (b) and TL (c) measured at 300 K in NaCl:Li (400 ppm). In all three cases, the luminescence maximum is located at ~3.4 eV, and some distinction in ∆ (0.3 eV for XRL and TL, 0.4 eV for TSL) is most likely due to different registration temperatures and differences in electron-phonon interaction.
Thus, the coinciding spectra (maxima at 3.4 eV) of the high-temperature TSL, XRL, and TL in the NaCl:Li crystal confirm the involvement of the emission with the same origin—the radiative relaxation of ELFs created during e-h recombination (recombinational creation of bound excitons,  e SL 0 L i +  in the field of  L i +  impurity ions.

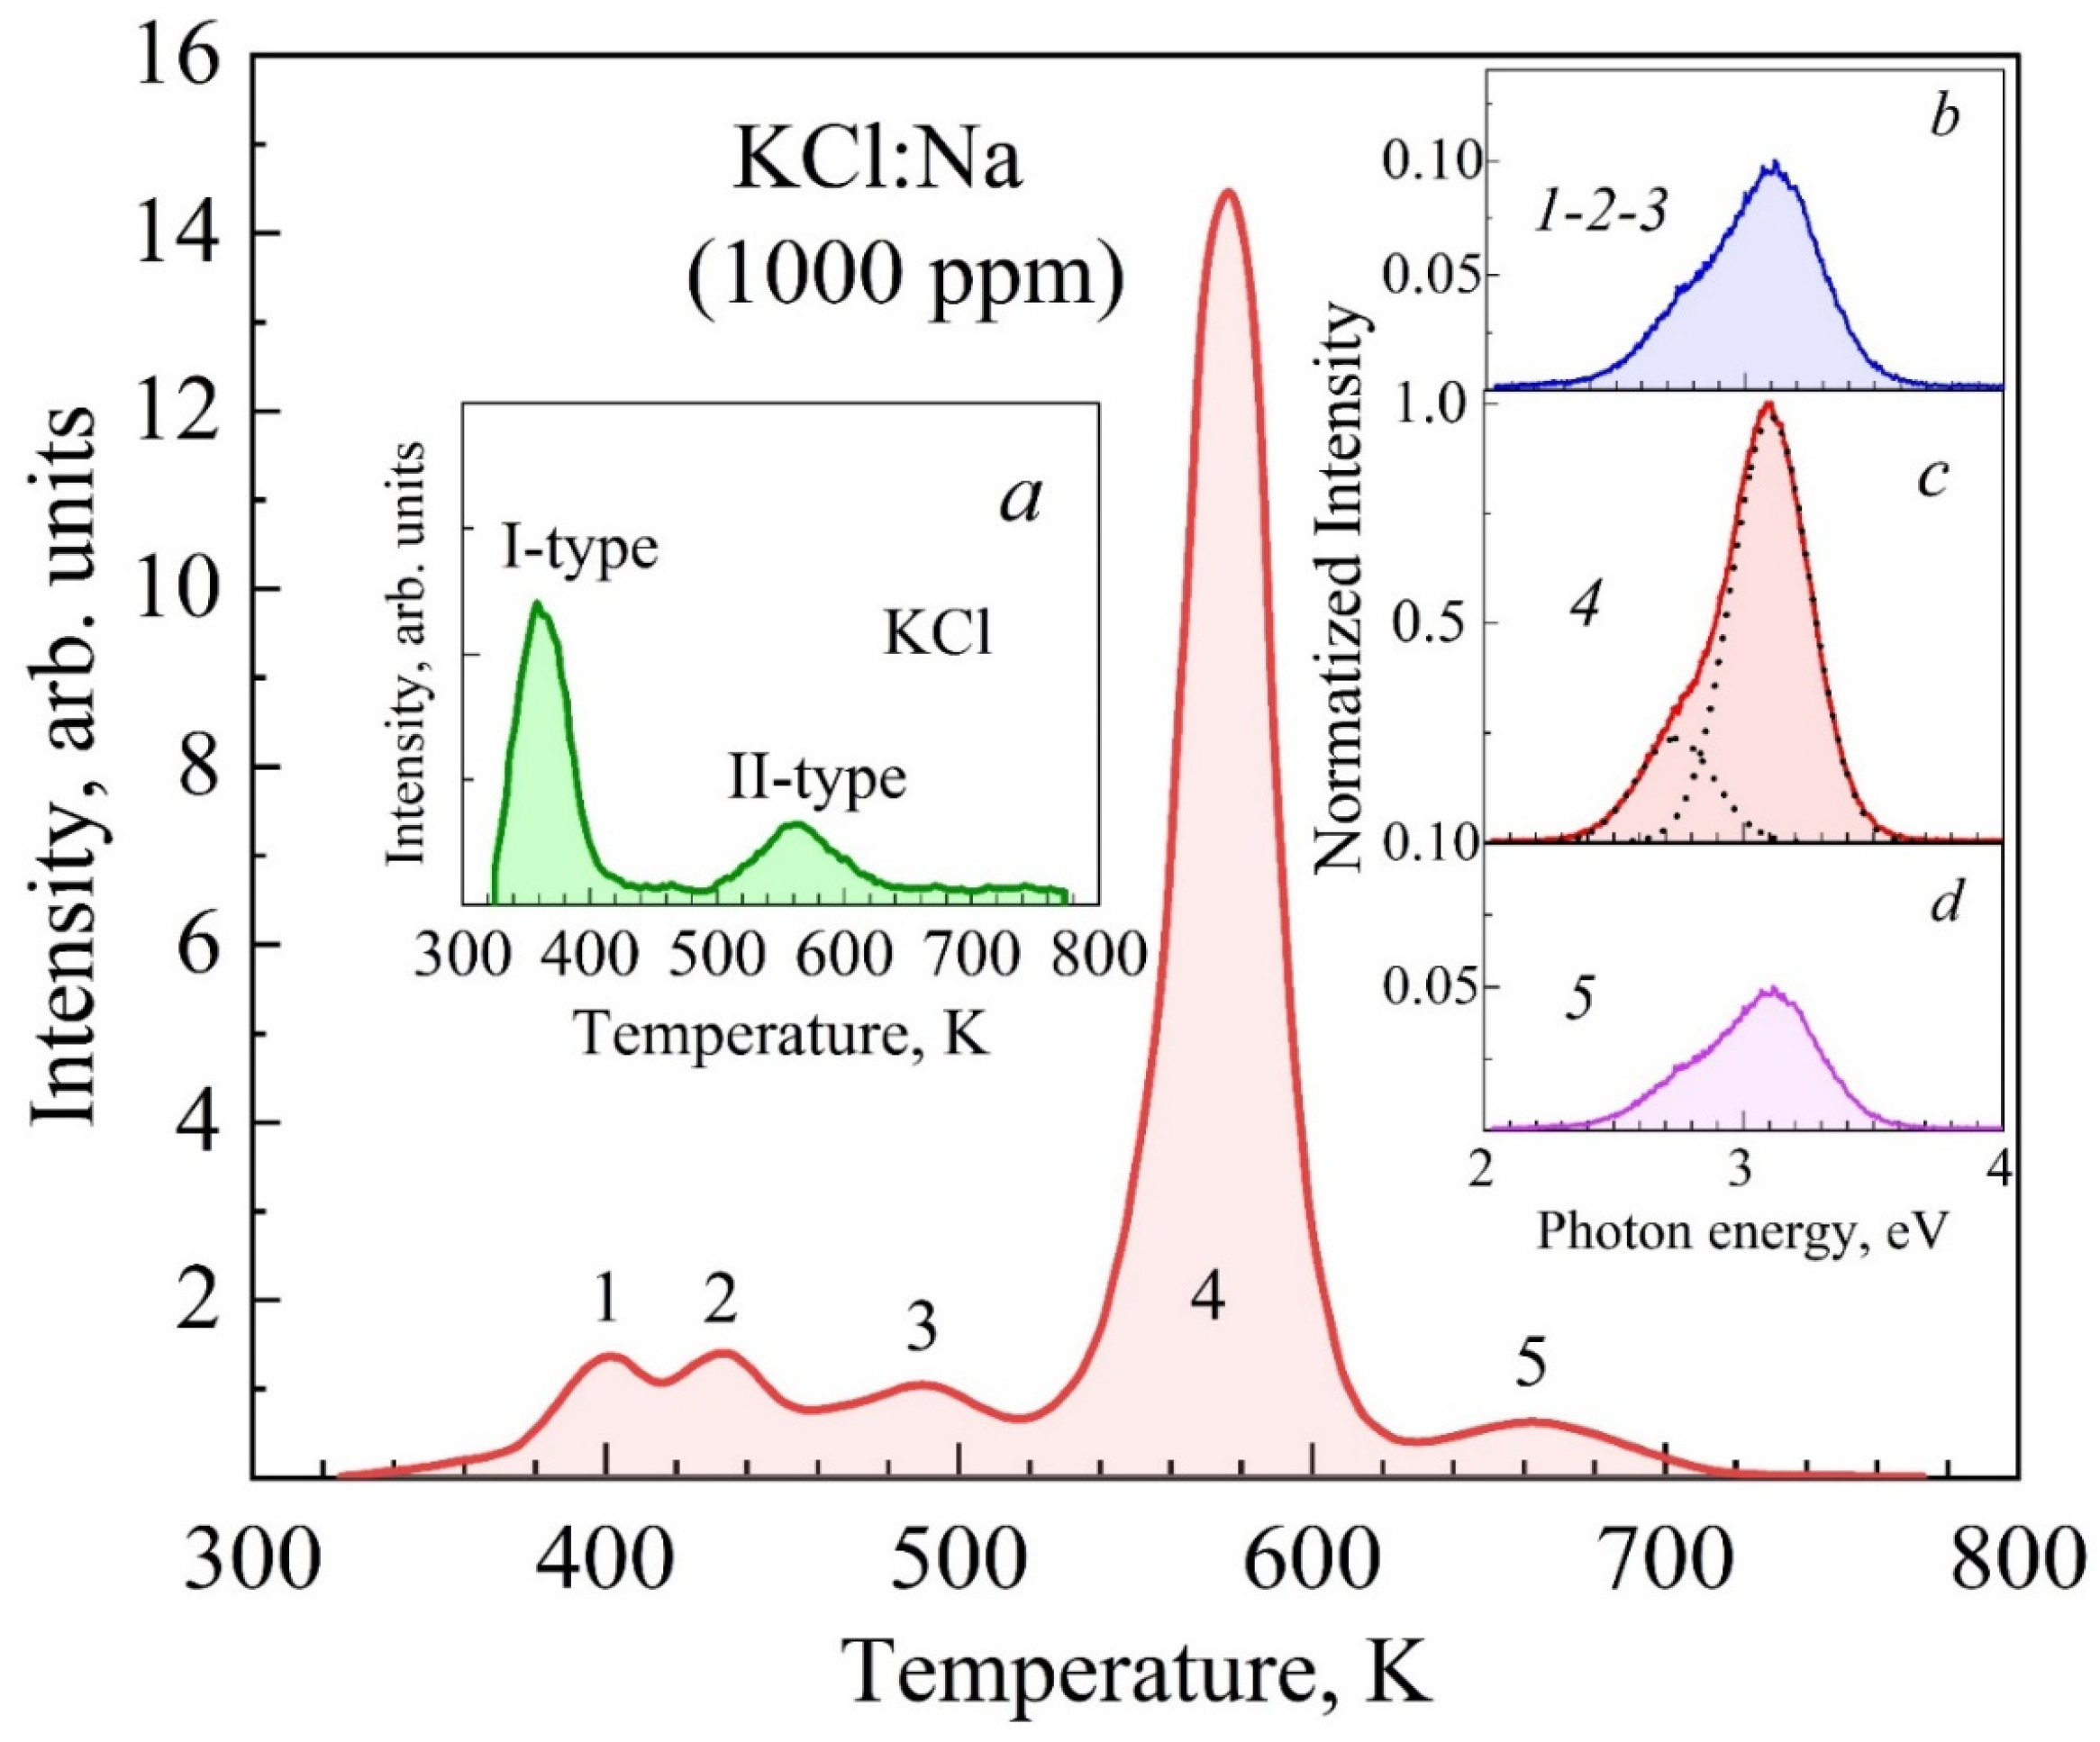
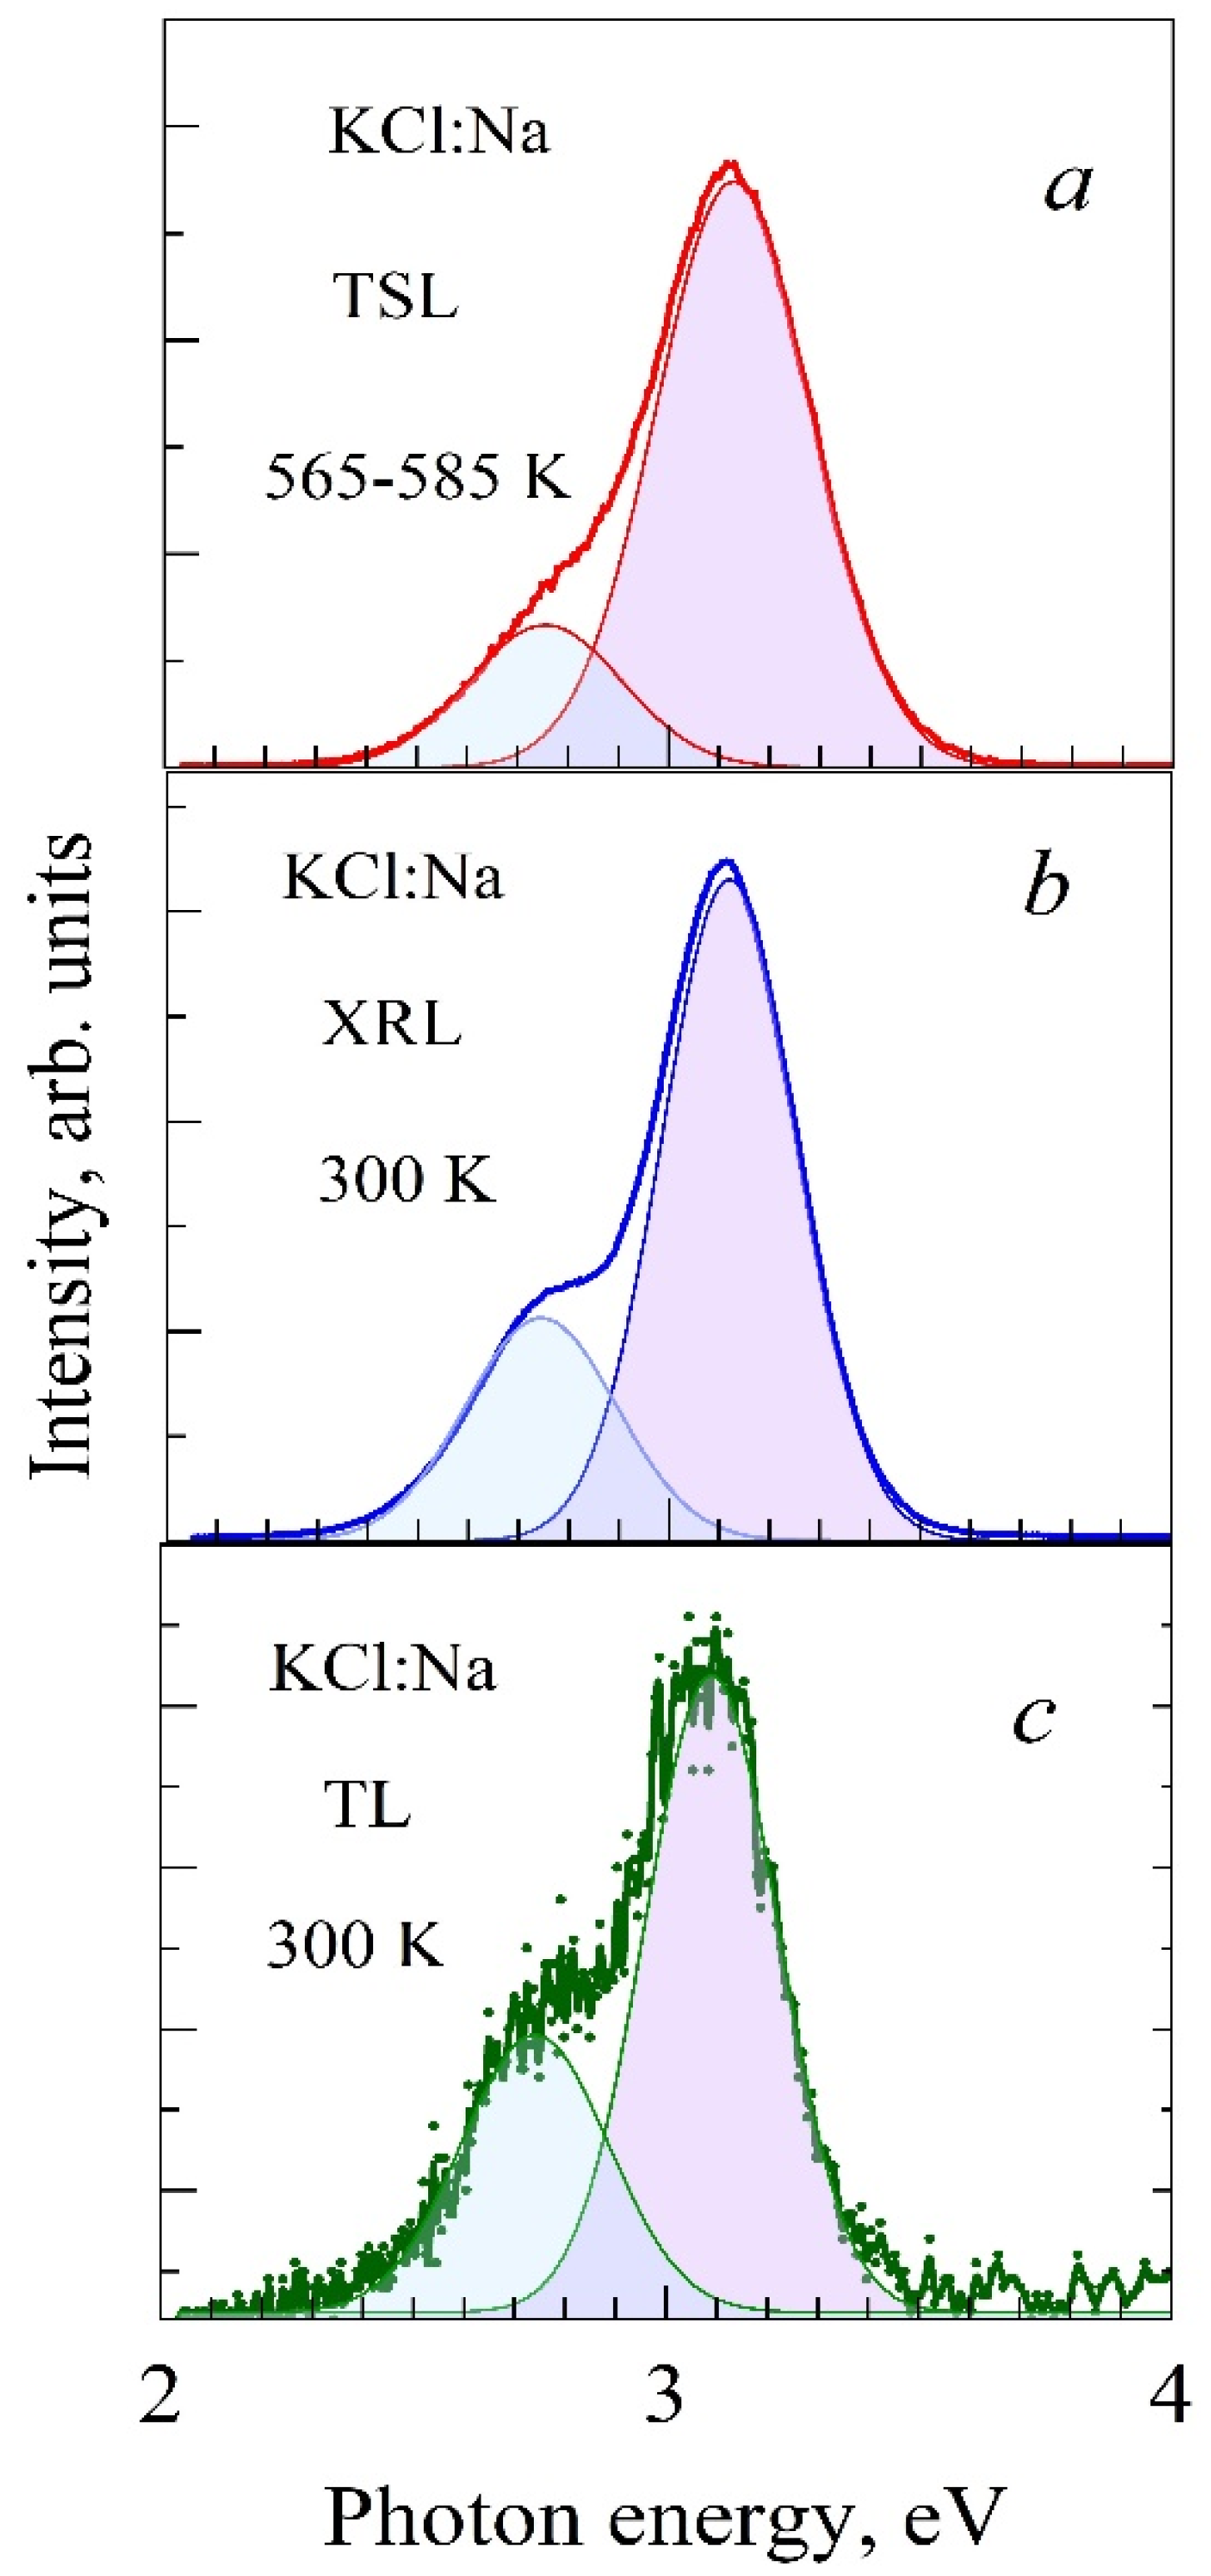
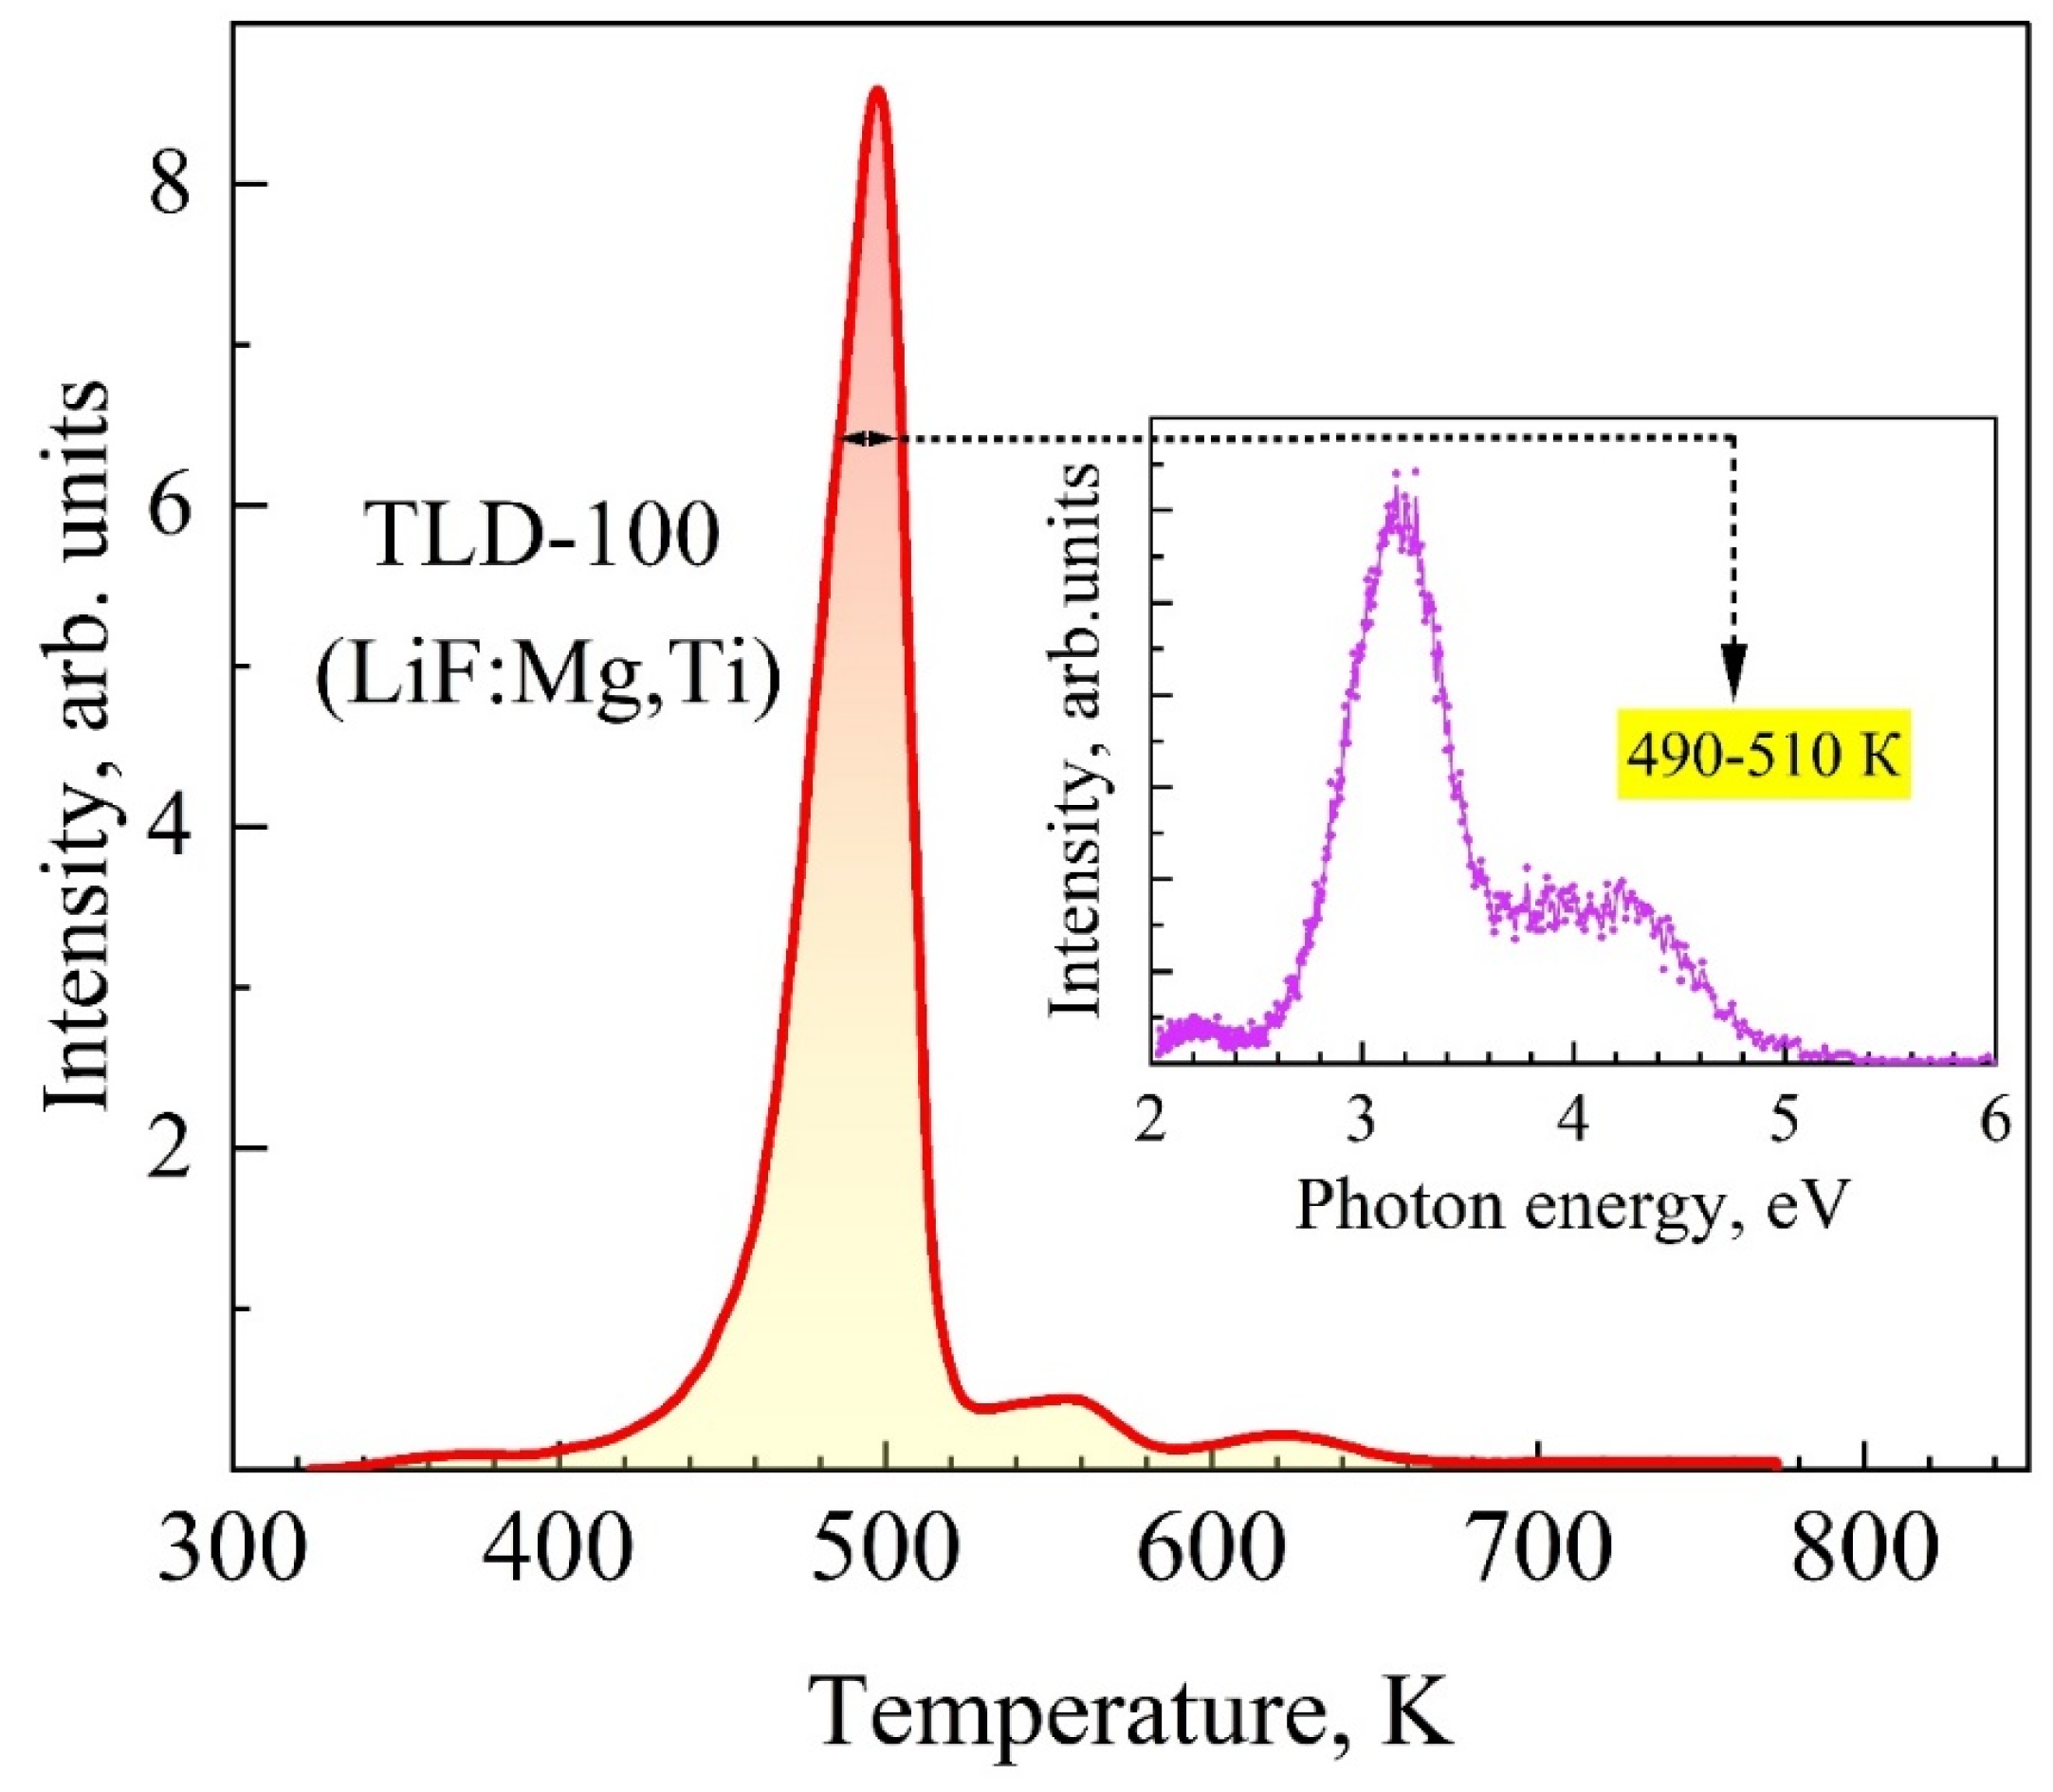
3.3. Spectra of High-Temperature TSL of KCl:Na and LiF:Mg, Ti (TLD-100) Crystals

The situation is rather similar in KCl:Na crystals—luminescence bands peaking at 2.8 eV and 3.1 eV dominate in XRL, TL, and the spectra of type-II TSL (see Figure 4). According to Figure 4, an intense type-I TSL (the peak at 365 K) and a relatively weak peak at 570 K (type-II TSL) are typical of a pure KCl crystal (see Figure 4a), while several clearly distinguishable TSL peaks at 400 K (labeled by number 1 in the figure), 430 K (2), 480 K (3), 570 K (4), and 660 K (5) are registered in a highly doped KCl:Na (1000 ppm) crystal. The presented TSL curves were recorded under identical conditions and after the same X-ray radiation dose as for NaCl:Li crystals (Figure 1 and Table 1).
The values of integral light sum S and activation energies  E a  for the TSL peaks of KCl and KCl:Na (1000 ppm) crystals are collected in Table 2. The light sums, Sa for KCl and Sb KCl:Na (1000 ppm), were calculated for a temperature range from 300 K to 750 K. A sharp increase in the S value clearly correlates with the presence of impurity cations in the KCl:Na (1000 ppm) crystal.
Table 2 also presents the activation energies  E a  of TSL peaks in KCl and KCl:Na, calculated using the Lushchik formula. The values of  E a  = 0.71–1.5 eV for type-I TSL are lower than that for type-II TSL peaks,  E a  = 1.6–2.4 eV. The presence of Na+ impurity ions in the KCl lattice causes a sharp increase of the defect formation efficiency (i.e., rise of the concentration of radiation defects), which manifests itself as an enhancement of the integral TSL recorded during heating of the irradiated crystal.
A clear analogy with NaCl:Li crystals can also be traced when analyzing the TSL spectra of KCl:Na (1000 ppm) crystals, presented in the insets of Figure 4. In the region of the dominant TSL peak at 575 K, the TSL spectra consist of distinct emission bands with maxima at 3.1 eV and 2.8 eV and Δ estimated as 0.38 eV and 0.36 eV, respectively, for Gaussian components of decomposition. In Figure 5, this TSL spectrum (part a) is compared with the corresponding XRL (b) and TL (c) spectra of the KCl:Na crystal (1000 ppm).
Again, the luminescence spectra for all three cases are very similar: the band maxima are located at 3.1 eV and 2.8 eV, and the differences in the Δ values (for the TSL peak, Δ1(3.1 eV) = 0.38 eV and Δ2(2.8 eV) = 0.36 eV, while in the XRL and TL spectra, Δ1 = 0.32 eV and Δ2 = 0.34 eV are again connected with different registration temperatures (the same as for NaCl:Li; see Figure 3). It should be noted that due to the low intensity of the TSL peaks at 400 K (1), 430 K (2), 490 K (3), and 660 K (5), their spectra were measured with lower accuracy. However, the overall shape of the emission bands at these peaks remains consistent.
In KCl:Na crystals, the identical spectral composition of TSL in the temperature range of 400–660 K with the XRL and TL spectra indicates that they share the same luminescence nature with maxima at 3.1 eV and 2.8 eV. A similar pattern was observed in NaCl:Li crystals, where an emission band with a maximum at 3.4 eV was detected across all TSL, XRL, and TL spectra (see Figure 3).
Extensive experimental data (including concentration, temperature, and deformation dependencies) [21,22,23] have established that in KCl:Na crystals, the luminescence spectrum with maxima at 3.1 eV and 2.8 eV arises from the radiative relaxation of ELF near the light sodium ion (with a radius smaller than that of potassium). These ELFs are formed through the recombination assembly of e-h pairs created by X-ray irradiation.
The formation of such ELFs in NaCl:Li and KCl:Na crystals during the registration of TSL peaks’ spectra is facilitated by the flow of mobile holes released during the thermal dissociation of polyhalide defects and their subsequent recombination with electrons near impurity ions (Li+, Na+).
Basically, the dominant type-II TSL peaks of NaCl:Li and KCl:Na crystals, the light sum of which increases with impurity concentration, can act as dosimetric peaks in thermoluminescent detectors. Therefore, it is interesting to compare the integral light sum S values in these with a widely used LiF:Mg, Ti crystal (known as a TLD-100 thermoluminescent dosimeter). TSL curves for these three crystals were measured under identical conditions (and the same irradiation doses of 10 mGy). For a commercial TLD-100 dosimeter, the light sum of TSL at 320–700 K equals S = 36, while the relevant values for NaCl:Li and KCl:Na crystals (see Table 1 and Table 2) are significantly higher, Sb = 720 for KCl:Na (1000 ppm) and Sb = 580 for NaCl:Li (400 ppm).
The integral TSL curve used to calculate the S value of LiF:Mg, Ti (TLD-100) is shown in Figure 6. The emission spectrum in the region of the dosimetric TSL peak (see insert) consists of several bands. The precise origin of the dominant luminesnce at 3.2 eV is still unclear.

3.4. Temperature Dependence of Vacancy Frequency Jumps in NaCl and KCl Crystals

Analyzing the nature of high-temperature TSL peaks, it is necessary to consider both the direct recombination of complementary radiation defects and the jump migration (hopping diffusion) of anion and cation vacancies, which stimulates the destruction of complex polyhalide radiation defects in NaCl and KCl single crystals [2,21,22,23,42]. Therefore, we have calculated the temperature dependence of the jump frequency for cationic  ν υ c  and anionic  ν υ a +  vacancies in the NaCl and KCl crystal lattices, according to the formulae from paper [55]:
ν υ c = ν 0 exp   D υ c k B   exp E a υ c k B T
ν υ a + = ν 0 exp   D υ a + k B exp E a υ a + k B T
where D υ c , D υ a +  are the diffusional migration entropies of cation and anion vacancies, respectively;  E a υ c   E a υ a +  are the activation energies of vacancies’ migration;  ν 0  is the Debye frequency of ion oscillations; and  k B  is the Boltzmann constant.
Table 3 summarizes the thermoactivation parameters defined for NaCl and KCl in [55], which are required for the calculations.
Figure 7 shows the temperature dependence of the vacancy jumps frequency calculated by us for NaCl and KCl crystals. The temperature at which the vacancy performs only one jump per second is taken as the beginning of mobility, ν = 1 s−1, and negative values on the ordinate axis characterize the temperature region, where the vacancy remains immobile (localized). The onset of mobility (ν = 1) for  υ c  and  υ a +  takes place at 260 and 293 K, respectively (points 1 and 3′ in Figure 7). In KCl, vacancy mobility occurs at slightly higher temperatures:  υ c –270 K (point 2) and  υ a + –307 K (point 4′). Note that by the time the jump diffusion of  υ a +  starts, cation vacancies are sufficiently mobile: ν( υ c ) =33 s−1 in NaCl and ν( υ c ) = 46 s−1 in KCl (Table 4). Thus, only  υ c  are mobile at 260–293 K in NaCl (points 1 → 3) and 270–307 K in KCl (points 2 → 4).
The results of a comparative analysis of the jump frequency of  υ c  and  υ a +  for KCl and NaCl crystals in different temperature ranges (according to the dependences presented in Figure 7) are summarized in Table 4.
Table 4 highlights the data for two temperature regions that correspond to type-I and type-II TSL peaks (shaded areas containing points 5 and 6 in Figure 7). As the temperature rises above the threshold values, characterizing the onset of anion vacancy mobility in NaCl and KCl crystals, the difference in jump frequencies of  υ c  and  υ a +  decreases significantly. In the region of type-I TSL (the midpoint at 400 K is taken in Table 4), the ν( υ c )/ν( υ a + ) ratio equals 13 (NaCl) and 15 (KCl), while for the type-II TSL (555 K was selected in Table), the corresponding ν( υ c )/ν( υ a + ) values decrease to 7 and 6, respectively. This implies that significantly more mobile  υ c  play a crucial role in the formation of type-I TSL peaks, while  υ c  and  υ a +  participate equally in the appearance of type-II TSL peaks.
In NaCl:Li and KCl:Na crystals doped with small-radius cation impurities (r(Na+)/r(Li+) =1.44 and r(K+)/r(Li+) =1.35), the  E a  (υc) value for the cation vacancy migration decreases to 0.6 eV [32,55]. Figure 7 and Table 4 also illustrate notable changes in the temperature dependencies of vacancy jump frequencies in the doped crystals. In KCl:Na, a cation vacancy becomes mobile at 220 K, ν( υ c ) = 1 c−1 (point 0 in the figure), at 307 K—ν( υ c ) = 6.3 × 10³ s−1 (4″); at 400 K—ν( υ c  = 1.25 × 10⁶ s−1 (5″); at 555 K—ν( υ c ) = 1.63 × 10⁸ s−1 (6″). It is evident that these ν values considerably exceed those for the pure crystal. In NaCl:Li, the obtained values of ν( υ c ) are very similar (points 0, 1″, 2″, 3″, 4″, 5″, and 6″ in Figure 7).
Thus,  υ c  in doped NaCl and KCl crystals become mobile at lower temperatures than in pure crystals. Moreover, in the regions of type-I and type-II TSL peaks, the calculated values of ν( υ c ) exceed the corresponding values of ν( υ a ) by almost an order of magnitude. Consequently,  υ c  is a key factor in the formation of TSL peaks during the destruction of polyhalide structures (e.g., trihalide quasi-molecules  C l 3 aca ) and complementary electronic F-centers. One should also note that mobile holes are formed during the high-temperature decomposition of polyhalide molecules, and their radiative recombination with the electrons near impurity cations can proceed via the ELF states. Just the typical luminescence of near-impurity ELFs has been detected in the spectra of high-temperature TSL of KCl:Na and NaCl:Li crystals.

4. Conclusions

The presence of small-radius impurity cations (Li, Na) in NaCl:Li and KCl:Na crystals significantly enhances the high-temperature TSL peaks with maxima at 570–580 K, which can be utilized as dosimetric peaks in novel luminescent detectors. The integral light sum S of high-temperature TSL in NaCl:Li (400 ppm) and KCl:Na (1000 ppm) crystals exceeds that of the standard TLD-100 thermoluminescent dosimeter (LiF:Mg, Ti). When TSL measurements are conducted under identical conditions and after isodose irradiation with X-rays (10 mGy), these values relate as 16:20:1.
For the first time, the spectra of high-temperature TSL (300–800 K) in X-irradiated NaCl:Li and KCl:Na crystals have been measured and analyzed. Their comparison with the spectra of XRL and TL of the same crystals has revealed their identity: in all three cases, the emission band peaking at 3.4 eV dominates in NaCl:Li, while the luminescence at 2.8 eV and 3.1 eV prevails in KCl:Na. In our opinion, these emissions result from the radiative decay of ELFs (bound excitons) near impurity cations with small ionic radii. The creation of such ELFs is facilitated by the flux of the mobile holes released during thermal dissociation of polyhalide radiation defects and their recombination with electrons (released, e.g., at the thermal ionization of F-centers) near impurity ions.

Author Contributions

Conceptualization, K.S.; methodology, K.S.; software, A.K. and Z.S.; validation, S.S. and K.S.; formal analysis, S.S. and A.K.; investigation, K.S., A.K. and Z.S.; resources, K.S.; data curation, S.S. and A.K.; writing—original draft preparation, K.S.; writing—review and editing, K.S. and A.K.; visualization, S.S., A.K. and Z.S.; supervision, S.S. and K.S.; project administration, K.S.; funding acquisition, K.S. All authors have read and agreed to the published version of the manuscript.

Funding

The research work has been funded by the Science Committee of the Ministry of Science and Higher Education of the Republic of Kazakhstan (Grant No. AP23488688).

Data Availability Statement

The authors confirm that the data supporting the findings of this study are available within the article.

Acknowledgments

The authors would like to express sincere gratitude to A. Lushchik for fruitful discussions and invaluable help in editing this manuscript, as well as D. Sergeyev, L. Myasnikova, and A. Istlyaup for their assistance in visualization of the discussed concepts.

Conflicts of Interest

The authors declare no conflicts of interest.

References

  1. Stoneham, A.M.; Itoh, N. Materials Modification by Electronic Excitation. Appl. Surf. Sci. 2000, 155, 186–193. [Google Scholar] [CrossRef]
  2. Lushchik, C.; Lushchik, A. Evolution of Anion and Cation Excitons in Alkali Halide Crystals. Phys. Solid State 2018, 60, 1487–1505. [Google Scholar] [CrossRef]
  3. Song, K.S.; Williams, R.T. Self-Trapped Excitons; Springer Science & Business Media: Berlin/Heidelberg, Germany, 2013; ISBN 978-3-642-85236-7. [Google Scholar]
  4. Takizawa, Y.; Kamada, K.; Yoshino, M.; Kim, K.J.; Kutsuzawa, N.; Yamaji, A.; Kurosawa, S.; Yokota, Y.; Sato, H.; Toyoda, S.; et al. Growth of Thallium-Doped CsI/CsCl/KCl Eutectics and Their Scintillation Properties. Opt. Mater. X 2022, 15, 100159. [Google Scholar] [CrossRef]
  5. Miyazaki, K.; Nakauchi, D.; Kato, T.; Kawaguchi, N.; Yanagida, T. Development of Tl-Doped KI Single Crystal Scintillators. Radiat. Phys. Chem. 2023, 207, 110820. [Google Scholar] [CrossRef]
  6. Syrotych, Y.; Gorbenko, V.; Pejchal, J.; Kucerkova, R.; Mares, J.A.; Nikl, M.; Kamada, K.; Yoshikawa, A.; Fedorov, A.; Sidleskiy, O.; et al. Two- and Three-Layered Composite Scintillators Based on the Ce3+-Doped GAGG and TbAG Garnets for the Simultaneous Registration of Various Types of Ionizing Radiation. Cryst. Growth Des. 2024, 24, 6954–6964. [Google Scholar] [CrossRef]
  7. Salas-Juárez, C.J.; Ugalde-Valdés, M.A.; Guzmán-Mendoza, J.; Nolasco-Altamirano, D.; Martínez-Gil, M.; Gómez-Dominguez, C.E.; Guarin, C.A.; Melendrez, R.; Rivera-Montalvo, T. Persistent Luminescence of Commercial TLD-100 Dosimeter: Using Shallow Traps for Radiation Dosimetry. Radiat. Meas. 2023, 167, 106997. [Google Scholar] [CrossRef]
  8. Li, Y.; Xu, S.; Meng, F.; Jiang, H.; Yao, S.; Zhang, X.; Liu, J.; Sun, X.; Wang, L.; Mahadevan, C.K. Insight into the Structural, Mechanical and Optical Properties of NaCl:Tb Crystals for the WLED and TLD Applications. Ceram. Int. 2023, 49, 28274–28282. [Google Scholar] [CrossRef]
  9. Aboelezz, E.; Pogue, B.W. Review of Nanomaterial Advances for Ionizing Radiation Dosimetry. Appl. Phys. Rev. 2023, 10, 21312. [Google Scholar] [CrossRef]
  10. Salah, N.; Sahare, P.D.; Rupasov, A.A. Thermoluminescence of Nanocrystalline LiF:Mg, Cu, P. J. Lumin. 2007, 124, 357–364. [Google Scholar] [CrossRef]
  11. Horowitz, Y.S. Linearisation of the Dose Response of Composite Peak 5 in LiF:Mg,Ti by Post-Irradiation Photon Excitation. Phys. Med. Biol. 2024, 69, 212001. [Google Scholar] [CrossRef]
  12. Khoshakhlagh, M.; Islamian, J.; Abedi, S.; Mahmoudian, B. Development of Scintillators in Nuclear Medicine. World J. Nucl. Med. 2015, 14, 156–159. [Google Scholar] [CrossRef]
  13. Watanabe, K.; Kawabata, Y.; Yamazaki, A.; Uritani, A.; Iguchi, T.; Fukuda, K.; Yanagida, T. Development of an Optical Fiber Type Detector Using a Eu:LiCaAlF6 Scintillator for Neutron Monitoring in Boron Neutron Capture Therapy. Nucl. Instrum. Methods Phys. Res. Sect. A Accel. Spectrometers Detect. Assoc. Equip. 2015, 802, 1–4. [Google Scholar] [CrossRef]
  14. Horowitz, Y.S.; Oster, L.; Eliyahu, I. The Saga of the Thermoluminescence (TL) Mechanisms and Dosimetric Characteristics of LiF:Mg,Ti (TLD-100). J. Lumin. 2019, 214, 116527. [Google Scholar] [CrossRef]
  15. Lee, S.; Lee, J.; Kim, G.; Ye, S.-J. Estimating 10B and 14N Doses Using a Pair of LiF-Based TLD-600 and TLD-700 as an Alternative to Gold Activation Method. Nucl. Instrum. Methods Phys. Res. Sect. A Accel. Spectrometers Detect. Assoc. Equip. 2023, 1050, 168141. [Google Scholar] [CrossRef]
  16. Behmadi, M.; Mohammadi, S.; Ravari, M.E.; Mohammadi, A.; Loushab, M.E.; Toossi, M.T.B.; Ghergherehchi, M. Neutron Dosimetry with a Pair of TLDs for the Elekta Precise Medical Linac and the Evaluation of Optimum Moderator Thickness for the Conversion of Fast to Thermal Neutrons. Nucl. Eng. Technol. 2024, 56, 753–761. [Google Scholar] [CrossRef]
  17. Baker, M.D.; Hanusa, C.R.H.; Paltoo, K.; Danzig, E.; Belanger, J. Bonding in Sodium Chloride Nanotubes: A New Analysis via Madelung Constants and Cohesive Energies. J. Phys. Chem. C 2013, 117, 25742–25747. [Google Scholar] [CrossRef]
  18. Fernandez-Lima, F.A.; Henkes, A.V.; da Silveira, E.F.; Nascimento, M.A.C. Alkali Halide Nanotubes: Structure and Stability. J. Phys. Chem. C Nanomater. Interfaces 2012, 116, 4965–4969. [Google Scholar] [CrossRef]
  19. Froborg, F.; Duffy, A. Annual Modulation in Direct Dark Matter Searches. J. Phys. G Nucl. Part. Phys. 2020, 47, 94002. [Google Scholar] [CrossRef]
  20. Hailey, C.J.; Craig, W.W.; Harrison, F.A.; Hong, J.; Mori, K.; Koglin, J.; Yu, H.T.; Ziock, K.P. Development of the Gaseous Antiparticle Spectrometer for Space-Based Antimatter Detection. Nucl. Instrum. Methods Phys. Res. Sect. B Beam Interact. Mater. At. 2004, 214, 122–125. [Google Scholar] [CrossRef]
  21. Shunkeyev, K.; Tilep, A.; Sagimbayeva, S.; Ubaev, Z.; Lushchik, A. The Effect of Instability of KCl:Na Single Crystals. Crystals 2023, 13, 364. [Google Scholar] [CrossRef]
  22. Shunkeyev, K.; Tilep, A.; Sagimbayeva, S.; Lushchik, A.; Ubaev, Z.; Myasnikova, L.; Zhanturina, N.; Aimaganbetova, Z. The Enhancement of Exciton-like Luminescence in KCl Single Crystals under Local and Uniaxial Elastic Lattice Deformation. Nucl. Instrum. Methods Phys. Res. Sect. B Beam Interact. Mater. At. 2022, 528, 20–26. [Google Scholar] [CrossRef]
  23. Shunkeyev, K.; Aimaganbetova, Z.; Myasnikova, L.; Maratova, A.; Ubaev, Z. Mechanisms of Radiation Defect Formation in KCl Crystals under the Influence of Local and Plastic Deformation. Nucl. Instrum. Methods Phys. Res. Sect. B Beam Interact. Mater. At. 2021, 509, 7–11. [Google Scholar] [CrossRef]
  24. Kohzuki, Y.; Ohgaku, T. Deformation Luminescence of X-Ray-Irradiated KCl:Eu2+ Single Crystals by Compression. J. Lumin. 2023, 253, 119469. [Google Scholar] [CrossRef]
  25. Ramirez, M.; Bausa, L.; Biernacki, S.W.; Kaminska, A.; Suchocki, A.; Grinberg, M. Influence of Hydrostatic Pressure on Radiative Transition Probability of the Intrashell 4f Transitions in Yb3+ Ions in Lithium Niobate Crystals. Phys. Rev. B 2005, 72, 224104. [Google Scholar] [CrossRef]
  26. Elango, A.; Sagimbaeva, S.; Sarmukhanov, E.; Savikhina, T.; Shunkeev, K. Effect of Uniaxial Stress on Luminescence of X- and VUV-Irradiated NaCl and NaBr Crystals. Radiat. Meas. 2001, 33, 823–827. [Google Scholar] [CrossRef]
  27. Shunkeyev, K.; Lushchik, A.; Myasnikova, L.; Sagimbaeva, S.; Ubaev, Z.; Aimaganbetova, Z. Deformation-Stimulated Ex Luminescence in a RbI Single Crystal. Low Temp. Phys. 2019, 45, 1127–1130. [Google Scholar] [CrossRef]
  28. Grinberg, M. Excited States Dynamics under High Pressure in Lanthanide-Doped Solids. J. Lumin. 2011, 131, 433–437. [Google Scholar] [CrossRef]
  29. Mahlik, S.; Malinowski, M.; Grinberg, M. High Pressure and Time Resolved Luminescence Spectra of Gd3Ga5O12:Pr3+ Crystal. Opt. Mater. 2011, 33, 1525–1529. [Google Scholar] [CrossRef]
  30. Mahlik, S. High-Pressure Study of Phosphors Emission. In Phosphor Handbook: Experimental Methods for Phosphor Evaluation and Characterization; CRC Press: Boca Raton, FL, USA, 2022; pp. 419–545. [Google Scholar]
  31. Ikezawa, M.; Kojima, T. Luminescencs of Alkali Halide Crystals Induced by UV-Light at Low Temperature. J. Phys. Soc. Jpn. 1969, 27, 1551–1563. [Google Scholar] [CrossRef]
  32. Lushchik, C.; Lushchik, A. Decay of Electronic Excitations with Defect Formation in Solids; Nauka: Moscow, Russia, 1989; ISBN 978-5-02-014026-4. [Google Scholar]
  33. Lushchik, C.; Kolk, J.; Lushchik, A.; Lushchik, N.; Taiirov, M.; Vasilchenko, E. Decay of Excitons into Long-Lived F,H and α,I Pairs in KCl. Phys. Status Solidi B 1982, 114, 103–111. [Google Scholar] [CrossRef]
  34. Vasilchenko, E.; Sarmukhanov, E.; Shunkeev, K.; Elango, A. Electronic Excitations Localized in KBr and KI Crystals near Vacancy Defects of Different Sizes. Phys. Status Solidi B-Basic Solid State Phys. 1992, 174, 155–163. [Google Scholar] [CrossRef]
  35. Lushchik, A.; Lushchik, C.; Lushchik, N.; Frorip, A.; Nikiforova, O. Formation and Decay of Electronic Excitations Localized near Divacancies in Alkali Halides. Phys. Status Solidi B 1991, 168, 413–423. [Google Scholar] [CrossRef]
  36. Shunkeyev, K.; Sagimbayeva, S.; Myasnikova, L.; Istlyaup, A.; Kenzhebayeva, A. High-Temperature Thermally Stimulated Luminescence of the NaCl and NaCl-Li Crystals. Eurasian J. Phys. Funct. Mater. 2024, 8, 71–78. [Google Scholar] [CrossRef]
  37. Schoemaker, D. g and Hyperfine Components of VK Centers. Phys. Rev. B 1973, 7, 786–801. [Google Scholar] [CrossRef]
  38. Castner, T.G.; Känzig, W. The Electronic Structure of V-Centers. J. Phys. Chem. Solids 1957, 3, 178–195. [Google Scholar] [CrossRef]
  39. Lushchik, C.H.B. Chapter 8—Creation of Frenkel Defect Pairs by Excitons in Alkali Halides. In Modern Problems in Condensed Matter Sciences; Johnson, R.A., Orlov, A.N., Eds.; Elsevier: Amsterdam, The Netherlands, 1986; Volume 13, pp. 473–525. [Google Scholar]
  40. Lushchik, C.; Kolk, J.; Lushchik, A.; Lushchik, N. Radiational Creation of Frenkel Defects in KCl-Tl. Phys. Status Solidi A 1984, 86, 219–227. [Google Scholar] [CrossRef]
  41. Aboltin, D.E.; Grabovskis, V.J.; Kangro, A.R.; Lushchik, C.; O’Konnel-Bronin, A.A.; Vitol, I.K.; Zirap, V.E. Thermally Stimulated and Tunneling Luminescence and Frenkel Defect Recombination in KCl and KBr at 4.2 to 77 K. Phys. Status Solidi A 1978, 47, 667–675. [Google Scholar] [CrossRef]
  42. Elango, A.A.; Nurakhmetov, T.N. Structure and Generation Mechanism of Br Centres in X-Rayed KBr. Phys. Status Solidi B 1976, 78, 529–536. [Google Scholar] [CrossRef]
  43. Manam, J.; Gabtya, R.K.; Ratnam, V.V. Effect of Post-Irradiation Deformation on Thermoluminescence Spectra of KCl:Ca and NaCl:Ca Crystals. Phys. Status Solidi A 1983, 79, 167–171. [Google Scholar] [CrossRef]
  44. Manam, J.; Ratnam, V.V. Effect of Post-Irradiation Deformation on the Thermally Stimulated Luminescence Spectra of KCl:Na Crystals. Nucl. Tracks Radiat. Meas. 1985, 10, 97–100. [Google Scholar] [CrossRef]
  45. Manam, J.; Ratnam, V.V. V3 and FA Centers in KCl:Na Crystals. A Thermoluminescence Study. Phys. Status Solidi B 1984, 121, 393–399. [Google Scholar] [CrossRef]
  46. Shunkeyev, K.; Myasnikova, L.; Barmina, A.; Zhanturina, N.; Sagimbaeva, S.; Aimaganbetova, Z.; Sergeyev, D. The Thermostimulated Luminescence of Radiation Defects in KCl, KBr and KI Crystals at Elastic and Plastic Deformation. J. Phys. Conf. Ser. 2017, 830, 12138. [Google Scholar] [CrossRef]
  47. Shunkeyev, K.; Sergeyev, D.; Drozdowski, W.; Brylev, K.; Myasnikova, L.; Barmina, A.; Zhanturina, N.; Sagimbaeva, S.; Aimaganbetova, Z. The Deformation Stimulated Luminescence in KCl, KBr and KI Crystals. J. Phys. Conf. Ser. 2017, 830, 12139. [Google Scholar] [CrossRef]
  48. Itoh, N. Interstitial and Trapped-Hole Centers in Alkali Halides. Cryst. Lattice Defects 1972, 3, 115–143. [Google Scholar]
  49. Rodriguez-Lazcano, Y.; Correcher, V.; Garcia-Guinea, J. Luminescence Emission of Natural NaCl. Radiat. Phys. Chem. 2012, 81, 126–130. [Google Scholar] [CrossRef]
  50. Azim, M.K.M.; Sani, S.F.A.; Daar, E.; Khandaker, M.U.; Almugren, K.S.; Alkallas, F.H.; Bradley, D.A. Luminescence Properties of Natural Dead Sea Salt Pellet Dosimetry upon Thermal Stimulation. Radiat. Phys. Chem. 2020, 176, 108964. [Google Scholar] [CrossRef]
  51. Lushchik, A.; Lushchik, C.; Nagirnyi, V.; Shablonin, E.; Vasil’chenko, E. Low-Temperature Creation of Frenkel Defects via Hot Electron-Hole Recombination in Highly Pure NaCl Single Crystals. Low Temp. Phys. 2016, 42, 547–551. [Google Scholar] [CrossRef]
  52. Shunkeyev, K.; Ubaev, Z.; Lushchik, A.; Myasnikova, L. Radiation Defects in NaCl matrix Reduced Lattice Symmetry Caused by Light Cation Doping and Elastic Uniaxial Deformation. Lith. J. Phys. 2021, 61, 151–160. [Google Scholar] [CrossRef]
  53. Reddy, C.G.; Reddy, K.N. Effect of Plastic Deformation on the Thermally Stimulated Luminescence of NaCl:Y Crystals. Mater. Chem. Phys. 1991, 27, 325–329. [Google Scholar] [CrossRef]
  54. Lushchik, A.C.; Frorip, A.G. Thermalized and Hot Interstitial Halogen Ions in Alkali Halides. Phys. Status Solidi B 1990, 161, 525–535. [Google Scholar] [CrossRef]
  55. Beniere, M.; Chemla, M.; Beniere, F. Vacancy Pairs and Correlation Effects in KCl and NaCl Single Crystals. J. Phys. Chem. Solids 1976, 37, 525–538. [Google Scholar] [CrossRef]
Figure 1. TSL of NaCl (inset (a)), NaCl:Li (100 ppm, inset (b)), and NaCl:Li (400 ppm, the main graph)) crystals, irradiated by X-rays (10 mGy) at room temperature.
Crystals 15 00067 g001
Figure 2. TSL and the emission spectra of TSL in the region of main TSL peaks (insets (a,b)) of a NaCl:Li (400 ppm) crystal, irradiated with X-rays (dose of 10 mGy) and room temperature: (a) TSL spectrum of the peak at 360 K (scanned in the range of 350–370 K); (b) TSL spectrum of the peak at 540 K (scanned in the range of 525–545 K).
Crystals 15 00067 g002
Figure 3. The spectra of TSL in the region of the peak at 535 K ((a), also see Figure 2), XRL (b), and TL (c) of the NaCl:Li (400 ppm) crystal. TL and XRL spectra were recorded at 300 K upon and after X-ray irradiation of the crystal, respectively.
Crystals 15 00067 g003
Figure 4. TSL of KCl:Na (1000 ppm) and KCl (inset (a)) crystals, irradiated with X-rays (10 mGy) at room temperature. The TSL spectra of KCl:Na (1000 ppm) were measured in regions of different TSL peaks. The numbers of corresponding peaks of a TSL curve are indicated in insets (bd): (b) TSL spectra (1-2-3) of the KCl:Na crystal at the 400 K (1), 430 K (2), and 490 K (3) peaks; (c) TSL spectrum (4) of the KCl:Na crystal at the 575 K peak (4); (d) TSL spectrum (4) of the KCl:Na crystal at the 660 K peak (5).
Crystals 15 00067 g004
Figure 5. The spectra of TSL in the region of the peak at 575 K (a), XRL (b), and TL (c) of KCl:Na (1000 ppm) crystals. The XRL and TL spectra were measured at 300 K. Thin lines represent the decomposition into elementary Gaussians.
Crystals 15 00067 g005
Figure 6. The integral TSL curve and TSL spectrum in the region of a dosimetric peak at 495 K (inset) of the LiF:Mg, Ti crystal (TLD-100), irradiated with X-rays (10 mGy).
Crystals 15 00067 g006
Figure 7. Temperature dependence of the jump frequency of cation ν( υ c ) and anion ν( υ a + ) vacancies in NaCl and KCl crystals. The shaded areas highlight the temperature ranges corresponding to the TSL peaks of type-I (360–425 K) and type-II (495–620 K). The threshold value of the vacancy jump frequency (lgν = 0) is depicted by a horizontal beige line. The numbers in the figure indicate the selected temperatures for all four crystals: 1, 1′, 1″—260 K; 2, 2′, 2″—270 K; 3, 3′, 3″—293 K; 4, 4′, 4″—307 K; 5, 5′, 5″—400 K; 6, 6′, 6″—555 K.
Crystals 15 00067 g007
Table 1. Comparative analysis of integral light sums S of TSL and activation energies Ea of peaks in NaCl, NaCl:Li (100 ppm), and NaCl:Li (400 ppm) crystals.
CrystalsS, Arb. Units   S n S a E a , eV
Type-I TSL
E a , eV
Type-II TSL
NaClSa = 2.310.711.3
NaCl:Li (100 ppm)Sb = 16.57.20.821.16
NaCl:Li (400 ppm)Sc = 5802520.871.11
Table 2. Comparative analysis of integral light sums, S, and activation energies of the TSL peaks of KCl and KCl:Na (1000 ppm) crystals.
CrystalsS, Arb. Units   S n S a Ea, eV
Type-I TSL
Ea, eV
Type-II TSL
KClSa = 2.110.711.6
KCl:Na (1000 ppm)Sb = 7203431.3; 1.35; 1.52.2; 2.4
Table 3. Thermoactivation parameters of NaCl and KCl crystals, according to [55].
Crystals ν 0 ,
s−1
  For   Cation   Vacancy ,   υ c   For   Anion   Vacancy ,   υ a +
T ,   When   ν ( υ c )  = 1, K   D υ c k B E a υ c , eV T ,   When   ν ( υ a + )  = 1, K   D υ a + k B E a υ a + , eV
NaCl4.91 × 10122600.691.642930.771.38
KCl4.25 × 10122700.732.43070.853.2
Table 4. Comparative analysis of the jump frequency of cationic and anionic vacancies for KCl and NaCl crystals based on their temperature dependence, according to Figure 7.
Crystals293–307 KType-I TSL (400 K)Type-II TSL (555 K)
ν ( υ c ) ,
s−1
ν ( υ a + ) ,
s−1
  ν ( υ c ) ν ( υ a + ) ν ( υ c ) ,
(×104)
s−1
ν ( υ a + ) ,
(×104)
s−1
  ν ( υ c ) ν ( υ a + ) ν ( υ c ) , (×106)
s−1
ν ( υ a + ) ,
(×106)
s−1
  ν ( υ c ) ν ( υ a + )
NaCl331334.820.371313.527
KCl461462.90.191511.526
NaCl:Li11541115467.40.3718287.8244
KCl:Na213512135124.70.19656162.6281
Disclaimer/Publisher’s Note: The statements, opinions and data contained in all publications are solely those of the individual author(s) and contributor(s) and not of MDPI and/or the editor(s). MDPI and/or the editor(s) disclaim responsibility for any injury to people or property resulting from any ideas, methods, instructions or products referred to in the content.

