Abstract
In this paper, a MANet-based image detection approach is designed to inspect crystal defects during the cooling crystallization process, like that involving β-form L-glutamic acid (LGA), utilizing an online imaging device. The steps in the presented strategy encompass crystal image preprocessing, crystal image segmentation, and crystal classification. Firstly, the guided image filter is introduced to preprocess the collected crystallization images for offline training and online detection. Then, by using an image augmentation strategy to enlarge the number of crystal image samples for training, the MANet-based network is improved for crystal image segmentation. Accordingly, by defining some features, needle-like crystals can be categorized into four types with an efficient classifier for the detection of normal and defective crystals. The experimental results for the batch crystallization of β-form LGA are provided to illustrate the validity of the presented detection methodology.
1. Introduction
The detection of crystal growth is necessary and important to control the crystal status during crystallization [1,2]. A lot of research efforts in the last two decades have been devoted to the detection of crystal sizes and morphology during batch crystallization processes, by using process analysis technologies (PATs). Specifically, the specialized instrument known as the focused beam reflectance measurement (FBRM) device is designed for the assessment of the chord length distribution (CLD) of crystals. Nevertheless, the margin of error in such measurements can prove to be unacceptable when dealing with particles that deviate significantly from a spherical shape.
Recently, in the past years, microscope cameras are increasingly being used for online monitoring of crystal growth, based on invasive and non-invasive imaging instruments [3]. Zhou et al. [4] proposed image analysis techniques employed to obtain valuable characteristics from micrographics, with particle vision and measurement (PVM) technology as an invasive imaging device. By comparison, an non-invasive imaging device placed outside a crystallizer was successfully used to monitor the morphology of the crystals [5,6]. Larsen et al. [7] effectively analyzed high-concentration crystal images and meticulously processed needle crystals, conducting an examination of various crystal characteristics to attain a comprehensive depiction of the crystals. Concerning the online measurement of crystallization by an imaging tool, several image detection approaches were investigated for crystallization, some for measuring the one-dimensional characteristic size, and others for two-dimensional (2D) or three-dimensional (3D) sizes [8,9]. For instance, Wu et al. [10] developed an efficient image processing method using neural networks to evaluate the particle size and morphology in different concentrations for batch crystallization processes. Gao et al. [11] employed deep learning technology to detect L-glutamic acid (LGA) crystals and accurately measure the two-dimensional sizes of the particles. Heisel et al. [12] used a novel two-step classifier via artificial neural networks for the task of discriminating between the crystalline shapes, including α- and β-form crystals. Zhang et al. [3] proposed an in situ 3D measurement methodology to successfully assess 3D sizes of β-form LGA crystals with a binocular micro-vision system. Another 3D measurement technique [13], with the matching of the two sets of descriptor information, was further presented to assess the facet growth using the same binocular system. It is worth noting that this technique remains available for measuring or assessing crystal growth during crystallization. The size and shape of crystals traditionally may not fully reflect the quality of the crystals. It is interesting that the detection of crystal defects is carried out by using image analysis technologies.
Recently, deep learning strategies have been effectively employed in computer vision and various other domains [14]. The advent of the first deep network—AlexNet [15], in 2012, marked a significant milestone. This network used several advanced convolutional neural network (CNN) techniques, including parallel training, the ReLU function, and dropout technology. By stacking multiple convolutional layers and pooling layers, deeper network structures can be obtained, such as VGGNet [16], and ResNet [17], etc. In particular, based on these seminal neural network models, numerous experts and scholars have proposed improved network structures, thereby driving the rapid advancement of image segmentation. The CNN algorithm generates abstract deep features by merging shallow features and, subsequently, extracts distributed features for image semantic segmentation through pixel classification, resulting in an outstanding level of performance. Long et al. [18] designed the full convolutional network (FCN), using the convolution layer in place of the full connection layer, to solve the challenge of semantic image segmentation, realizing the end-to-end pixel classification of images. Badrinarayanan et al. [19] suggested a new semantic segmentation algorithm (SegNet) on the basis of the FCN. Groundtruth was used as the supervision information training network, and the image level classification was transformed into the pixel level classification, so as to realize semantic segmentation. Google proposed an extended semantic segmentation algorithm [20], which can expand the sensitivity field without increasing the number of parameters, and the representative algorithms include DeepLab-V1, DeepLab-V2, and DeepLab-V3 [21], etc. Ronneberger et al. [22] built a network of U-shaped architecture (U-Net) to solve the semantic segmentation issue, established based on the model architecture of the FCN.
Generally, the online detection of crystal quality in a suspension by utilizing an optical imaging system presents many difficulties. The major problem depends on the fact that there is no unified criterion for defect detection in needle-like crystals, subject to crystal agglomeration, crushing, and internal defects during crystallization. Nevertheless, there has been limited exploration of methods to address these challenges during batch crystallization processes in recent literature, particularly since the emergence of online microscopic image analysis technologies. To tackle the aforementioned issues, we develop a deep learning image analysis method for monitoring crystal defects during the cooling crystallization process, specifically focusing on β-form L-glutamic acid (LGA). Firstly, a guided image filter is introduced to preprocess images captured online of crystallization for offline training and online analysis, such that the impact of unbalanced illumination, solution turbulence in the stirred crystallizer, and particle movement could be effectively alleviated. Secondly, the multi-scale attention network (MANet) model [23] is adopted for deep learning analysis of crystal image segmentation, which does not need a large number of online crystal image samples. To overcome the problem of only having a very limited number of crystal images captured online to be used for training the deep learning network, an image augmentation strategy is proposed to improve the segmentation effect on the crystal images. Accordingly, four classes of β-form LGA crystals are recognized to complete the detection of crystal quality.
For clarity, the paper content is structured as follows. The experimental set-up is presented in Section 2. In Section 3, the suggested image detection process is recommended. Section 4 presents the experiment results to assess the performance of the method. Finally, some conclusions are presented in Section 5.
2. Experimental Set-Up
L-glutamic acid (LGA), C5H9NO4, was chosen as the subject of this research. LGA crystals exist in two forms: the prismatic α-form and the needle-like β-form. In this study, β-form LGA crystals were crystallized to facilitate the detection of defective crystals. The non-invasive microscopic device (Pharma Vision, Qingdao, China) used to collect the crystallization images of β-form LGA is depicted in Figure 1. The experiments were conducted using a 1 L glass vessel, a four-paddle stirrer, and a temperature probe (PT100, JULABO, Seelbach, Germany). Temperature control was achieved using a thermostatic circulator (Julabo CF41, JULABO, Seelbach, Germany). The imaging system, equipped with two high-speed cameras (Pharma Vision, Qingdao, China), captured crystallization images during the crystallization processes. The camera (UI-2280SE-C-HQ, IDS, Obersulm, Germany) with a CCD sensor (IDS, Obersulm, Germany) and universal serial bus was manufactured by IDS Imaging Development Systems GmbH. The online images of β-form LGA crystals were extracted from the solution in the agitated reactor.
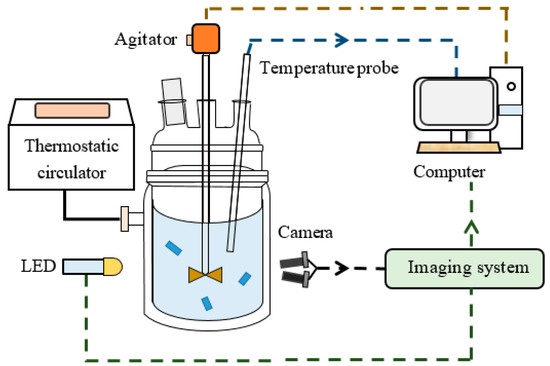
Figure 1.
The schematic of the experimental set-up.
In this study, β-form LGA seeds were employed during the crystallization to suppress secondary nucleation and prevent the formation of little particles. It is worth noting that seed crystals were generated with β-form LGA crystals through milling, sieving, dissolving, and drying, etc. Initially, a 0.6 L LGA solution was poured into the vessel, and the stirring rate was set at 210 rpm. The solution was heated to 75 °C to dissolve all the LGA solutes. Subsequently, the temperature was gradually reduced to 45 °C at a rate of 0.5 °C/min. When the solution reached 45 °C, the crystal seeds were introduced into the crystallizer. Simultaneously, the online images were captured via the imaging system during the crystallization process, as shown in Figure 1. The solution was then cooled down to a temperature of 35 °C, at a cooling rate of 0.1 °C/min. During the experiment process, with one camera taking about six images per second, the non-invasive imaging device was able to collect 12 images per second.
3. Detection Methods
3.1. Overview of the Method
An overview of the presented detection strategy is described in Figure 2. As shown in Figure 2, the method involves two stages (i.e., offline training and online detection) employed to capture crystallization images in complicated situations (e.g., unbalanced illumination, solution movement, etc.). The first stage involves training the network parameters using the annotated images, followed by image augmentation. It is worth noting that the annotated image set includes the original images and the mask ones via manual labeling of the crystals. In the second stage, the online crystallization images, which are captured in real-time during the crystallization process, are segmented using the trained model after image preprocessing. The classification of the crystals can be completed for the segmented images.
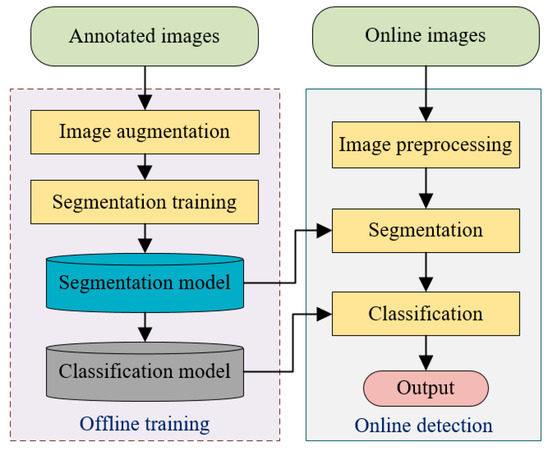
Figure 2.
Flow chart of the proposed detection strategy.
3.2. Image Preprocessing
During online image collection and transmission, the collected images are often affected by noise pollution. The background of crystallization images may suffer from unevenness and low variation, while the reflective properties of the crystal plane due to variations in lighting and solution movement within the agitated reactor can significantly compromise the accuracy of crystal image segmentation. Therefore, preprocessing of the images is necessary. To mitigate the impact of noise on the subsequent operation, this study utilizes the guided filtering approach [24]. The guided image serves as a processed image, and guided filtering acts as an edge-preserving filter, ensuring the conservation of information near the edges. The pixel in the input image and the pixel in the output one are defined by the following equation:
where is the index of the local square window , which is taken as in the input image, and are the constants in , which can be obtained by the following equation:
where is the regularization parameter. And the solution is as follows:
where and are the mean and variance of the input image in , and is the total number of pixels in , and
The output is calculated as:
Furthermore, to maintain the image values within a consistent range, it is essential to normalize the denoising crystallization images. This normalization process involves dividing the pixel values by 255 to scale the image pixels between 0 and 1. While it is possible to achieve segmentation without normalization in a full CNN, normalizing the images can enhance segmentation accuracy and improve the convergence speed.
3.3. Image Segmentation
Although the deep learning network based on skipping joins can capture rich semantic features, it does not delineate the spatial and channel interdependencies among pixels, which are crucial for the segmentation of crystal images. In addition, the pixel equivalent is always defined by using clear crystal imaging, so fuzzy images of crystals can affect the extraction of clear crystals. For instance, overlapping or adhesion results are always misjudged, as shown in Figure 3. With the purpose of resolving the aforementioned problems, MANet is introduced, which needs a considerably smaller training set of crystallization image samples that have similar structures. An overview of the segmentation MANet model is shown in Figure 4. The model includes two parts, i.e., the encoder and decoder. In order to better obtain a large amount of useful multi-scale information in feature maps, MANet incorporates two attention layers known as the position-wise attention block (PAB) and the multi-scale fusion attention block (MFAB), which enhance the overall performance of the network. The PAB layer is designed to grab spatial dependencies among the pixels in a feature map using the attention mechanism. The MFAB layer is designed to grab channel dependencies across all feature maps using the attention mechanism. The MFAB layer not only obtains the channel dependencies in deep feature maps, but also obtains those in shallow ones.
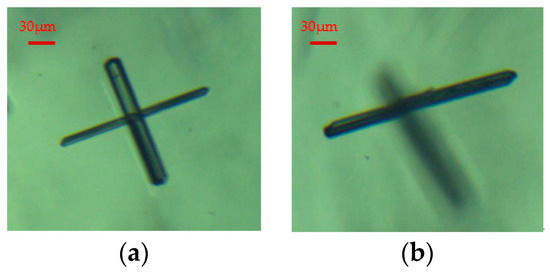
Figure 3.
The adhesion and overlapping image results: (a) adhesion; (b) overlapping.

Figure 4.
The structure of the MANet-based model for crystal segmentation.
The feature maps are extracted by using the ResNet-50 model, pre-trained using ImageNet. The lowest feature is directly up-sampled by the CAPAFE++ method [25], and then the feature maps with different scales generated by the backbone network are input into the corresponding attention module for refinement. These refined feature maps are applied to the lower ones in the upper sample. The encoder has four layers of Resblocks, and each Resblock contains three 3 × 3 Conv blocks, a 1 × 1 Conv block, and one residual connection with group normalization. For controlling model overfitting, a dropout operation [26] is applied in the convolution layer. The dropout ratio is 0.5. The channel of the PAB is set as 64. The fused features are then up-sampled in the decoder, by the corresponding up-sampling layer, using the CAPAFE++ method. This model has four skip connections. Finally, through the deconvolution operation, the output of the last layer is up-sampled to match the spatial resolution of the input, and input into the last convolution layer to obtain the predicted result.
To expedite the learning process for crystal images, the exponential linear unit (ELU) [27] is employed as an activation function with as:
To overcome pixel disproportion, the combined loss function is determined as:
where is the cross-entropy loss, and is the dice coefficient loss.
In scenarios where only a limited number of training samples are available, image augmentation serves are a crucial strategy to augment the training dataset and enhance the generalization capability of the segmentation model. Specifically in the context of microscopic images, it is advisable to apply random rotation, scaling, reflection, and brightness jitter to the sparse set of annotated images to facilitate the training of a segmentation network. The random rotation degree spans the interval (0, 360°), while the random scale factor varies within the range of (0.5, 1.5). Additionally, the brightness value varies within the range of (−0.3, 0.1). As a result of the image augmentation process, four training samples are generated for each original image, as shown in Figure 5.

Figure 5.
Image augmentation results: (a) original image; (b) rotation; (c) scaling; (d) reflection; (e) brightness jitter.
3.4. Image Classification
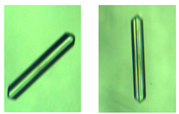
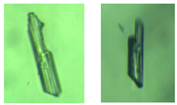
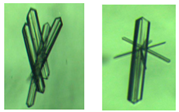
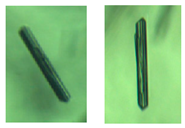
Generally, crystal adhesion, crushing, and dissolution, lead to irregular crystal defects during the cooling crystallization process. Therefore, it is possible that not all crystals in one batch are in the uniform β-shape. It is necessary that β-form LGA crystals are classified in order to inspect normal and defective particles. The semantic segmentation method, based on deep learning, may not address the classification issue for crystallization images on account of there being less unnormal samples and similar particle characteristics. In this study, β-form LGA crystals can be classified into four classes (i.e., normal class, incomplete class, adhesion class, and internal defect class), as shown in Table 1. Normal crystals with few defects are defined as Class 1. Incomplete crystals may be caused by particle collision and breakage, which are classified as Class 2. Adhesion crystals, which includes two or more crystals, are categorized as Class 3. Class 4 just encompasses defective crystals, with internal defects and irregular textures. As displayed in Table 1, Class 2 and Class 3 crystals can be distinguished from the other two classes by the convexity degree (CD), and the CD of Class 2 is much larger than that of Class 3. However, the CD of Class 1 and Class 4 are close to 1. The texture features between Class 1 and Class 4 are a bit different. Then, the number of defective crystals in one batch can be counted. Therefore, the CD, contrast, and entropy are selected as the features for classification. In addition, Fisher discriminant analysis [28], as a simple and efficient classifier, is used. Suppose the class of the training samples () is (), and the -th () class contains samples. The inter-class divergence matrix is , and the intra-class divergence matrix is .
where is the mean of the -th class, is the mean of the overall samples. The objective function with is:

Table 1.
Classification of β-form LGA crystals.
Then, the rate of the four types is easily obtained to further estimate the quality information combined with the CSD for a batch of crystals.
4. Experimental Results
The experiments were performed during the crystallization process of β-form LGA. The images used in the experiment were collected during the cooling crystallization process. The MANet-based model was improved and conducted via the open-source package [29]. In this study, about 80 images were randomly selected for the training of the segmentation model. The training images were annotated and augmented at first. The model was trained with a maximum epoch number of 180. The batch size for training was set as four. The Adam optimizer was employed during training. The initial learning rate was 0.005.
For segmentation testing, the improved segmentation method based on MANet for crystal extraction can take less than one second to process per image, and the reliable segmentation of clear crystals was realized. A general image collected during this study is shown in Figure 6a. Figure 6b shows the result of image preprocessing. It is observed that the noise can be removed, and the preprocessed image is of higher quality than the captured one. In Figure 6c, the crystal extraction result is obtained by using the improved segmentation model based on MANet applied to that of Figure 6b. We can see that the four particles are obvious in Figure 6c.
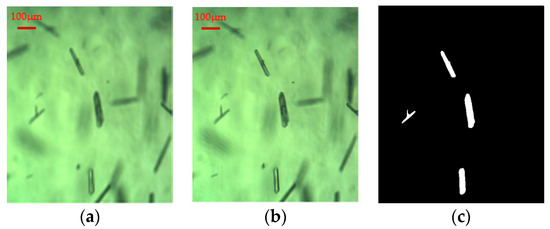
Figure 6.
The segmentation and measurement results of LGA image: (a) the captured image; (b) the preprocessed result; (c) the segmented result.
In addition, to indicate the superiority of the proposed image processing method for crystallization image analysis, the improved model, the thresholding segmentation method, the multi-scale segmentation method, and the original MANet model were used for comparison. The four segmentation methods are applied to the preprocessed crystal image shown in Figure 7a. Figure 7b shows the result with the improved MANet model. Figure 7c,d shows the result for the thresholding and multi-scale Canny segmentation methods, respectively. It is seen that the clear crystals are effectively extracted by the recommended technique for crystal classification, which can overcome the influence of crystal overlapping, while the two traditional techniques exhibit various shortcomings, such as the occurrence of fuzziness and the overlapping of crystals delineated by a red circle, as exhibited in Figure 7c,d. In addition, Figure 7e illustrates that the outcome generated by the original MANet model is less accurate when compared to that of the improved network. It is indicated that the improved MANet model can generally obtain clear particles to facilitate crystal classification for defect detection, as shown in Figure 7.

Figure 7.
The segmentation comparison results illustrated by LGA images: (a) the captured image; (b) the improved MANet result; (c) the thresholding segmentation result; (d) the multi-scale Canny detection result; (e) the MANet result.
In this experiment, the LGA crystals can be classified into four classes (i.e., normal class, incomplete class, adhesion class, and internal defect class), as shown in Table 1. In order to verify the performance of the classification model, we randomly selected 250 particles with the feature dataset as the training set, and randomly selected 100 particles (not containing the training set) as the testing set. For the classification of LGA crystals, the three feature variables (i.e., convexity degree, contrast, and entropy) were extracted from the identified crystals as the input features of the classification model. The classification model was trained using the features of the training particles. Table 2 demonstrates that the classification model, with Fisher discriminant analysis, has high classification accuracy. The error rate was about 6% for crystal class determination. Particularly, the accuracy for Class 1 reaches 98%, as shown in Table 2. It is also seen from Table 2 that the defective particles in Class 3 can be identified with high accuracy. However, because the internal defects are not distinct, the accuracy for Class 4 is just 86%. Additionally, some particles in Class 2 may be misjudged as Class 3. During application, in order to improve the recognition rate, the features set requires full training, as much as possible. Accordingly, the rates of the normal (Class 1) and defective particles (Class 2–4) can be calculated to assess the crystallization quality of the batch.

Table 2.
Classification accuracy.
5. Conclusions
In this work, an online detection method has been developed by utilizing a non-invasive imaging device, enabling us to assess crystal defects in a stirred reactor. The raw crystal images were captured during the crystallization process. Guided filtering is employed to enhance the image quality by effectively reducing image noise. The segmentation method based on MANet is actually utilized to obtain the particles from the images characterized by an uneven background, caused by the illumination light or the movement of particles and solution. Four β-form LGA crystals are categorized for the further evaluation of defective crystals. In conclusion, the experiment results on the crystallization process highlighted the effectiveness of the online defect detection method, including segmentation and classification, in facilitating crystallization control. In fact, crystal classification through 2D image analysis is still a bit inaccurate, especially in regard to internal defects. So, future work will focus on the detection of crystal defects by reconstructing the 3D shape with a binocular vision system.
Author Contributions
Conceptualization, L.D.; methodology, D.G.; software, Y.H.; investigation, L.D. and Y.H.; writing—original draft preparation, Y.H.; writing—review and editing, D.G. All authors have read and agreed to the published version of the manuscript.
Funding
This research was supported in part by the funding project of Northeast Geological S&T Innovation Center of the China Geological Survey, grant number, QCJJ2022-24; in part by the China Postdoctoral Science Foundation, grant number, 2020M680979; and in part by the Basic Scientific Research Project of the Higher Education Institutions of Liaoning Province, grant number, JYTMS20231165.
Data Availability Statement
The original contributions presented in the study are included in the article material, further inquiries can be directed to the corresponding author.
Acknowledgments
We acknowledge Ji Fan for his help during the crystallization experiments.
Conflicts of Interest
The authors declare no conflicts of interest.
References
- Borsos, Á.; Szilágyi, B.; Agachi, P.Ş.; Nagy, Z.K. Real-time image processing based online feedback control system for cooling batch crystallization. Org. Process Res. Dev. 2017, 21, 511–519. [Google Scholar] [CrossRef]
- Yao, T.; Liu, J.; Wan, X.; Li, B.; Rohani, S.; Gao, Z.; Gong, J. Deep-learning based in situ image monitoring crystal polymorph and size distribution: Modeling and validation. AIChE J. 2024, 70, e18279. [Google Scholar] [CrossRef]
- Zhang, R.; Ma, C.Y.; Liu, J.J.; Wang, X.Z. On-line measurement of the real size and shape of crystals in stirred tank crystalliser using non-invasive stereo vision imaging. Chem. Eng. Sci. 2015, 137, 9–21. [Google Scholar] [CrossRef]
- Zhou, Y.; Lakshminarayanan, S.; Srinivasan, R. Optimization of image processing parameters for large sets of in-process video microscopy images acquired from batch crystallization processes: Integration of uniform design and simplex search. Chemom. Intell. Lab. Syst. 2011, 107, 290–302. [Google Scholar] [CrossRef]
- Calderon De Anda, J.; Wang, X.Z.; Lai, X.; Roberts, K.J.; Jennings, K.H.; Wilkinson, M.J.; Watson, D.; Roberts, D. Real-time product morphology monitoring in crystallization using imaging technique. AIChE J. 2005, 51, 1406–1414. [Google Scholar] [CrossRef]
- Zhang, F.; Shan, B.; Wang, Y.; Zhu, Z.; Yu, Z.-Q.; Ma, C.Y. Progress and opportunities for utilizing seeding techniques in crystallization processes. Org. Process Res. Dev. 2021, 25, 1496–1511. [Google Scholar] [CrossRef]
- Larsen, P.; Rawlings, J.; Ferrier, N. An algorithm for analyzing noisy, in situ images of high-aspect-ratio crystals to monitor particle size distribution. Chem. Eng. Sci. 2006, 61, 5236–5248. [Google Scholar] [CrossRef]
- Wang, X.Z.; Roberts, K.J.; Ma, C. Crystal growth measurement using 2D and 3D imaging and the perspectives for shape control. Chem. Eng. Sci. 2008, 63, 1173–1184. [Google Scholar] [CrossRef]
- Borchert, C.; Temmel, E.; Eisenschmidt, H.; Lorenz, H.; Seidel-morgenstern, A.; Sundmacher, K. Image-based in situ identification of face specific crystal growth rates from crystal populations. Cryst. Growth Des. 2014, 14, 952–971. [Google Scholar] [CrossRef]
- Wu, Y.; Lin, M.; Rohani, S. Particle characterization with on-line imaging and neural network image analysis. Chem. Eng. Res. Des. 2020, 157, 114–125. [Google Scholar] [CrossRef]
- Gao, Z.; Wu, Y.; Bao, Y.; Gong, J.; Wang, J.; Rohani, S. Image analysis for in-line measurement of multidimensional size, shape, and polymorphic transformation of l-glutamic acid using deep learning-based image segmentation and classification. Cryst. Growth Des. 2018, 18, 4275–4281. [Google Scholar] [CrossRef]
- Heisel, S.; Ernst, J.; Emshoff, A.; Schembecker, G.; Wohlgemuth, K. Shape-independent particle classification for discrimination of single crystals and agglomerates. Powder Technol. 2019, 345, 425–437. [Google Scholar] [CrossRef]
- Zhang, R.; Ma, C.Y.; Liu, J.J.; Zhang, Y.; Liu, Y.J.; Wang, X.Z. Stereo imaging camera model for 3d shape reconstruction of complex crystals and estimation of facet growth kinetics. Chem. Eng. Sci. 2017, 160, 171–182. [Google Scholar] [CrossRef][Green Version]
- Huo, Y.; Gang, S.; Guan, C. Fcihmrt: Feature cross-layer interaction hybrid method based on res2net and transformer for remote sensing scene classification. Electronics 2023, 12, 4362. [Google Scholar] [CrossRef]
- Krizhevsky, A.; Sutskever, I.; Hinton, G. Imagenet classification with deep convolutional neural networks. Commun. ACM 2017, 60, 84–90. [Google Scholar] [CrossRef]
- Simonyan, K.; Zisserman, A. Very deep convolutional networks for large-scale image recognition. arXiv 2014, arXiv:1409.1556. [Google Scholar]
- He, K.; Zhang, X.; Ren, S.; Jian, S. Deep residual learning for image recognition. In Proceedings of the 2016 IEEE Conference on Computer Vision and Pattern Recognition (CVPR), Las Vegas, NV, USA, 27–30 June 2016; pp. 770–778. [Google Scholar]
- Long, J.; Shelhamer, E.; Darrell, T. Fully convolutional networks for semantic segmentation. IEEE Trans. Pattern Anal. Mach. Intell. 2015, 39, 640–651. [Google Scholar]
- Badrinarayanan, V.; Handa, A.; Cipolla, R. Segnet: A deep convolutional encoder-decoder architecture for image segmentation. IEEE Trans. Pattern Anal. Mach. Intell. 2017, 39, 2481–2495. [Google Scholar] [CrossRef]
- Chen, L.-C.; Papandreou, G.; Kokkinos, I.; Murphy, K.; Yuille, A.L. Semantic image segmentation with deep convolutional nets and fully connected crfs. arXiv 2014, arXiv:1412.7062. [Google Scholar]
- Chen, L.-C.; Papandreou, G.; Kokkinos, I.; Murphy, K.; Yuille, A.L. Deeplab: Semantic image segmentation with deep convolutional nets, atrous convolution, and fully connected crfs. IEEE Trans. Pattern Anal. Mach. Intell. 2017, 40, 834–848. [Google Scholar] [CrossRef]
- Ronneberger, O.; Fischer, P.; Brox, T. U-net: Convolutional networks for biomedical image segmentation. In Proceedings of the Medical Image Computing and Computer-Assisted Intervention—MICCAI 2015, Munich, Germany, 5–9 October 2015; pp. 234–241. [Google Scholar]
- Fan, T.; Wang, G.; Li, Y.; Wang, H. Ma-net: A multi-scale attention network for liver and tumor segmentation. IEEE Access 2020, 8, 179656–179665. [Google Scholar] [CrossRef]
- He, K.; Sun, J.; Tang, X. Guided image filtering. IEEE Trans. Pattern Anal. Mach. Intell. 2013, 35, 1397–1409. [Google Scholar] [CrossRef] [PubMed]
- Wang, J.; Chen, K.; Xu, R.; Liu, Z.; Loy, C.C.; Lin, D. Carafe++: Unified content-aware reassembly of features. IEEE Trans. Pattern Anal. Mach. Intell. 2022, 44, 4674–4687. [Google Scholar] [CrossRef]
- Hinton, G.E.; Srivastava, N.; Krizhevsky, A.; Sutskever, I.; Salakhutdinov, R.R. Improving neural networks by preventing co-adaptation of feature detectors. Comput. Sci. 2012, 3, 212–223. [Google Scholar]
- Clevert, D.-A.; Unterthiner, T.; Hochreiter, S. Fast and accurate deep network learning by exponential linear units (elus). arXiv 2015, arXiv:1511.07289. [Google Scholar]
- Mika, S.; Ratsch, G.; Weston, J.; Scholkopf, B.; Mullers, K.-R. Fisher discriminant analysis with kernels, Neural networks for signal processing IX. In Proceedings of the 1999 IEEE Signal Processing Society Workshop, Madison, WI, USA, 25 August 1999; IEEE: Piscataway, NJ, USA, 1999; pp. 41–48. [Google Scholar]
- Iakubovskii, P. Segmentation Models Pytorch. GitHub Repository. 2019. Available online: https://github.com/qubvel/segmentation_models.pytorch (accessed on 1 January 2024).
Disclaimer/Publisher’s Note: The statements, opinions and data contained in all publications are solely those of the individual author(s) and contributor(s) and not of MDPI and/or the editor(s). MDPI and/or the editor(s) disclaim responsibility for any injury to people or property resulting from any ideas, methods, instructions or products referred to in the content. |
© 2024 by the authors. Licensee MDPI, Basel, Switzerland. This article is an open access article distributed under the terms and conditions of the Creative Commons Attribution (CC BY) license (https://creativecommons.org/licenses/by/4.0/).
