Abstract
This study presents a model of the reaction of a nanocrystalline substance within the gas phase, where diffusion of gas reactants in the volume of the nanocrystallites is a rate-limiting step. According to the model calculations carried out, the rate of diffusion across the phase boundary located on the nanocrystallite surface limits the rate of the process. It was stated that in chemical processes with a phase transformation, the critical concentration of absorbate depends on two factors: the specific active surface area of the adsorbent and the difference in chemical potentials between the gas phase and the equilibrium potential at which the phase transformation occurs. When the actual adsorbate potential in the gas phase is much greater than the equilibrium potential of the nanocrystallite with the largest specific active surface, nanocrystallites undergo phase changes in the order according to their specific active surfaces from the largest to the smallest. In a process where the actual adsorbate potential is close to an equilibrium one, nanocrystallites undergo phase transformation in the order of their specific active surface from the smallest to the largest.
1. Introduction
There is an extensive body of literature on diffusion processes in various types of macroscopic, coarsely crystalline structures [1,2,3,4,5,6,7].
The interaction of ammonia, hydrogen, and nitrogen with an iron surface was studied in order to learn the elementary stages of the catalytic synthesis of ammonia [8,9,10,11,12,13,14,15,16,17,18]. The phase diagram for an iron-nitrogen system was first presented by Jack [19,20]. Lehrer conducted research on the thermodynamic equilibrium in a coarsely crystalline iron-ammonia-hydrogen system. Based on the results obtained, he determined the limits of the individual phases of the iron nitrides, depending on the temperature and composition of the gaseous ammonia-hydrogen mixtures—Lehrer diagram [21]. Thermodynamic studies on nitrogen and carbon in iron and steel were conducted, e.g., by Kunze, Mittemeijer [22,23] and others [24].
The kinetics of the nitriding process of the iron catalyst have been described in previous works [25,26,27,28]. It was found that the concentration of nitrogen in the volume of iron nanocrystallites at a given time in the reaction depends on the ratio of nanocrystallite active surface area S to volume V of nanocrystallite, i.e., on the specific active surface area, A = S/V. The critical concentration necessary for the phase transition of iron-iron nitride will be achieved faster in small nanocrystallites than in large ones. Thus, under kinetic conditions, where the rate of the process is limited by the rate of dissociative gas adsorption over the nanocrystallite surface, iron nanocrystallites undergo phase transformation into iron nitride Fe4N in the order of their sizes from the smallest to largest, along with the progress of the nitriding process. The concentration gradient in the volume of nanocrystallites practically does not occur, and after exceeding the critical concentration, nanocrystallites undergo phase transformation in their entire volume [27].
A model of the reaction between the nanocrystalline solid phase and the gas phase has been proposed [27], in which the rate of the process is limited by the rate of dissociative gas adsorption over the nanocrystallite’s surface, and the diffusion is fast enough for the equilibrium between gas adsorbed on the surface and gas dissolved in the volume of nanocrystallites to be established—a reaction model in the adsorption area.
Methods for determining the mass and size distribution of nanocrystallites (grain mass distribution, GMD; grain size distribution, GSD) have been proposed [26,27,28]. Using the methods, the relative size distribution of iron nanocrystallites, by their specific active surface area, was determined in the industrial ammonia synthesis catalyst [26,28], with greater accuracy compared to previous, commonly used methods. It was observed that the tested catalyst was characterized by a bimodal size distribution of iron nanocrystallites.
In the process of the nitriding of nanocrystalline iron, stationary states were identified [29,30], in which the rate of catalytic decomposition of ammonia rd = const, the rate of nitriding reaction rn = 0, and the maximum conversion mn of nanocrystalline material was a function of temperature and the nitriding potential P = pNH3/pH23/2 (pNH3, pH2—partial pressures of ammonia and hydrogen, respectively) in the gas phase. In steady states, there may be single-phase systems (one crystallographic phase—α-Fe(N) or γ’-Fe4N) as well as two-phase systems (α-Fe(N) + γ’-Fe4N). It has been observed that in stationary states established at increasingly higher nitriding potentials, along with increasing the conversion degree, nanocrystallites undergo a phase transformation in the reverse order compared to kinetic measurements, i.e., according to size from the largest to the smallest [29]. It was found that the sum of the chemical potential of nitrogen and the surface energy balances the deformation potential of the iron crystal sub-lattice at the phase transformation from α-Fe(N) to γ’-Fe4N [29].
In steady-state conditions in a two-phase system, the occurrence of hysteresis was observed for the dependence of the degree of conversion on the nitriding potential for nanocrystalline iron nitriding and the reduction of formed nitrides [30]. Depending on the direction of the reaction (nitriding or reduction), nanocrystallites undergo a phase transition at different gas-phase chemical potentials. It was found [30] that the chemical potential of the gas phase was equal to the potential of nitrogen in the iron/iron nitride nanocrystallites. Critical nitriding potentials at which nanocrystals of various sizes undergo phase transformation in the processes of nitriding P0n and reduction in the nitrides formed P0r were determined to be P0n > P0r.
The mechanisms of the nanocrystalline iron nitriding and reduction processes for the obtained nitrides were explained together with the thermodynamic foundations of the hysteresis phenomenon [30]. It was found that the coexistence of two crystallographic phases side-by-side (α-Fe(N) + γ’-Fe4N) is consistent with the Gibbs phase rule after taking into account the parameter relating to the size of the nanocrystallite as an additional degree of freedom. The critical nitriding potentials in the processes of nanocrystalline iron nitriding and nitride reduction are directly proportional to the specific active surface area of nanocrystallites.
The adsorption kinetic model describes a system well if the adsorption rate is much lower than the rate of the phenomena occurring in the volume of the nanocrystallite. This paper presents a new model of the reaction of a nanocrystalline substance within the gas phase in a case where the reaction rate-limiting step is the rate of diffusion in the solid phase.
2. Results and Discussion
The solid-phase diffusion process was described in detail in Crank’s extensive study [1]. Based on the relationships presented there, it is possible to describe the kinetics of processes between the gas and solid phases in relation to processes occurring in nanocrystalline materials. It was assumed that:
- -
- The diffusion coefficient D does not depend on the concentration of absorbate and its value can be expressed by the relationship:
D = D0 exp(−Ea/RT)
- -
- Between gas phase and a solid state there are established chemical equilibrium states, at which the chemical potentials of sorbate in the gas phase μg, adsorbate on the crystallite surface μs, and absorbate in the crystallite volume μb are equal:
μg = μs = μb
μs = Es− − RT ln (K2D ln PB)
μg = 2μb
In a system with an unlimited solubility of a sorbate, an equilibrium state is established between the surface of the nanocrystallite and the gas phase; therefore, the molar surface concentration as of the adsorbate and the molar bulk concentration ab of the absorbate correspond to the chemical potential P of this component in the gas phase:
where Kads—equilibrium constant of the adsorption process, and Kabs—equilibrium constant of the absorption process.
ln as = Kad lnP
ln ab = Kab lnP
ln as/ln ab = Kseg lnP
The free enthalpy values in the state of chemical equilibrium are expressed by the equations:
where a—activity of a component, G—free enthalpy, R—gas constant, T—temperature, K—equilibrium constant; superscripts g, s, and b—correspond to gas, solid, and bulk, respectively.
Gg/ag = Gs/as = Gb/ab
lnKg/ag = lnKs/as = lnKb/ab
- -
- The process occurs in the kinetic area and the rate-limiting step is the adsorbate diffusion rate from the surface to the volume of nanocrystalline absorbent;
- -
- At low values of the concentration of the absorbate solution in the absorbent, Equation (5) is satisfied:
xb = nabb/nb = Kab* P
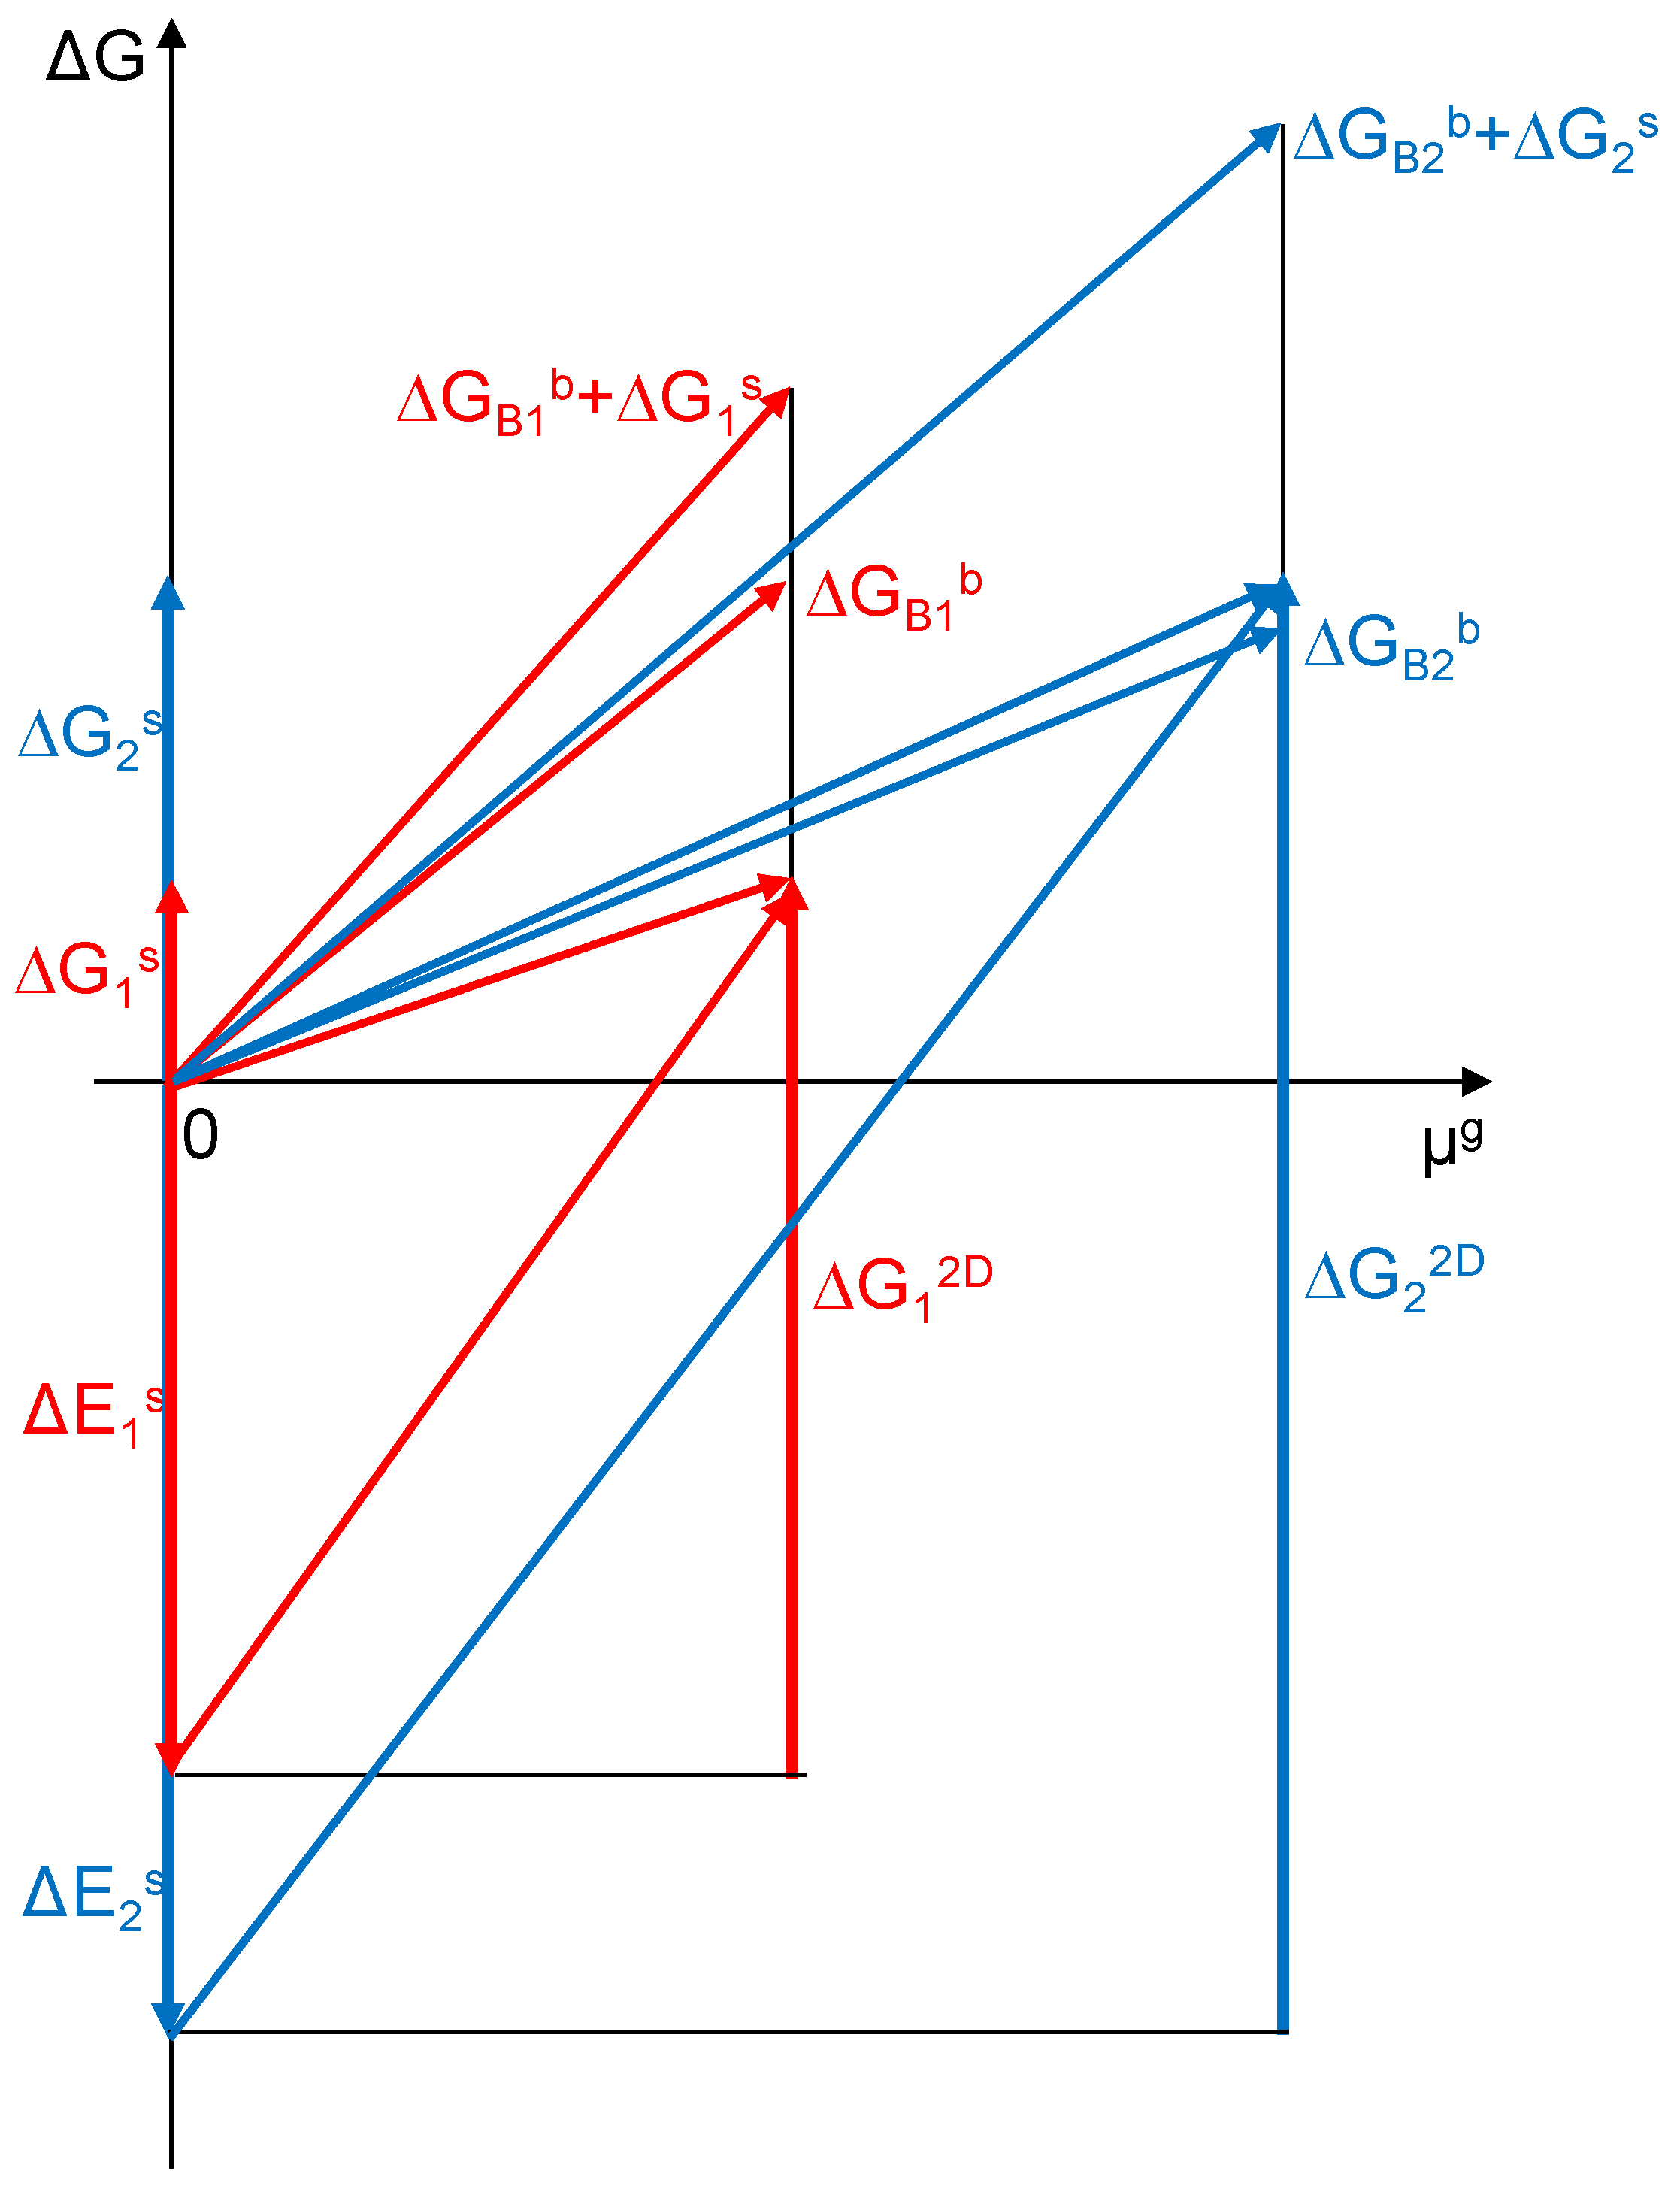
During the process of creating dispersed structures, the surface endoenergetic effect associated with the creation of a free α phase surface ΔEs = Es− aAs,max/aAb is balanced by the sum of the exoenergetic effects ΔGb + ΔG2D (Figure 1). The creation of two-dimensional structures on the resulting surface, as an exothermic process, can be represented as the vector ΔG2D. Thus, the sum of energies associated with surface transformations can be expressed as ΔGs = ΔEs − ΔG2D. Both the free enthalpy of the α solution formation ΔGb and the free enthalpy of creating 2D structures ΔG2D are functions of the chemical potential of the gas component. As a result of establishing equilibrium in the dispersion process, smaller crystallites are formed with a specific active surface area under constant formation conditions of temperature and chemical potential of component B.
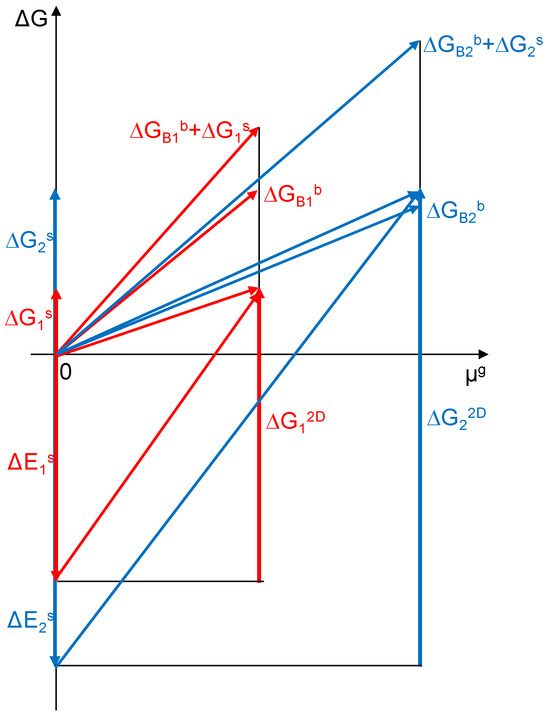
Figure 1.
Changes in energy in the process of dispersion of a coarsely crystalline substance and the formation of surface structures of the α-A(B) phase in a state of thermodynamic equilibrium for two crystals of different active specific surface areas (a = 0.300 nm−1 blue color and 0.075 nm−1 red color).
The relationship describing ΔG2D for the adsorption process is as follows:
where R—gas constant, T—temperature, and Kads—adsorption process equilibrium constant related to activities of a component.
ΔG2D,ads = −RTaAs,max ln (Kadsln PB) + ΔEs
Similarly, one can derive relationships describing ΔG2D for other processes:
- -
- Segregation:
ΔG2D,seg = −RTaAs,max ln (Kads/Kabs ln PB) + ΔEs
- -
- Wetting:
ΔG2D,wet = −RTaAs,max ln (KsublKadsln PB) + ΔEs
In general, we obtain:
where K2D—equilibrium constant of the process of forming 2D monolayer of component B on the surface of phase α-A(B).
ΔG2D = −RTaAs,max ln (K2Dln PB) + ΔEs
The free enthalpy of solution formation ΔGBb is given by:
ΔGBb = −RTaBb lnPB
After substituting Equations (6d) and (7):
ΔGBb + ΔG2D = −RT(aBb lnPB − aAs,max ln (K2Dln PB))
According to the energy balance, smaller crystallites (blue color in Figure 1) require more energy to maintain their nanostructure when compared to larger crystallites (red color in Figure 1). Due to the different values of active specific surface areas and different ratios of surface area to volume for different crystallites, the free enthalpy connected with the surface phenomena ΔG2D and connected with phenomena in the bulk of crystallite ΔGBb for the total energy of the crystallite will differ and the impact on ΔG2D will be greater for smaller crystallites.
Using a graph of energy changes for the process of dispersion of a coarsely crystalline substance and the formation of surface structures of the α-A(B) phase in thermodynamic equilibrium (Figure 1), the slope of the line representing the change in the energy of the system together with the change in the PB potential is determined by the relationship:
2.1. Kinetics of the Reaction in Solid Solution
Based on the literature data [31], the actual diffusion coefficients for carbon, nitrogen, and oxygen in metals in the temperature range of 200–500 °C are within the range of 10−14–10−12 m2/s. A constant value of the diffusion coefficient in the volume of the sorbate nanocrystallite D = 10−13 m2/s was assumed for model calculations.
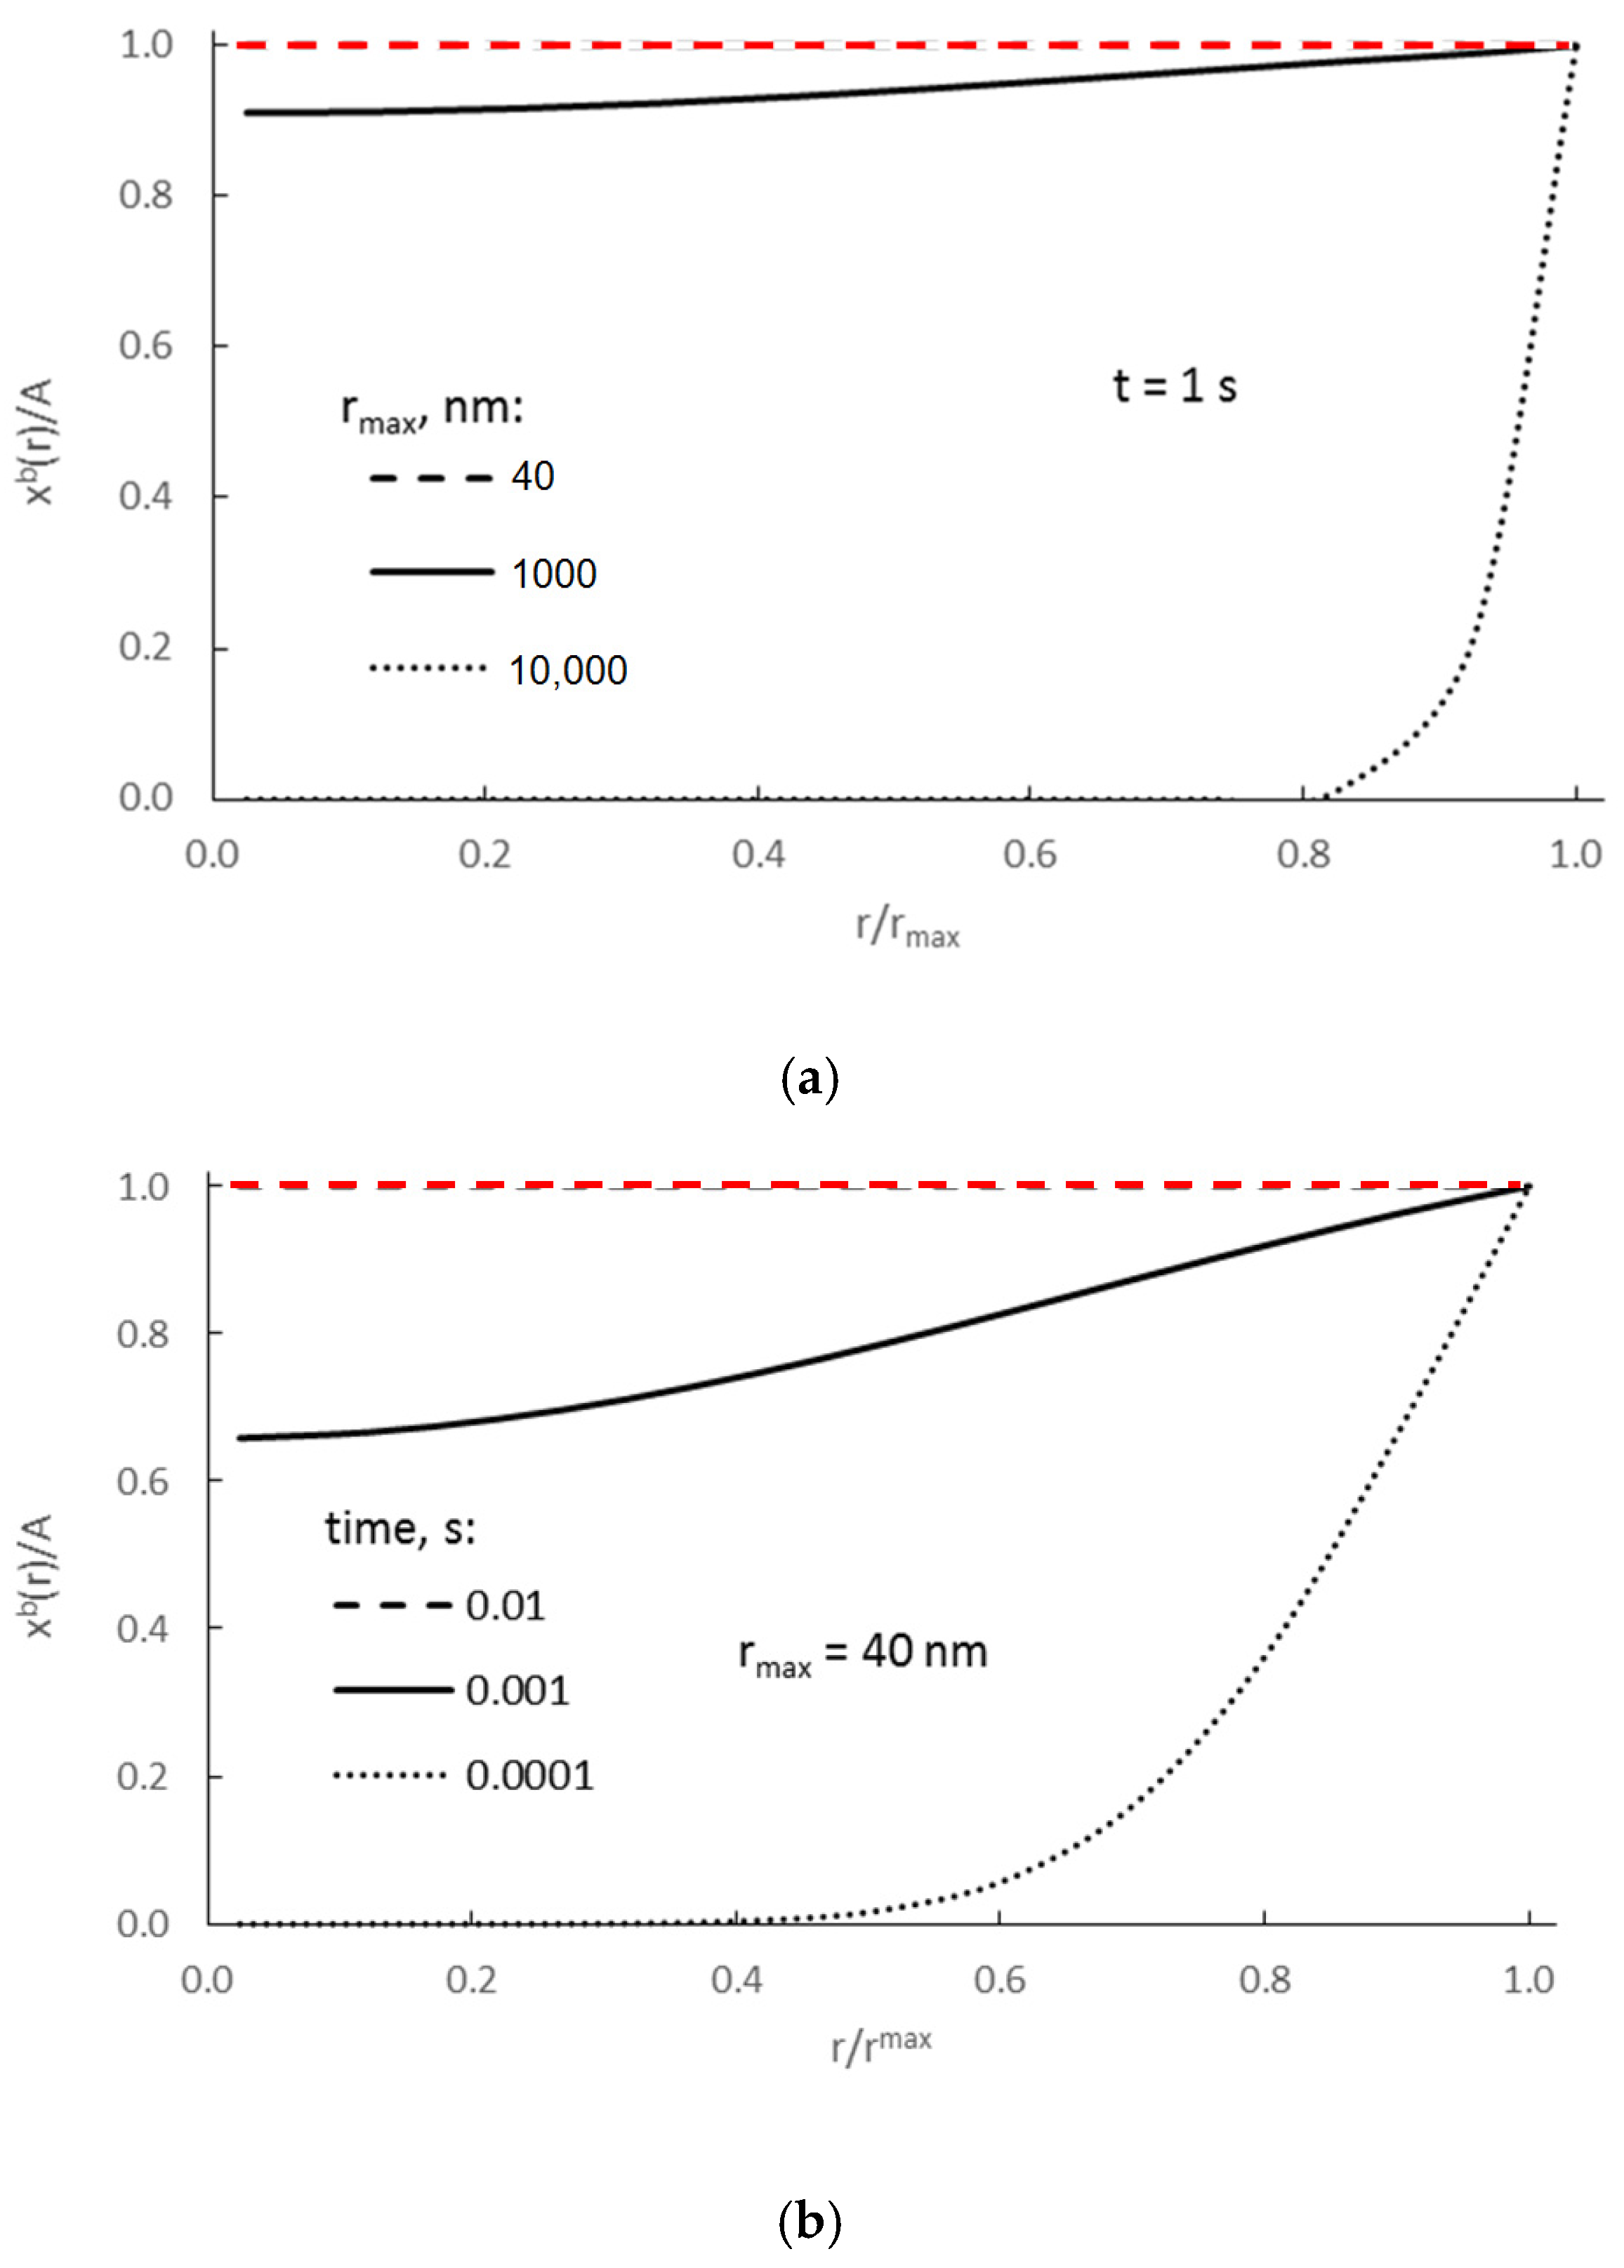
In order to determine the effect of the diffusion rate in the volume of nanocrystallite on the process rate in a solution with unlimited solubility of absorbate, model calculations of concentrations in the volume of a spherical nanocrystallite (with radius rmax in spheres with different radii r ∈ (0, rmax>) at constant gas-phase potential and surface concentration of adsorbent were performed using the equation proposed by Crank [1] and here modified to the following form:
where t—time, xb—molar concentration of absorbate, and n—number of spheres in nanocrystallite (assumed n = rmax/a), a—lattice constant.
Figure 2 shows the results for crystallites of various sizes at a constant molar concentration of adsorbate on the surface for a defined, constant maximum potential Pmax, assuming that ΔGseg = 0.
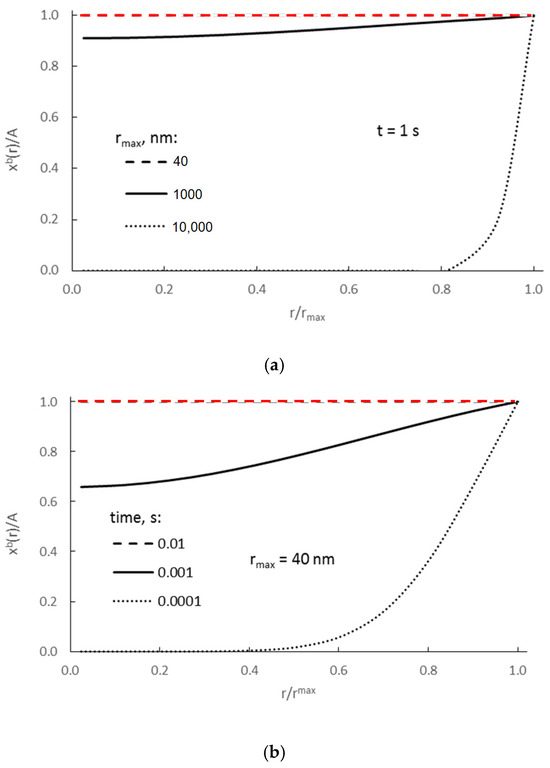
Figure 2.
(a) Dependence of absorbate concentration on the distance from the center of nanocrystallite r ∈ (0, rmax>), after 1 s for crystallites with radii (nm) 40, 1000, and 10,000, and (b) after three different process times (crystallite with a radius rmax = 40 nm) (D = 10−13 m2/s).
From Figure 2a it can be concluded that for nanocrystallites of r = 40 nm, concentrations within their whole volume equilibrate and reach maximum values in less than 1 s (red, dashed line in Figure 2a). If we more precisely consider the process of equilibration of those concentrations in nanocrystallites of r = 40 nm (Figure 2b), we may state (based on model calculation results) that the time needed to equilibrate the concentration in the volume of such nanocrystallite is 0.01 s (red, dashed line in Figure 2b).
That model value r = 40 nm is based on the results of our measurements using scanning electron microscopy. According to these results, the largest iron nanocrystallites in the tested samples had diameters of approximately 80 nm. Our intention is to determine the values of characteristic parameters primarily for the largest nanocrystallites as those representing the end of the chemical reaction—if these large nanocrystallites undergo a phase transformation over time, smaller ones will undergo this transformation faster.
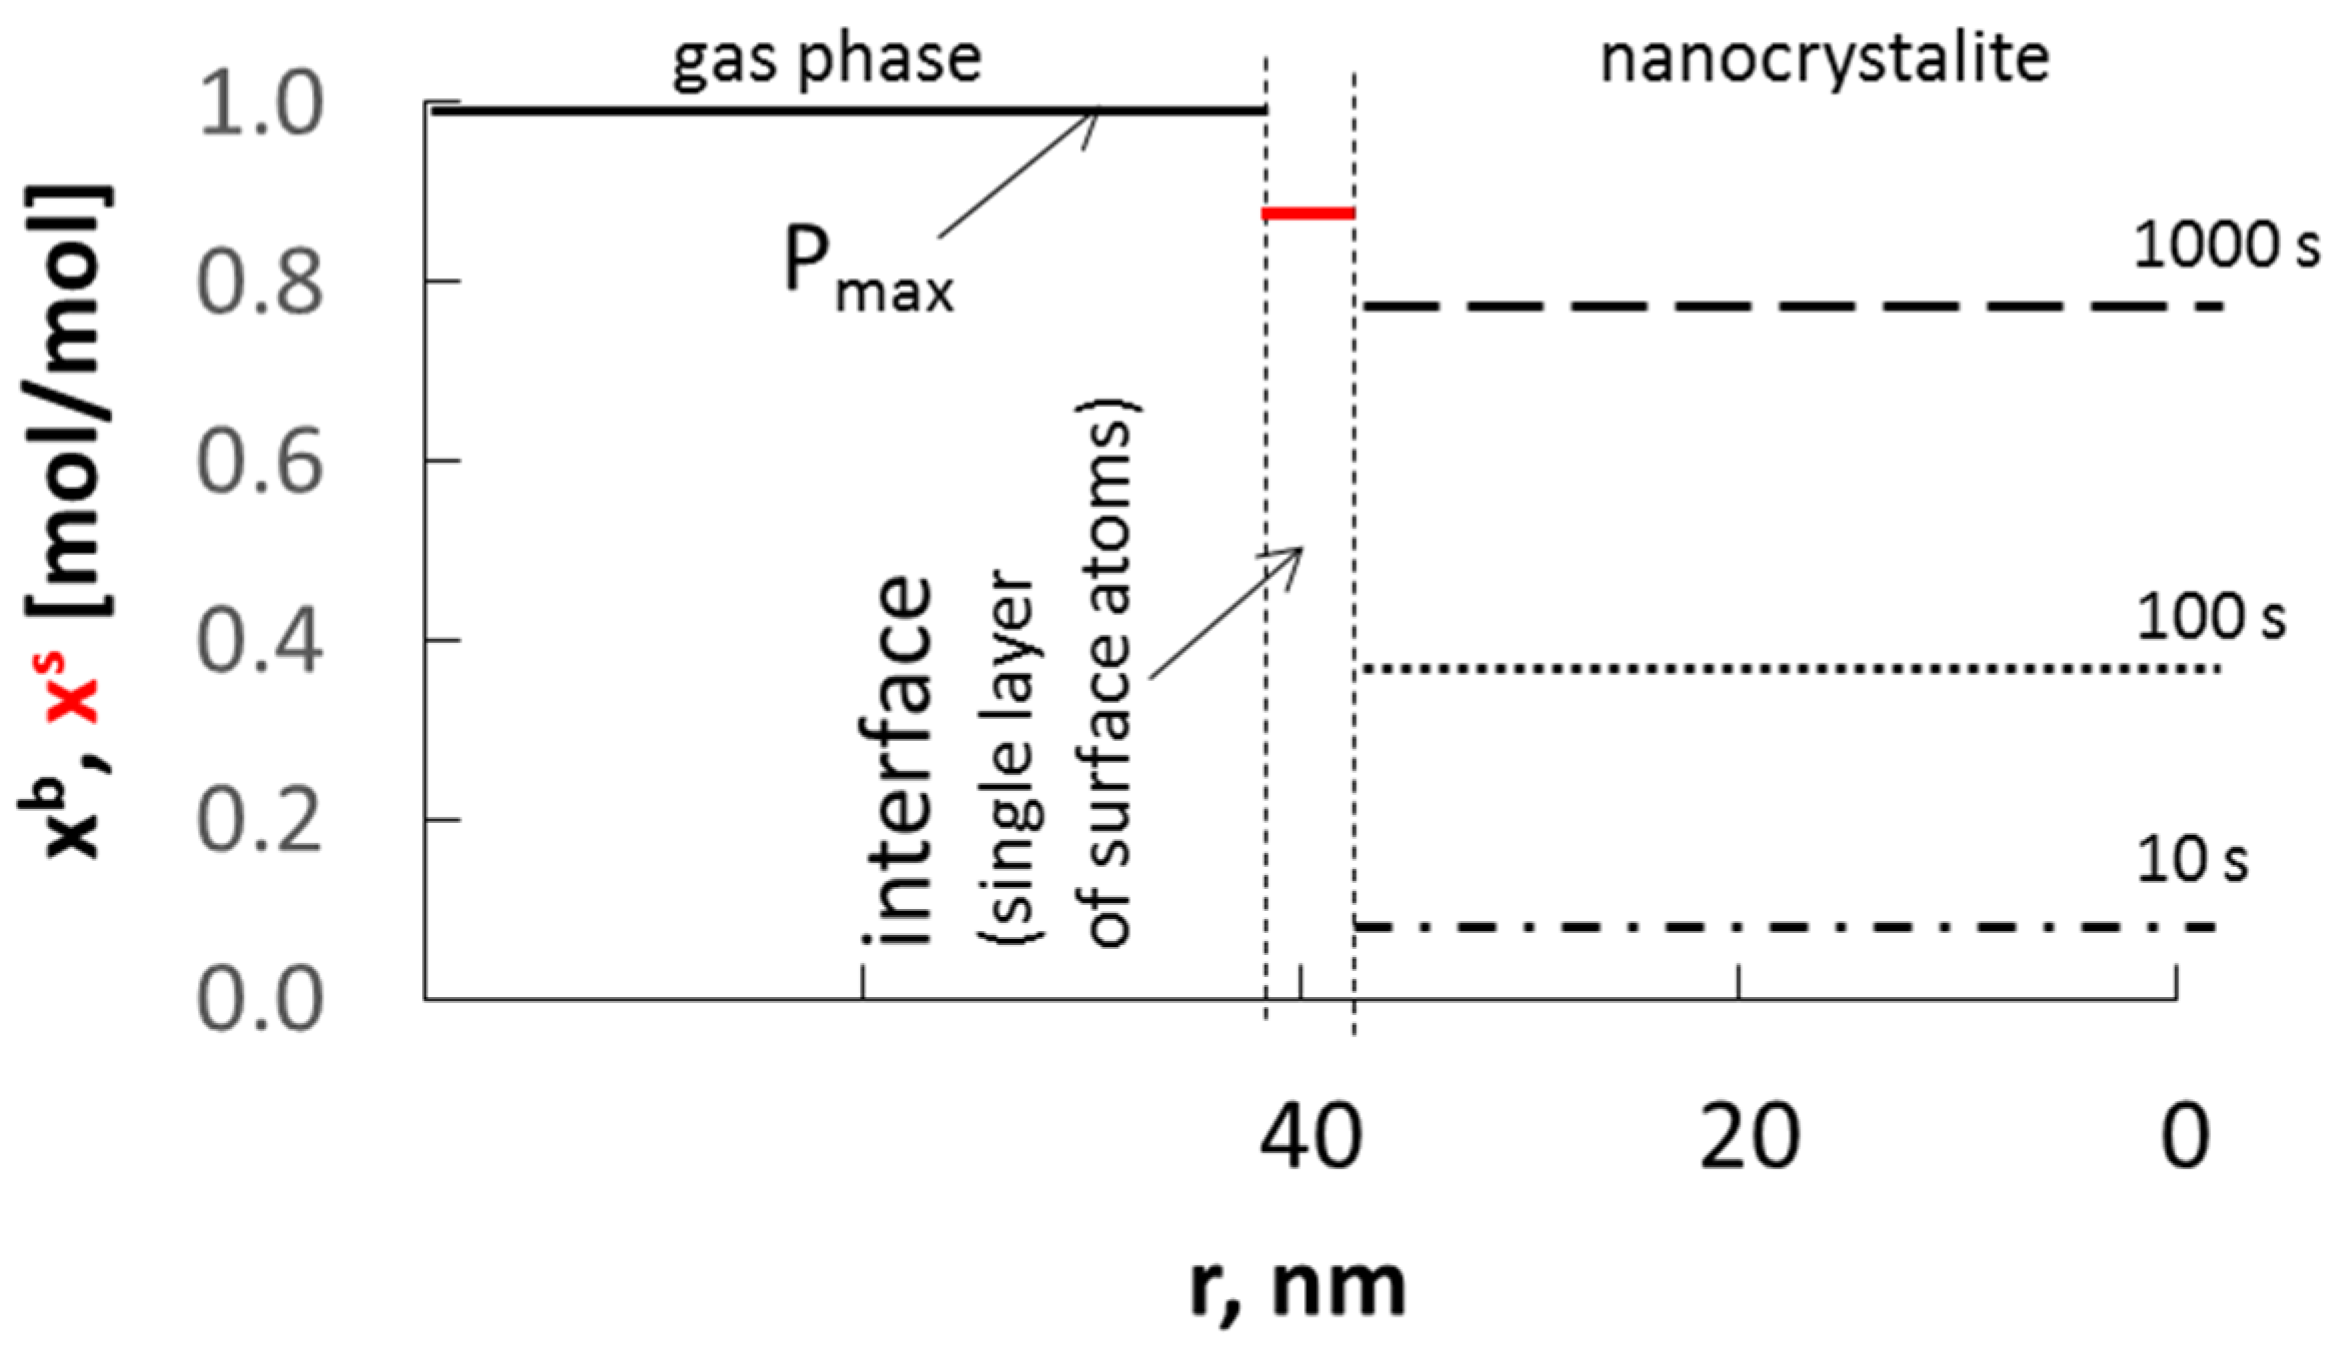
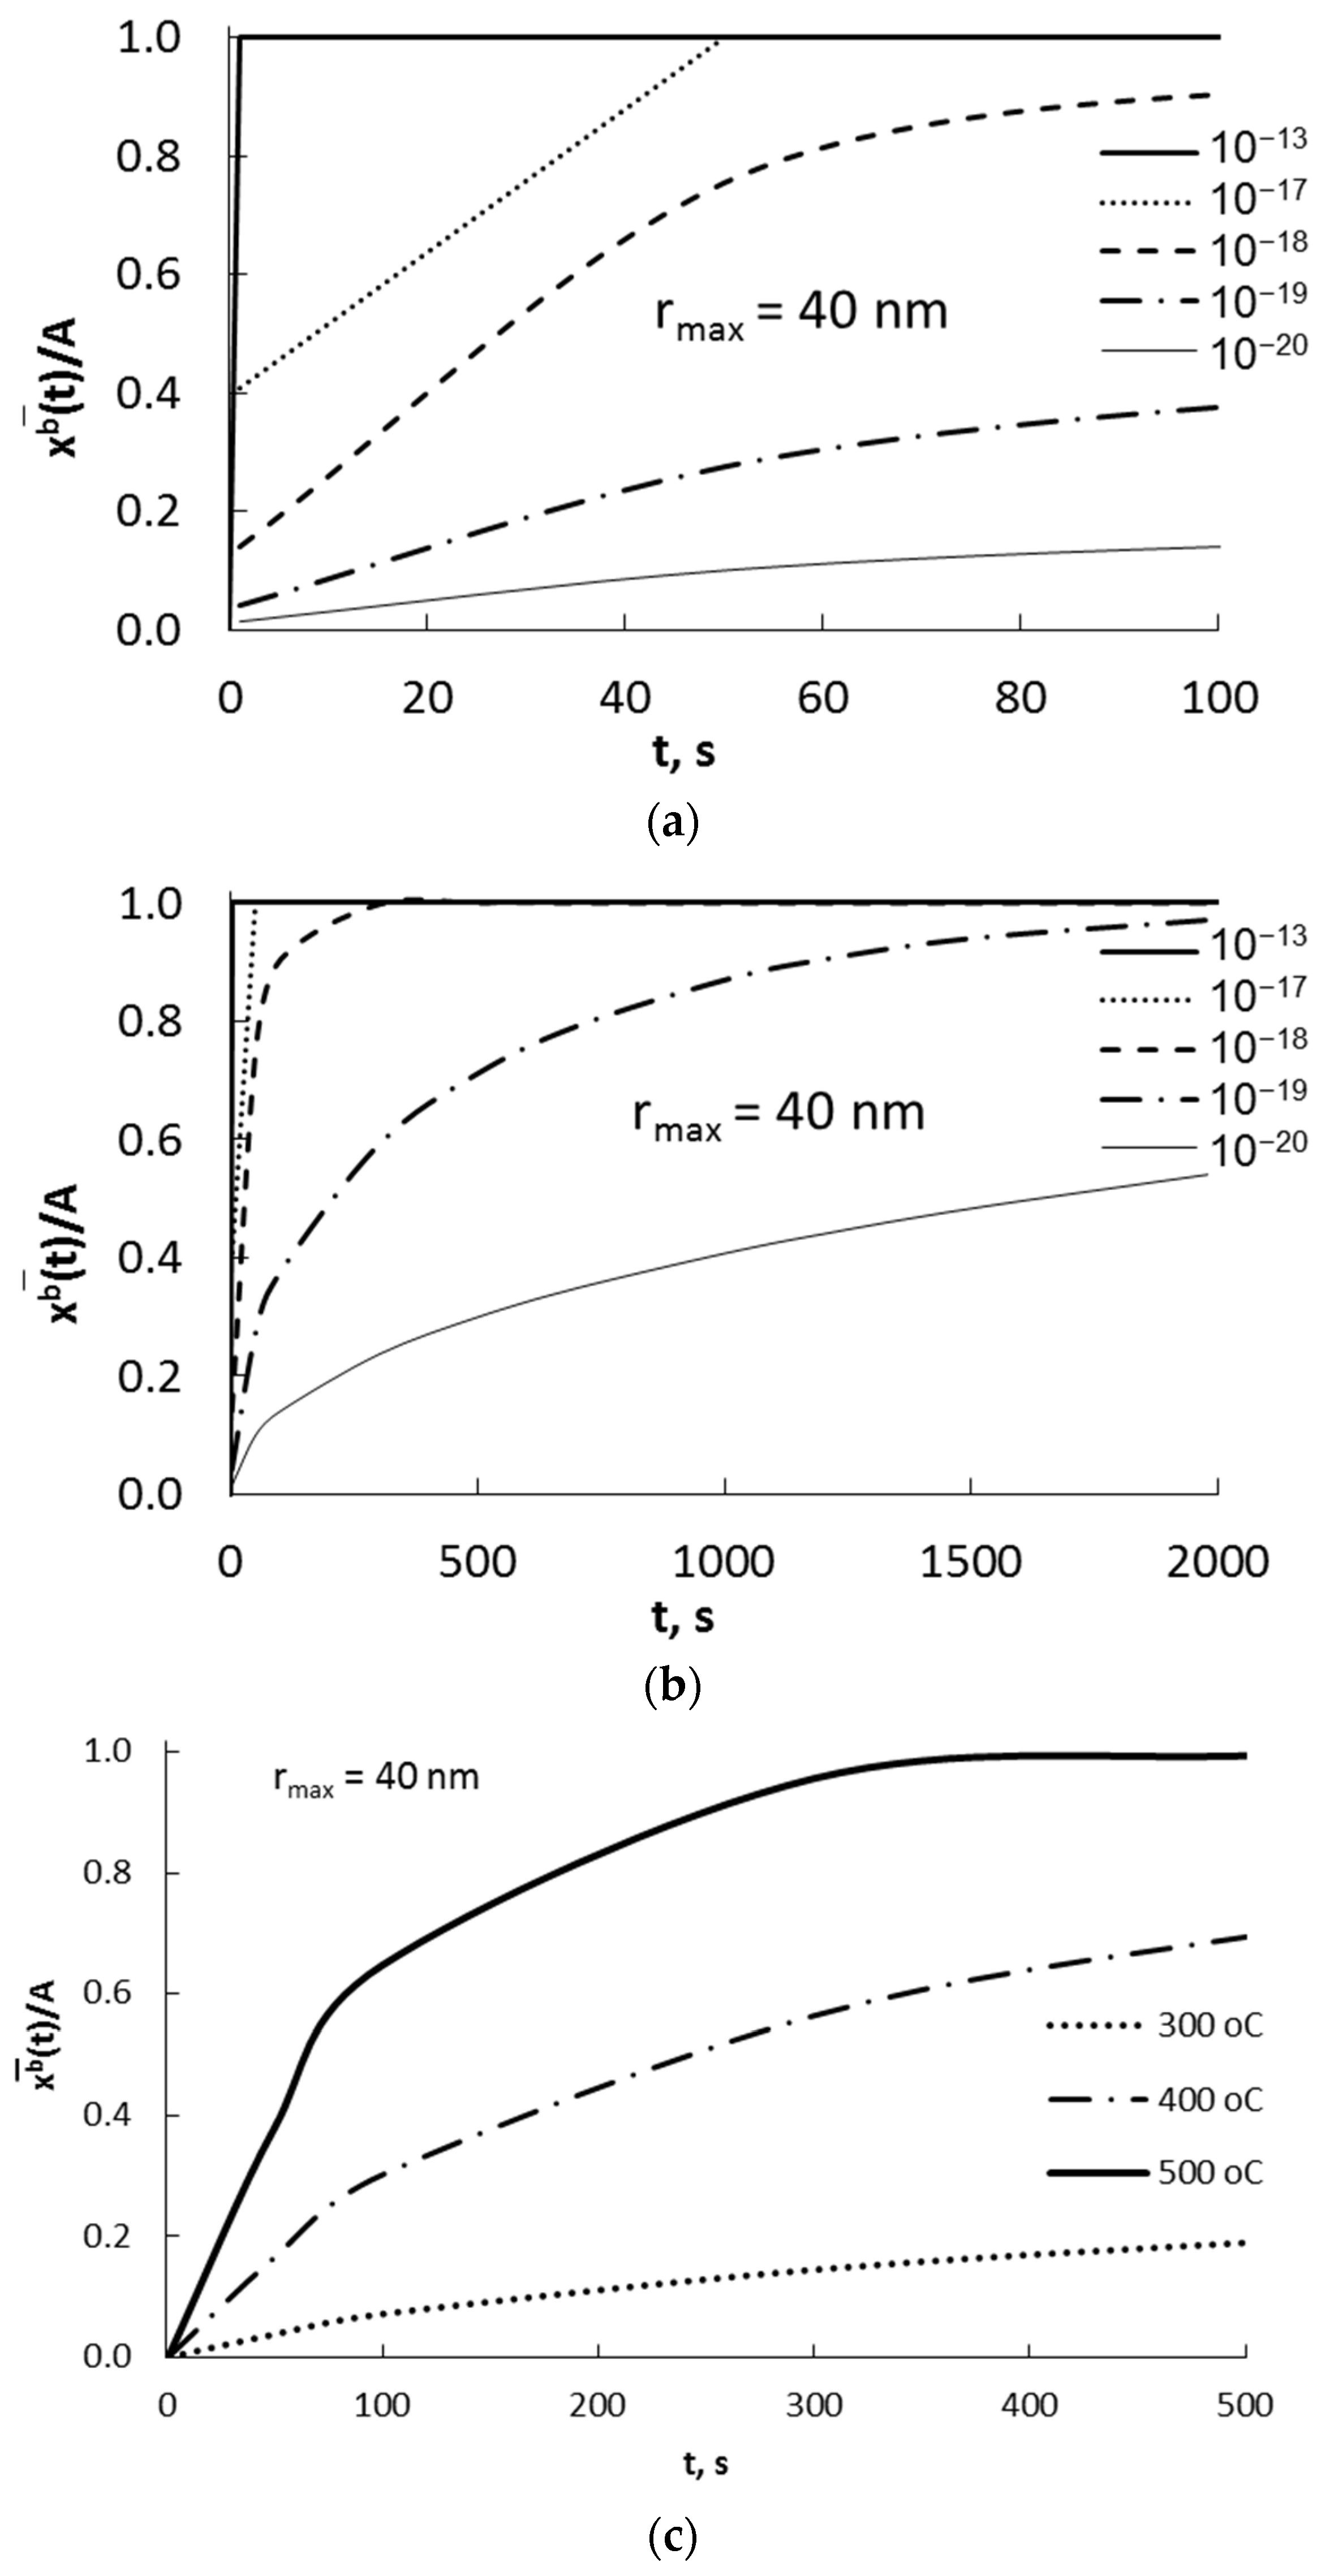
Based on the assumptions made so far, the schematic dependence of the absorbate concentration in nanocrystallite volume xb on the process time and nanocrystallite radius was presented at a constant surface concentration of adsorbate xs and with a diffusion coefficient of D = 10−19 m2/s at the interface composed of single layer of atoms of solid phase (Figure 3).
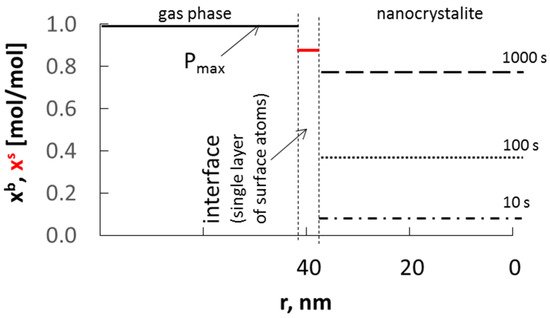
Figure 3.
Dependence of absorbate concentration in nanocrystallite (of radius 40 nm) volume xb, on time at a constant surface concentration xs, and with a diffusion coefficient of D = 10−19 m2/s.
The surface concentration will be greater than the equilibrium concentration determined by the equilibrium between the surface area and the volume of the nanocrystallite. The recrystallization of the substrate phase to the product phase will take place after reaching the average surface and volume concentration of sorbate in the nanocrystallite, corresponding to the critical concentration in its entire volume. The rate at which the nanocrystallite saturates depends on the difference in surface concentration and the concentration in volume of the nanocrystallite.
In the solid phase, a constant level of absorbate concentration is quickly established at a constant maximum during the experiment at the adsorbate potential in the gas phase Pmax.
Extensive research on diffusion and a thorough arrangement of various equations and models describing this process can be found in the work [32]. This work extends the scope of application of the presented models to nonlinear multicomponent diffusion, taking into account the kinetics of the chemical reactions in various states of matter. In the current work, we focused on processes involving chemical reactions in the solid phase, which is an attempt to answer one of the questions posed in the conclusions by the authors of the work [32] on diffusion and chemical reactions in such systems. Additionally, we assumed that the rate-limiting step of the process is the passage of atoms adsorbed on the surface into the volume of iron nanocrystallites through a single surface layer of iron atoms (the diffusion of the dissolved component in the volume of nanocrystallites is much faster and a product layer is not formed on the disappearing core as in the shrinking core model) [33].
The average molar concentration of a substance dissolved in the entire volume of nanocrystallite as a function of time was calculated using Equation proposed by Crank [1]:
Using Equation (11), the dependence of the average molar concentration of absorbate in a nanocrystallite with a radius of 40 nm on the time with diffusion coefficients D = 10−20–10−13 m2/s is presented in Figure 4a,b and for different temperatures in Figure 4c.
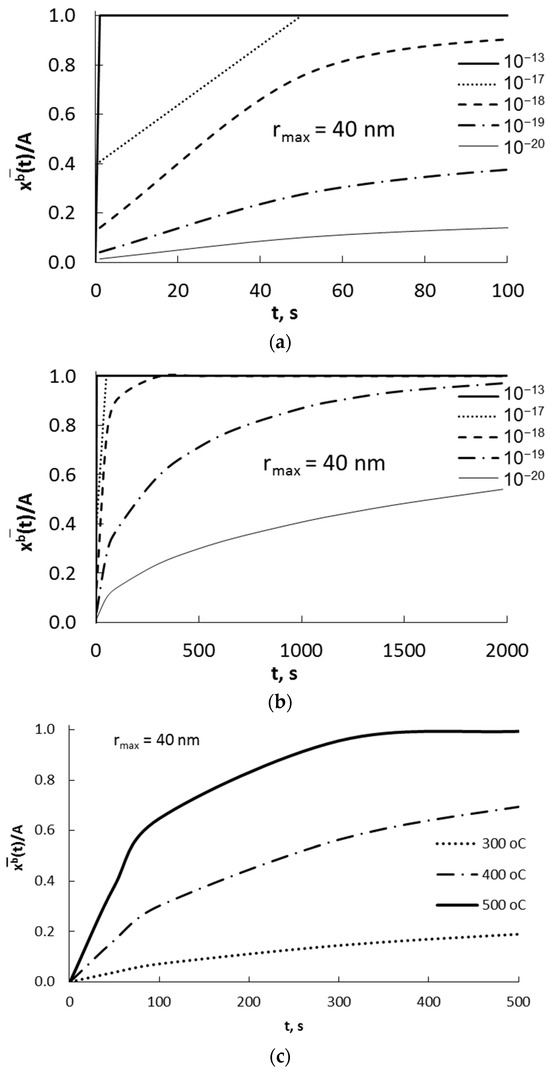
Figure 4.
Dependence of the average concentration of absorbate in a nanocrystallite with a radius of 40 nm on time (a,b) for diffusion coefficients in the range of D = 10−20–10−13 m2/s, T = 400 °C; (c) for different temperatures (D = 10−19 m2/s).
It was found that for a diffusion coefficient of 10−13 m2/s (typical for coarse-crystalline materials) in nanocrystalline materials, the concentration of absorbate and the concentration of adsorbate on the surface of the nanocrystallite were equalized in a very short period of time (Figure 4a). For a diffusion coefficient of 10−19 m2/s, the steady state absorbate concentration was reached over a period of about 2000 s (Figure 4b).
A significant difference in the values of diffusion coefficients leads to the conclusion that the stage limiting the rate of the process is the rate of diffusion of the adsorbate from the surface across the phase interface into the nanocrystallite volume. The adsorbate must overcome not only the energy barrier related to the vibrations of the lattice but also the barrier related to the dissolution of the absorbate in the crystallite volume. Equation (1) will change its form:
where Ea—activation energy of diffusion through the crystallite surface, and ΔGdis = −ΔGseg—enthalpy of dissolution of the adsorbate in the volume of nanocrystallite.
D = D0 exp[−(Ea + ΔGdis)/RT]
The effect of the change in Ea + ΔGdis and the temperature on the change in concentration over time is shown in Figure 4b.
The rate of the chemical reaction between the gaseous substance and one nanocrystalline solid of α phase can be described taking into account the influence of three parameters on the course of the chemical reaction: temperature, chemical potential of the gas phase, and nanocrystallite size distribution:
For a single nanocrystallite, the reaction rate can be described as:
From Equations (12) and (13) and taking into account Equation (14), we obtain:
The measured reaction rate is the sum of the process rates on individual i-th nanocrystallites in the sample:
The actual system consists of a set of crystallites described by the probability density distribution of their sizes characterized by the specific surface area of the crystallite A = S/V. It was assumed in this paper that this is a bimodal distribution consistent with experimental tests [25,26,28,29,30] and model calculations [29,30] for the nanocrystalline iron-ammonia-hydrogen system.
The dependence of the total concentration of the absorbate in the volume of sample of nanocrystallites xb on temperature, chemical potential of the gas phase, and crystallite size can be described by continuous functions as follows:
In the area of one α phase and at constant temperature as well as at constant potential of the gas phase, the averaged reaction rate is as follows:
where C1, and C2—constants taking into account the influence of temperature and gas-phase potential on the reaction rate.
2.2. Kinetics and Thermodynamics of a Solution at Different Constant Potentials of the Gas Phase
Assuming ΔGseg = 0, the chemical compositions of the surface and volume at equilibrium are equal to each other. The dependence of concentration in volume xb on the time, based on Equation (11) for different constant potentials (0.25, 0.50, 0.75, and 1.00), is shown in Figure 5.
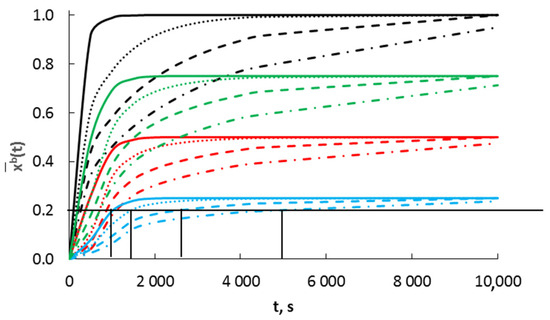
Figure 5.
Dependence of absorbate concentration on time for crystallites with radii (nm)  10,
10,  20,
20,  30 and
  40, at four different gas-phase potentials (
 0.25,
0.25,  0.50,
0.50,  0.75 and
  1.00), diffusion coefficient D = 10−19 m2/s.
10, 20, 30 and 40, at four different gas-phase potentials ( 0.25, 0.50, 0.75 and 1.00), diffusion coefficient D = 10−19 m2/s.
The gas-phase potential determines the surface concentration related to the specific surface area. In the kinetic region of the process, the concentrations in the crystallite volume are a function of the gas-phase potential and the crystallite radius. Crystallites reach a certain concentration in the order of their radii from the smallest to the largest. After an infinitely long time, the state of chemical equilibrium is established, where Equation (2) is satisfied for each crystallite size. The maximum concentration of the adsorbate in the surface layer xsmax and the absorbate in the crystallite volume xbmax are equal to each other and are a function of the gas-phase potential only.
2.3. Thermodynamics and Kinetics of the System with Phase Transformation (Two-Phase System)
With the chemical potential of the adsorbate in the gas phase P0(A)i and depending on the specific active surface area of the i-th nanocrystallite at the critical concentration, xb,cri, the i-th nanocrystallite of the α phase undergoes a phase change α→β in its entire volume. At this potential, the phase β is formed with the concentration xib,β,min and the maximum concentration of defects xDmax (Figure 6). The defect concentration is equal to the difference between the maximum absorbate concentration in the β phase and the minimum absorbate concentration in this phase after the transition from the α phase:
xDβ = xiβ,cri − xiβ,min = −xβ
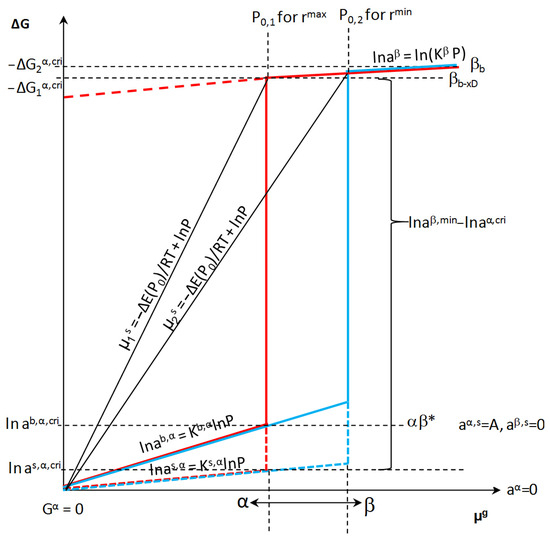
Figure 6.
Dependence of free enthalpy of the component in the crystallite volume on the component potential in the gas phase at constant temperature (β* represents unsaturated β phase).
At constant chemical potentials and after an infinitely long time, the state of chemical equilibrium is established, characterized by a specific equilibrium potential of the gas phase, activities in the solid phase on the surface and in the volume, process temperature, and specific active surface (Figure 6). The phase transformation of the α phase occurs when the critical values are taken into account in Equation (3):
where as,cri—critical activity at the surface, ab,cri—critical activity in crystallite volume, and P0—equilibrium potential of the gas phase.
ln as,cri = Kad lnP0
ln ab,cri = Kab lnP0
Assuming that the reference conditions are the process conditions (constant temperature and zero chemical potential of the gas phase), the change in free enthalpies can be replaced by the values of free enthalpies of sorbate in the individual phases:
For small concentrations, a simplification can be used:
The ratio of the equilibrium constants under phase transition conditions is as follows:
According to the balance (26), the phase transformation takes place at a constant energy of the system, i.e., the sum of the free enthalpies: of deformation of the crystal lattice in the α phase volume in the absorption process ΔGα→β, of a component dissolved in the nanocrystallite volume ΔGb, of a chemisorbed component on the nanocrystallite surface ΔGs; and the change in surface energy of nanocrystallite ΔE is equal to zero and Equations (26)–(28) are also satisfied [29]:
−ΔGα→β + ΔGb + ΔGs + ΔE = 0
For low gas-phase potentials:
Due to the interactions between the atoms adsorbed on the adsorbent surface, for high concentrations of the adsorbate, Equation (28) will take the form:
The change in surface energy at high adsorbate concentrations is expressed as:
wherein
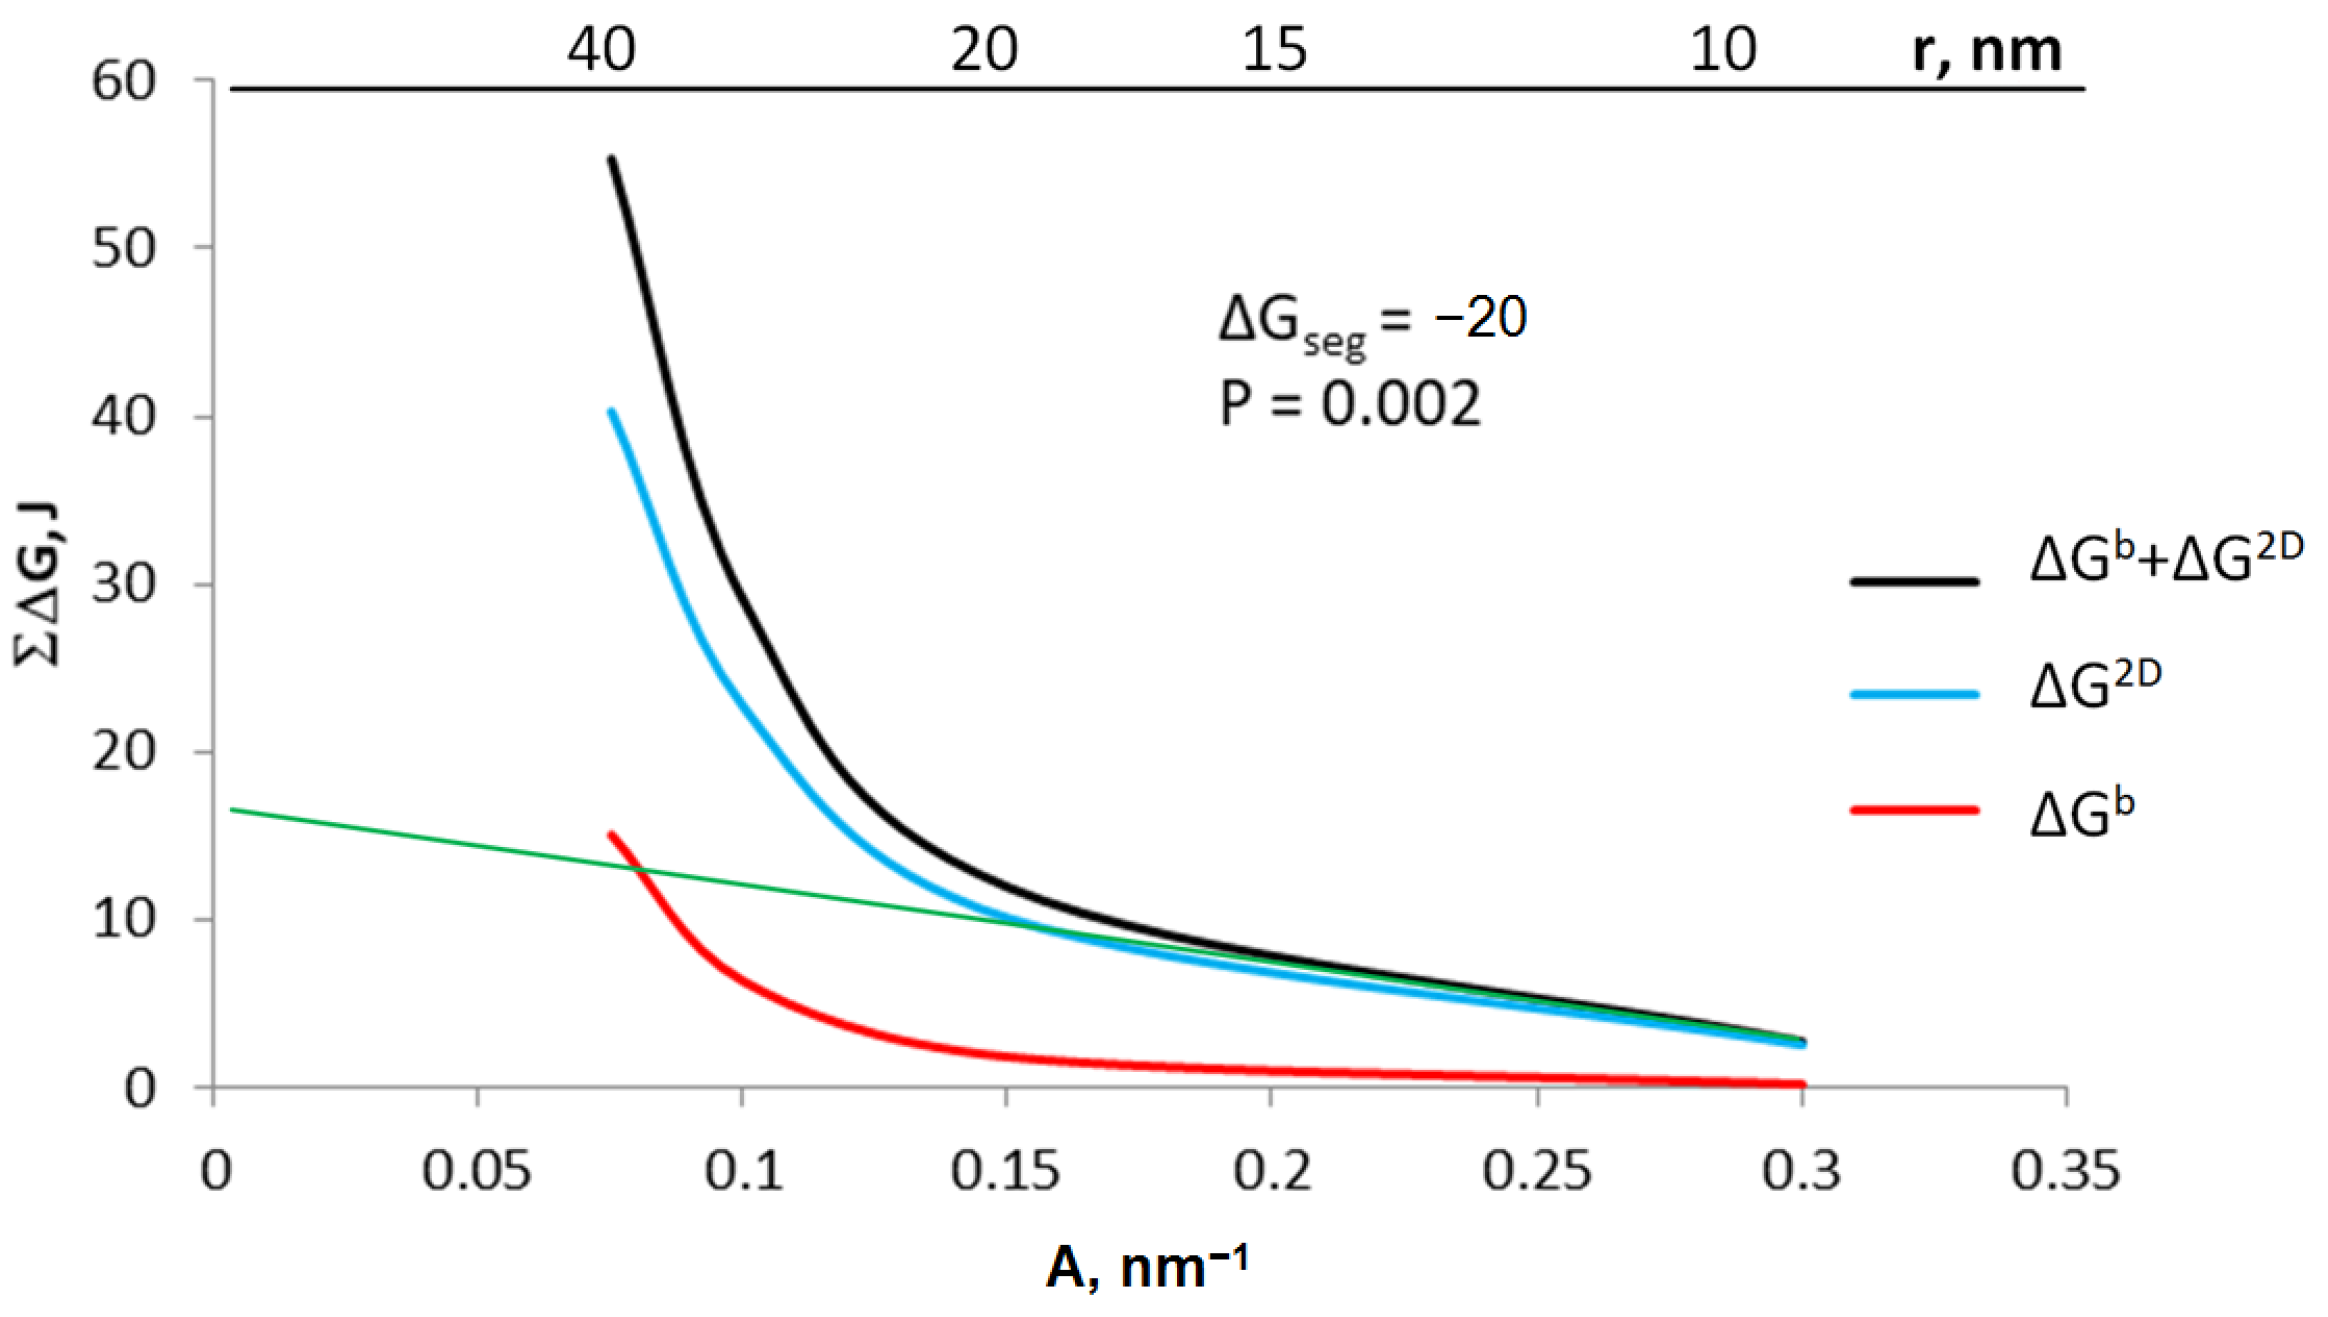
Based on the Equation (8), the sum of ΔGb + ΔG2D was calculated for crystallites with specific active surfaces in the range of 0.075–0.300 nm−1 (Figure 7). The graph also shows the values of ΔG2D and ΔGb for individual crystallites calculated on the basis of the Equations (4b) and (5), respectively, with a gas-phase potential of 0.002 and segregation free enthalpy ΔGseg = −20 kJ.
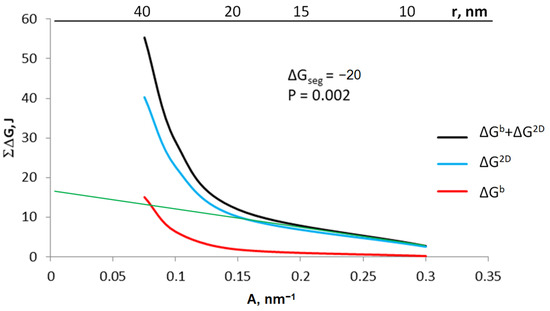
Figure 7.
The sum of energy related to the surface and volume of the crystallite as well as the share of area and volume in this sum for the potential of 0.002 and the free enthalpy of segregation −20 kJ; green line: extrapolating the sum of energy to conditions of coarse-crystalline substances.
The proportion of free enthalpy related to the crystallite surface of the total free enthalpy of the system is 97% for a crystallite with a radius of 20 nm. Thus, it can be assumed that smaller crystallites can be treated as nanocrystallites, and larger crystallites will have properties corresponding to coarse-crystalline substances. Based on Equation (6d), knowing the enthalpy balance for at least two crystallites and extrapolating the obtained values to the conditions of coarse-crystalline substances (green line in Figure 7), it is possible to determine the value of the enthalpy ΔEs related to the process of coarse-crystalline substance dispersion.
The values of the expression ΔGb + ΔG2D were determined on the basis of Equation (8) for crystallites with specific active surfaces in the range of 0.075–0.300 nm−1 (Figure 8) with a gas-phase potential in the range of 0.25–0.75 and segregation free enthalpy ΔGseg = −20 kJ.
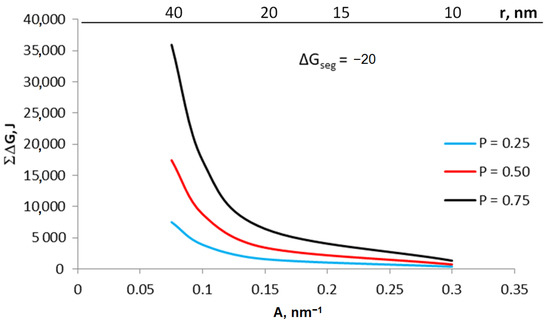
Figure 8.
The sum of energy related to the surface and volume of the crystallite and the share of surface and volume in this sum for various potentials 0.25–0.75 and segregation free enthalpy −20 kJ, temperature 673 K.
For crystallites with different A, the expression ΔG2D/ΔGb will have a different value: the smaller the value of A, the smaller the ratio of ΔG2D/ΔGb. As a result of establishing equilibrium, smaller crystallites are transformed under the higher chemical potential of the gas components rather than larger crystallites.
In terms of surface tension, usually the joules (J) per square meter of surface area (m2) unit is used [34,35]. According to the definitions adopted in this work, unit J/mol of surface [36] is used for the molar chemical potential of the surface where the surface area is expressed in terms of mole of surface atoms which corresponds to the usual unit for surface tension. The energy for creating a clean surface ΔEs is then given by:
where Es−—molar chemical potential of free surface, and f—activity coefficient.
ΔEs = Es− A = −A RTlnxs
The total surface energy ΣΔEAs, defined for a specific surface and volume of crystallite and taking into account the fraction of free and occupied crystallite surface, is a function of surface concentration adsorbate and is equal to [27]:
where Es−ad—molar chemical potential of occupied surface.
After substituting Equations (6d), (7) and (32):
This balance applies to a crystallite and only to the extent of restructuring its surface. When as,max is changed, the active specific surface area changes despite the constant xb. Equation (34) represents the minimum system energy at a given volume of crystallites and their specific surface.
The dependence of the energy change needed for the phase transformation for the S/V value of the i-th crystallite on the potential can be approximated by a linear function:
E(S/V) = aP + b
When ΔGseg is less than or greater than zero, according to the McLean–Langmuir equation at equilibrium, xsmax will be different from xbmax, and moreover, these concentrations will be a function of the crystallite radius and the potential P0α,max(Ai):
After calculating the logarithm of the maximal activities of the absorbate and the adsorbate in the α phase, the value of the free segregation enthalpy ΔGsegα can be determined for each crystallite in the system. In the coordinate system ln = f(ln) = f(lnP0max), the relation / is a line with slope Kα,ab.
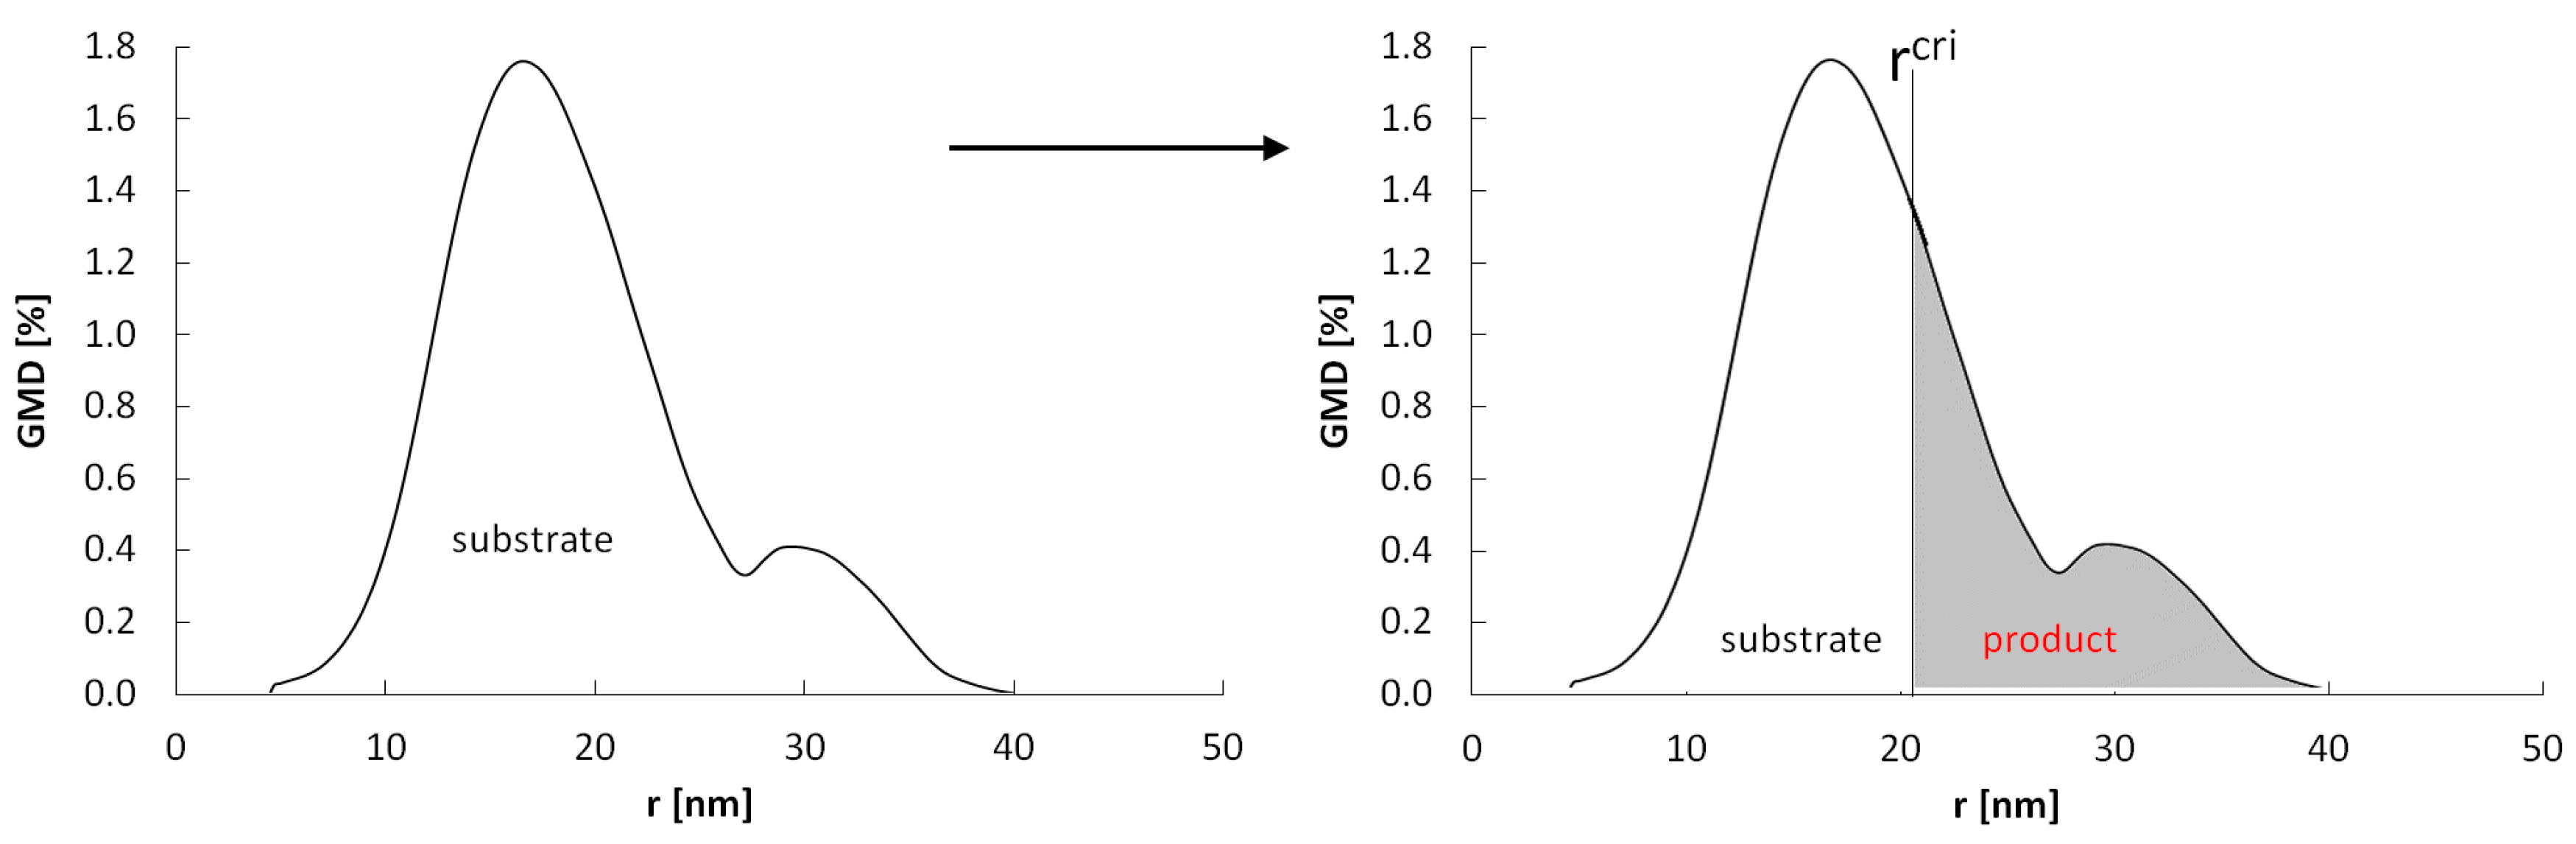
If we consider a system containing nanocrystallites with specific active surfaces Ai ∈ <Amin–Amax>, nanocrystallites will undergo phase transformation in their entire volume at the potentials P0(A)i ∈ <P0(Amin)–P0(Amax)>. The value of ΔE is directly proportional to the specific active surface area, and therefore, the fractions of larger crystallites will undergo a phase change at lower P0(Ai) potentials and smaller xs and xb concentrations than smaller crystallites (Figure 9)—in equilibrium states established with increasing gas-phase potential, crystallites will reach maximum concentrations and undergo phase changes in the order of their radius from the largest to the smallest, and the α and β phase crystallites will be present in the sample next to each other at a specific potential P0(Ai) ≈ P0(Amin).
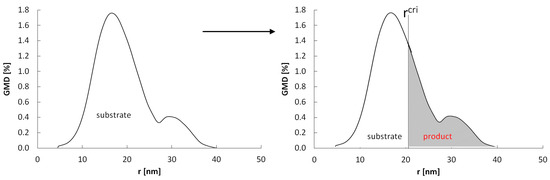
Figure 9.
Scheme of the reaction of a nanocrystalline system with a specific size distribution with the gas-phase potential close to the equilibrium potential P0(Ai) ≈ P0(Amin).
With (P(t) − P0(Amin) → 0, the rate of crystallite conversion with rmax = 10 nm is lower and occurs at higher gas-phase potentials than the crystallite conversion rate with rmax = 40 nm. The chemical potential at which phase transformation of i-th crystallite occurs can be expressed by the relationship:
lnP0(A)i = ln P0(Amin) + Ailnxscri/lnxbcri = ln P0(Amin) − AiKseg
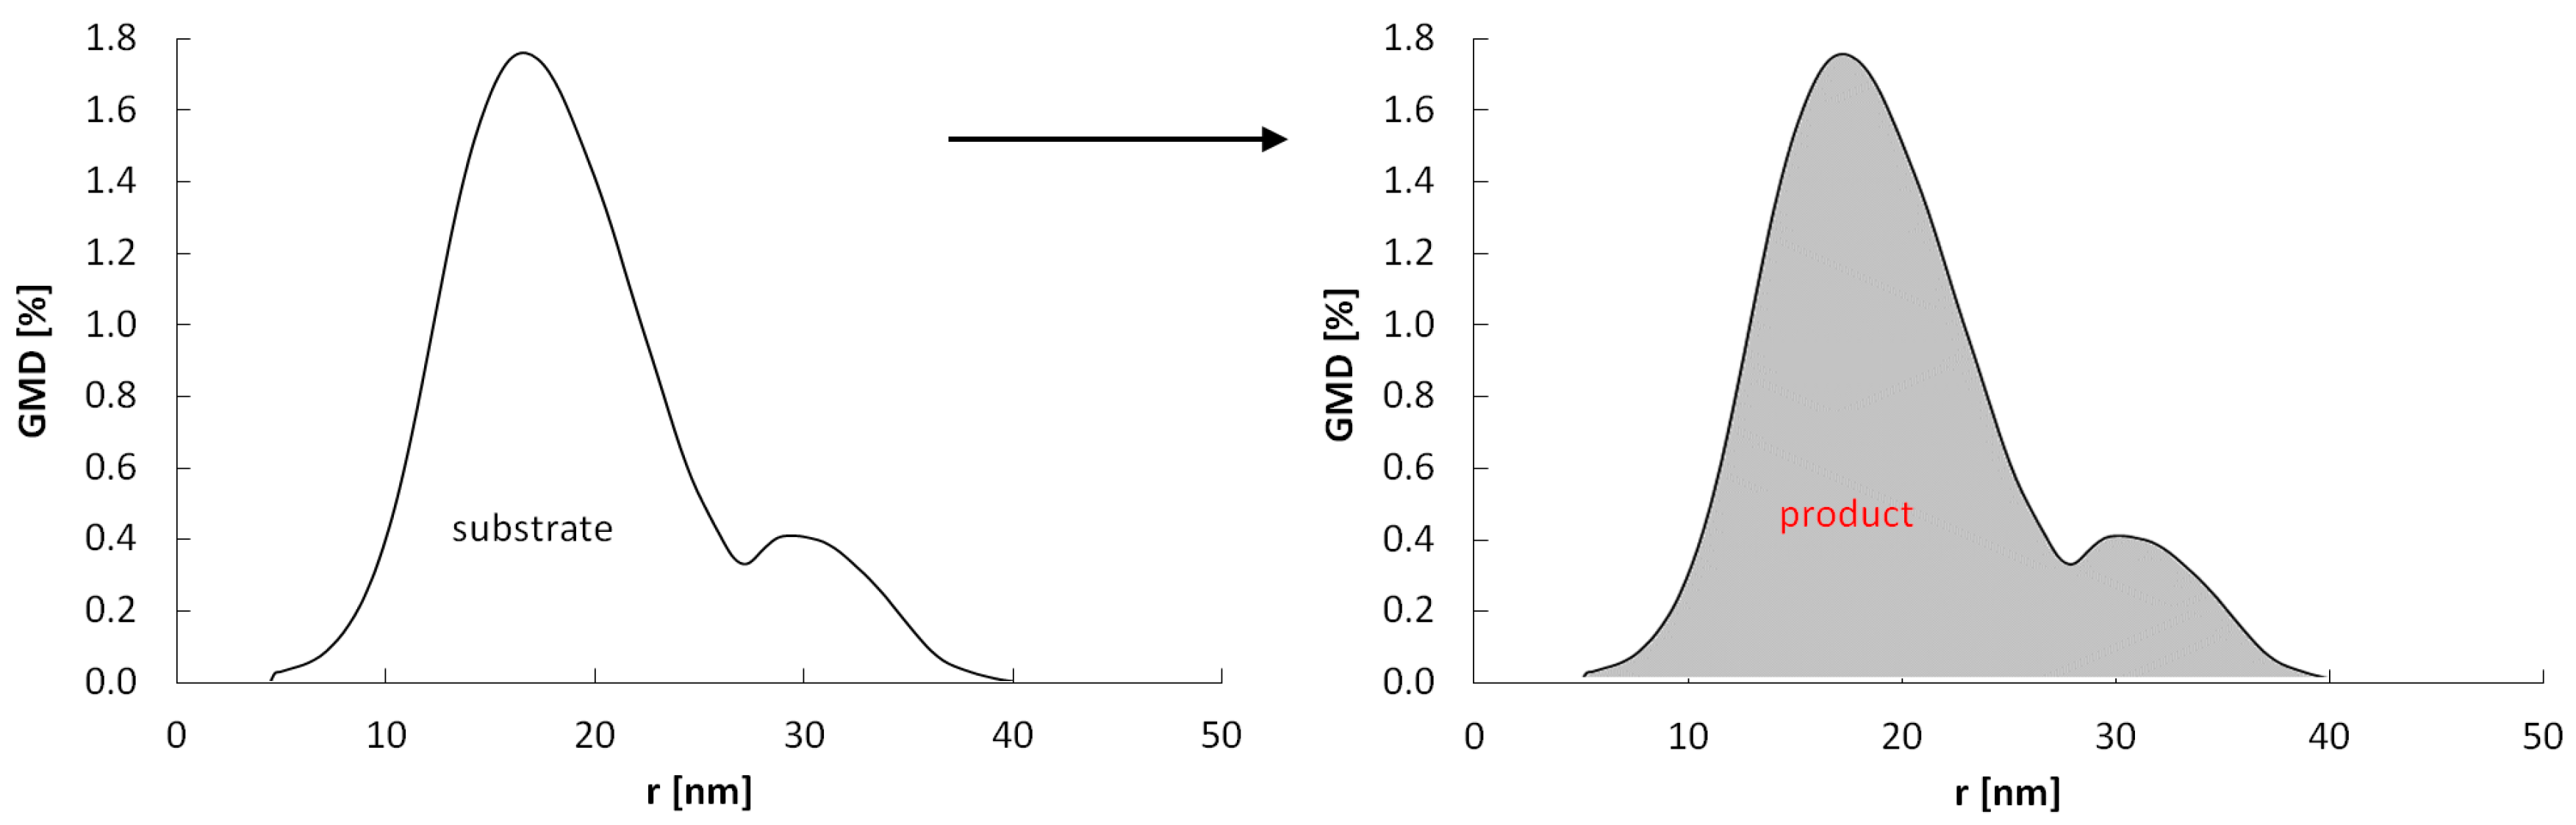
Under the conditions where the potential P(t) >> P0(Amin), all crystallites can undergo a phase change (Figure 10) and the rate of crystallite conversion with rmax = 10 nm is higher and occurs at lower gas-phase potentials than the crystallite conversion rate with rmax = 40 nm.

Figure 10.
Scheme of the reaction of a nanocrystalline system with a specific size distribution with the gas-phase potential P(t) >> P0(Amin).
Taking into account the phase transformation and the formation of the second nanocrystalline phase β for a single nanocrystallite, the total average reaction rate can be expressed by the equation:
After the phase transition, the concentration difference is expressed only by the second component of the right side of the Equation (38).
2.4. Process in the Isothermal System and the Linear Relationship P = f (t)
Equation (13) takes into account the influence of three parameters on the reaction rate. Assuming that the system is isothermal, Equation (13) boils down to the form:
Assuming that the adsorbate concentration in the gas phase xg(t) varies according to the linear model:
where k—proportional coefficient, t—time, and adsorbate surface concentration changes over time according to Equation (3a).
Any changes in absorbate concentration xb as a function of radius, when the concentration changes in adsorbate are described by Equations (3a) and (40), can be calculated using Equation (41) (for the initial conditions, the concentration in the nanocrystallite volume is zero and the concentration on its surface is a function of time) [1]:
The average concentration of the solute in the entire volume of nanocrystallite during the reaction with the gas phase can be determined using Equation (42) [1]:
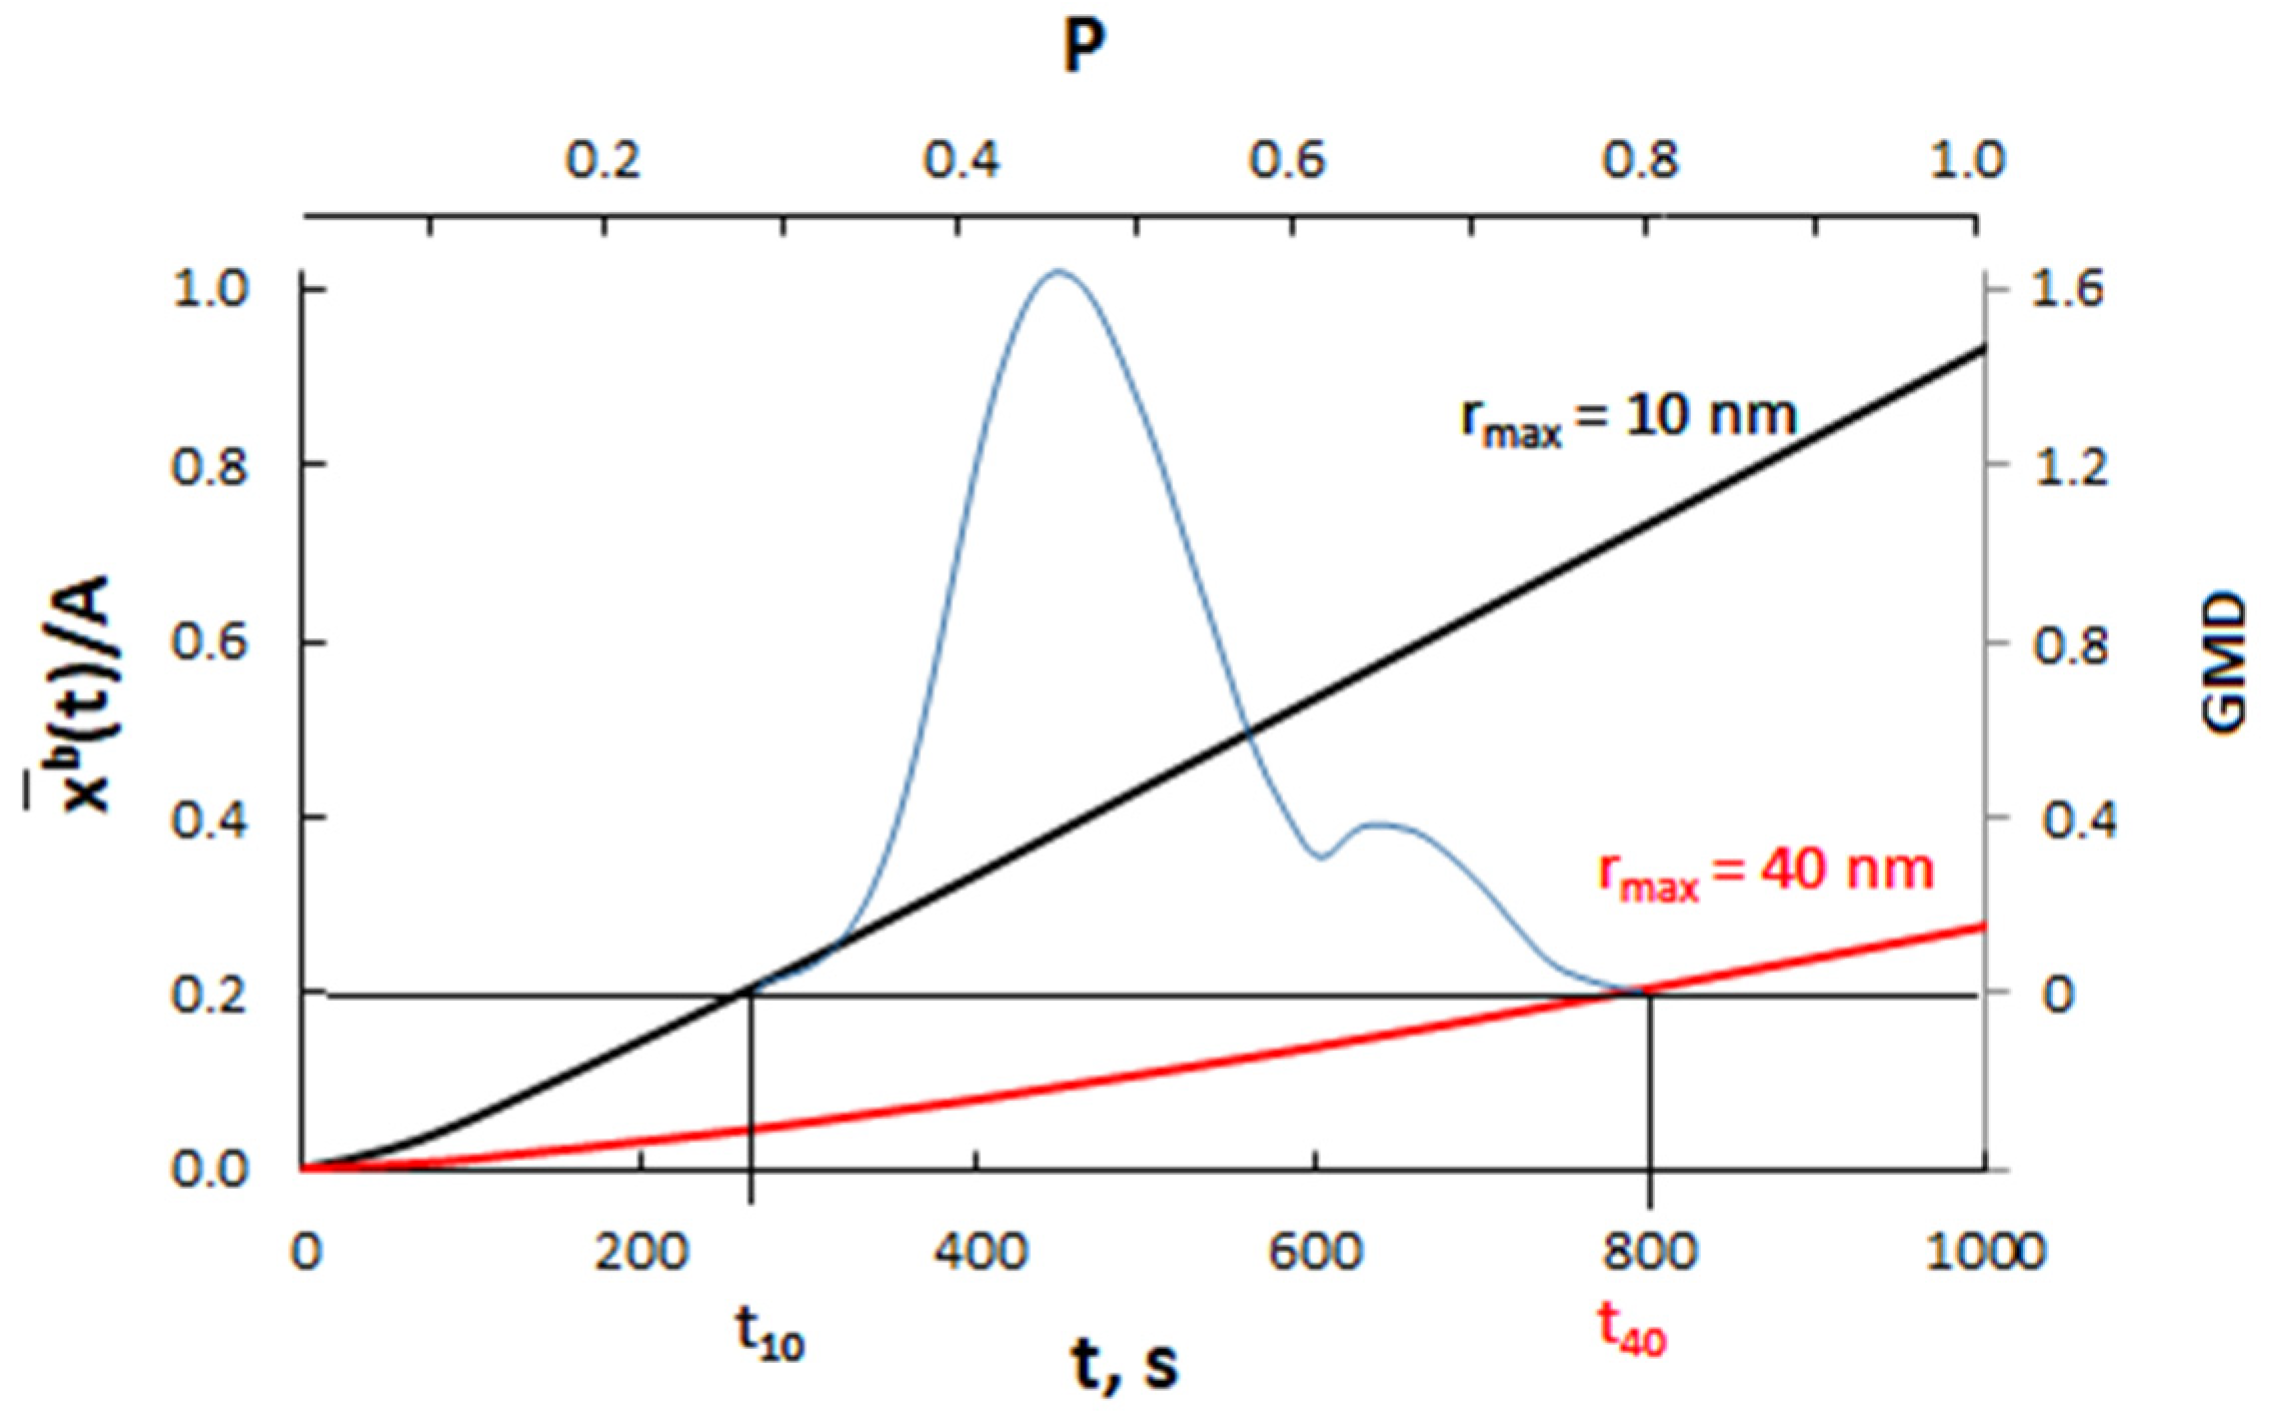
Calculation results for nanocrystallites with radii of 10 nm (A = 0.3000 nm−1) and 40 nm (A = 0.0750 nm−1) and for a diffusion coefficient of 10−19 m2/s are presented in Figure 11.

Figure 11.
The dependence of the average concentration of the solute in the volume of nanocrystallites with radii of 10 nm (A = 0.3000 nm−1) and 40 nm (A = 0.0750 nm−1) on the time for the diffusion coefficient D = 10−19 m2/s (blue color—scheme of crystallite size distribution).
Assuming that P(t) >> P0(A), the smaller crystallite (rmax = 10 nm) reaches the critical concentration in a shorter time and undergoes a phase change compared to the larger crystallite (rmax = 40 nm).
2.5. Process in the Isothermal System and the Exponential Relationship P = f (t)
Assuming that the adsorbate concentration in the gas phase xg(t) varies according to the leaching model with perfect mixing:
where v—gas flow rate, Vr—reactor volume, x0g—maximum concentration in the gas phase, and the adsorbate surface concentration changes over time according to Equation (3a).
Any changes in absorbate concentration xb as a function of radius, when the concentration changes in adsorbate are described by Equations (3a) and (43), can be calculated using Equation (44) (for the initial conditions, the concentration in the nanocrystallite volume is zero and the concentration on its surface is a function of time) [1]:
The average concentration of the solute in the entire volume of nanocrystallite during the reaction in the gas phase can be determined using Equation (45) [1]:
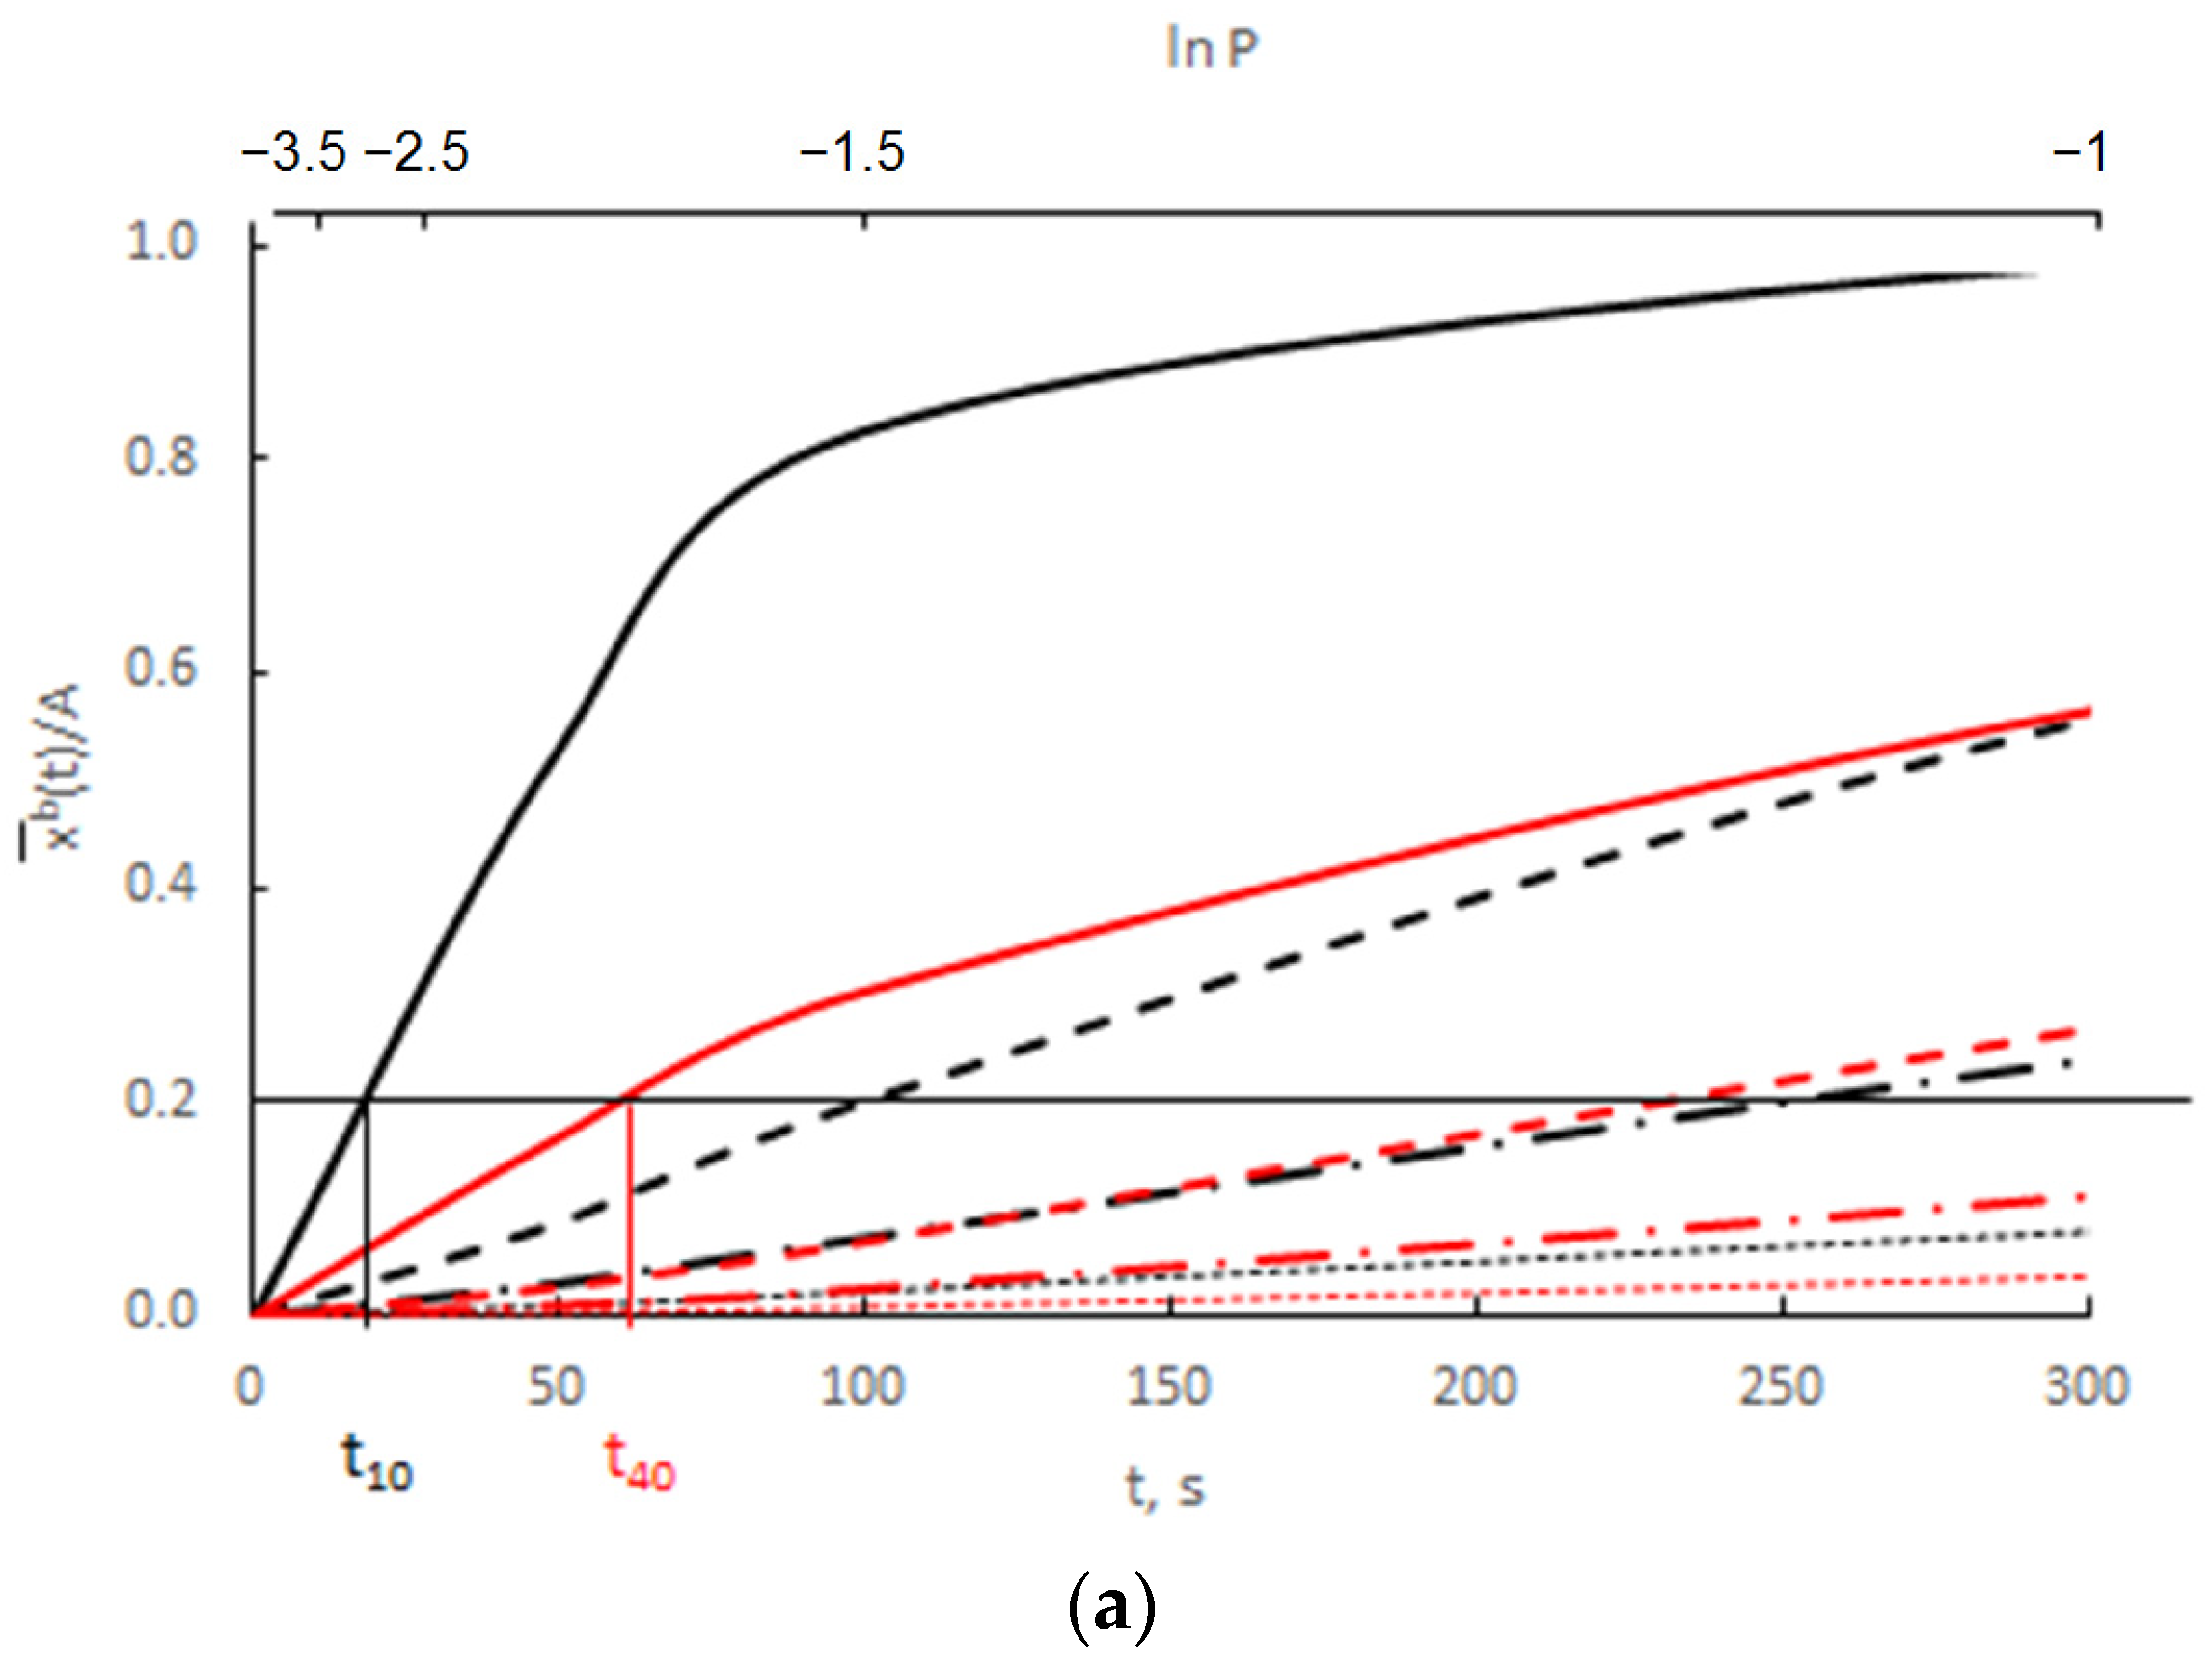
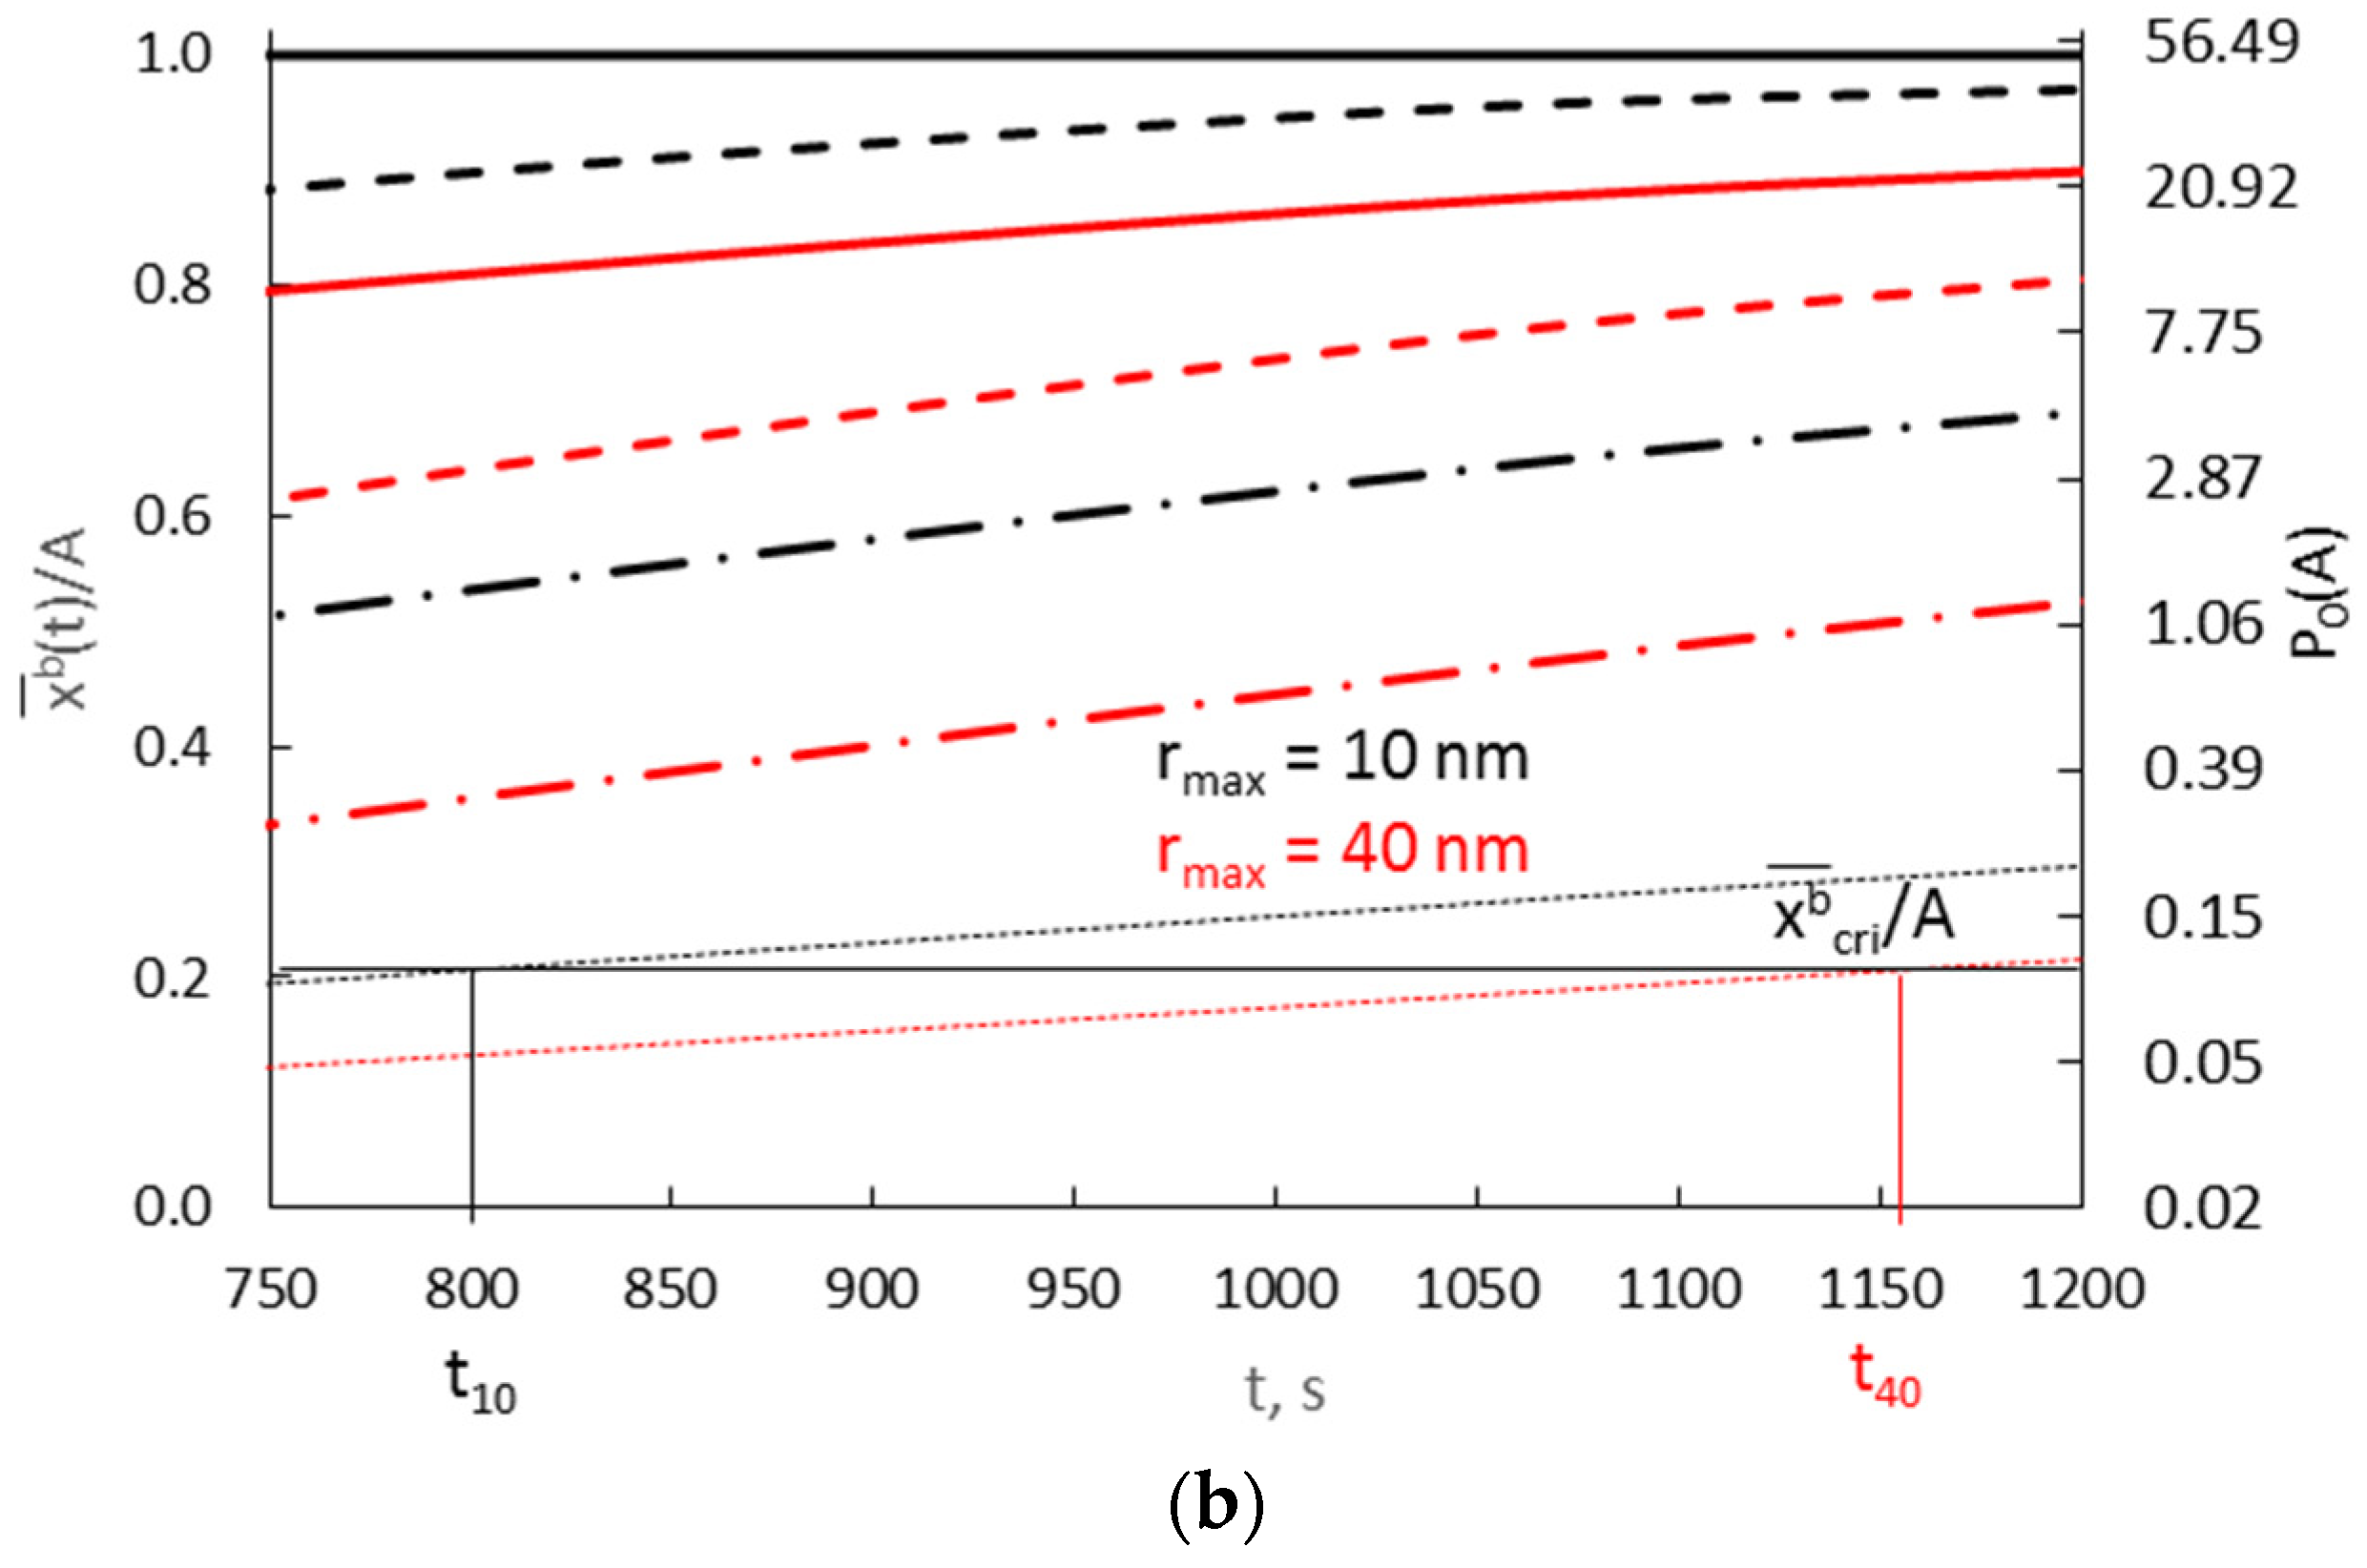
Calculation results derived from Equation (44) for 10 nm (A = 0.3000 nm−1) and 40 nm nanocrystallites (A = 0.0750 nm−1), with a diffusion coefficient of 10−19 m2/s and various values of the parameter v/Vr = <0.0003–0.0300>, are shown in Figure 12.
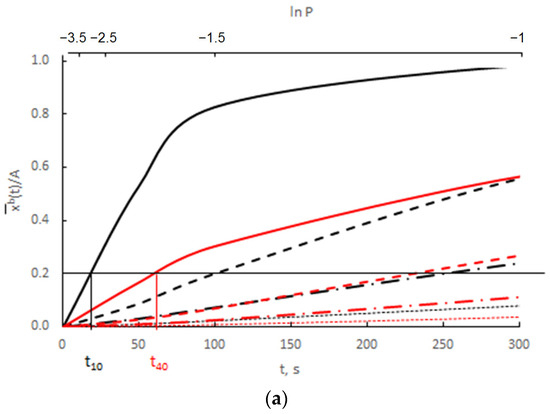
Figure 12.
The dependence of the average concentration of the solute in the volume of nanocrystallites with radii of 10 nm (A = 0.3000 nm−1) and 40 nm (A = 0.0750 nm−1) on time in the range (a) t = 0–300 s, (b) t = 750–1200 s, at surface concentrations varying exponentially and with a diffusion coefficient D = 10−19 m2/s (v/Vr:  0.0003,
  0.0010,
  0.0030
  0.0300).
0.0003, 0.0010, 0.0030 0.0300).
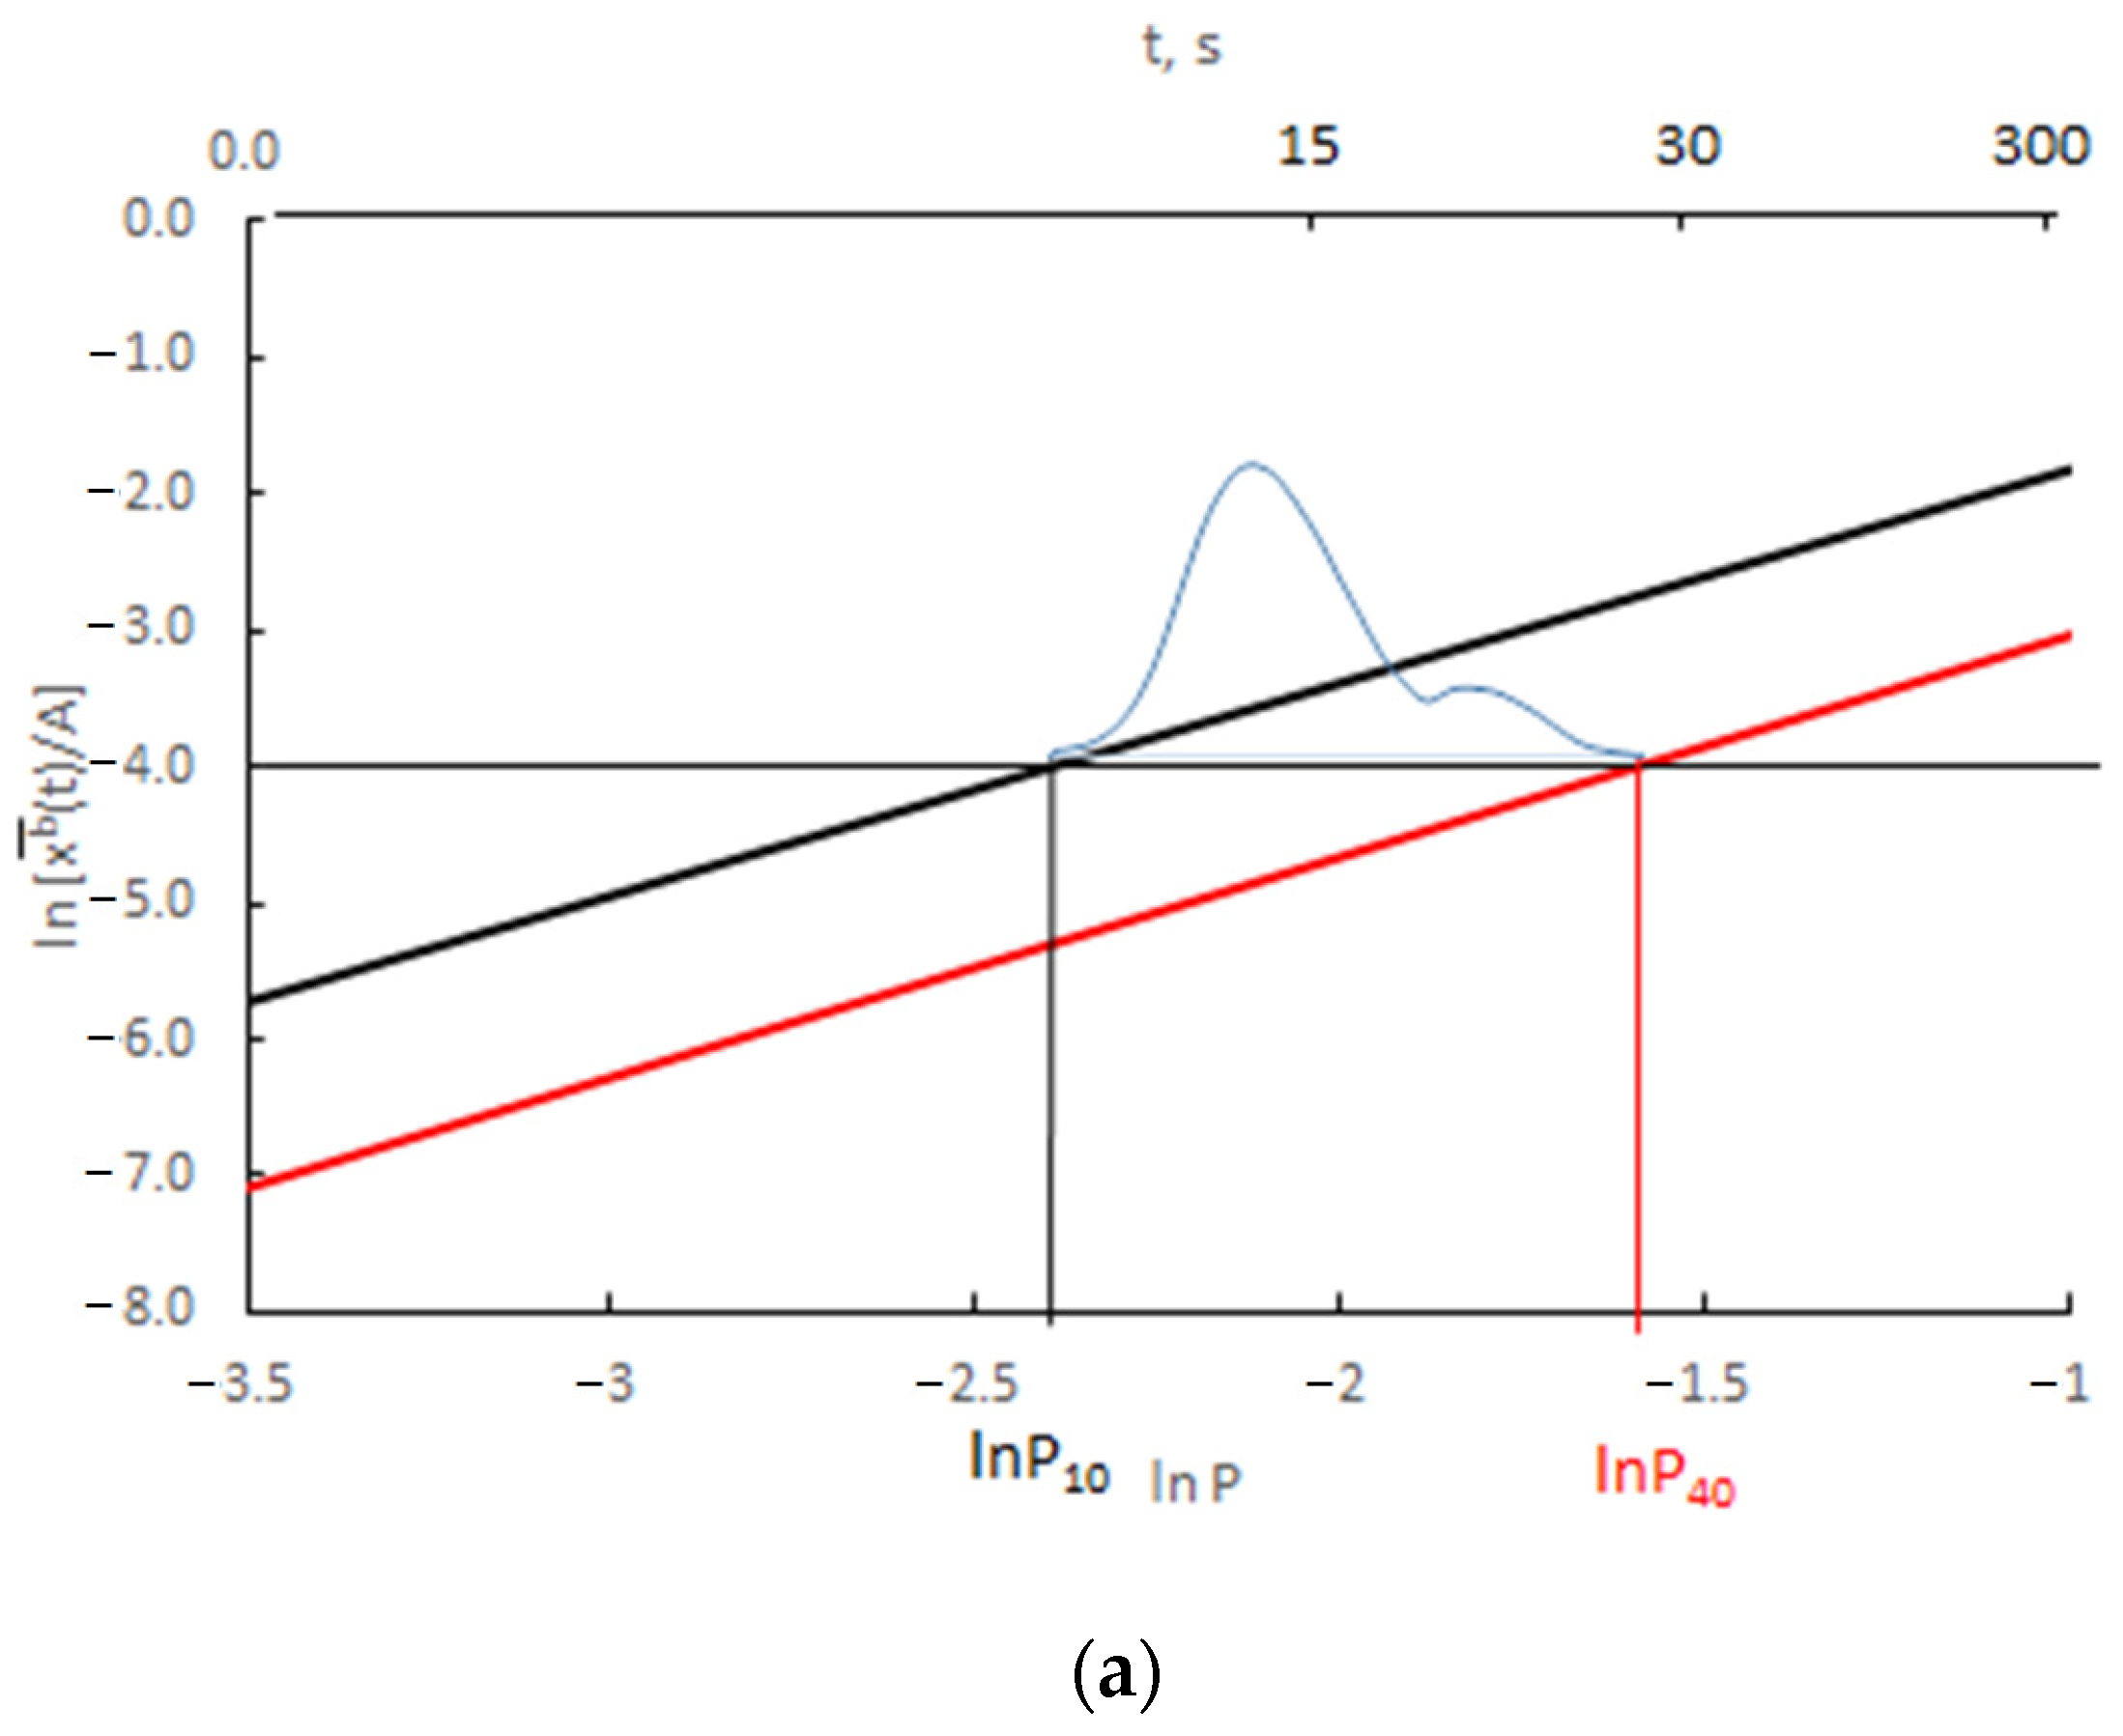
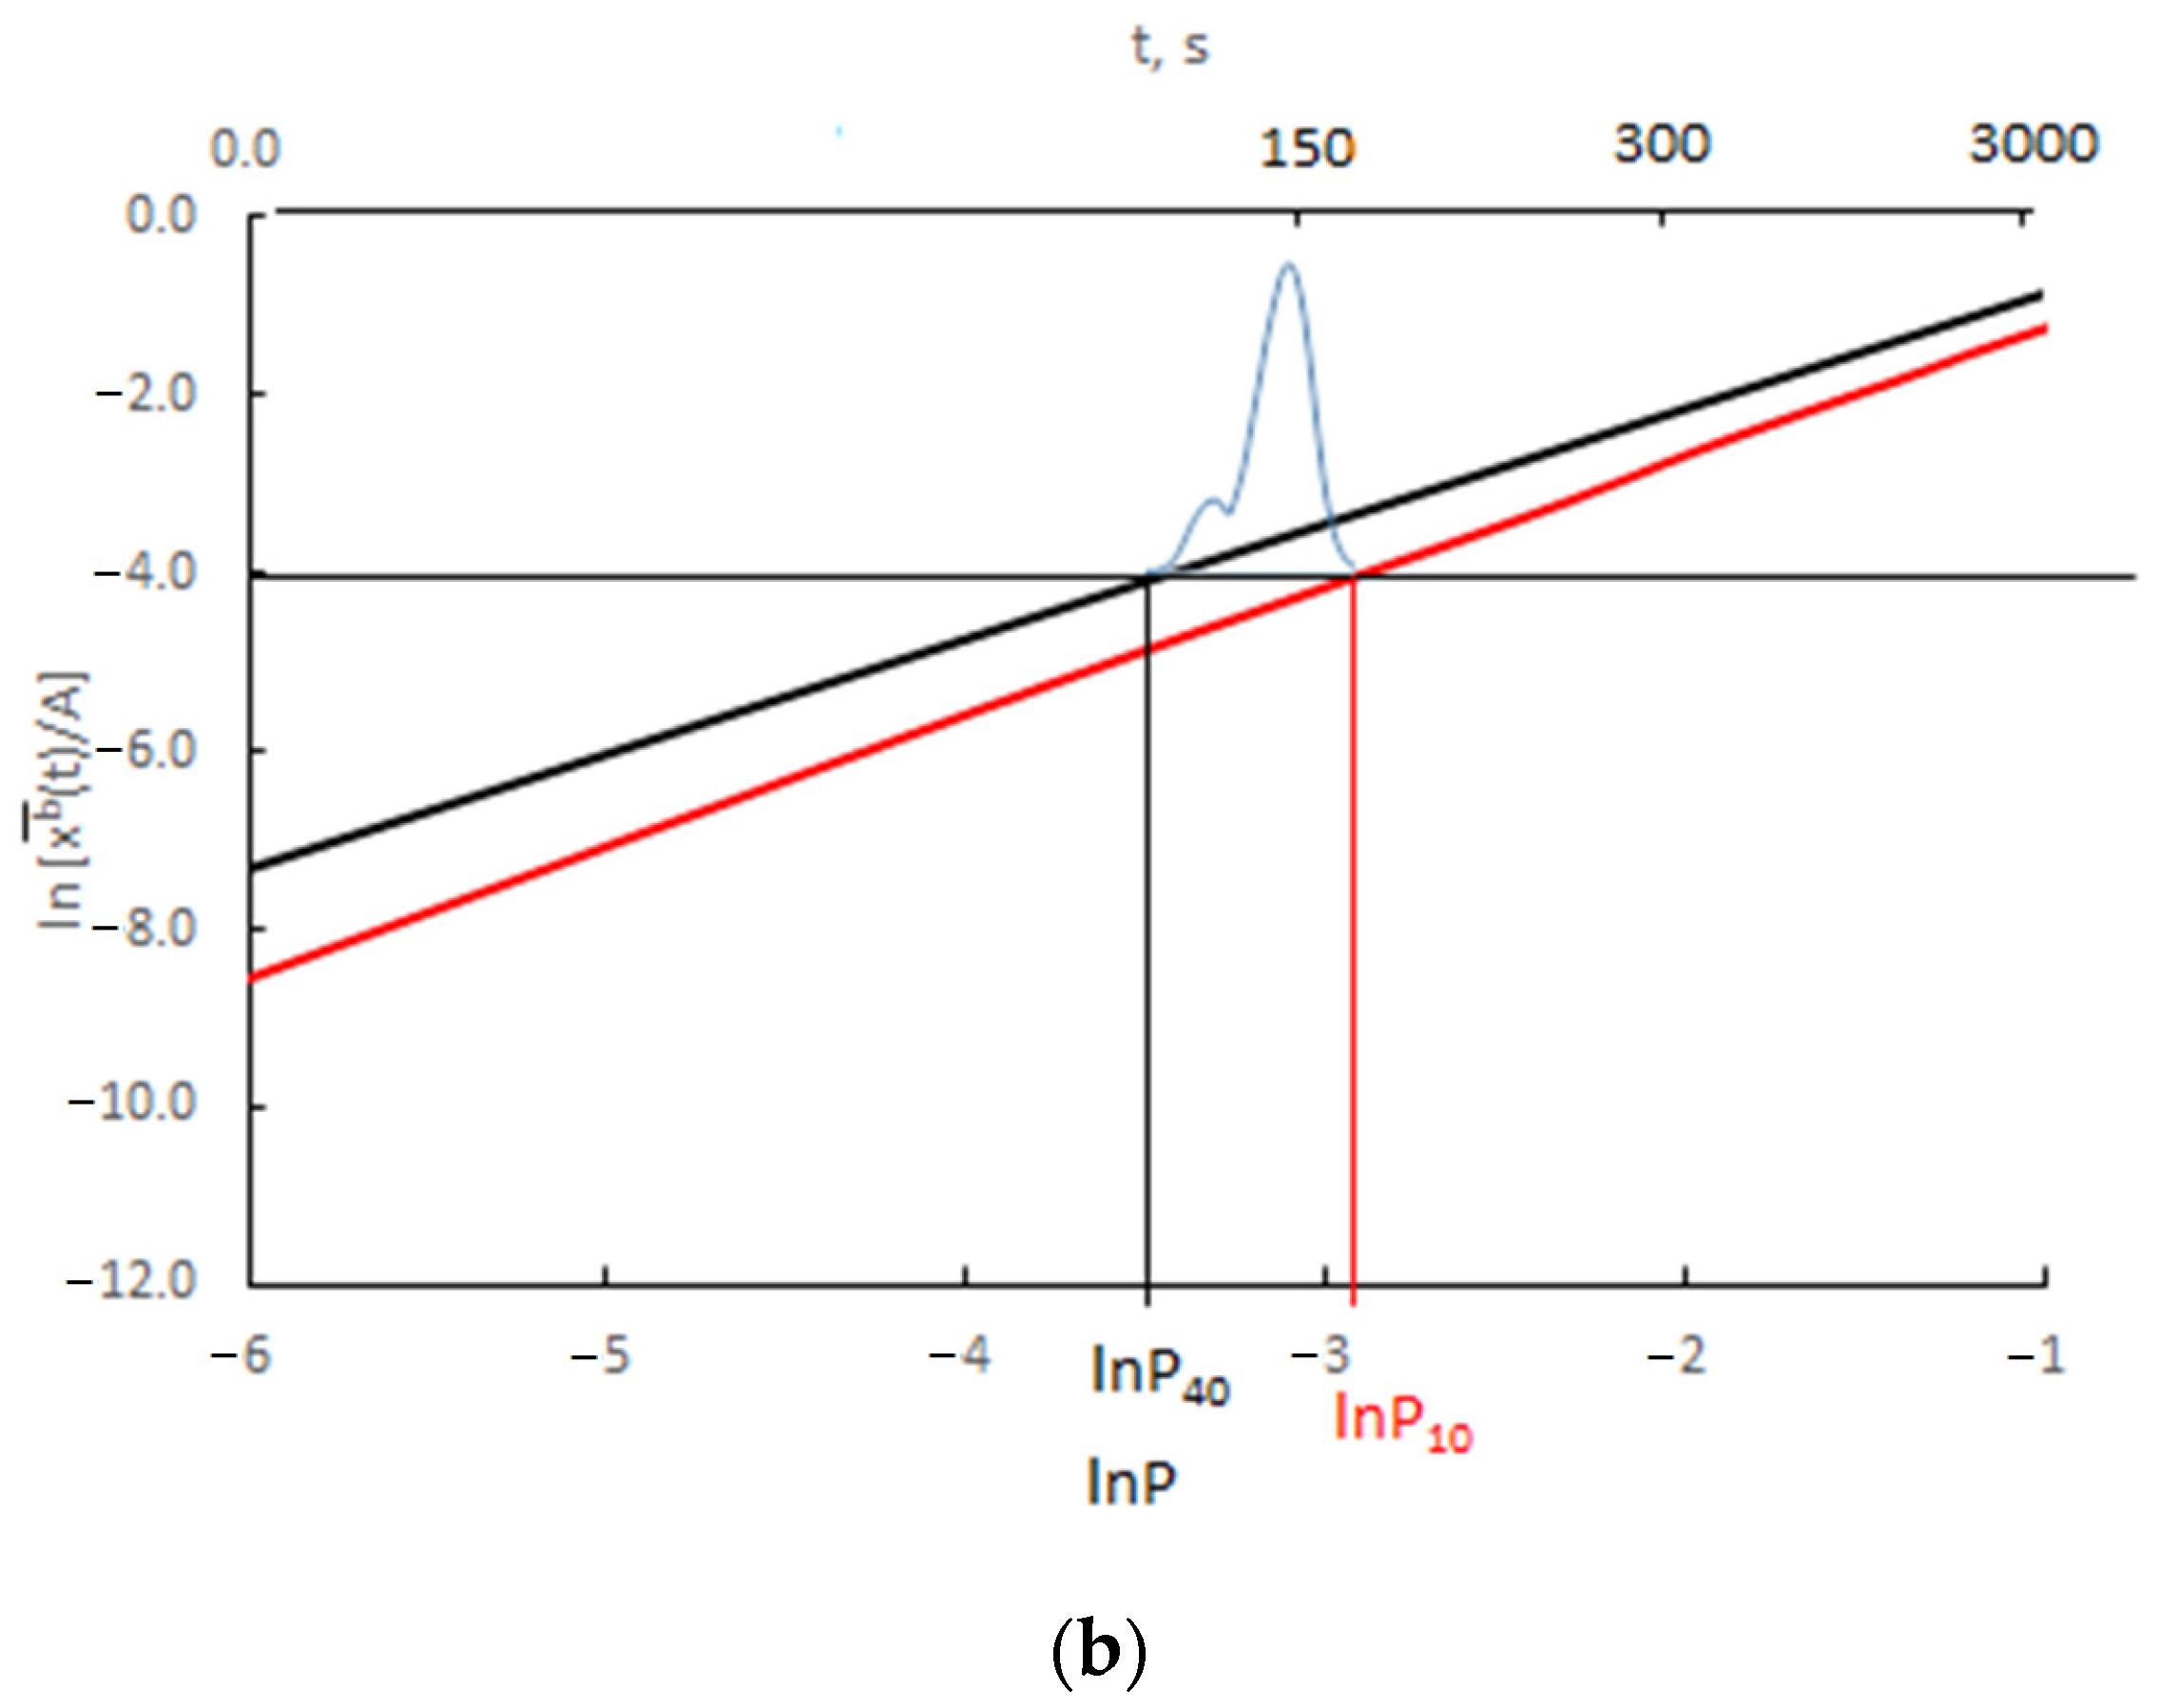
The results presented in Figure 12 are presented as the change in ln depending on ln P(t) = ln xg (Figure 13).
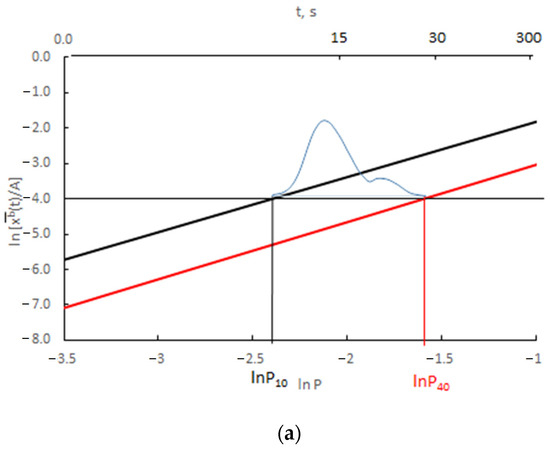

Figure 13.
Change in ln depending on ln P(t) for (a) v/Vr = 0.0300 (b) v/Vr = 0.0003 (black color rmax = 10 nm, red color rmax = 40 nm, blue color—scheme of crystallite size distribution).
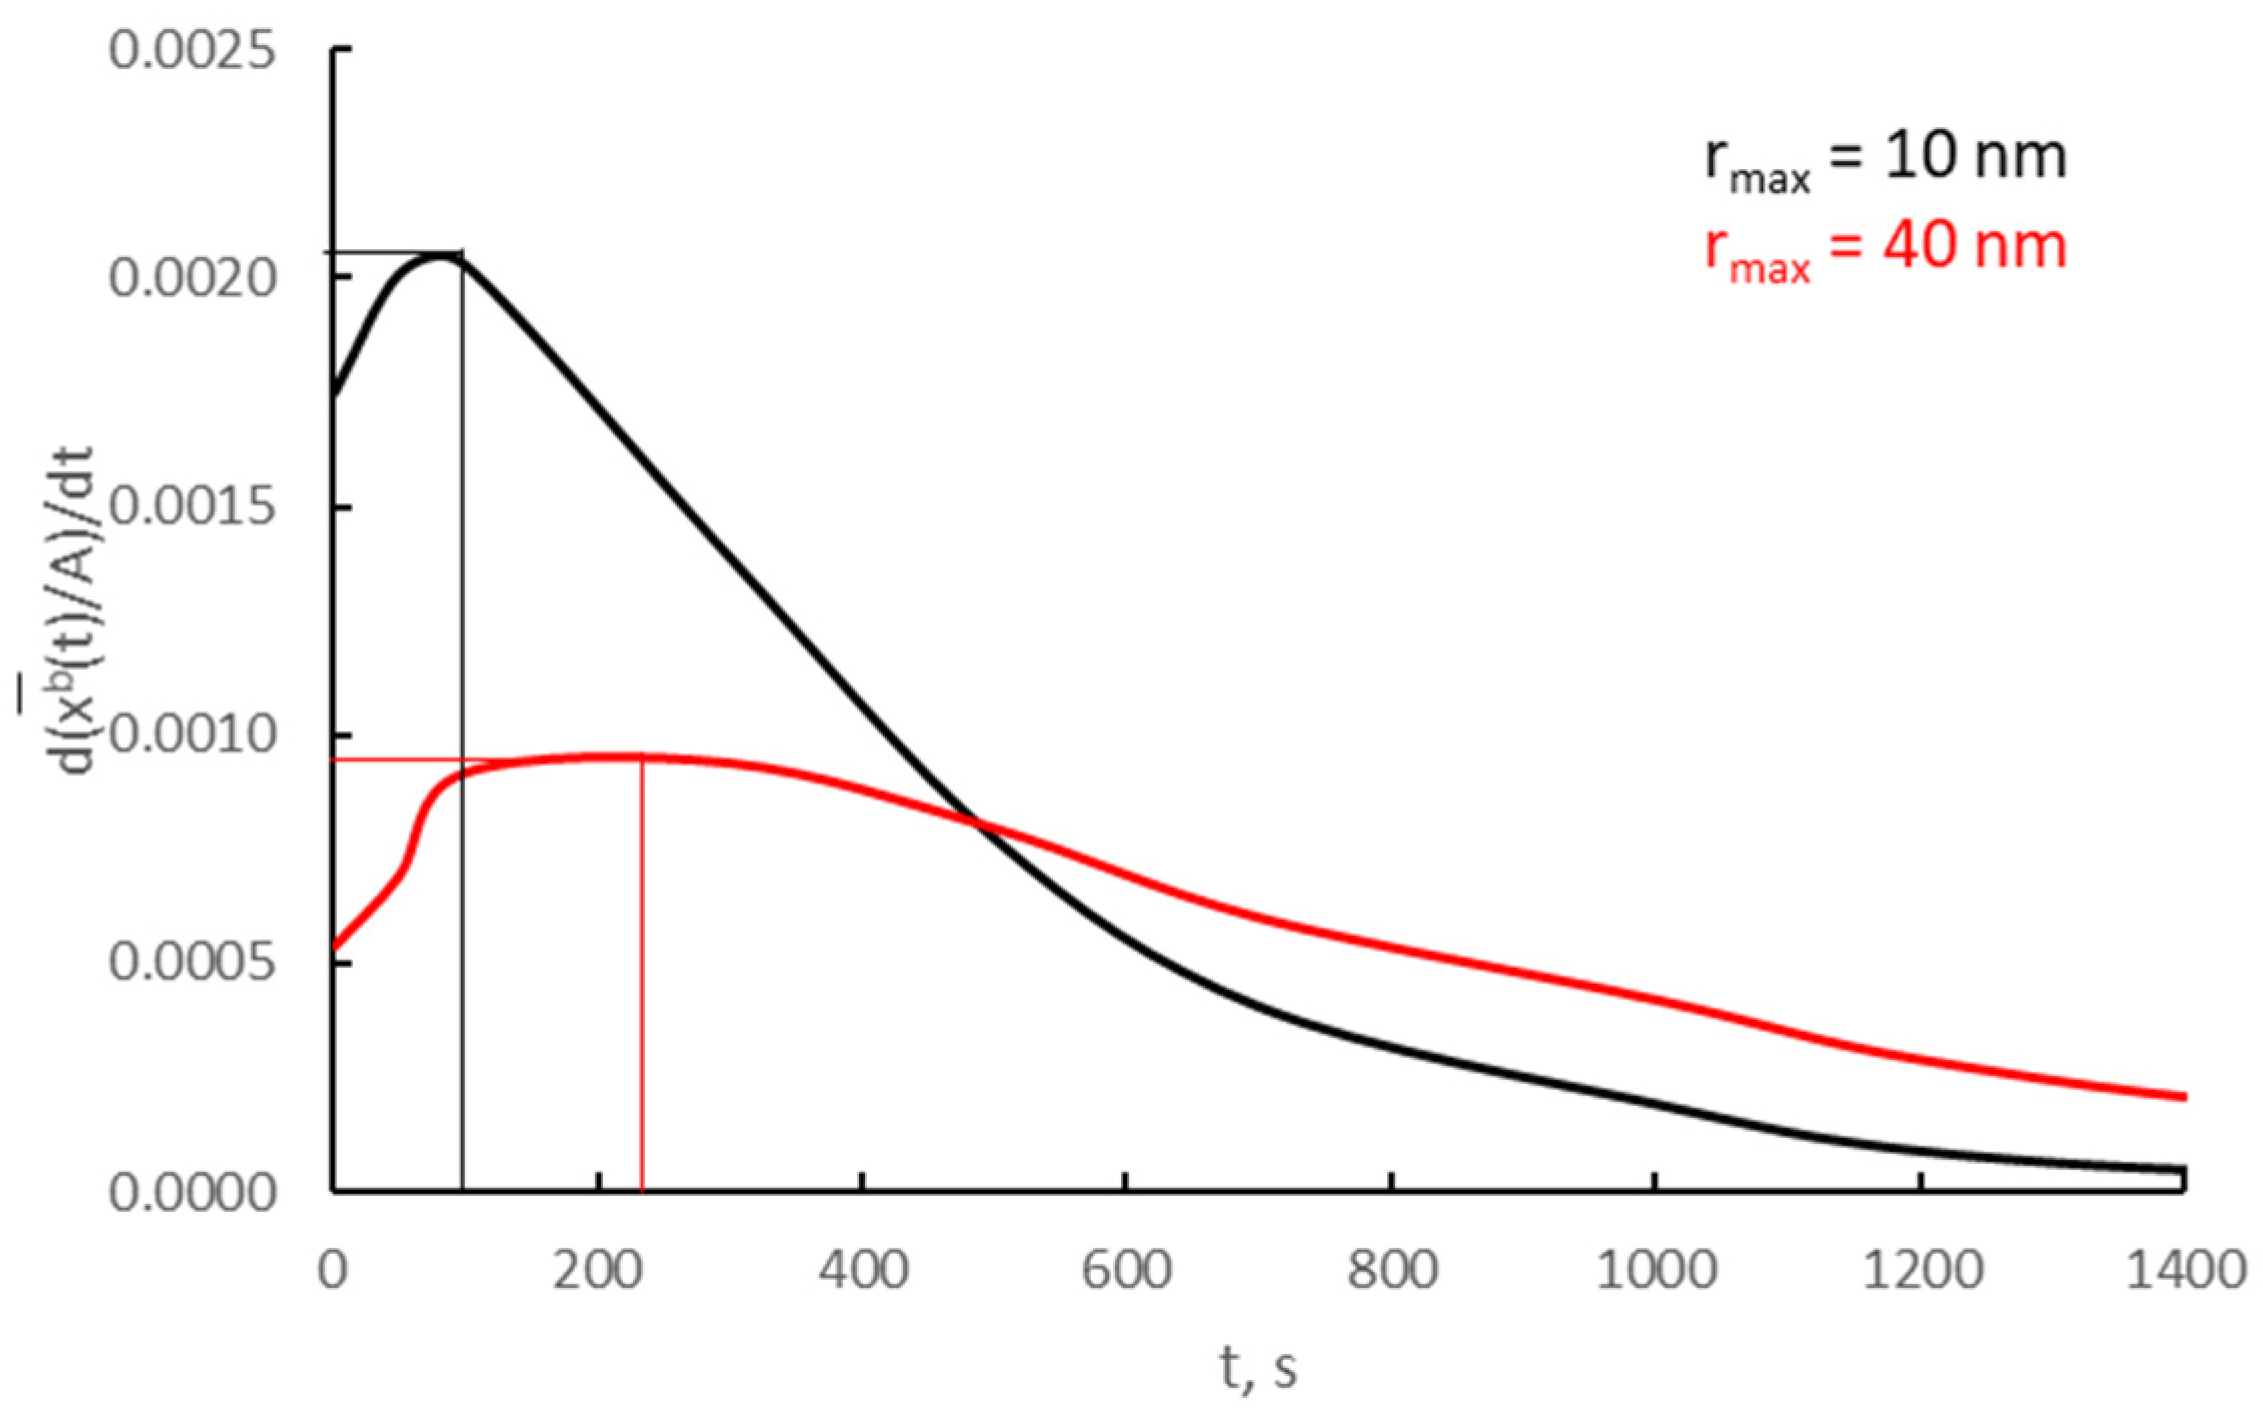
After differentiating over time, the relationships shown in Figure 12a for v/Vr = 0.0030 and two crystallites; the average rate of the absorption process was determined according to Equation (19) and presented in Figure 14.

Figure 14.
Absorption process rates on two different crystallites (v/Vr = 0.0030).
The rate of the absorption process at the time of the phase change for crystallites of 10 and 40 nm is, respectively, 0.0021 and 0.0009 t−1.
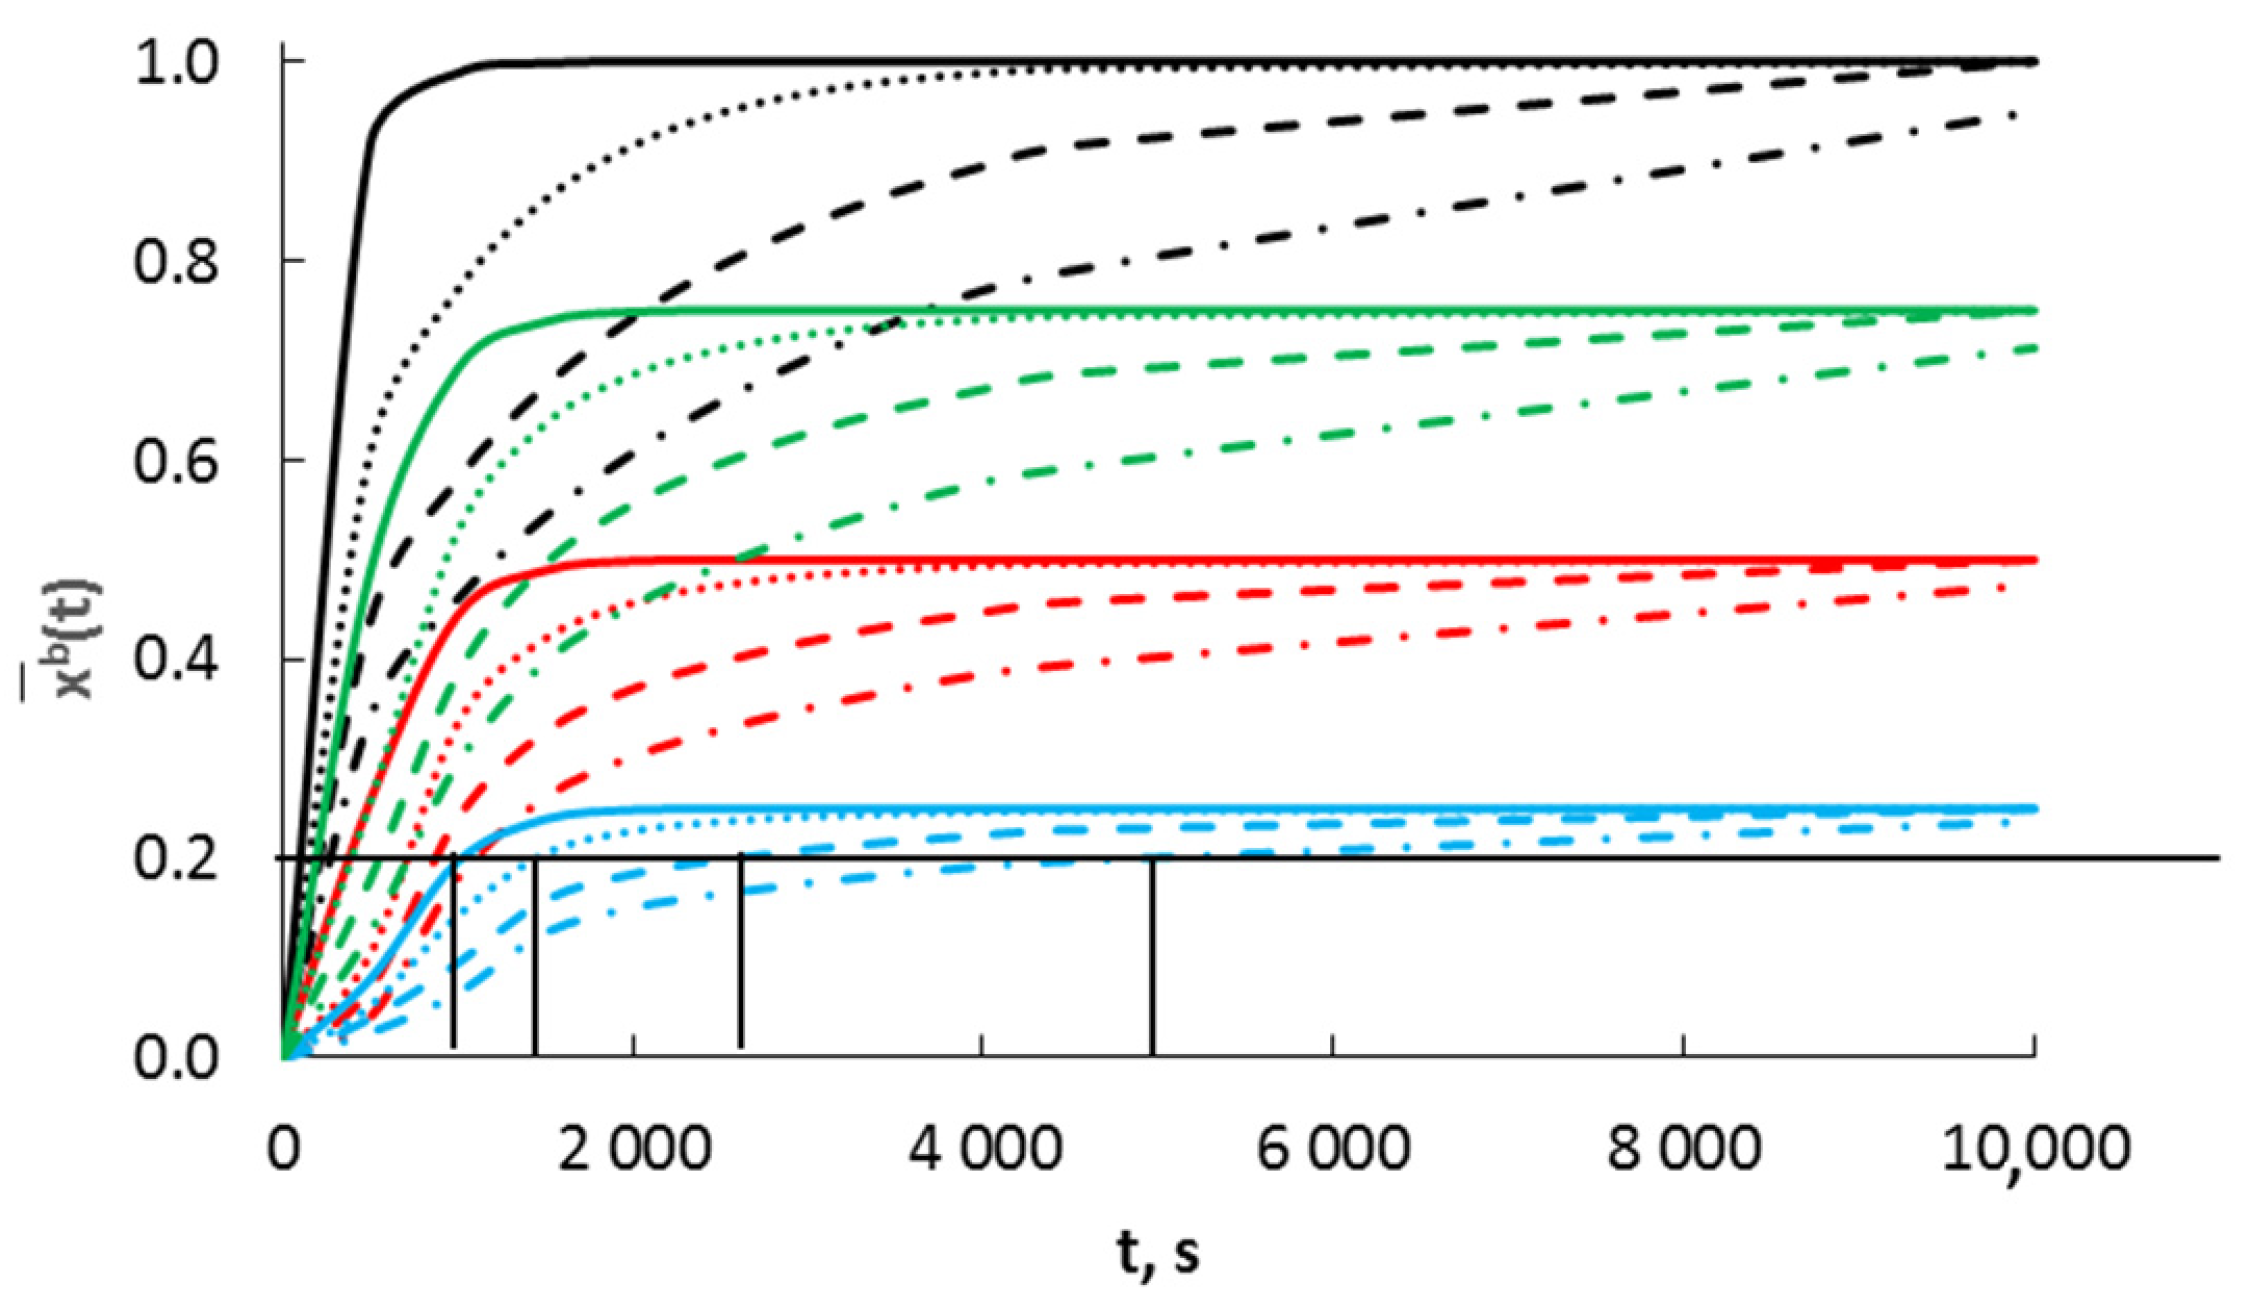
After summing the results presented in Figure 12 for individual crystallites in the range of 10–40 nm (every 1 nm) and according to the crystallite shares given by the bimodal mass distribution, a total and integral diagram of concentration changes in the entire crystallite system is obtained for the kinetic (Figure 15a) and equilibrium regions (Figure 15b).
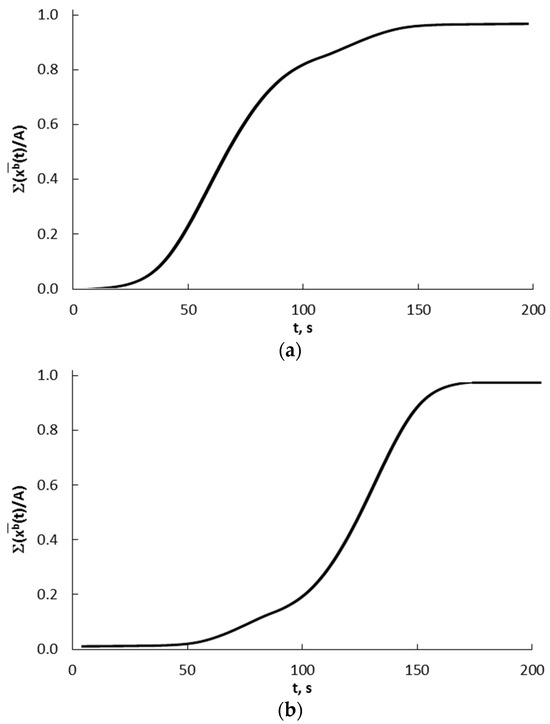
Figure 15.
Summary and integral graphs of concentration changes in the entire crystallite system for (a) kinetic and (b) equilibrium regions.
To sum up, in the current work, we deal with a chemical reaction in a solid phase—nitriding reaction of nanocrystallite iron, for which we have assumed a probable mechanism of reaction with the diffusion resistance of an extremely thin surface layer (literally surface layer—we consider the change in the thermodynamic states of nitrogen after passing through a single layer of iron atoms on the nanocrystallite surface)—model No. 1. Since this is the rate-limiting step of the entire process, the equalization of concentrations (i.e., eliminating concentration gradients in the volume of iron nanocrystallites) should occur faster, and we will not observe a growing layer of the product but rather an equal concentration in the volume of nanocrystallites. Then, after exceeding the critical concentration, the phase transformation of the substrate into the product will occur immediately in the entire volume of the nanocrystallite. If the product layer does not grow in the proposed model, the associated diffusion resistance does not change (increase) as the reaction progresses, as occurs in the shrinking core model (model No. 2) [33]. The adsorption model of the reaction is also known (model No. 3) [27], in which the rate of the process is limited by the rate of adsorption and dissociation of the gaseous substrate on the nanocrystallite surface. It was also assumed that there is no concentration gradient in the volume of nanocrystallites (an equilibrium is established between the adsorbate on the surface and the substrate dissolved in the volume of nanocrystallites), and the substrate–product phase transformation will occur in the entire volume of nanocrystallites. So, to sum up, we may compare those models and conclude that there are some similarities (in model No. 1 and in model No. 3 there is no concentration gradient in the volume of nanocrystallites; in model No. 1 and in model No. 2 the process rate is limited by the diffusion rate) but also differences (in model No. 1, the process rate is limited by the diffusion rate and in model No. 3 by the rate of gas adsorption on the surface of the nanocrystallites; in model No. 1, diffusion only concerns the passage of adsorbate atoms from the surface through an unchanging interface into the nanocrystallite volume, where the concentrations are equalized, and in model No. 2, the diffusion rate changes due to the surface layer of the product growing as the reaction progresses, limiting the possibility of contacting the gaseous substrates and those remaining in the solid phase).
The proposed model can be used to describe any reaction system in which a phase transformation may occur as a result of exceeding a certain critical concentration in the volume of nanoparticles. Examples include nitriding, carburizing, and oxidation reactions of transition metal nanoctystalites and reduction in the resulting products, e.g., with hydrogen. Experimental results for the reactions we obtained earlier inspired us to develop the current reaction model. Another example may be the growth of a solid clathrate hydrate phase upon exposure of ice to hydrate-forming gases, such as methane or carbon dioxide described in a scientific paper by Englezos et al. [37].
3. Conclusions
According to the model calculations carried out, nanocrystallite volume concentrations level out very quickly. That justifies the assumption for further calculations that at the time of transformation the average concentration in the nanocrystallite volume is equal to the concentration of the adsorbate in the absorbent.
If the adsorption process does not limit the reaction rate of the gaseous component with the nanocrystalline absorbent, the surface concentration of the adsorbate is directly proportional to the logarithm of the adsorbate potential in the gas phase.
The rate of diffusion across the phase boundary limits the rate of the process. With perfect mixing of the gas component in a reactor volume, the sorption process rate depends on the ratio of gas flow through the reactor volume, i.e., the ratio of the logarithm of the chemical potential of the gas adsorbate to the volume of nanocrystallite.
In processes in which phase transformation takes place, the critical concentration of absorbate depends on the specific active surface area of the adsorbent and the difference in chemical potentials of the gas-phase and equilibrium potentials at which the phase transformation occurs. When the adsorbate potential in the gas phase is greater than the equilibrium potential of the nanocrystallite with the largest specific active surface, nanocrystallites undergo phase changes in the order according to their specific active surfaces from the largest to the smallest. In a process in which the adsorbate potential P(t) changes according to the relationship P(t)i = P0(A)i, nanocrystallites undergo phase transformation in order of their specific active surface from the smallest to the largest.
Author Contributions
Conceptualization, W.A.; methodology, B.W. and R.P. validation, W.A., Z.L.-B. and R.P.; formal analysis, B.W. and Z.L.-B.; investigation, B.W. and R.P.; data curation, W.A.; writing—original draft preparation, B.W. and R.P.; writing—review and editing, W.A., R.P. and Z.L.-B.; visualization, and R.P.; supervision, W.A.; project administration, W.A.; funding acquisition, W.A. and R.P. All authors have read and agreed to the published version of the manuscript.
Funding
This research was funded by The National Science Centre, Poland, grant numbers 2017/27/B/ST8/02947 and 2017/27/B/ST8/02970.
Institutional Review Board Statement
Not applicable.
Informed Consent Statement
Not applicable.
Data Availability Statement
Data are contained within the article.
Acknowledgments
The scientific work was financed by The National Science Centre, Poland under the program “Opus”, project no. 2017/27/B/ST8/02947 and project no. 2017/27/B/ST8/02970.
Conflicts of Interest
The authors declare no conflicts of interest.
References
- Crank, J. The Mathematics of Diffusion; Clarendon Press: Oxford, UK, 1975. [Google Scholar]
- Crank, J. Moving Boundary Problems in Heat Flow and Diffusion; Ockendon, J.R., Hodgkins, R., Eds.; Clarendon Press: Oxford, UK, 1974. [Google Scholar]
- Peng, Y.; Ji, R.; Phan, T.; Chen, X.; Zhang, N.; Xu, S.; Bastawros, A.; Xiong, L. Effect of a Long-Range Dislocation Pileup on the Atomic-Scale Hydrogen Diffusion near a Grain Boundary in Plastically Deformed bcc Iron. Crystals 2023, 13, 1270. [Google Scholar] [CrossRef]
- Radek, E. Stochastic Modelling of Reaction-Diffusion Processes; Cambridge University Press: Cambridge, UK, 2020. [Google Scholar]
- Hu, T.; Ruan, Z.; Fan, T.; Wang, K.; He, K.; Wu, Y. First-Principles Investigation of the Diffusion of TM and the Nucleation and Growth of L12 Al3TM Particles in Al Alloys. Crystals 2023, 13, 1032. [Google Scholar] [CrossRef]
- Mehrer, H. Solutions of the Diffusion Equation. In Diffusion in Solids. Springer Series in Solid-State Sciences; Springer: Berlin/Heidelberg, Germany, 2007; Volume 155. [Google Scholar]
- Tahani, M.; Postek, E.; Sadowski, T. Molecular Dynamics Study of Interdiffusion for Cubic and Hexagonal SiC/Al Interfaces. Crystals 2023, 13, 46. [Google Scholar] [CrossRef]
- Aika, K.; Christiansen, L.J.; Dybkjaer, I.; Hansen, J.B.; Nielsen, P.E.H.; Nielsen, A.; Stolze, P.; Tamaru, K. Ammonia Catalysis and Manufacture; Springer: Berlin/Heidelberg, Germany, 1995. [Google Scholar]
- Jennings, J.R. (Ed.) Catalytic Ammonia Synthesis. Fundamentals and Practice; Plenum Press: New York, NY, USA, 1991. [Google Scholar]
- Ertl, G.; Knözinger, H.; Schüth, F.; Weitkamp, J. (Eds.) Handbook of Heterogeneous Catalysis; Wiley: Weinheim, Germany, 2008. [Google Scholar]
- Nielsen, A. An Investigation on Promoted Iron Catalyst for the Synthesis of Ammonia; Jul. Gjullerupus Forlag: Kopenhagen, Denmark, 1968. [Google Scholar]
- Somorjai, G.A.; Li, Y. Introduction to Surface Chemistry and Catalysis; Wiley: New York, NY, USA, 1994. [Google Scholar]
- Liu, H.Z. Ammonia Synthesis Catalysts: Innovation and Practice; Science Publishing Co., Ltd.: Singapore, 2013. [Google Scholar]
- Grabke, H.J. Reaktionen von Ammoniak, Stickstoff und Wasserstoff an der Oberfläche von Eisen I. Zur Kinetik der Nitrierung von Eisen mit NH3-H2-Gemischen und der Denitrierung. Ber. Bunsenges. Phys. Chem. 1968, 72, 533–541. [Google Scholar] [CrossRef]
- Grabke, H.J. Zur Fehlordnung des γ′-Eisennitrids. Ber. Bunsenges. Phys. Chem. 1969, 73, 596–601. [Google Scholar] [CrossRef]
- Grabke, H.J. Die Kinetik der Nitrierung von Eisen in Abhängigkeit von der Sauerstoffaktivität des Gases. Arch. Eisenhuttenwes. 1973, 44, 603–608. [Google Scholar] [CrossRef]
- Grabke, H.J. Conclusions on the Mechanism of Ammonia-Synthesis from the Kinetics of Nitrogenation and Denitrogenation of Iron. Z. Phys. Chem. Neue Folge 1976, 100, 185–200. [Google Scholar] [CrossRef]
- Grabke, H.J. Corrosion by Carbonaceous Gases, Carburization and Metal Dusting, and Methods of Prevention. Mater. High Temp. 2000, 17, 483–487. [Google Scholar] [CrossRef]
- Jack, K.H. The Iron-Nitrogen System: The Preparation and the Crystal Structures of Nitrogen-Austenite(γ) and Nitrogen-Martensite(α’). Proc. Roy. Soc. A 1951, 208, 200–215. [Google Scholar]
- Jack, K.H. The Iron-Nitrogen System: The Crystal Structures of ε-Phase Iron Nitrides. Acta Crystallogr. 1952, 5, 404–411. [Google Scholar] [CrossRef]
- Lehrer, E. The Equlibrium Iron-Hydrogen-Ammonia. Z. Elektrochem. 1930, 36, 383–392. [Google Scholar]
- Kunze, J. Nitrogen and Carbon in Iron and Steels-Thermodynamics; Akademie Verlag: Berlin, Germany, 1990. [Google Scholar]
- Mittemeijer, E.J.; Somers, M.A.J. Thermochemical Surface Engineering of Steels; Elsevier Science & Technology: Cambridge, UK, 2015. [Google Scholar]
- Aizawa, T.; Yoshino, T.; Morikawa, K.; Yoshihara, S.-I. Microstructure of Plasma Nitrided AISI420 Martensitic Stainless Steel at 673 K. Crystals 2019, 9, 60. [Google Scholar] [CrossRef]
- Pelka, R.; Arabczyk, W. Modelling of Nanocrystalline Iron Nitriding Process—Influence of Specific Surface Area. Chem. Pap. 2011, 65, 198–202. [Google Scholar] [CrossRef]
- Pelka, R.; Arabczyk, W. Studies of the Kinetics of Reaction Between Iron Catalysts and Ammonia − Nitriding of Nanocrystalline Iron with Parallel Catalytic Ammonia Decomposition. Top. Catal. 2009, 52, 1506–1516. [Google Scholar] [CrossRef]
- Wróbel, R.; Arabczyk, W. Solid-Gas Reaction with Adsorption as the Rate Limiting Step. J. Phys. Chem. A 2006, 110, 9219–9224. [Google Scholar] [CrossRef]
- Wilk, B.; Pelka, R.; Arabczyk, W. Study of the Iron Catalyst for Ammonia Synthesis by Chemical Potential Programmed Reaction Method. J. Phys. Chem. C 2017, 121, 8548–8556. [Google Scholar] [CrossRef]
- Arabczyk, W.; Ekiert, E.; Pelka, R. Size-Dependent Transformation of α-Fe into γ′-Fe4N in the Nanocrystalline Fe-NH3-H2 System. J. Phys. Chem. C 2016, 120, 17989–17995. [Google Scholar] [CrossRef]
- Arabczyk, W.; Ekiert, E.; Pelka, R. Hysteresis Phenomenon in a Reaction System of Nanocrystalline Iron and a Mixture of Ammonia and Hydrogen. Phys. Chem. Chem. Phys. 2016, 18, 25796–25800. [Google Scholar] [CrossRef]
- Available online: https://www.tf.uni-kiel.de/matwis/amat/iss/kap_5/illustr/s5_2_3d.html (accessed on 2 March 2023).
- Gorban, A.N.; Sargsyan, H.P.; Wahab, H.A. Quasichemical Models of Multicomponent Nonlinear Diffusion. Math. Model. Nat. Phenom. 2011, 6, 184–262. [Google Scholar] [CrossRef]
- Porter, D.A.; Easterling, K.E.; Sherif, M.Y. Phase Transformations in Metals and Alloys, 3rd ed.; CRC Press: Boca Raton, FL, USA, 2009. [Google Scholar]
- Kaptay, G. Partial Surface Tension of Components of a Solution. Langmuir 2015, 31, 5796–5804. [Google Scholar] [CrossRef]
- Kaptay, G. Modelling Equilibrium Grain Boundary Segregation, Grain Boundary Energy and Grain Boundary Segregation Transition by the Extended Butler Equation. J. Mater. Sci. 2016, 51, 1738–1755. [Google Scholar] [CrossRef]
- Kaptay, G. Nano-Calphad: Extension of the Calphad Method to Systems with Nano-Phases and Complexions. J. Mater. Sci. 2012, 47, 8320–8335. [Google Scholar] [CrossRef]
- Englezos, P.; Alavi, S.; Ripmeester, J.A. Kinetics of Clathrate Hydrate Processes. In Clathrate Hydrates: Molecular Science and Characterization; Ripmeester, J.A., Alavi, S., Eds.; WILEY-VCH: Weinheim, Germany, 2022. [Google Scholar]


Disclaimer/Publisher’s Note: The statements, opinions and data contained in all publications are solely those of the individual author(s) and contributor(s) and not of MDPI and/or the editor(s). MDPI and/or the editor(s) disclaim responsibility for any injury to people or property resulting from any ideas, methods, instructions or products referred to in the content. |
© 2024 by the authors. Licensee MDPI, Basel, Switzerland. This article is an open access article distributed under the terms and conditions of the Creative Commons Attribution (CC BY) license (https://creativecommons.org/licenses/by/4.0/).