Article

Effect of TiO2 on the Microstructure and Flexural Strength of Lunar Regolith Simulant

School of Electromechanical Engineering, Guangdong University of Technology, Guangzhou 510006, China
*
Author to whom correspondence should be addressed.
Crystals 2024, 14(2), 110; https://doi.org/10.3390/cryst14020110
Submission received: 27 December 2023 / Revised: 19 January 2024 / Accepted: 21 January 2024 / Published: 23 January 2024
(This article belongs to the Special Issue Ceramics: Processes, Microstructures, and Properties)

Abstract

:
Lunar regolith is the preferred material for lunar base construction using in situ resource utilization technology. The TiO2 variations in lunar regolith collected from different locations significantly impact its suitability as a construction material. Therefore, it is crucial to investigate the effects of TiO2 on the properties of lunar regolith. This study aims to evaluate the influence of TiO2 content and sintering temperature on phase transformation, microstructure, and macroscopic properties (e.g., the shrinkage rate, mechanical properties, and relative density) of lunar regolith simulant samples (CUG-1A). The flexural strength and relative density of the sample with a TiO2 content of 6 wt% sintered at 1100 °C reached 136.66 ± 4.92 MPa and 91.06%, which were 65% and 12.28% higher than those of the sample not doped with TiO2, respectively. The experiment demonstrated that the doped TiO2 not only reacted with Fe to form pseudobrookite (Fe2TiO5) but also effectively reduced the viscosity of the glass phase during heat treatment. As the sintering temperature increased, the particles underwent a gradual melting process, leading to a higher proportion of the liquid phase. The higher liquid-phase content had a positive impact on the diffusion of mass transfer, causing the voids and gaps between particles to shrink. This shrinkage resulted in greater density and, ultimately, improved the mechanical properties of the material.

1. Introduction

The Moon, being the closest celestial body to Earth, unquestionably serves as the primary destination for human space exploration. The unique environment and rich mineral resources on the Moon are strategically significant for space exploration [1,2,3]. Therefore, the construction of a lunar base, as a scientific research facility or supply station for deep space exploration, on the surface of the Moon is necessary [4,5]. Dispatching resources through Earth–Moon round-trip transportation is uneconomical because it entails significant depletion of Earth’s resources. To address this, the concept of in situ resource utilization (ISRU) technology was proposed after the first human landing on the Moon, and it has been widely recognized by the industry. Lunar regolith is formed through a series of extraterrestrial processes, including meteorite impacts, exposure to cosmic radiation, and solar wind activity. It exhibits an irregular shape with a wide particle-size distribution and non-uniform thickness; it comprises olivine, feldspar, pyroxene, and spinel minerals, along with a considerable amount of glass [6,7,8,9]. These characteristics underscore the abundant availability and potential suitability of lunar regolith as a construction material for future lunar bases using ISRU technology [10,11].
The scarcity and high value of lunar regolith samples retrieved from the Moon pose a challenge for large-scale scientific research. Consequently, countries worldwide have developed lunar regolith simulants [12], such as FJS-1 [13,14], CAS-1 [15], and JSC-1 [16,17], based on the composition of existing lunar regolith. However, whether it is lunar regolith simulant or authentic lunar regolith, their intricate and diverse composition will give rise to complex chemical reactions during the sintering process. Numerous studies (Song et al. [18]; Fateri et al. [19]; Lim et al. [20]) have indicated that different types of lunar regolith simulants are susceptible to foaming, swelling, and other defects that significantly impact the mechanical strength of samples during firing. The underlying causes of these issues have not been fully addressed in the current literature [12]. Presently, research has demonstrated that the presence of non-lunar phases such as carbonate, sulfate, and hydrate leads to degassing of lunar soil simulant during vacuum treatment; moreover, gas phase dissolution in Earth or lunar materials throughout this process may facilitate pore formation [21,22]. Wang et al. [23] investigated the correlation between the laser melting diameter and melting depth of the CUG-1A lunar regolith simulant. The results show intricate gradation relationships in the particle characteristics of CUG-1A, with samples exhibiting the prevalent presence of pores and cracks, which had detrimental effects on the mechanical properties. This caused deterioration in the mechanical properties of the samples and affected the viability of lunar regolith as an in situ resource for constructing lunar bases.
According to the publicly available data, significant disparities have been observed in the average chemical composition of lunar regolith samples collected at various locations during both the Apollo manned lunar landing program and the Soviet lunar exploration program [24,25]. Variations are expected to appear in the mechanical properties of raw construction materials derived from lunar regolith obtained from different collection sites. According to the published literature, lunar regolith simulants such as JSC-1 [26], MLS-1, MLS-2 [27], FJS-1, MKS-1 [28,29], and CAS-1 [15] have been designed to mimic the low-titanium soil of the Apollo 14 landing site or the high-titanium soil of the Apollo 11 landing site. However, the physical and chemical properties of these lunar regolith simulants differ from those of the lunar regolith. For instance, MLS-1 has a composition similar to that of the lunar regolith at the Apollo 11 landing site; however, it lacks the vitreous content and only acquires it after special processing. MLS-2 is similar to the lunar regolith in terms of only the chemical composition. FJS-1 and MKS-1, which resemble the lunar regolith at the Apollo 11 and Apollo 14 landing sites, respectively, exhibit significant differences in spectral and electrical properties to those of the lunar regolith [30]. Therefore, the future utilization of lunar regolith as an in situ material for constructing moon bases requires the extensive processing and preparation of building materials to eliminate performance disparities among the raw materials and ensure standardized product content requirements.
Currently, lunar regolith is primarily classified as low-titanium and high-titanium samples, based on the different collection points and average chemical composition [31,32,33,34], and this classification is adopted by various countries for the preparation of lunar regolith simulants. The titanium content varies in different lunar regolith samples, and such disparities may significantly affect the performance of the lunar regolith, thereby affecting its reliability as a construction material for lunar bases. Moreover, only a few studies have been conducted to investigate the effect of titanium on the performance of simulated lunar regolith. Dou et al. [35] proposed incorporating a small number of additive materials, such as oxides or low-melting-point glass, into lunar regolith samples to induce the formation of glassy phases during the sintering process. This approach aims to enhance the relative density and mechanical properties of lunar regolith, serving as the driving force behind this study. TiO2 is a component of lunar regolith, and the Ti content in the lunar regolith collected from various places varies. These variations will inevitably affect the properties of the prepared materials; therefore, the effect of Ti on the performance of lunar regolith simulants must be studied. To select the sintering environment, Dou et al. [35] conducted a comprehensive assessment of the impact of a sintering atmosphere on the phase transformation, microstructure, and mechanical properties of sintered lunar regolith samples fabricated through digital light processing (DLP)–stereolithography; their findings indicated that the mechanical properties of samples sintered in air were superior to those sintered in argon. Song et al. [18] reported that closed pores tend to swell under vacuum because of the pressure difference; when the closed pores continue to swell, they break and form open pores, thus hindering sample densification. This study considers that the establishment of a lunar base represents a multidisciplinary and collaborative endeavor, characterized by its sustained and long-term nature. In the imminent future, when a lunar base is effectively constructed, the provision of oxygen will become high, enduring, and sustainable. Additionally, the feasibility of extracting oxygen from lunar regolith has been demonstrated in previous studies, which can generate an oxygen atmosphere and the required air pressure for sintering lunar regolith samples [36,37]. Consequently, this investigation employed sintering in an air environment.
In this study, we proposed a method for incorporating TiO2 in varying proportions into the CUG-1A lunar regolith simulant as an additive component and implemented a sintering temperature gradient to investigate the effect of TiO2 on the relative density and flexural strength of CUG-1A. Furthermore, we assessed and elucidated the effects of TiO2 on the phase change, microstructure, and macroscopic properties of CUG-1A. We also determined the optimal ratios and sintering processes for achieving excellent mechanical properties during the preparation of CUG-1A. The aim of this study is to provide valuable insights for future research on ISRU technology and other related fields concerning lunar regolith.

2. Experimental Section

2.1. Materials

CUG-1A, the lunar regolith simulant, was provided by the Qian Xuesen Laboratory of Space Technology. CUG-1A [38,39,40] was developed and prepared at the China University of Geosciences. The raw materials were acquired from the Cenozoic volcanic rocks in Huinan County, Jilin Province, China. The main components of CUG-1A are listed in Table 1 [39] and include silicate minerals such as pyroxene (Ca, Mg, Fe)2Si2O6, anorthite (Ca, Na)(Al, Si)4O8, hortonolite (Mg, Fe)3SiO4, non-silicate ilmenite FeTiO3, and other amorphous phases. CUG-1A is classified as a low-titanium basalt analog owing to its low Ti content [31]. Its chemical composition and physical properties are comparable to those of the lunar regolith collected at the Apollo 14 sampling points; thus, it is an ideal low-titanium lunar regolith simulant. A CUG-1A–TiO2 mixed powder was prepared using nanoscale TiO2 powder (Titanium dioxide, anatase, Shanghai Aladdin Biotechnology Co., Ltd., Shanghai, China) as the additive component.

2.2. Sample Preparation

The CUG-1A–TiO2 samples were prepared as follows: First, the raw materials were accurately weighed using an analytical weighing balance and then mixed with anhydrous ethanol. The designed chemical compositions are presented in Table 2; T4, T6, and T10 are the experimental groups, and T0 is the control group. Subsequently, planetary ball milling was performed at 360 r/min for 2, 4, 6, 8, and 10 h, respectively, to ensure thorough mixing of CUG-1A and TiO2 and determine the optimal ball-milling process. The resultant powder was dried at 60 °C for 4 h, followed by screening through a 200-mesh sieve to obtain the CUG-1A–TiO2 mixed powder. Finally, the obtained dry powder (18 g) was placed in a cylindrical stainless steel mold with an inner diameter of 40 mm and pressed using a four-top dry press under a pressure of 6 MPa for 1 min to form round sheets with a diameter of 40 mm and a thickness of 6 mm. CUG-1A–TiO2 was prepared by applying isostatic pressing at 120 MPa for 300 s.

2.3. Sintering Experiments

The sintering process was conducted using a commercial box-type sintering furnace. CUG-1A-TiO2 samples were placed on an Al2O3 substrate in a quartz ship during sintering. The target temperatures were set at 1050, 1100, 1120, 1140, and 1160 °C. The heating rate was maintained at 5 °C/min until the target temperature was reached, and the samples were held at that temperature for 2 h. Subsequently, controlled cooling was carried out at a rate of 3 °C/min. Upon reaching 500 °C, the CUG-1A-TiO2 samples underwent natural cooling within the furnace.

2.4. Characterization

The particle size distribution of the powder was determined using a laser diffraction particle size analyzer (Mastersizer 2000, Malvern, UK), mixed with a small amount of water, and the refractive index of the powder was adjusted to 1.7. The phase composition of the sample was tested using an X-ray diffractometer (XRD, D8-Advance, Bruker, Germany), in which the scanning angle was 10~70°, and the step length was 0.02°. Thermal analysis of the samples was performed using a synchronous thermal analyzer (TGA/DSC3+, Mettler Toledo, Greifensee, Switzerland) in an air environment ranging from room temperature to 1200 °C, with a heating rate of 10 °C/min.
The bulk density (ρ) of the sample was determined using the Archimedes drainage method, and an average value was obtained from five measurements. Given the complex composition of the simulated lunar soil and its propensity for phase changes during sintering, the sample underwent grinding and screening through a 100-mesh sieve. Subsequently, its real density (ρreal) was measured using a specific gravity bottle. The real density of the ground powder served as a substitute for the theoretical density of the sample. The equation for calculating the relative density (ρr) is as follows:
ρr = ρ/ρreal
The diameter and height of the disc before and after sintering were measured using a vernier caliper, and the shrinkage of the sintering line of the sample in the X/Y and Z axes was calculated using the following formula:
η X / Y = R 0 R 1 R 0 × 100 %
η Z = H 0 H 1 H 0 × 100 %
where ηX/Y is the linear shrinkage of the sample along the X/Y axes, R0 is the diameter of the sample before sintering, R1 is the diameter of the sample after sintering, ηZ is the linear shrinkage of the sample along the Z-axis, H0 is the height of the sample before sintering, and H1 is the height of the sample after sintering (unit: mm).
Asper ASTM standard C1161-13 [38], a three-point bending test was performed using a universal mechanical testing machine (Inspekt Table Blue 05, Hegewald & Peschke, Nossen, Germany) to evaluate the flexural strength of the sample. The sintered sample was cut into a cuboid measuring 3.0 mm × 4.0 mm × 35 mm using a small diamond wire cutter (STX-202A), and its surface was subsequently polished. The test span was set at 30 mm, with a loading speed of 0.5 mm/min. Five samples were tested to take the average value.
Energy-dispersive X-ray spectroscopy (EDS) elemental analysis was performed using an X-ray photoelectron spectroscopy (Inca X-Max50, Oxford Instruments, Abingdon, UK) combined with field-emission scanning electron microscopy (SEM; SU8220, Hitachi, Tokyo, Japan) to observe the microstructure of the sample, including the microstructure of the powder, the morphology of the block fracture surface and the polished surface, and the element analysis of the block polished surface energy spectrum. Due to the extremely low conductivity of the CUG-1A–TiO2 sintered samples, a pre-gold spraying treatment was required before testing.

3. Results and Discussion

3.1. CUG-1A–TiO2 Ball-Milling Process

As previously mentioned, lunar regolith particles exhibit irregular shapes and a wide range of particle-size distributions. Sintering without pre-treatment adversely affects the performance of a sample [10,11]. During the sintering of fine particles, the atomic diffusion distance reduces, thus enhancing particle solubility in the liquid phase and facilitating faster and more efficient sintering; this contributes to the improved properties of the sample [41]. Therefore, to eliminate this interfering factor, the CUG-1A–TiO2 powder was initially subjected to ball milling for different durations to determine the optimal process. The particle sizes of the CUG-1A–TiO2 powder with different ball-milling durations are presented in Table 3. After 6 h of ball milling, the particle size of T0 (D10, D50, and D90) decreased by 131%, 233%, and 163%, respectively, compared with the initial state (0 h). However, after a milling duration of 8 h, no significant change was observed in the particle size of CUG-1A–TiO2. The variation curve for the specific surface area of the T6 powder after ball milling was also examined (Figure 1); it showed an increase with a prolonged ball-milling duration. When the milling duration exceeded 6 h, no substantial changes were observed in the specific surface area of the powder. These results indicate that after a ball-milling duration of 6 h, the effect of ball milling on the CUG-1A–TiO2 powder particles becomes negligible. Considering both the post-milling properties and experimental efficiency factors, we determined a ball-milling duration of precisely 6 h to be optimal.
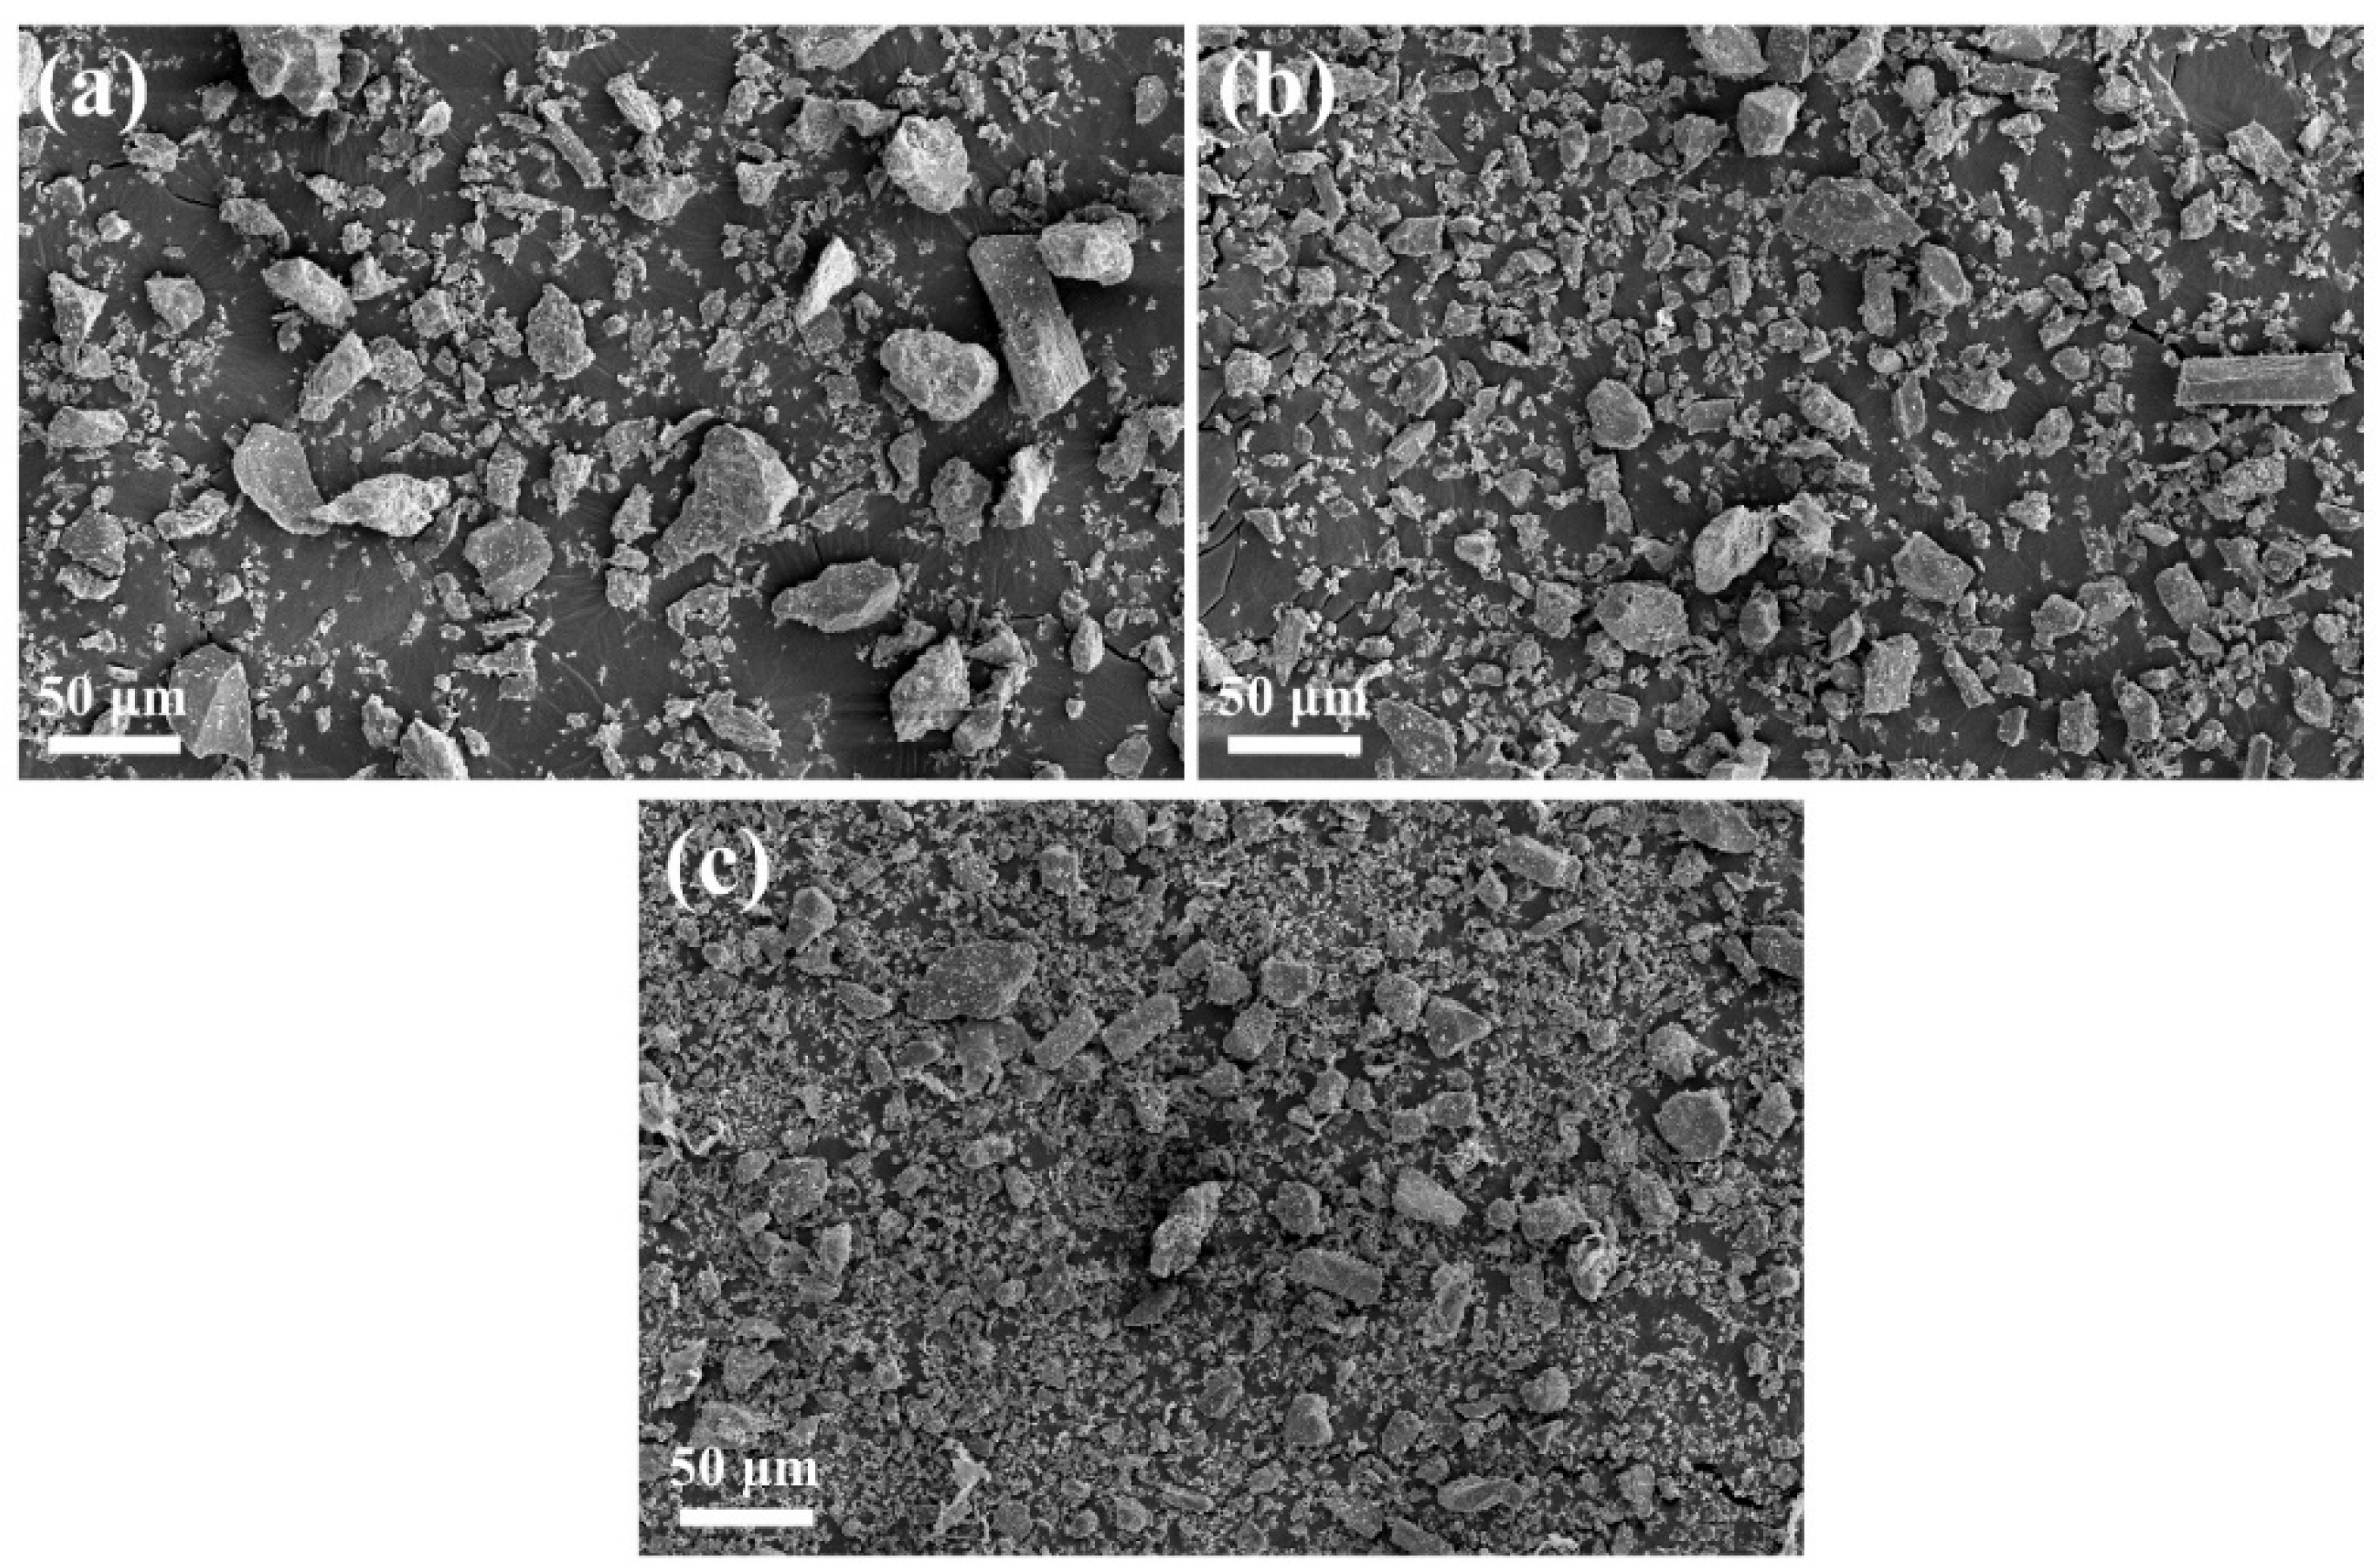
The SEM image in Figure 2 shows the T6 powder morphology at the milling durations of 0, 2, and 6 h. An evident refinement and uniformity of the powder can be observed with increasing milling duration. As shown in Figure 2c, the large particles depicted in Figure 2a are eliminated, whereas the aspect ratio and specific surface area of the particles are enhanced. Thus, ball milling for 6 h to prepare and sinter the powder yields a sample surface that exhibits significantly improved performance compared with direct preparation and sintering without ball milling.

3.2. Phase Analysis

The phase evolution during the sintering process was analyzed to better understand the effect of varying the TiO2 content on the thermodynamic behavior of CUG-1A–TiO2. The XRD pattern (Figure 3) of the CUG-1A–TiO2 samples indicates the presence of pseudobrookite (PDF#41-1432), diopside (PDF#41-1370), anorthite (PDF#41-1481), forsterite (PDF#34-0189), augite (PDF#41-1483), and amorphous glass. Additionally, a weak diffraction peak corresponding to magnesium dititanate (MgTi2O5) (PDF#35-0792) is observed for T10. Compared with T0, the diffraction peak of pseudobrookite (Fe2TiO5) becomes more apparent as the TiO2 content increases, whereas the intensity of the hematite (Fe2O3) (PDF#33-0664) peak weakens. All the PDF cards can be found in the Supplementary Materials. When the TiO2 content exceeds 6 wt%, some hematite peaks disappear. Furthermore, as the TiO2 content increases, the intensity of the diffraction peaks for certain augite and forsterite minerals initially increases and then decreases. This may be due to the potential vitrification of silicate minerals at high temperatures, forming an amorphous phase. Alternatively, it could be attributed to the generation of volatiles with low melting points. The XRD patterns of T6 samples sintered at different temperatures are presented in Figure 4. It is evident that with increasing temperature, the diffraction peaks of pseudobrookite, diopside, anorthite, forsterite, and augite initially intensify and then weaken; however, the peaks corresponding to hematite (Fe2O3) diminish and eventually disappear. Nevertheless, when the temperature reaches 1160 °C, prominent diffraction peaks cannot be observed in the XRD curve. The XRD (Figure 4) shows the loss of peaks at an elevated sintering temperature, indicating the mineral underwent significant vitrification, resulting in the formation of a glass phase, and it also indicates the formation of a magnesium-rich phase. Some studies have demonstrated that the melting temperature plays a crucial role in silicate formation and that, in addition to other factors, the mineral composition, flux compounds, presence and abundance of volatiles, and disordered substances contribute to the variations in the melting temperature of CUG-1A–TiO2 [42]. In addition, as is known, the amorphous phases with disordered structures and low softening temperatures can be more unstable [18,35]. Furthermore, the alteration could be intensified by elevated temperatures.
The phase compositions of the air-sintered samples undergo significant changes, including the formation of Fe2O3, Fe2TiO5, and TiO2. According to the research conducted by Zhang et al. [43], the formation of ilmenite products during sintering is highly dependent on temperature. At temperatures ranging from 600 to 800 °C, ilmenite undergoes oxidation, converting ferrous iron to ferric iron, and new phases such as Fe2Ti3O9, Fe2O3, and TiO2 emerge. However, the Fe2Ti3O9 phase is metastable and disappears at temperatures above approximately 1000 °C, decomposing into Fe2TiO5 and TiO2. At 1000 °C, Fe2TiO5 begins to form due to the decomposition of Fe2Ti3O9 and the combination reaction of Fe2O3 and TiO2. The correlation equations are presented in (4), (5), and (6).
4FeTiO3 + O2 = Fe2Ti3O9 + Fe2O3 + TiO2
Fe2Ti3O9 = Fe2TiO5 + 2TiO2
Fe2O3 + TiO2 = Fe2TiO5
Chen et al. [44] investigated the elevated-temperature behavior of ilmenite and proposed that the oxidation products of FeTiO3 vary with increasing temperature. At 600–800 °C, ferrous iron oxidizes to form an intermediate Fe2O3·2TiO2 phase (7). Chen et al. [45] also noted that the Fe2O3·2TiO2 and Fe2Ti3O9 phases are metastable at high temperatures. Thus, at 600–1000 °C, the Fe2O3·2TiO2 phase decomposes to form Fe2O3 and TiO2 (8). Furthermore, Fe2Ti3O9 decomposes into Fe2O3 and TiO2 at above ~1000 °C (9). Fe2TiO5 is formed from the recombination of Fe2O3 with TiO2 at 1000–1200 °C (10). Although the specific temperature for the high-temperature formation of Fe2TiO5 varies across different studies, a general correspondence can be noted between the formation and the temperature range within which Fe2TiO5 is formed.
2FeTiO3 + 1/2O2 = Fe2O3·2TiO2
Fe2O3 2TiO2 = Fe2O3 + 2TiO2
Fe2Ti3O9 = Fe2TiO5+ 2TiO2
Fe2O3 +TiO2 = Fe2TiO5
By analyzing the T0 curve and cross-referencing Table 2, we can see that the CUG-1A utilized in this experiment belongs to the category of low-titanium lunar regolith simulant, with a TiO2 content of approximately 1.9 wt%. Consequently, even after the aforementioned reactions, the formation of Fe2TiO5 is inevitably limited. This observation is consistent with the subdued diffraction peak of Fe2TiO5 in the T0 curve of the XRD pattern. With increasing TiO2 content, hematite (Fe2O3) can react sufficiently with abundant TiO2 to generate Fe2TiO5 (6) or (10) at elevated temperatures. This phenomenon further indicates the weakening of the diffraction peak of Fe2O3, along with a gradual enhancement of the diffraction peak of Fe2TiO5. These findings are consistent with those of Zhang et al. [43] and Chen et al. [44].

3.3. Thermal Analysis

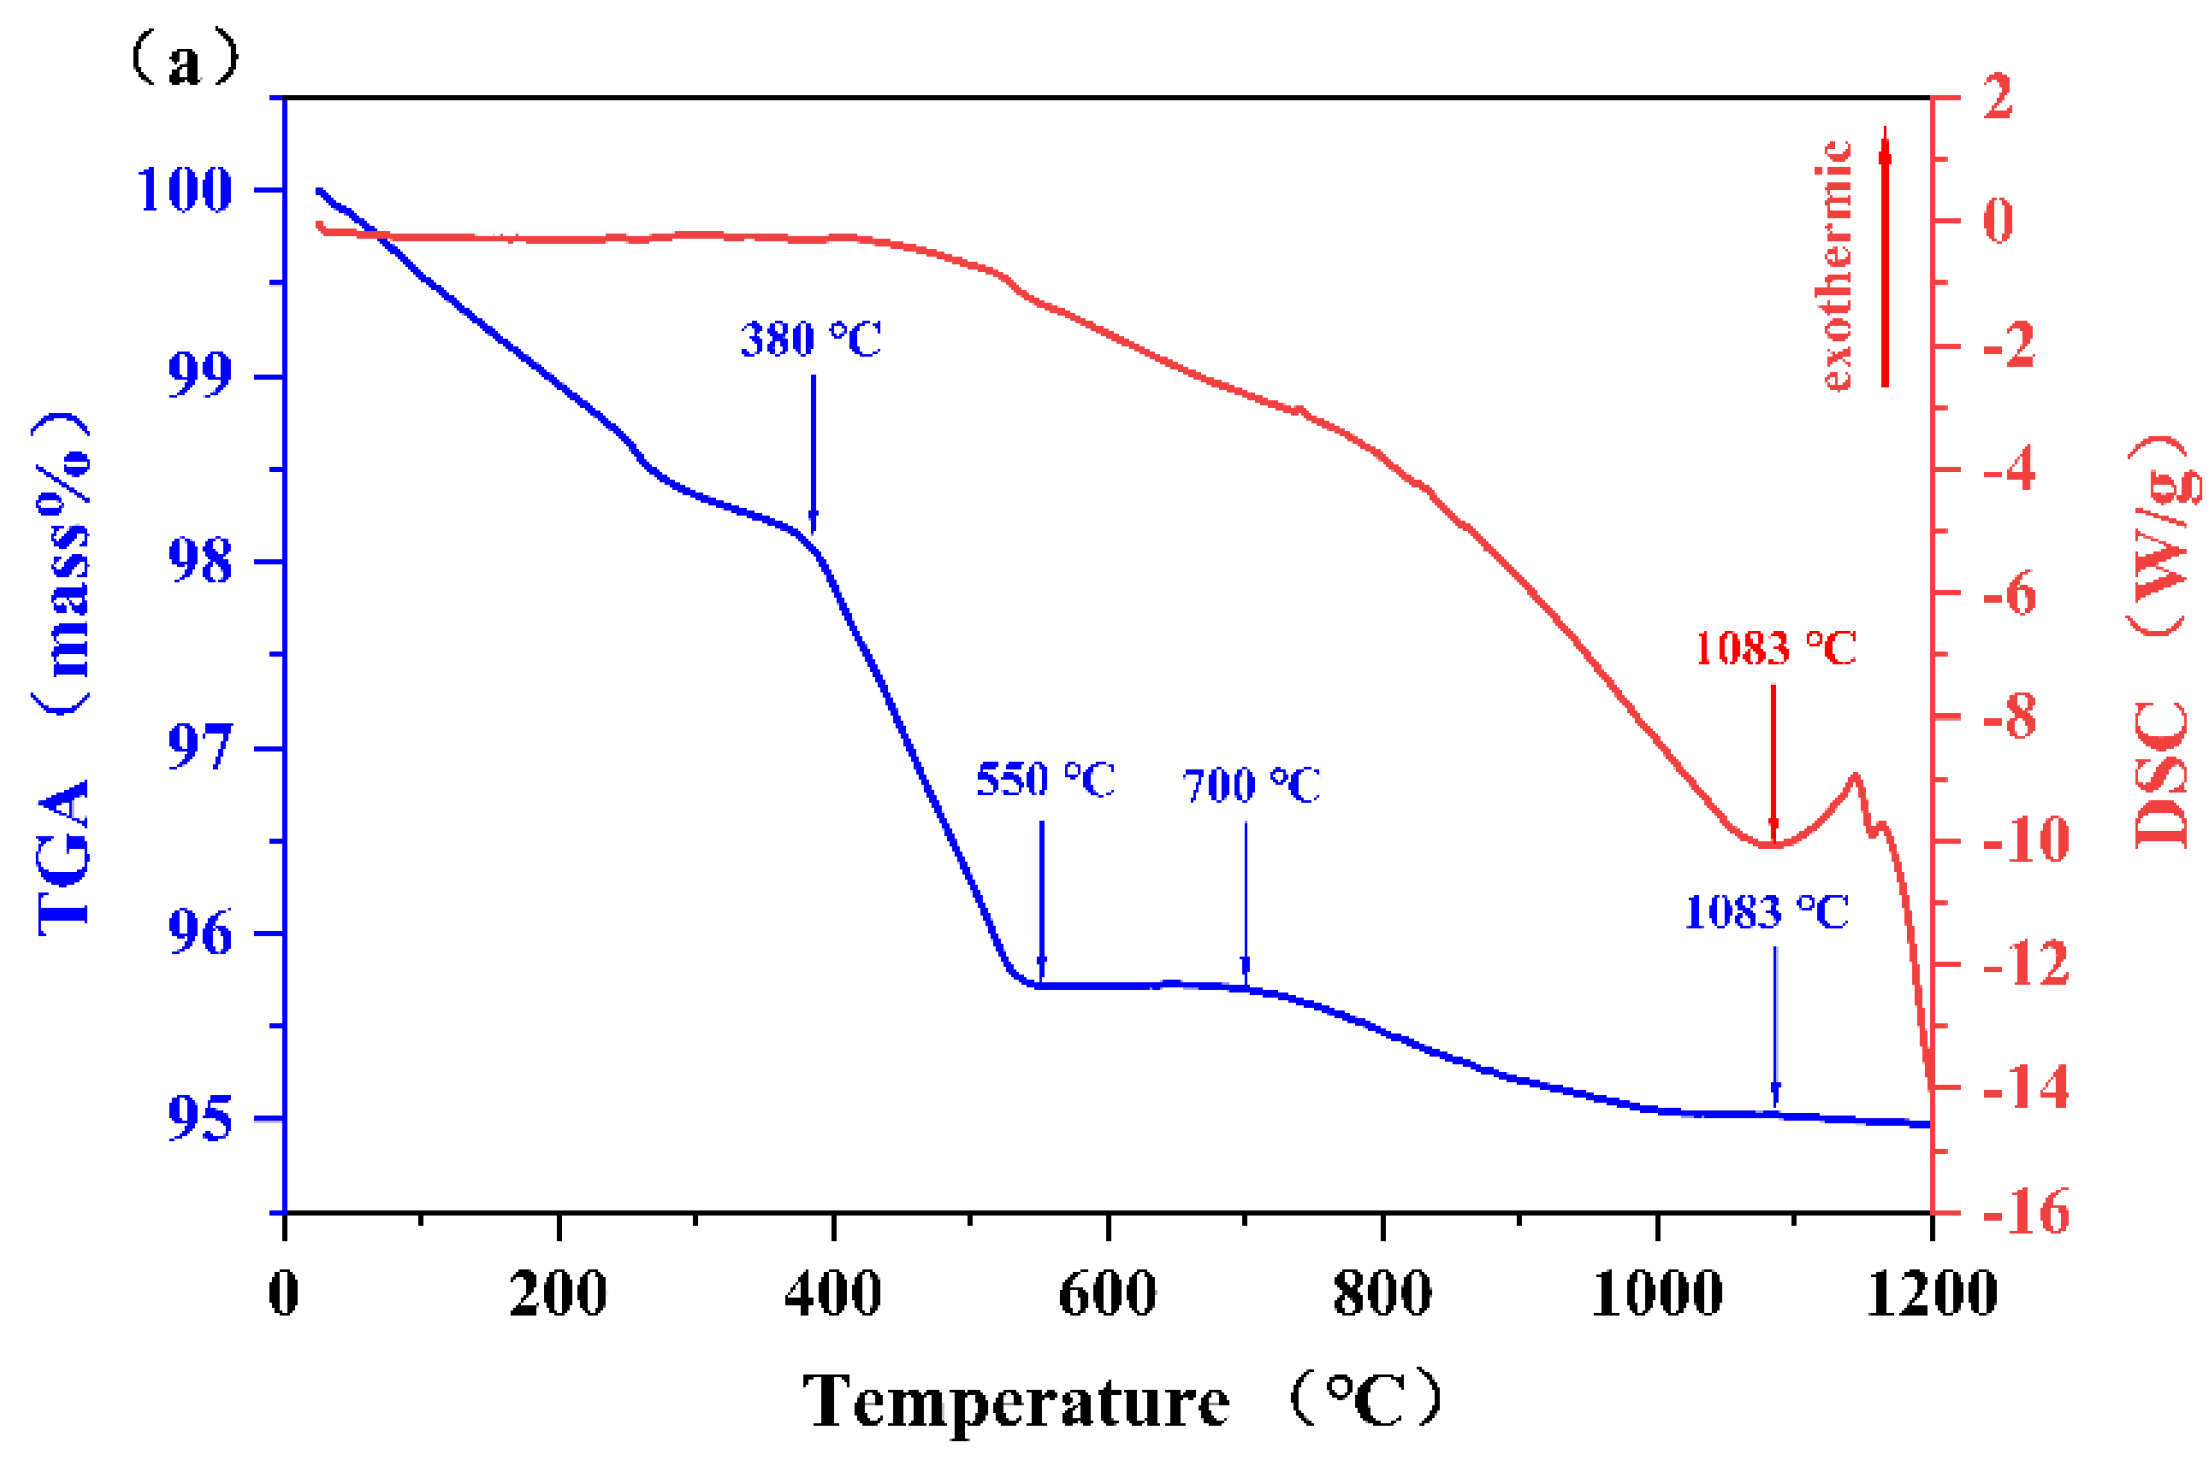
The synchronous thermal analysis (TGA-DSC) results of T0 and T6 are presented in Figure 5, revealing distinct differences between the two sets of curves. Additionally, the weightlessness process for T0 can be roughly categorized into three stages (Figure 5a): the first stage occurs from room temperature to approximately 380 °C, during which the primary transformation in the sample involves the volatilization of water, encompassing both adsorbed water molecules on particle surfaces and within the crystal lattice. The second stage takes place between around 380 °C and 550 °C, characterized by a discernible steepening of the curve slope, indicating an elevated rate of mass loss. Wilkerson et al. [21] determined that the mass loss events occurring at different temperature ranges during the heat treatment of lunar regolith simulant JSC-1A have distinct origins and compositions. The mass loss observed from approximately 200 °C to 500 °C primarily consists of H2O, CO, CO2, SO2, and SO3, which is likely a result of either physisorbed gases or the decomposition of carbonates and sulfates with low stability. A significant mass loss, accompanied by a substantial evolution of CO2, is observed in the temperature range of 500 °C to 600 °C. This mass loss is attributed to the decomposition of a non-lunar trace carbonate, such as CaCO3. Notably different from the vacuum sintering investigated in that study, air sintering involving oxygen effectively increases the heat energy required for the fusion process of amorphous phases and expedites their molten state evaporation [45,46]. Thus, considering that the sintering was conducted in an ambient air environment in this study, and the CUG-1A composition contained only minimal amounts of sulfide, it is likely that the material loss at this stage resulted from hydration phase decomposition and carbonate decomposition. The third stage occurs above ~700 °C; the rate of weightlessness decreases. The evident heat absorption peak is observed at 1083 °C in the corresponding DSC curve. This phenomenon may be attributed to the depletion of specific silicate materials, and the amorphous phase is vitrifying these mineral phases.
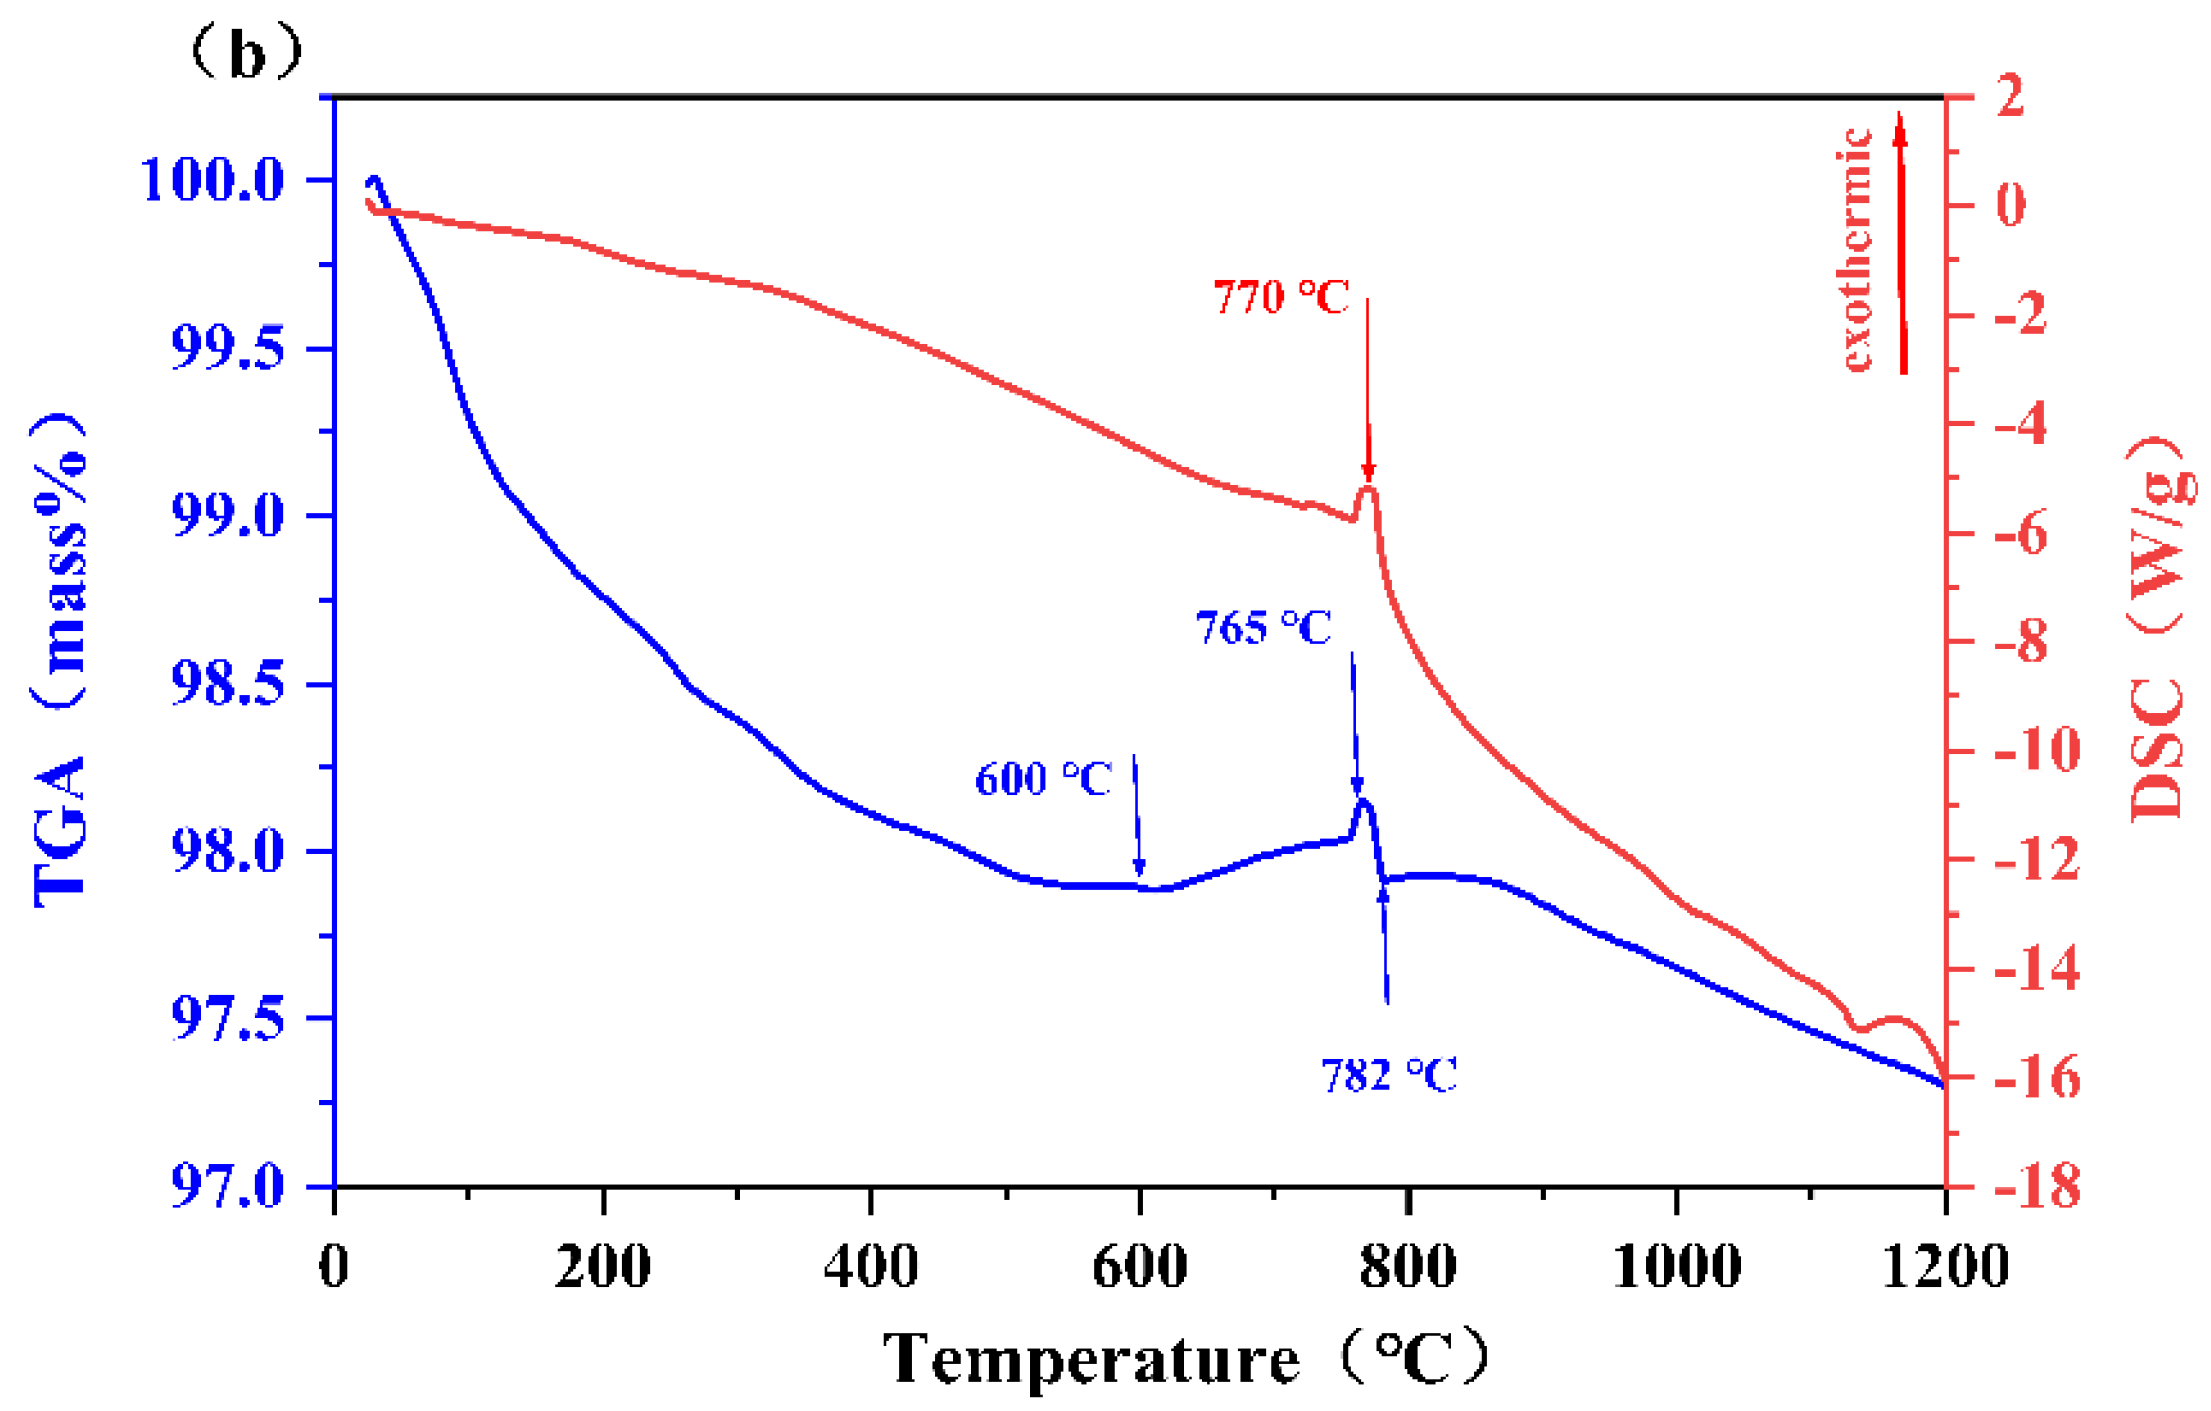
The TGA-DSC results of T6 (Figure 5b) show an unexpected rise in the TGA curve between 600 °C and 783 °C, indicating the formation of new substances during high-temperature sintering. In addition, from 765 °C to 773 °C, a simultaneous exothermic peak appears in the DSC curves, providing evidence for our inference in Section 3.2: we speculate that TiO2 inclusion causes an increase in the amount of Fe2Ti3O9, which subsequently decomposes into pseudobrookite (Fe2TiO5) as the temperature further increases. Notably, at equivalent temperatures, T6 experiences a substance loss that is 2.4465% lower than that of T0, suggesting that TiO2 can react with molten amorphous Fe to form Fe2TiO5 and reduce the generation of volatile amorphous phases during the high-temperature firing of the CUG-1A. The diffraction peaks of pyroxene and olivine in the experimental group are stronger than those for T0, further supporting the results of this analysis, which means that the addition of TiO2 may inhibit the decomposition or evaporation of mineral components.

3.4. Microstructure and EDS Analysis

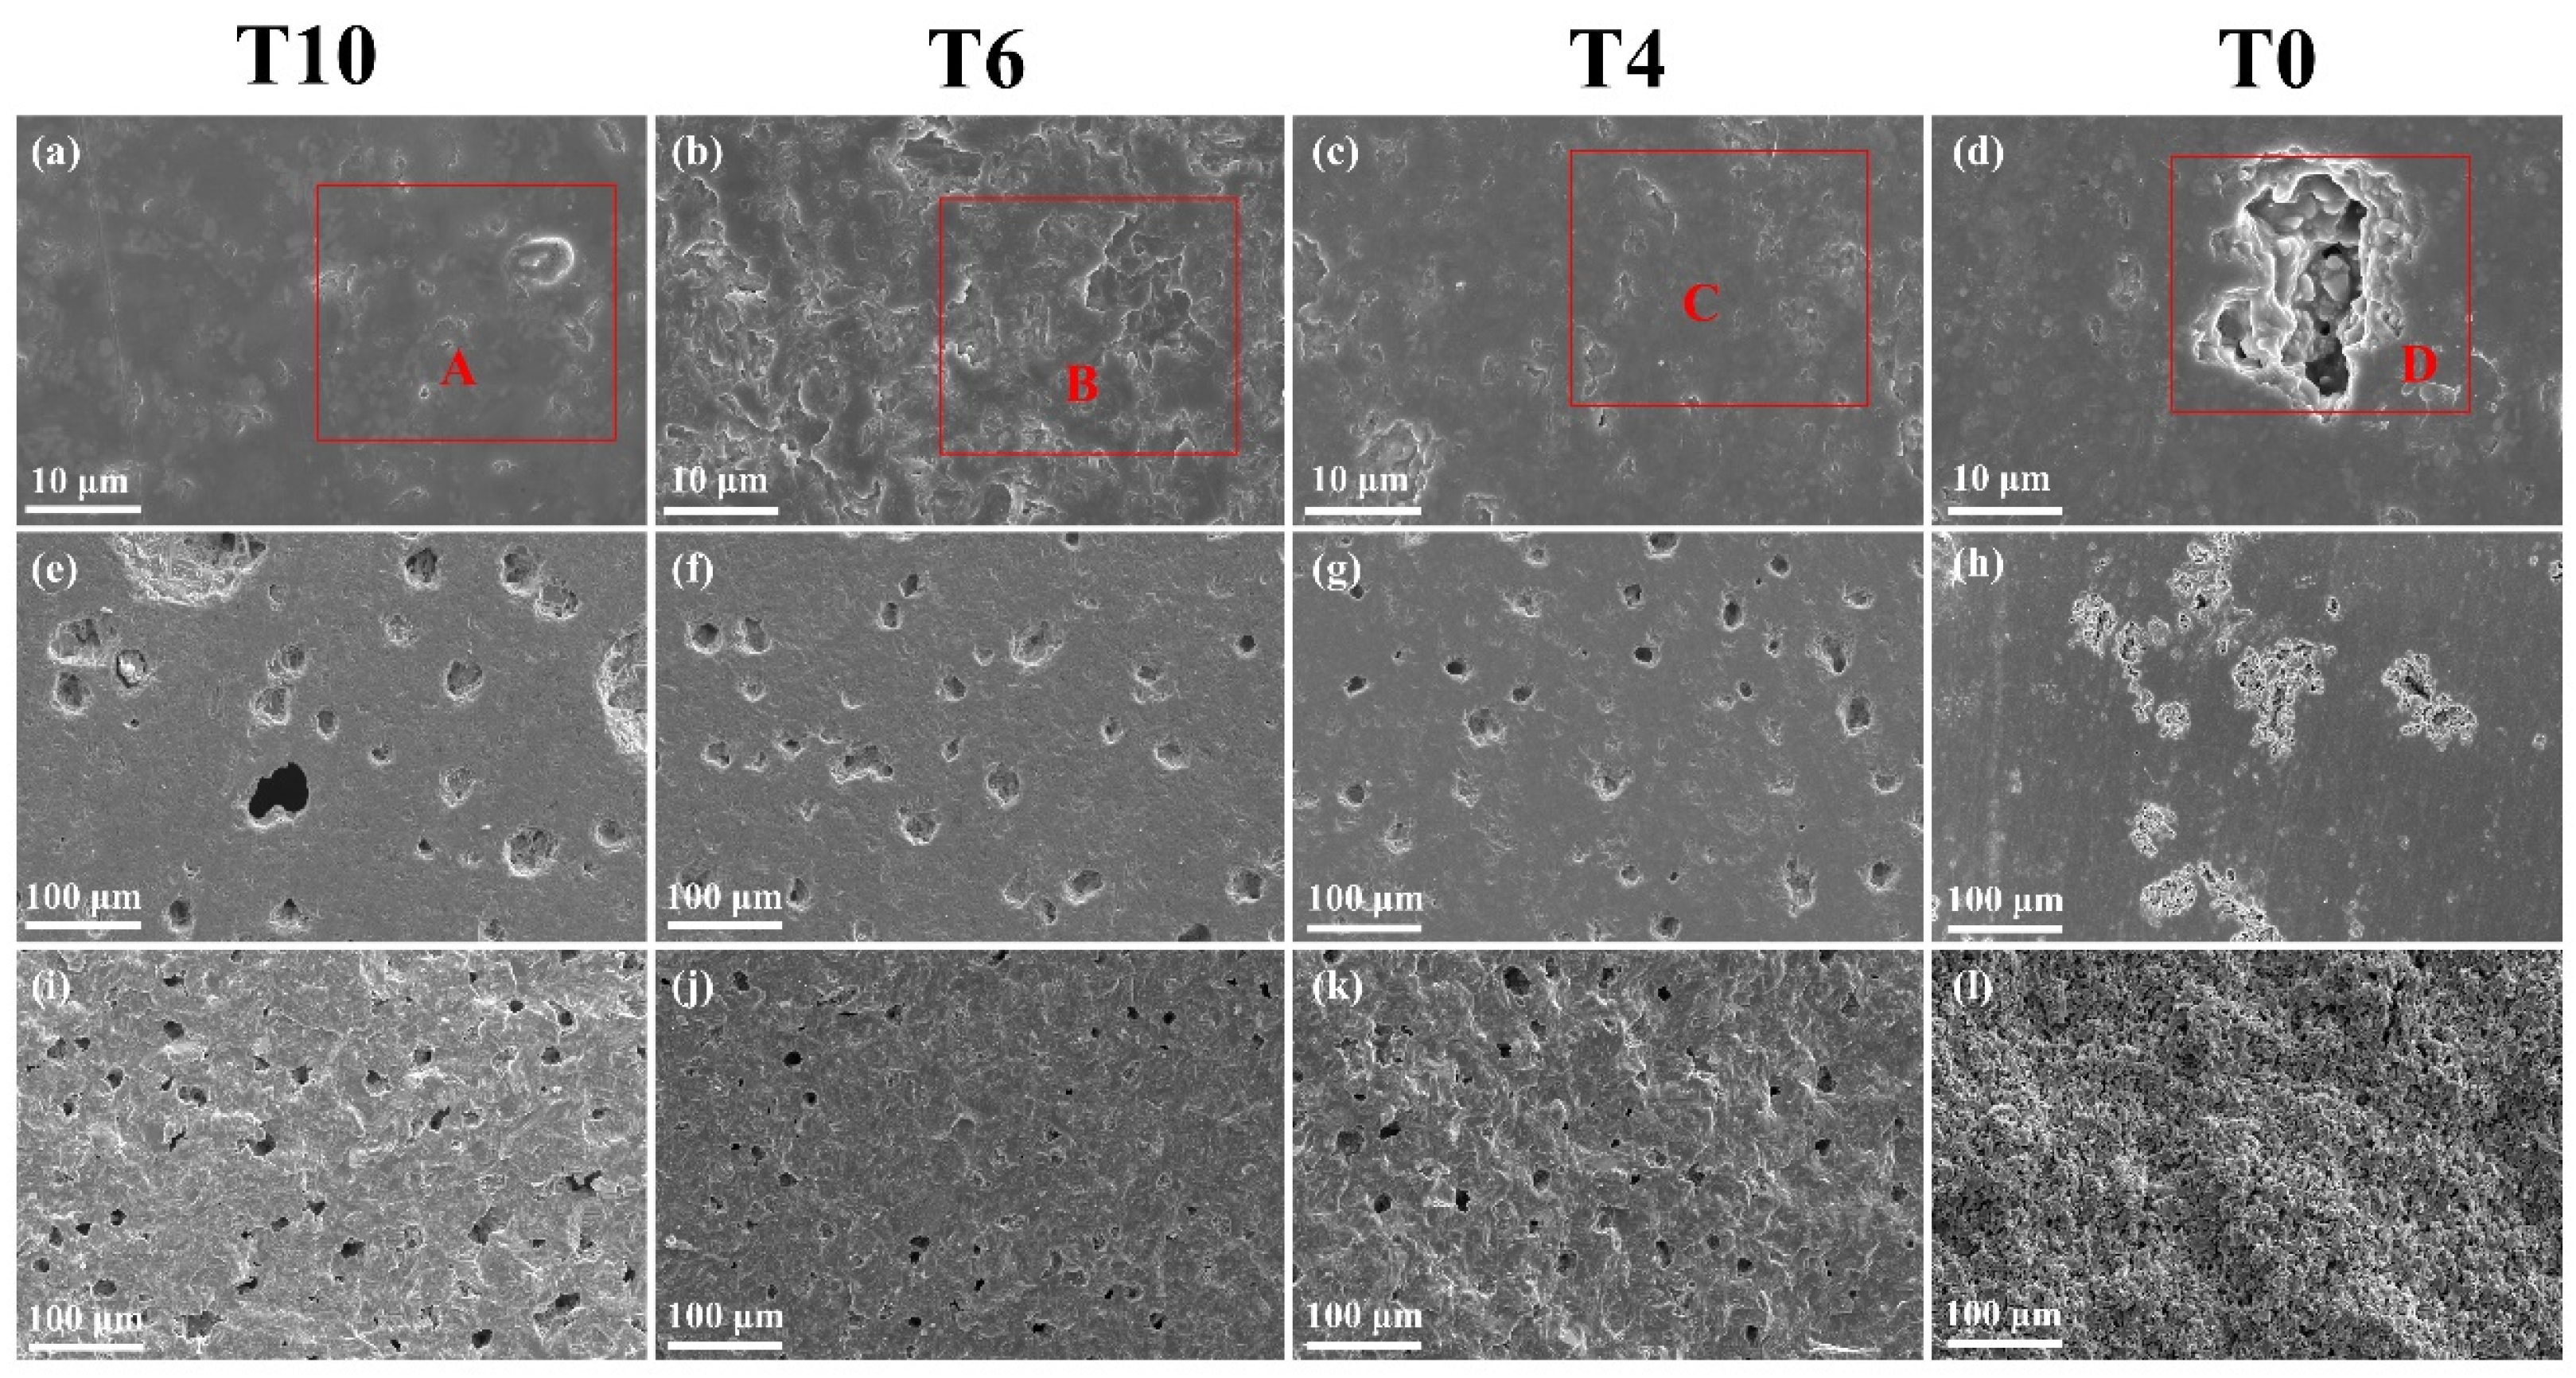
Figure 6 presents the SEM images of the fractured and polished microstructure surfaces of the samples sintered at 1100 °C. Noticeable differences can be observed among T10 (e), T6 (f), T4 (g), and T0 (h). T0 exhibits irregular large pores in patch-like formations, while T10, T6, and T4 display individual pores. Moreover, the number of pores within the same observation range initially decreases and then increases with increasing TiO2 content. The evaporation process during sintering restricts material transfer and reduces the presence of pores, resulting in the formation of macropores [18,45]. I. P. Alekseeva et al. [47,48] have also suggested that TiO2 induces liquid unmixing, causing metastable liquid phase separation and lowering the crystallization temperature of glass. Similarly, Lim et al. [49] demonstrated that the addition of TiO2 to the regolith simulant decreased the viscosity of molten slag and improved the wettability between molten iron and slag.
Combining the results of SEM and XRD and the aforementioned related investigations, we postulate that the underlying factors contributing to this phenomenon may be as follows: First, air sintering facilitates liquid-phase melting to promote sintering. Second, the addition of TiO2 reduces the viscosity, enhances the wettability and fluidity of glass, and facilitates element migration within the glass system, thereby lowering the crystallization temperature of the glass. Third, an appropriate amount of TiO2 not only increases the titanium content in CUG-1A but also reacts with Fe2O3 to form Fe2TiO5 and with Fe in the molten amorphous state to form Fe2TiO5. These reactions effectively prevent substance evaporation and an excessive increase in the amount of liquid-phase components caused by the formation of a low-melting-point iron-containing solid solution. These also accelerate the mass transfer rate during sintering, leading to closer particle bonding. Consequently, the large pores cluster together and shrink into independent pores, ensuring uniform sample shrinkage, which contributes to enhance the relative density of the samples, resulting in an increase in flexural strength. The fracture morphologies of the samples are shown in Figure 6i–l. Compared with T0, which still exhibits a granular structure after sintering (l), the experimental groups ((i), (j), and (k)) clearly display an increased presence of a fuller liquid phase during the sintering process. This phenomenon further supports the aforementioned viewpoint that the addition of TiO2 promotes liquid-phase formation and facilitates closer bonding between neighboring particles, which will enhance the The relative densities of T4 and T6 samples; thus, the performance characteristics of these samples are considerably enhanced [18,45,46].
However, the excessive addition of TiO2 may have the opposite effect. When the TiO2 content increases from 6 wt% to 10 wt%, the amounts of the liquid-phase products decrease (Figure 6e). At higher temperatures, TiO2 can act as an intermediate oxide within the glass system, replacing Si4+ in the silicon-oxygen tetrahedral structure and forming coordination bonds with O2−. This process disrupts the intricate silicon–oxygen tetrahedral network. Consequently, excessive doping of TiO2 can significantly decrease the viscosity of glass [50]. However, when TiO2 is appropriately doped, it can effectively reduce viscosity and improve the fluidity of the glass. Severely reduced viscosity of the glass results in macroscopic deformation of the sample. The sample will experience severe deformation following sintering at an elevated temperature, such as 1160 °C. Furthermore, although the reduction in glass viscosity and increase in the liquid-phase content promote element migration within the glass system [51,52] and enhance the mass transfer processes, an excessive amount of TiO2 can react with the Mg2+ present in the low-melting-point magnesia solid solution or pyroxene to form magnesium dititanate (MgTi2O5) [53,54] (as indicated by the XRD curve of T10 shown in Figure 3). As mentioned previously, an excess of evaporating substances during sintering can impede mass transfer. Similarly, an excess of the molten state can hinder gas discharge and increase the trapped gas pressure within the closed pores. This results in a higher number of closed pores, which inevitably have a detrimental effect on the sintering pattern performance. A significant increase and expansion of the internal pores are evident in T10 (Figure 5e). Consequently, the inclusion of excessive TiO2 doping in T10 leads to a significant deterioration in its properties, including shrinkage, relative density, and mechanical characteristics when compared to T6.
Table 4 presents the EDS results for the marked regions in Figure 6. Regions A–C exhibit high concentrations of Fe, Ti, and O, while region D displays lower levels of Fe and Ti. The predominant components in regions A–C are Fe2TiO5, Fe2O3, and TiO2, which align with the chemical Equations (7)–(9) when combined with the XRD findings. On the other hand, region D primarily consists of hematite (Fe2O3). The low presence of Mg in region D, along with the TGA-DSC results (Figure 5a) and its secondary analysis, indicate the evaporation of the molten amorphous state. The reduced Mg content is presumed to be the result of its consumption from the amorphous phase in order to form numerous Fe-Ti-O phases. Consequently, Ca is not being concentrated elsewhere for the formation of other mineral crystals. Naturally, the hindrance of the mass transfer process due to evaporation inevitably leads to the formation of macroscopic pores. Regions A–C have high Mg and Fe contents. Based on the inference from the thermal analysis (Section 3.3), we can conclude that the TiO2 content effectively mitigates the generation or volatilization of certain low-melting-point substances during the high-temperature sintering of CUG-1A. This confirms that TiO2 plays a positive role in reducing the evaporation of Mg- or Fe-containing low-melting-point substances formed during sintering [18,45], thereby enhancing the properties of the samples.

3.5. Sintering Shrinkage and Relative Density of CUG-1A–TiO2 Samples

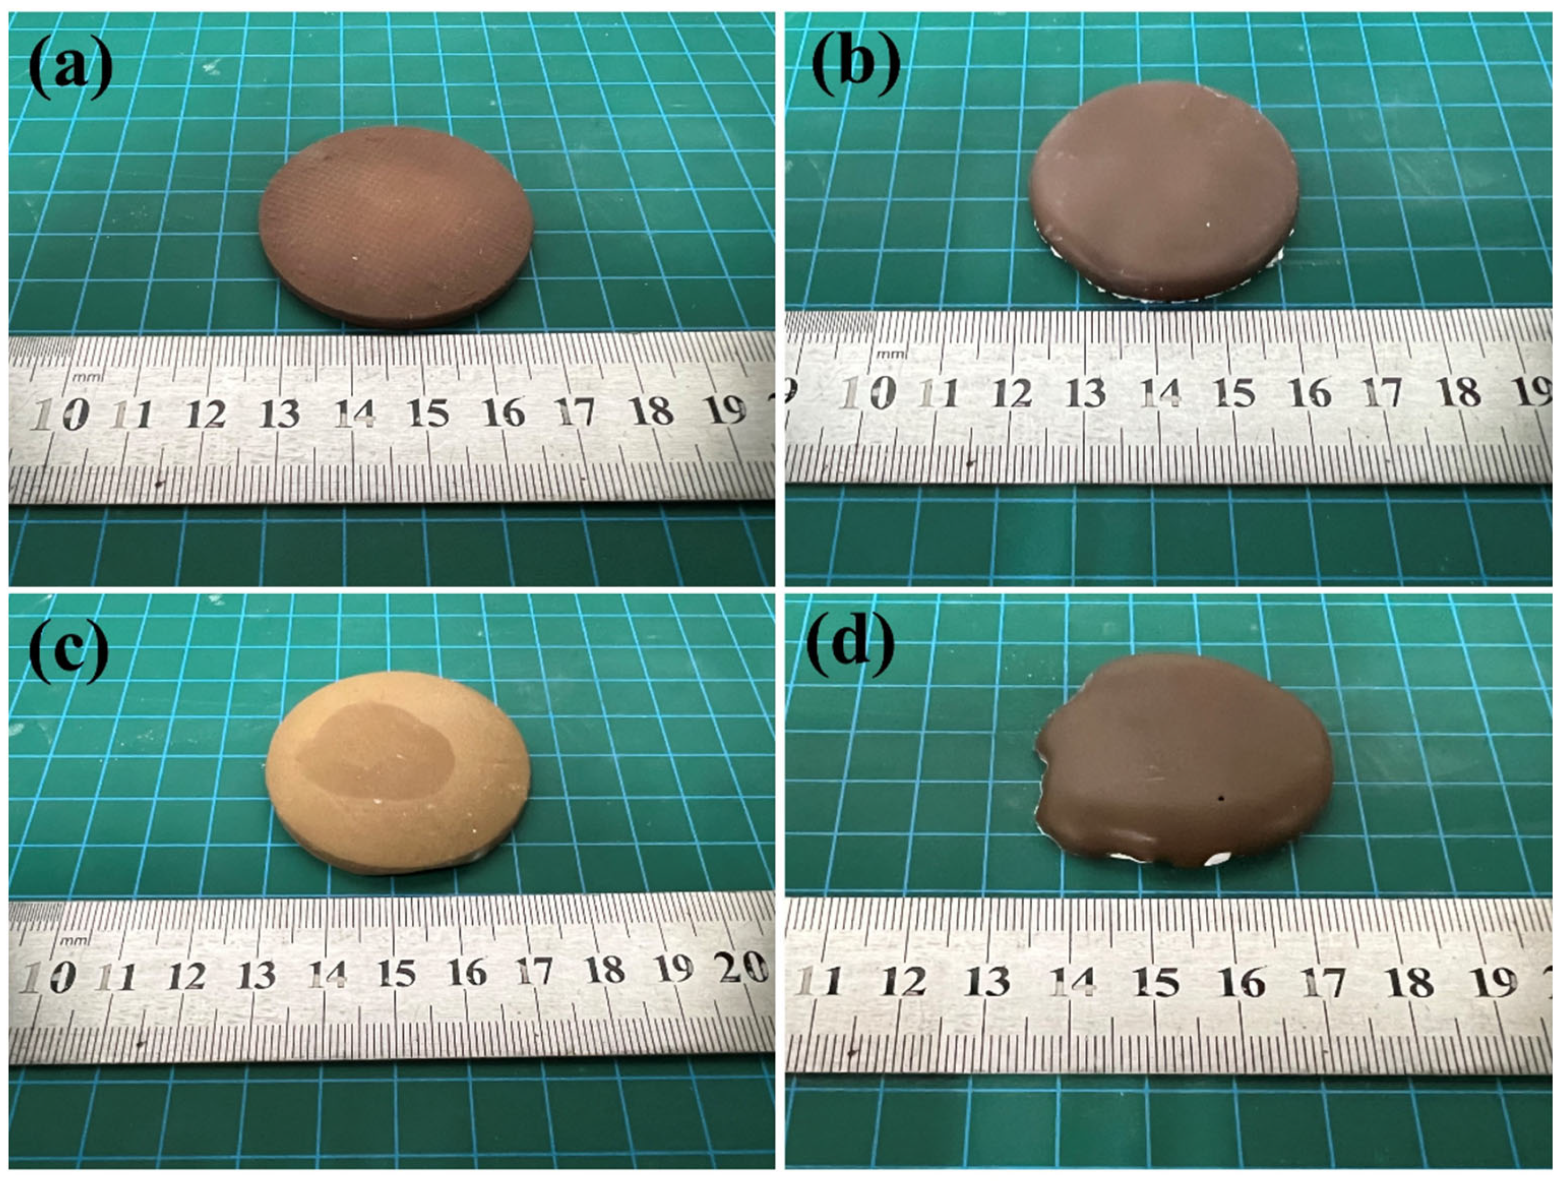
The appearance of the samples after sintering is shown in Figure 7. Notably, T6 (d), subjected to a sintering temperature of 1160 °C, exhibits severe deformation, the observed results appear to be consistent with the findings from our previous XRD analysis (as indicated by the XRD curve of 1160 °C shown in Figure 4). whereas the surface of T0 (b) displays unevenness. The other samples are well-sintered. Furthermore, T0 appears reddish-brown owing to hematite formation, as confirmed in the XRD analysis (Figure 3). In contrast, T6 displays a yellowish-brown color.
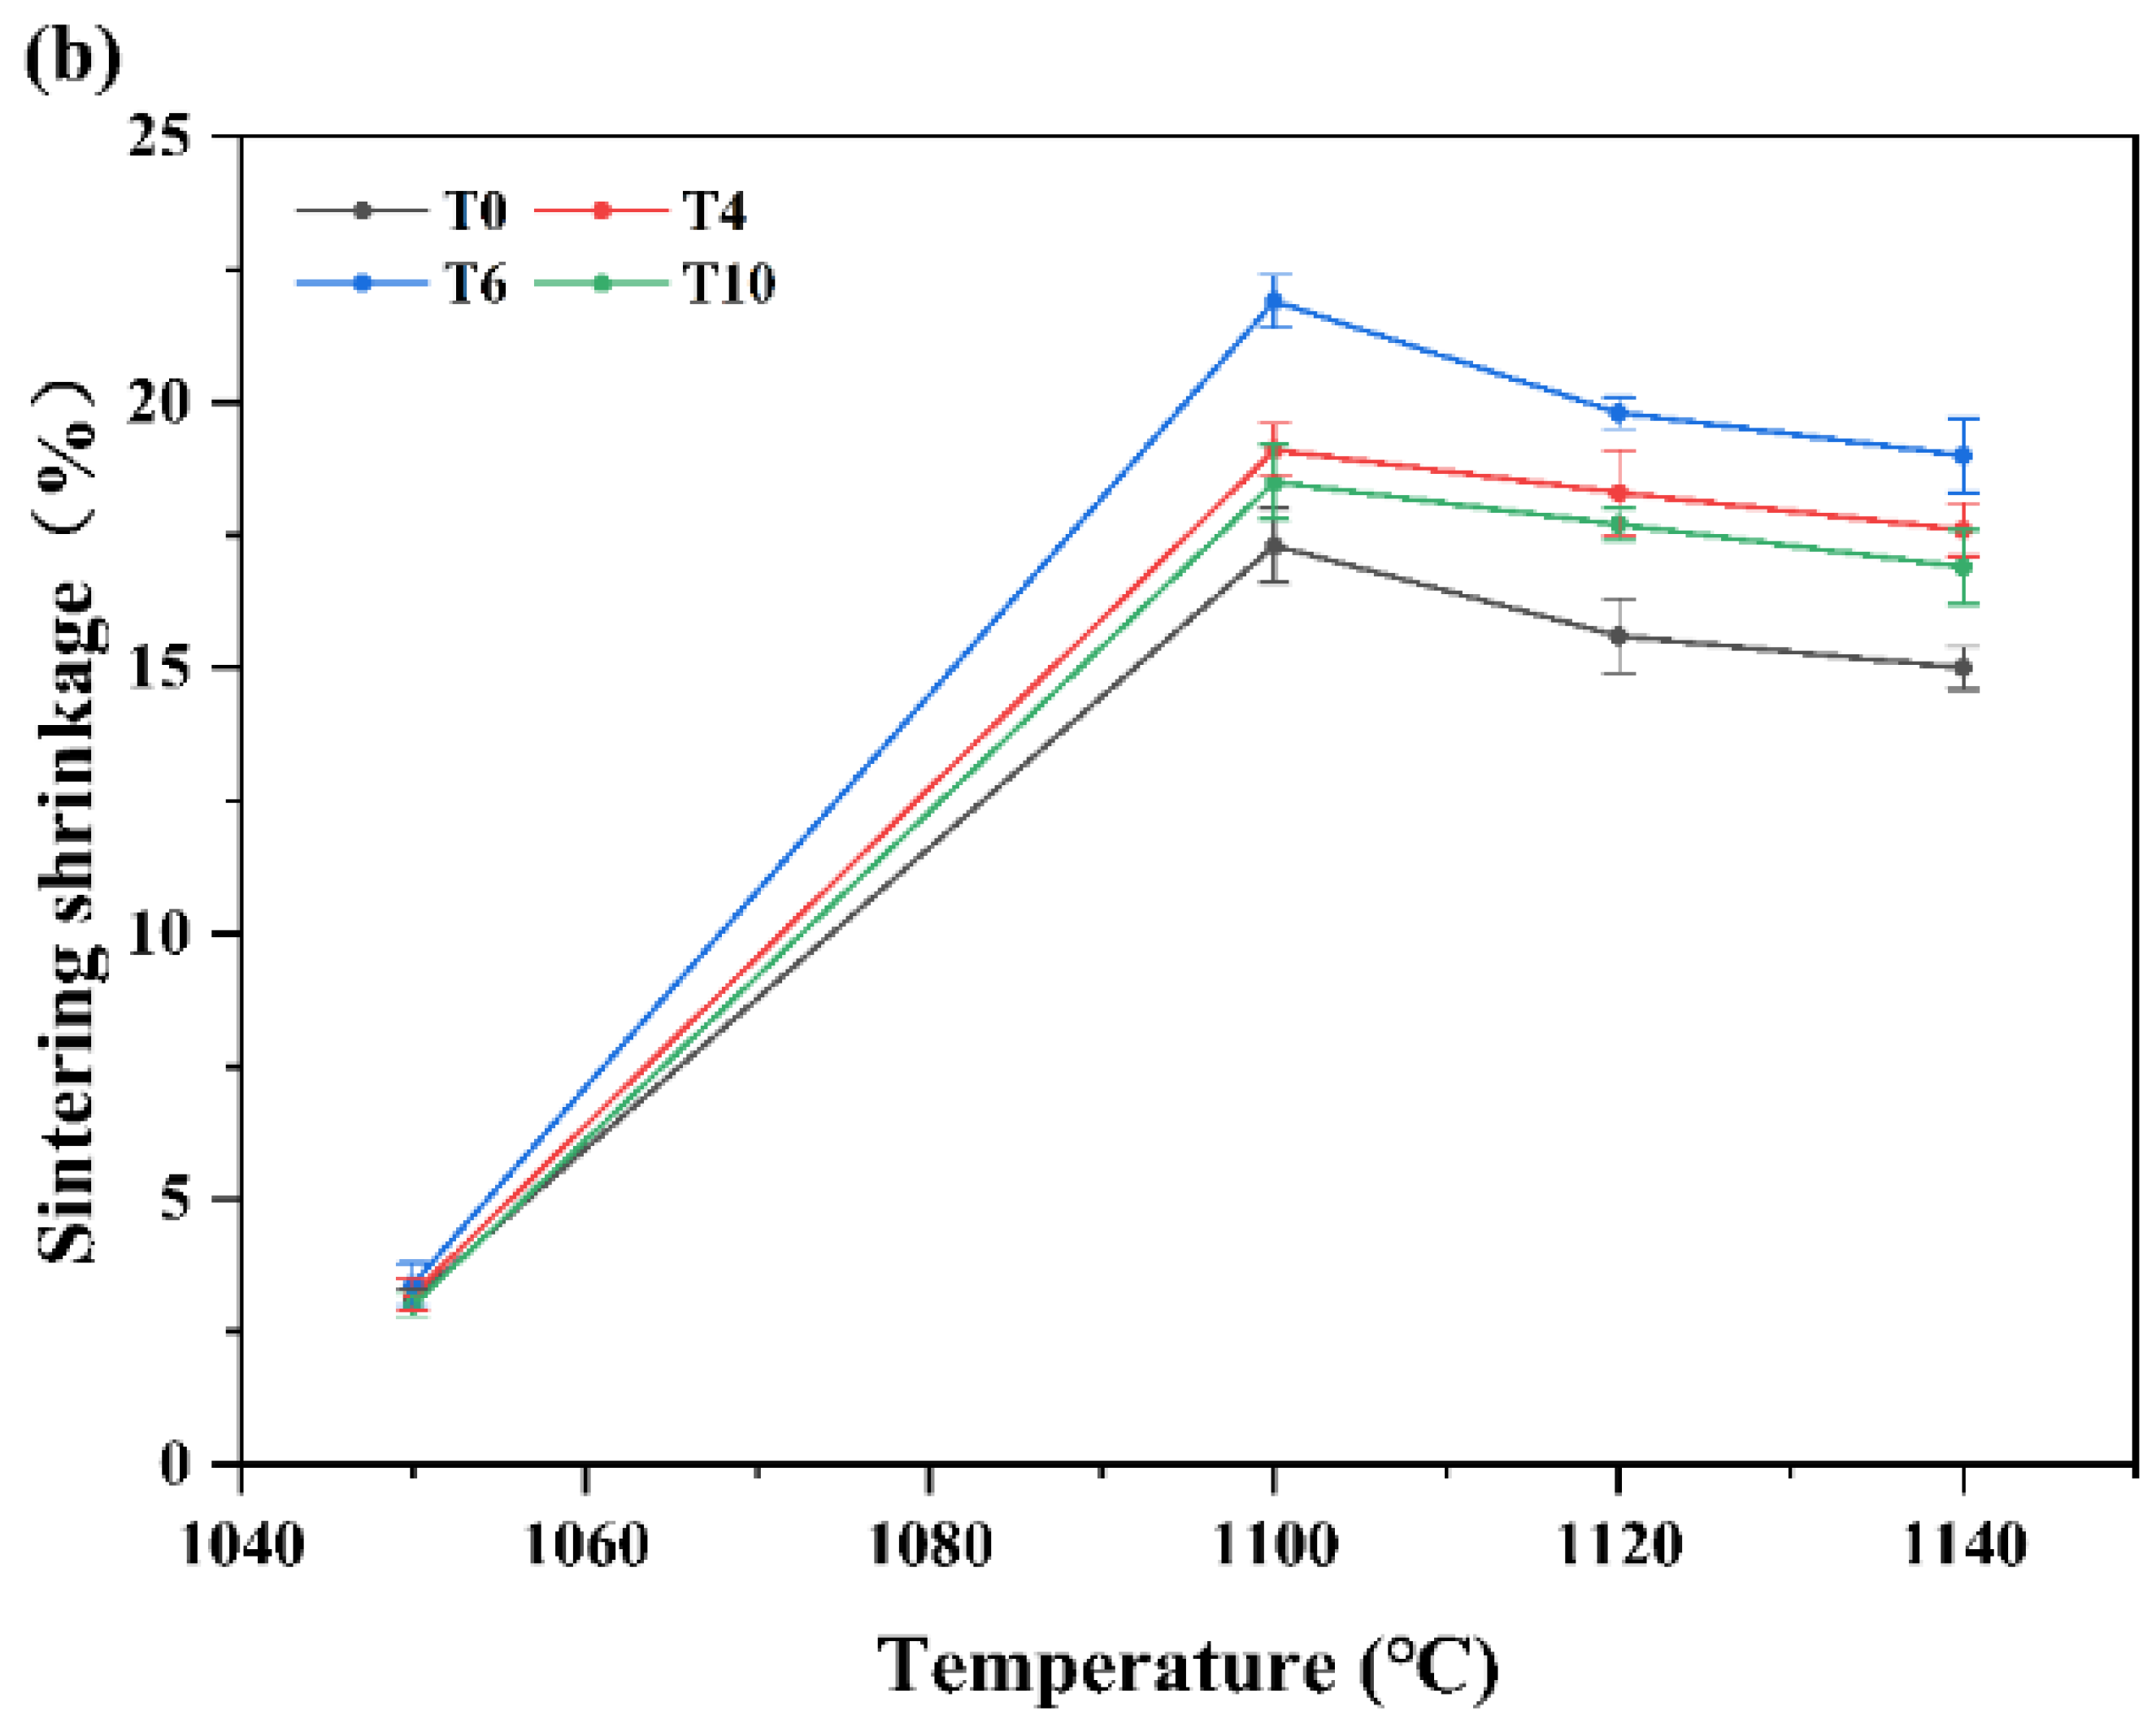
As the samples exhibit a round-like shape in the X–Y plane, the X-axis and Y-axis are combined into a single X-axis during measurements. Figure 8 shows the linear shrinkage rate of each group of sintered samples in the X- and Z-axes at varying sintering temperatures. The relative densities of the sintered samples are shown in Figure 9, and the bulk density and real density of the sintered samples are shown in Table 5 and Table 6, respectively. The shrinkage rate of the samples initially increases and then decreases with increasing temperature (Figure 8), and the relative density of the samples exhibits a similar pattern (Figure 8). Additionally, the shrinkage rate of the samples shows the same trend as the content of TiO2 at the same temperature. The shrinkage rate along the X-axis is generally lower than that along the Z-axis. At the sintering temperature of 1100 °C, all samples exhibit maximum shrinkage in all directions and achieve the highest relative density. At 1100 °C, among all samples, T6 exhibits the highest sintering shrinkage of 17.9 ± 0.2% and 21.7 ± 0.5% along the X- and Z-axes, respectively, which are 13.29% and 25.43% higher than those of T0, respectively. The relative density of T6 reaches 91.06%, indicating a significant enhancement of 12.28% compared with that of T0, which has a relative density of 81.10%. The observed trends in the shrinkage rate and relative density are consistent with those discussed in Section 3.4.

3.6. Mechanical Properties

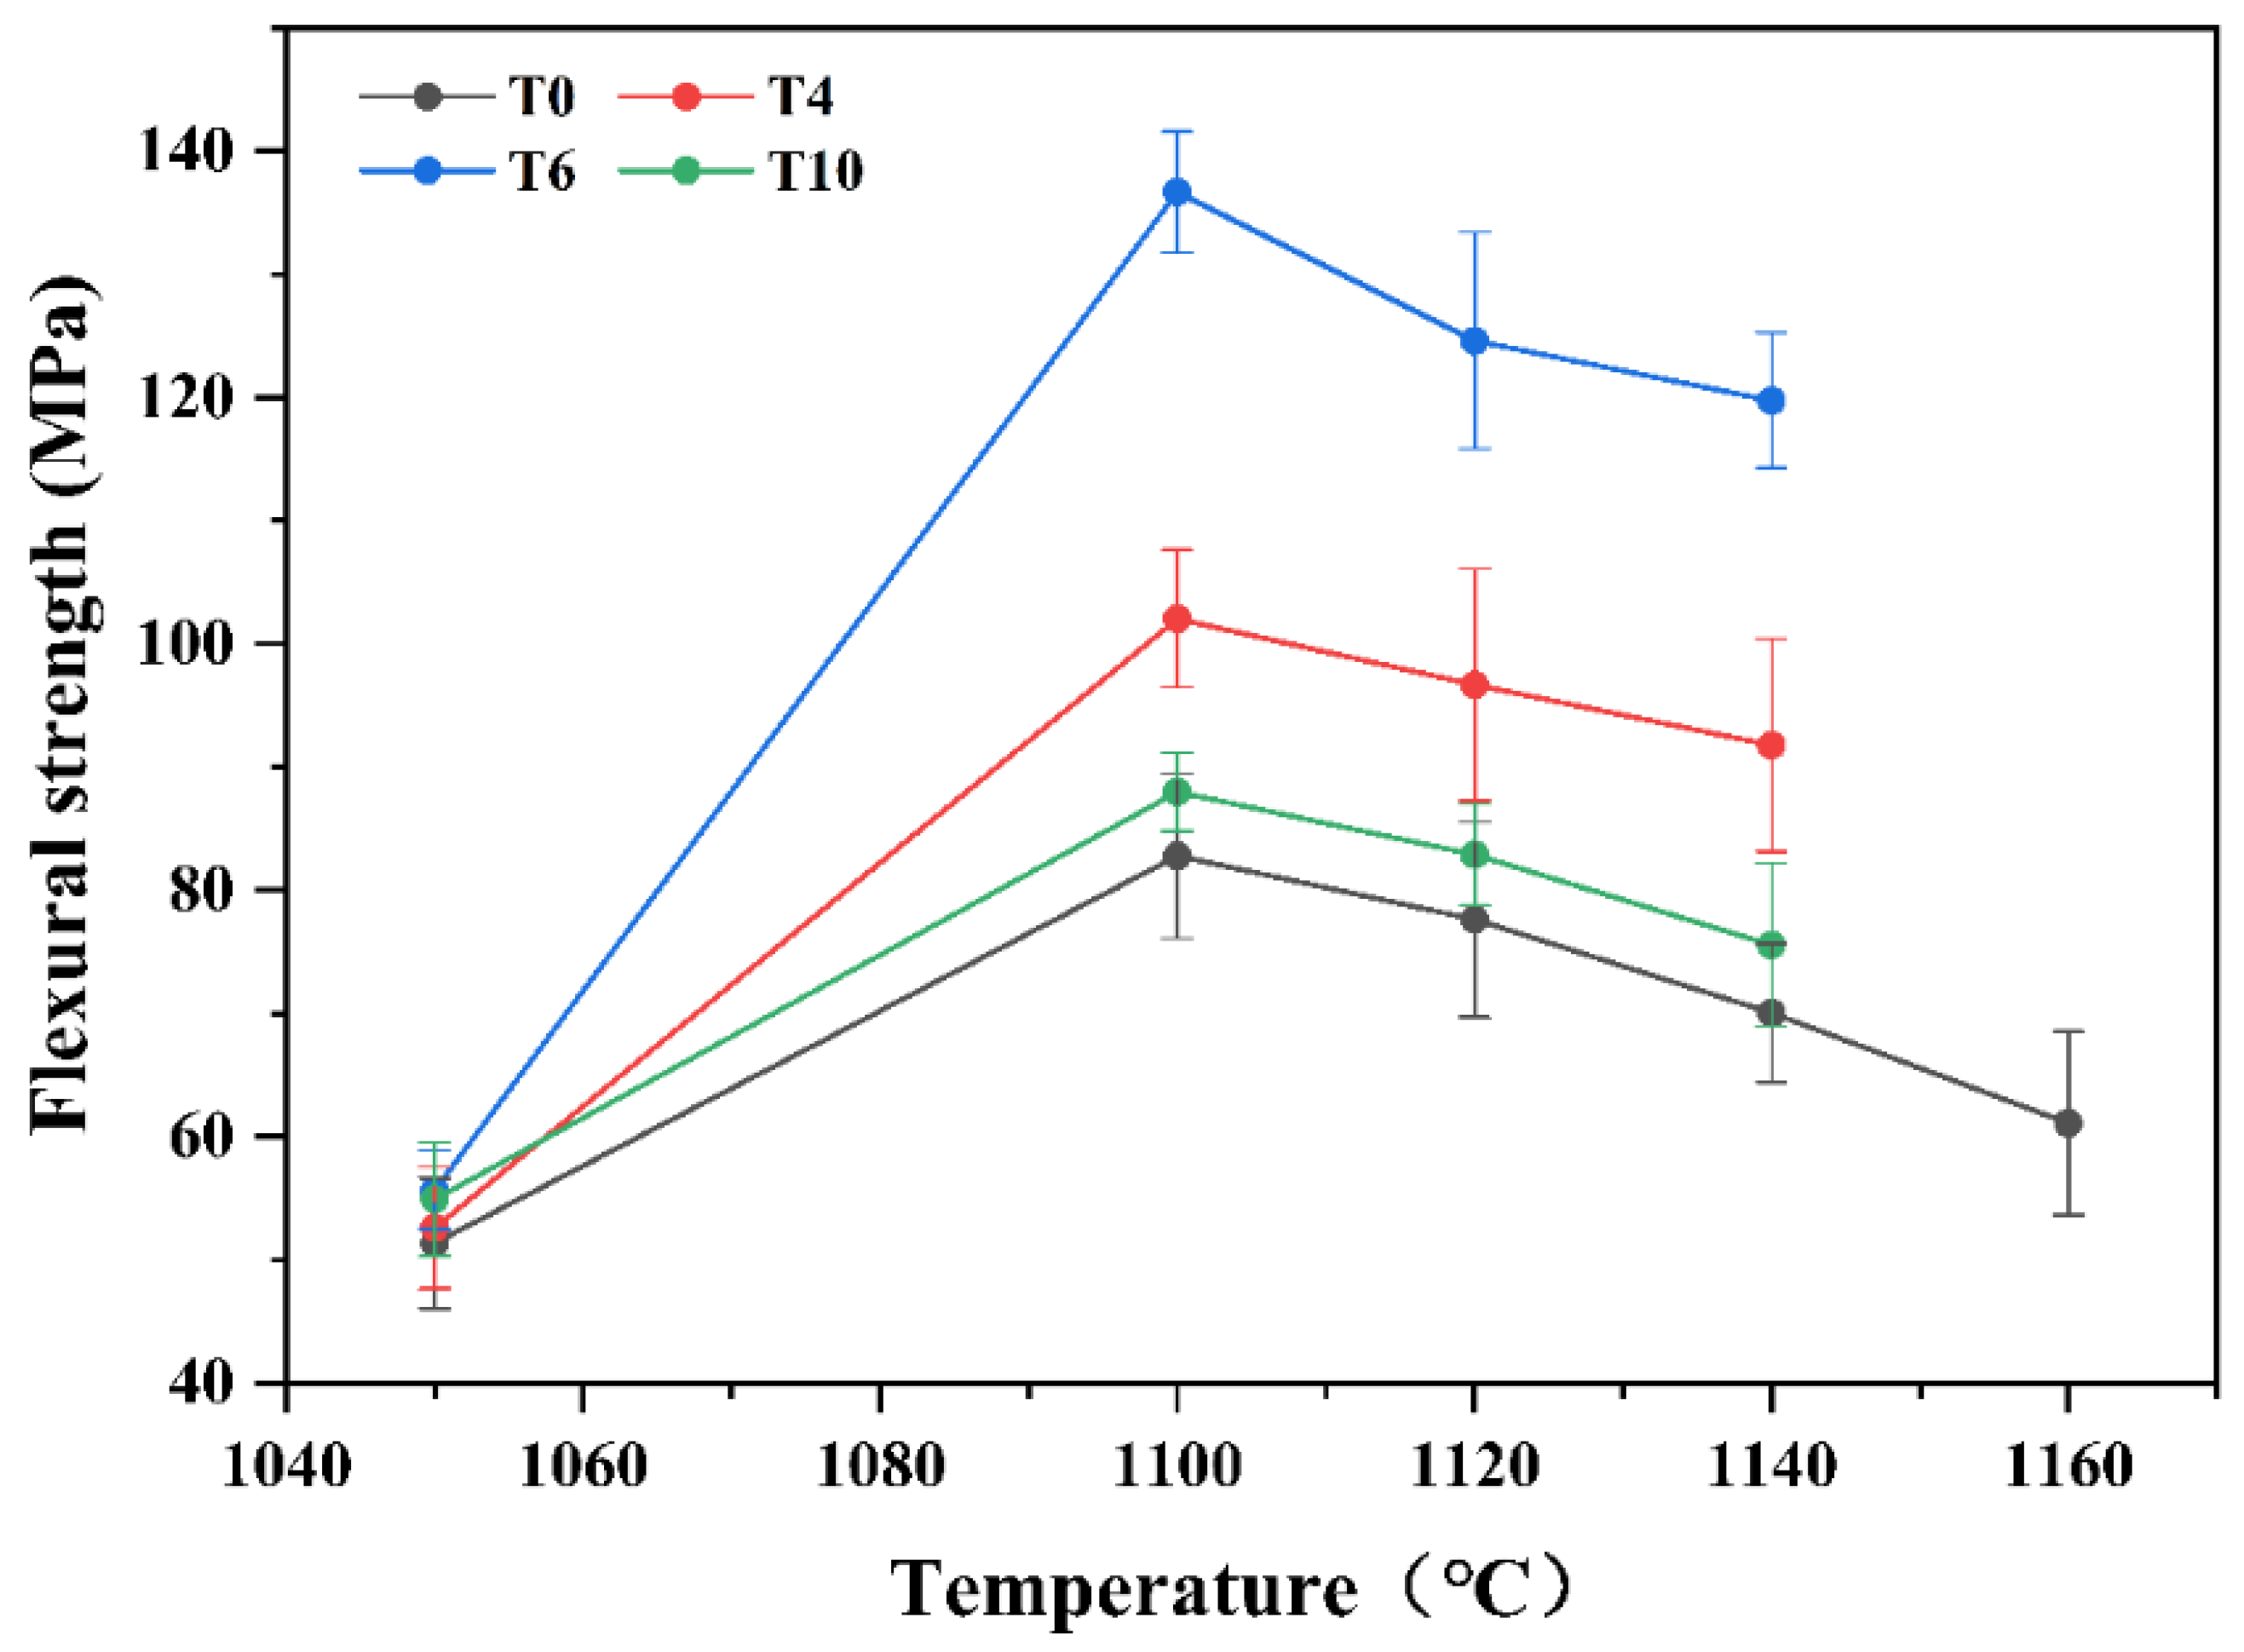
To assess the impact of TiO2 content on the mechanical properties of the CUG-1A samples, the flexural strengths of the sintered samples were determined and are illustrated in Figure 10. The experimental group generally exhibits higher flexural strength compared to T0, indicating the influence of TiO2 content on the mechanical properties of CUG-1A. The flexural strength of all sample groups initially increases and then decreases with increasing sintering temperatures. At a sintering temperature of 1100 °C, all sample groups achieve optimal flexural strength. However, unlike T0, which exhibits only slight deformation (Figure 7b), samples in the experimental group experience severe melting deformation (Figure 7d) and cannot be tested for flexural strength at 1160 °C. The enhancement in the flexural strength of the experimental group samples is not proportional to increasing TiO2 content. Instead, it initially increases and then decreases; this is consistent with the trends observed for the sample shrinkage rate and relative density. Microstructural analysis reveals that appropriate TiO2 doping enhances the flexural strength of CUG-1A. However, excessive TiO2 doping leads to an increase in liquid-phase content during the sintering process, thereby impeding gas discharge. With increasing sintering temperature, decomposed substances continuously generate gas, resulting in elevated trapped gas pressure within closed pores and, subsequently, leading to an augmentation in the number of closed pores. Consequently, both flexural strengths and relative densities of the samples decrease.
The flexural strength of T6 sintered at 1100 °C reaches the highest value of 136.66 ± 4.92 MPa, exhibiting a remarkable increase of 65% compared to that of T0. These results demonstrate the effectiveness of TiO2 as an additive component in enhancing both relative density and flexural strength for lunar regolith structures.

4. Conclusions

This study proposes an effective method for enhancing the mechanical properties of lunar regolith samples. By varying the TiO2 content in the CUG-1A lunar regolith simulant, CUG-1A-TiO2 samples were fabricated, and the effects of TiO2 content and sintering temperature on phase transformation and microstructure, as well as macroscopic properties such as shrinkage rate, flexural strength, and relative density were examined. The following conclusions were drawn.
Doping with TiO2 can effectively enhance the mechanical properties of CUG-1A. The experimental results demonstrate that the experimental groups outperformed T0 in terms of relative density and flexural strength. Furthermore, with increasing TiO2 content, the relative density and flexural strength initially increased and then decreased. On the one hand, doping with TiO2 led to the formation of Fe2TiO5 through a reaction with Fe2O3, thus reducing the generation and volatilization of solid solutions containing Fe or Mg with low melting points during heat treatment; this means that the addition of TiO2 to a CUG-1A lunar regolith simulant system will produce considerable changes not only in the distribution of Fe but also in the distribution of Mg. Moreover, TiO2 addition effectively decreased the viscosity and enhanced the fluidity of glass, facilitated mass transfer during heat treatment, and promoted pore shrinkage for enhanced mechanical properties. On the other hand, over-doping with TiO2 severely reduced glass viscosity, resulting in the formation of impurities and sub-crystalline phases such as magnesium dititanate (MgTi2O5), and the lower viscosity glass phase would deteriorate high-temperature mechanical properties. The sample exhibited optimal properties when sintered at 1100 °C with a TiO2 content of 6 wt%. The average flexural strength and relative density of the samples were 136.66 ± 4.92 MPa and 91.06%, respectively, which were 65% and 12.28% higher than those of T0, respectively. Comparisons of the microstructures and relative densities of the sintered samples in the experimental groups and T0 revealed that doping with TiO2 led to a reduction in the severity of defects and the formation of denser and more uniform microstructures.
This study represents a preliminary exploration of the impact of TiO2 on the microstructure and flexural strength of lunar regolith. Furthermore, our findings demonstrate that the incorporation of TiO2 exerts a substantial influence on certain elements, including magnesium and iron. Future research will focus on investigating the synergistic effects occurring in lunar regolith samples during heat treatment by considering compositional diversity to further enhance the performance of fabricated samples. Additionally, the effects of varying heat treatment processes and combining different manufacturing techniques for lunar regolith will be examined.

Supplementary Materials

The following supporting information can be downloaded at: https://www.mdpi.com/article/10.3390/cryst14020110/s1, PDF cards for anorthite, augite, diopside, forsterite, hematite, Magnesium titanium oxide and pseudobrookite.

Author Contributions

Conceptualization, J.C. and X.Z.; methodology, H.C.; software, Z.Z.; validation, J.C. and X.Z.; formal analysis, J.C.; investigation, H.C.; resources, Z.Z.; data curation, H.C.; writing—original draft preparation, J.C.; writing—review and editing, J.C. and X.Z.; visualization, J.C.; supervision, X.Z.; project administration, X.Z.; funding acquisition, X.Z. All authors have read and agreed to the published version of the manuscript.

Funding

This research was funded by the Guangdong Basic and Applied Basic Research Foundation (Grant No. 2019B1515130005), the Foshan Science and Technology Innovation Team project (Grant No. FS0AA-KJ919-4402-0023), the Project funded by China Postdoctoral Science Foundation (Grant No. 2022M720832).

Data Availability Statement

The data presented in this study are available on request from the corresponding authors. The data are not publicly available due to the fact that the research is still in progress.

Acknowledgments

The authors are grateful for the CUG-1A material provided by Chao Wang from the Qian Xuesen Laboratory of Space Technology, China Academy of Space Technology and Shenggui Chen from the School of Mechanical Engineering, Dongguan University of Technology.

Conflicts of Interest

The authors declare that they have no known competing financial interests or personal relationships that could have appeared to influence the work reported in this paper.

References

  1. Ruess, F.; Schaenzlin, J.; Benaroya, H. Structural design of a lunar habitat. J. Aerosp. Eng. 2006, 19, 135–157. [Google Scholar] [CrossRef]
  2. Detsis, E.; Doule, O.; Ebrahimi, A. Location selection and layout for LB10, a lunar base at the Lunar North Pole with a liquid mirror observatory. Acta Astronaut. 2013, 85, 61–72. [Google Scholar] [CrossRef]
  3. Wilhelm, S.; Curbach, M. Review of possible mineral materials and production techniques for a building material on the moon. Struct. Concr. 2014, 15, 419–428. [Google Scholar] [CrossRef]
  4. Labeaga-Martínez, N.; Sanjurjo-Rivo, M.; Díaz-Alvarez, J.; Martínez-Frías, J. Additive manufacturing for a Moon village. In Proceedings of the 7th Manufacturing-Engineering-Society International Conference (MESIC), Vigo, Spain, 28–30 June 2017; pp. 794–801. [Google Scholar]
  5. Lim, S.; Prabhu, V.L.; Anand, M.; Taylor, L.A. Extra-terrestrial construction processes—Advancements, opportunities and challenges. Adv. Space Res. 2017, 60, 1413–1429. [Google Scholar] [CrossRef]
  6. Anand, M.; Crawford, I.A.; Balat-Pichelin, M.; Abanades, S.; van Westrenen, W.; Péraudeau, G.; Jaumann, R.; Seboldt, W. A brief review of chemical and mineralogical resources on the Moon and likely initial in situ resource utilization (ISRU) applications. Planet Space Sci. 2012, 74, 42–48. [Google Scholar] [CrossRef]
  7. Sanders, G.B.; Larson, W.E. Integration of In-Situ Resource Utilization into lunar/Mars exploration through field analogs. Adv. Space Res. 2011, 47, 20–29. [Google Scholar] [CrossRef]
  8. Sanders, G.B.; Larson, W.E. Final review of analog field campaigns for In Situ Resource Utilization technology and capability maturation. Adv. Space Res. 2015, 55, 2381–2404. [Google Scholar] [CrossRef]
  9. Sanders, G.B.; Larson, W.E. Progress Made in Lunar In Situ Resource Utilization under NASA’s Exploration Technology and Development Program. J. Aerosp. Eng. 2013, 26, 5–17. [Google Scholar] [CrossRef]
  10. Isachenkov, M.; Chugunov, S.; Akhatov, I.; Shishkovsky, I. Regolith-based additive manufacturing for sustainable development of lunar infrastructure—An overview. Acta Astronaut. 2021, 180, 650–678. [Google Scholar] [CrossRef]
  11. Miller, J.; Taylor, L.; Zeitlin, C.; Heilbronn, L.; Guetersloh, S.; DiGiuseppe, M.; Iwata, Y.; Murakami, T. Lunar soil as shielding against space radiation. Radiat. Meas. 2009, 44, 163–167. [Google Scholar] [CrossRef]
  12. Zong, X.; Chen, J.H.; Chen, H.M.; Jiang, Z.S.; Wu, S.H. Progress in Preparation Technology of Lunar Regolith Simulant. Mech. Electr. Eng. Technol. 2023, 52, 23–29. [Google Scholar]
  13. Zhang, X.; Khedmati, M.; Kim, Y.R.; Shin, H.S.; Lee, J.G.; Kim, Y.J.; Cui, B. Microstructure evolution during spark plasma sintering of FJS-1 lunar soil simulant. J. Am. Ceram. Soc. 2020, 103, 899–911. [Google Scholar] [CrossRef]
  14. Matsushima, T.; Katagiri, J.; Uesugi, K.; Tsuchiyama, A.; Nakano, T. 3D Shape Characterization and Image-Based DEM Simulation of the Lunar Soil Simulant FJS-1. J. Aerosp. Eng. 2009, 22, 15–23. [Google Scholar] [CrossRef]
  15. Zheng, Y.C.; Wang, S.J.; Ouyang, Z.Y.; Zou, Y.L.; Liu, J.Z.; Li, C.L.; Li, X.Y.; Feng, J.M. CAS-1 lunar soil simulant. Adv. Space Res. 2009, 43, 448–454. [Google Scholar] [CrossRef]
  16. Taylor, L.A.; Pieters, C.M.; Britt, D. Evaluations of lunar regolith simulants. Planet Space Sci. 2016, 126, 1–7. [Google Scholar] [CrossRef]
  17. Ray, C.S.; Reis, S.T.; Sen, S.; O’Dell, J.S. JSC-1A lunar soil simulant: Characterization, glass formation, and selected glass properties. J. Non-Cryst. Solids 2010, 356, 2369–2374. [Google Scholar] [CrossRef]
  18. Song, L.; Xu, J.; Fan, S.Q.; Tang, H.; Li, X.Y.; Liu, J.Z.; Duan, X.M. Vacuum sintered lunar regolith simulant: Pore-forming and thermal conductivity. Ceram. Int. 2019, 45, 3627–3633. [Google Scholar] [CrossRef]
  19. Fateri, M.; Meurisse, A.; Sperl, M.; Urbina, D.; Madakashira, H.K.; Govindaraj, S.; Gancet, J.; Imhof, B.; Hoheneder, W.; Waclavicek, R.; et al. Solar Sintering for Lunar Additive Manufacturing. J. Aerosp. Eng. 2019, 32, 04019101. [Google Scholar] [CrossRef]
  20. Lim, S.; Bowen, J.; Degli-Alessandrini, G.; Anand, M.; Cowley, A.; Levin Prabhu, V. Investigating the microwave heating behaviour of lunar soil simulant JSC-1A at different input powers. Sci. Rep. 2021, 11, 16. [Google Scholar] [CrossRef]
  21. Wilkerson, R.P.; Petkov, M.P.; Voecks, G.E.; Lynch, C.S.; Shulman, H.S.; Sundaramoorthy, S.; Choudhury, A.; Rickman, D.L.; Effinger, M.R. Outgassing behavior and heat treatment optimization of JSC-1A lunar regolith simulant. Icarus 2023, 400, 13. [Google Scholar] [CrossRef]
  22. Petkov, M.P.; Voecks, G.E. Characterization of volatiles evolved during vacuum sintering of lunar regolith simulants. Ceram. Int. 2023, 49, 33459–33468. [Google Scholar] [CrossRef]
  23. Wang, C.; Zhang, G.; LÜ, X.C.; Yao, W. Experimental study of the parameters of laser melting molding process with regard to simulated lunar soil. Spacecr. Environ. Eng. 2021, 38, 575–580. [Google Scholar] [CrossRef]
  24. Toklu, Y.C.; Açikbas, N.; Açikbas, G.; Çerçevik, A.E.; Akpinar, P. Production of a set of lunar regolith simulants based on Apollo and Chinese samples. Adv. Space Res. 2023, 72, 565–576. [Google Scholar] [CrossRef]
  25. Shkuratov, Y.; Kaydash, V.; Sysolyatina, X.; Razim, A.; Videen, G. Lunar surface traces of engine jets of Soviet sample return probes: The enigma of the Luna-23 and Luna-24 landing sites. Planet Space Sci. 2013, 75, 28–36. [Google Scholar] [CrossRef]
  26. Arslan, H.; Sture, S.; Batiste, S. Experimental simulation of tensile behavior of lunar soil simulant JSC-1. Mater. Sci. Eng. A-Struct. Mater. Prop. Microstruct. Process. 2008, 478, 201–207. [Google Scholar] [CrossRef]
  27. Kanamori, H. Properties of lunar soil simulant inanufactured in Japan. In Proceedings of the Proceeding of the International Conference & Exposition on Engineering, Albuquerque, NM, USA, 26–30 April 1998. [Google Scholar]
  28. Yoshida, H.; Watanabe, T.; Kanamori, H.; Yoshida, T.; Ogiwara, S.; Eguchi, K. Experimental Study on Water Production by Hydrogen Reduction of Lunar Soil Simulant in a Fixed Bed Reactor. Pain 2000, 148, 36–42. [Google Scholar]
  29. Weiblen, P.W.; Murawa, M.J.; Reid, K.J. Preparation of Simulants for Lunar Surface Materials. Eng. Constr. Oper. Space II 1990, 98–106. [Google Scholar]
  30. He, X.X.; Xiao, L.; Huang, J.; He, Q.; Gao, R.; Yang, G. Lunar Soil Simulant Development and Lunar Soil Simulant CUG-1A. Geol. Sci. Technol. Inf. 2011, 30, 6. [Google Scholar]
  31. James, O.B.; Jackson, E.D. Petrology of the Apollo 11 ilmenite basalts. J. Geophys. Res. 1970, 75, 5793–5824. [Google Scholar] [CrossRef]
  32. Cameron, E.N. Apollo 11 ilmenite revisited. In Proceedings of the 3rd International Conference, Denver, CO, USA, 31 May–4 June 1992. [Google Scholar]
  33. Zhou, C.J.; Tang, H.; Li, X.Y.; Zeng, X.J.; Yu, W.; Mo, B.; Li, R.; Liu, J.Z.; Zou, Y.L. Effects of Ilmenite on the Properties of Microwave-Sintered Lunar Regolith Simulant. J. Aerosp. Eng. 2021, 34, 8. [Google Scholar] [CrossRef]
  34. Taylor, L.A.; Mckay, D.S. An Ilmenite Feedstock on the Moon: Beneficiation of Rocks Versus Soil. Abstr. Lunar Planet. Sci. Conf. 1992, 23, 1411. [Google Scholar]
  35. Dou, R.; Tang, W.Z.; Wang, L.; Li, S.; Duan, W.Y.; Liu, M.; Zhang, Y.B.; Wang, G. Sintering of lunar regolith structures fabricated via digital light processing. Ceram. Int. 2019, 45, 17210–17215. [Google Scholar] [CrossRef]
  36. Schlüter, L.; Cowley, A.; Pennec, Y.; Roux, M. Gas purification for oxygen extraction from lunar regolith. Acta Astronaut. 2021, 179, 371–381. [Google Scholar] [CrossRef]
  37. Reiss, P.; Kerscher, F.; Grill, L. Thermogravimetric analysis of chemical reduction processes to produce oxygen from lunar regolith. Planet Space Sci. 2020, 181, 8. [Google Scholar] [CrossRef]
  38. Chen, H.M.; Nie, G.L.; Li, Y.H.; Zong, X.; Wu, S.H. Improving relative density and mechanical strength of lunar regolith structures via DLP-stereolithography integrated with powder surface modification process. Ceram. Int. 2022, 48, 26874–26883. [Google Scholar] [CrossRef]
  39. Wang, C.Y.; Gong, H.Q.; Wei, W.; Wu, H.; Luo, X.; Li, N.; Liang, J.H.; Khan, S.B.; Xiao, C.; Lu, B.H.; et al. Vat photopolymerization of low-titanium lunar regolith simulant for optimal mechanical performance. Ceram. Int. 2022, 48, 29752–29762. [Google Scholar] [CrossRef]
  40. Xiao, C.; Zheng, K.; Chen, S.G.; Li, N.; Shang, X.; Wang, F.H.; Liang, J.H.; Khan, S.B.; Shen, Y.F.; Lu, B.H.; et al. Additive manufacturing of high solid content lunar regolith simulant paste based on vat photopolymerization and the effect of water addition on paste retention properties. Addit. Manuf. 2023, 71, 14. [Google Scholar] [CrossRef]
  41. Song, L.; Xu, J.; Tang, H.; Fan, S.Q.; Liu, J.Z.; Li, X.Y.; Liu, J.Q. Research Progress. of the Simulated Lunar Soil Molding. Acta Mineral. Sin. 2020, 40, 47–57. [Google Scholar]
  42. Street, K.W.; Ray, C.; Rickman, D.; Scheiman, D.A. Thermal Properties of Lunar Regolith Simulants. In Proceedings of the Earth and Space 2010 Conference Sponsored by the American Society of Civil Engineers, Honolulu, HI, USA, 14–17 March 2010. [Google Scholar]
  43. Zhang, G.Q.; Ostrovski, O. Effect of preoxidation and sintering on properties of ilmenite concentrates. Int. J. Miner. Process. 2002, 64, 201–218. [Google Scholar] [CrossRef]
  44. Chen, X.; Deng, J.X.; Yu, R.B.; Chen, J.; Hu, P.H.; Xing, X.R. A Simple Oxidation Route to Prepare Pseudobrookite from Panzhihua Raw Ilmenite. J. Am. Ceram. Soc. 2010, 93, 2968–2971. [Google Scholar] [CrossRef]
  45. Song, L.; Xu, J.; Tang, H.; Liu, J.Q.; Liu, J.Z.; Li, X.Y.; Fan, S.Q. Vacuum sintering behavior and magnetic transformation for high-Ti type basalt simulated lunar regolith. Icarus 2020, 347, 8. [Google Scholar] [CrossRef]
  46. Taylor, S.L.; Jakus, A.E.; Koube, K.D.; Ibeh, A.J.; Geisendorfer, N.R.; Shah, R.N.; Dunand, D.C. Sintering of micro-trusses created by extrusion-3D-printing of lunar regolith inks. Acta Astronaut. 2018, 143, 1–8. [Google Scholar] [CrossRef]
  47. Alekseeva, I.P.; Dymshits, O.S.; Zhilin, A.A.; Mikhailov, M.D.; Khubetsov, A.A. Phase transformations in glass of the MgO-Al2O3-SiO2-TiO2 system doped with yttrium oxide. Glass Phys. Chem. 2015, 41, 597–606. [Google Scholar] [CrossRef]
  48. Alekseeva, I.P.; Dymshits, O.S.; Zhilin, A.A.; Mikha?Lov, M.D.; Khubetsov, A.A. Effect of yttrium oxide on the crystallization of glasses of the MgO–Al2O3–SiO2 system, nucleated by a mix of titanium and zirconium dioxides, and the transparency of glass--crystalline materials in the superhigh-frequency spectral region. J. Opt. Technol. Opt. Zhurnal 2015, 82, 262. [Google Scholar] [CrossRef]
  49. Lim, S.; Nakamoto, M.; Fuji-ta, K.; Tanaka, T. Effect of Titanium Dioxide on Aggregation of Reduced Metallic Iron in Molten Slag. Mater. Trans. 2023, 64, 672–680. [Google Scholar] [CrossRef]
  50. He, D.F.; Ma, H.; Zhong, H. Effect of different nucleating agent ratios on the crystallization and properties of MAS glass ceramics. J. Eur. Ceram. Soc. 2021, 41, 342–350. [Google Scholar] [CrossRef]
  51. Khater, G.A. Influence of Cr2O, LiF, CaF2 and TiO2 nucleants on the crystallization behavior and microstructure of glass-ceramics based on blast-furnace slag. Ceram. Int. 2011, 37, 2193–2199. [Google Scholar] [CrossRef]
  52. Allen, C.C.; Morris, R.V.; Mckay, D.S. Experimental reduction of lunar mare soil and volcanic glass. J. Geophys. Res. Planets 1994, 99, 23173–23185. [Google Scholar] [CrossRef]
  53. Suzuki, Y.; Shinoda, Y. Magnesium dititanate (MgTi2O5) with pseudobrookite structure: A review. Sci. Technol. Adv. Mater. 2011, 12, 6. [Google Scholar] [CrossRef]
  54. Son, H.W.; Maki, R.S.S.; Kim, B.N.; Suzuki, Y. High-strength pseudobrookite-type MgTi2O5 by spark plasma sintering. J. Ceram. Soc. Jpn. 2016, 124, 838–840. [Google Scholar] [CrossRef]
Figure 1. Specific surface area of T0 powder under different milling durations.
Crystals 14 00110 g001
Figure 2. Microstructure of T6 powder under different milling durations: (a) 0, (b) 2, and (c) 6 h.
Crystals 14 00110 g002
Figure 3. XRD patterns of samples of each group at 1100 °C.
Crystals 14 00110 g003
Figure 4. XRD patterns of samples of T6 at different sintering temperatures.
Crystals 14 00110 g004
Figure 5. (a) TGA-DSC curve of T0 powder before sintering; (b) TGA-DSC curve of T6 powder before sintering.
Crystals 14 00110 g005aCrystals 14 00110 g005b
Figure 6. SEM images of the (ah) polished and (il) fractured surfaces of the sample sintered at 1100 °C. (A–D region represents the designated area for EDS scanning.)
Crystals 14 00110 g006
Figure 7. Photos of the appearance of the samples after sintering. (a) 1050 °C T0; (b) 1160 °C T0; (c) 1050 °C T6; (d) 1160 °C T6. (For interpretation of the colors in this figure legend, the reader is referred to the Web version of this article.)
Crystals 14 00110 g007
Figure 8. Evaluation of the sintering shrinkage (%) of samples at different sintering temperatures: (a) X-axis and (b) Z-axis.
Crystals 14 00110 g008aCrystals 14 00110 g008b
Figure 9. Evaluation of the relative density (%) of samples at different sintering temperatures.
Crystals 14 00110 g009
Figure 10. Flexural strength (MPa) of samples at different sintering temperatures.
Crystals 14 00110 g010
Table 1. Chemical composition (wt%) of CUG-1A.
ElementSiO2Al2O3FeOMgOCaONa2OTiO2K2OP2O5MnOSrOCr2O3NiOSO3
Content45.914.311.59.866.924.581.92.330.630.140.10.060.060.05
Table 2. Detailed composition of raw materials according to different nucleating agent ratios (wt%).
Sample NumberCUG-1ATiO2
T01000
T4964
T6946
T109010
Table 3. T0 and T6 powder particle size under different milling durations.
Time (h)D10 (μm)D50 (μm)D90 (μm)
T0T6T0T6T0T6
02.91 ± 0.032.89 ± 0.0219.10 ± 0.0619.49 ± 0.0446.30 ± 0.0346.09 ± 0.04
21.81 ± 0.051.79 ± 0.0610.94 ± 0.0210.52 ± 0.0526.37 ± 0.0825.59 ± 0.07
41.44 ± 0.041.42 ± 0.038.25 ± 0.038.44 ± 0.0120.83 ± 0.0219.94 ± 0.05
61.26 ± 0.031.25 ± 0.055.74 ± 0.075.63 ± 0.0817.09 ± 0.0216.90 ± 0.03
81.27 ± 0.021.28 ± 0.015.77 ± 0.015.60 ± 0.0316.94 ± 0.0516.86 ± 0.03
101.23 ± 0.011.21 ± 0.025.72 ± 0.025.58 ± 0.0516.97 ± 0.0316.89 ± 0.04
Table 4. EDS results of atomic composition in the scanned regions (A, B, C, and D) in Figure 6.
ElementAtomic %
ABCD
O39.8739.7643.6241.62
Na2.972.712.944.89
Mg4.805.544.343.56
Al7.457.537.039.64
Si29.3528.2628.4927.98
K1.701.611.862.09
Ca3.813.603.924.86
Ti4.023.352.061.05
Fe6.037.645.744.31
Total:100.00100.00100.00100.00
Table 5. Evaluation of the bulk density (g/cm3) of samples at different sintering temperatures.
SamplesTemperature (°C)
1050110011201140
T02.236 ± 0.312.338 ± 0.692.303 ± 0.942.281 ± 0.60
T42.362 ± 0.932.497 ± 0.582.460 ± 0.402.391 ± 0.43
T62.403 ± 0.252.558 ± 0.942.509 ± 0.792.431 ± 0.50
T102.472 ± 0.612.537 ± 0.182.521 ± 0.132.497 ± 0.62
Table 6. Evaluation of the real density (g/cm3) of samples at different sintering temperatures.
SamplesTemperature (°C)
1050110011201140
T03.478 ± 0.512.884 ± 0.282.968 ± 0.723.217 ± 0.74
T43.325 ± 0.252.840 ± 0.22.995 ± 0.693.002 ± 0.81
T63.387 ± 0.682.809 ± 0.162.836 ± 0.412.904 ± 0.49
T103.542 ± 0.492.964 ± 0.793.105 ± 0.293.164 ± 0.55
Disclaimer/Publisher’s Note: The statements, opinions and data contained in all publications are solely those of the individual author(s) and contributor(s) and not of MDPI and/or the editor(s). MDPI and/or the editor(s) disclaim responsibility for any injury to people or property resulting from any ideas, methods, instructions or products referred to in the content.