Article

Optical Parameters of Deuterated Triglycine Sulfate in Terahertz Range

1
Department of Nanoelectronics, MIREA—Russian Technological University, Moscow 119454, Russia
2
Joint Institute for High Temperatures of Russian Academy of Sciences (JIHT), Moscow 125412, Russia
3
Moscow Center for Advanced Studies, Kulakova Str. 20, Moscow 123592, Russia
*
Author to whom correspondence should be addressed.
Crystals 2024, 14(12), 1093; https://doi.org/10.3390/cryst14121093
Submission received: 30 November 2024 / Revised: 11 December 2024 / Accepted: 16 December 2024 / Published: 19 December 2024
(This article belongs to the Section Inorganic Crystalline Materials)

Abstract

:
In this work, the optical parameters of a 550 μm thick deuterated triglycine sulfate (DTGS) crystal in the range of 0.3–1.5 THz were investigated in low and high fields by time-domain spectroscopy. The X and Z axes of the refractive index ellipsoid were identified, and the refractive indices and extinction coefficients were determined. In addition, it was shown that, in strong THz fields, a phonon A-mode with a frequency of about 40 cm−1 can be excited in the DTGS crystal when the THz wave vector coincides with the polar axis of the crystal and the polarization of the THz radiation coincides with the X-axis of the crystal. The use of the observed effect and the determination of the mode excitation parameters can be twofold. First, they show the limits of the THz field for non-invasive action on the crystal. Second, they present the mode excitation conditions that can be used, for example, in controllable absorbers.

1. Introduction

Ferroelectric materials are widely used in nano- and optoelectronic applications due to their radiation resistance, energy efficiency, short switching times, stability over a wide temperature range, and low dielectric losses [1,2]. In traditional electro-optical devices, optical properties of the ferroelectrics are controlled by an external electric field, which limits their switching speed to nanoseconds, which corresponds to gigahertz frequencies. The search for conceptually new methods and mechanisms to control the state of ferroelectrics in significantly shorter times, down to picoseconds, is critical for the development of new, efficient, and ultrafast optoelectronic devices. One promising approach is the use of powerful sub-picosecond electromagnetic pulses in the terahertz range [3,4,5,6].
Another promising application of ferroelectric materials in the THz range is the development of highly efficient THz radiation modulators. The ability to achieve high modulation depth in these devices has already been demonstrated [7,8,9]. The implementation of these modulators will significantly enhance the speed of information transfer. To develop efficient optoelectronic devices in the THz range, precise knowledge of the optical properties of the materials used in this frequency range is required.
To date, optical constants in the THz range are determined for such materials as silicon, sapphire, crystalline quartz, silica, and pyrex glass [10,11,12] etc., which are typical substrate and window materials. Some ferroelectrics materials, including LiNbO3 (Lithium Niobate) [13], SrTiO3 (Strontium Titanate) [14], and PZT (Lead Zirconate Titanate) [15], have also been characterized in the THz and sub-THz ranges. However, the optical constants of triglycine sulfate in the THz range have not been reported previously.
Triglycine sulfate (NH2CH2COOH)3 ∗ H2SO4 (TGS) is a widely studied ferroelectric material. It has monoclinic symmetry with a C2 polar axis. It is commonly used in IR detectors, nonlinear capacitors, temperature sensors, and other nano- and optoelectronic devices [16,17,18]. Research into its properties and possible applications is still ongoing [19,20,21]. For instance, in Ref. [22], the phase switching of order to disorder states of TGS by the impact of acoustical shock waves was demonstrated. In [23], the method for the fabrication of a thin TGS film consisting of ordered nanocrystals inside the nanopores of the anodic aluminum oxide template and along the polar axis of the crystal was proposed. This structure has a potential for the creation of thermal energy harvesting devices. Therefore, investigation into TGS’s optical properties in the THz range is also important task.
Modification of TGS crystals (deuteration and doping) leads to the stabilization of the domain structure and an increase in spontaneous polarization. These crystals have one of the highest values in terms of their pyroelectric coefficient and are widely used as the main functional element of pyroelectric detectors. Although in recent years the range of pyroelectric detector materials has significantly expanded, pyroelectric and IR detectors based on TGS find their niche and show high efficiency [24,25,26].
Here, we present the results of the deuterated TGS (DTGS) optical parameters investigation in the THz range using a time-domain spectroscopy (TDS) technique. These results will expand the scope of TGS applications and accelerate the creation of new-generation optoelectronic devices operating in the THz range.

2. Materials and Methods

A 550 μm thick DTGS crystal was made by a slow cooling method from solution at Shubnikov Institute of Crystallography RAS. The XRD pattern of the crystal (Figure 1) confirmed that the DTGS is a single crystal with the surface oriented perpendicular to its polar axis.
The transmission spectra of the DTGS crystal in the THz range were investigated by time domain spectroscopy (TDS) technique on three different facilities (see Figure 2).
The optical anisotropy of the sample in the THz range was investigated using a terahertz time-resolved spectroscopy facility (Facility 1). The facility is based on a femtosecond laser system consisting of a Ti:sapphire laser with a regenerative amplifier with a wavelength of 800 nm, a pulse duration of 50 fs, and a repetition rate of 3 kHz. The THz radiation source was a CoFeB/Pt spintronic emitter (SE) placed in an external magnetic field to generate THz radiation polarized along the X-axis in the laboratory frame (X-component). A wire grid polarizer transmitting only the X-component of the THz radiation was placed in front of the DTGS crystal for additional polarization control. Detection was performed by a 1 mm thick ZnTe crystal. To register the X-component of the THz field after passing through the DTGS crystal, the ZnTe [−110] axis was aligned along the X-axis in the laboratory frame. To register the Y-component, the polarization of the probe radiation and the ZnTe crystal were rotated by 90 degrees.
To reveal the anisotropy, the DTGS crystal was rotated around the Z axis of the laboratory frame (blue axes in Figure 3a) in 20-degree increments for a full 360 degrees. For each step, temporal forms of the X-and Y-components of the THz pulse were measured, and the peak-to-peak signals were taken (see Figure 4, top left panel) [28]. These values were plotted on the graph (Figure 3), which allowed us to determine the principal axes of the index ellipsoid (red axes in Figure 3a).
After determining the principal axes, and, therefore, the polarization directions of two linearly polarized waves propagating in the crystal, the transmission spectra of these waves in the THz range were studied in both weak and strong THz fields.
Studies in weak THz fields were carried out using a commercial THz spectrometer Tera K15 (Menlo System) in the range of 0.25–1.5 THz (Facility 2).
To study the THz transmission spectra in high fields using the TDS technique, Facility 3 was used, based on a Cr:forsterite laser with a wavelength of 1240 nm and a repetition rate of 10 Hz.Due to a low repetition rate, this facility has a low signal-to-noise ratio. The THz radiation source was an organic crystal OH1 [29]. The THz field strength reached 4 MV/cm, and the spectral range was 0.5–3 THz. The strong terahertz field made it possible to carry out measurements at different field strengths, achieved by adjusting the optical pump energy. A 200 µm thick GaP crystal was used for detection. The wider spectral range and intense THz radiation allowed for detailed study of the THz-induced effects in the DTGS crystal, which was not possible with the commercial Tera K15 device. All experiments were performed in dry air (humidity ≤ 5%). The comparison of the three facilities is presented in Table 1.

3. Results

Figure 3 shows the azimuthal dependences of the X and Y components of the peak-to-peak signal of the THz pulse transmitted through the DTGS crystal. This signal changes depending on the azimuthal orientation of the DTGS crystal and allows us to distinguish two characteristic directions in the crystal (marked with thin red lines). For these crystal positions (120 and 30 degrees), higher and lower maxima of the X-component of the terahertz field azimuthal dependence are observed (Figure 3a). In our case, these are the directions along the X and Z main axes of the refractive index ellipsoid (see Section 4).
Figure 4 presents the temporal and spectral forms of the input THz pulse (reference) and of the pulse transmitted through the sample with polarizations along the X and Z directions in the refractive index ellipsoid frame. The right panels show the spectral forms for different facilities with different THz field strengths (Facility 2 and Facility 3). The spectral range of the reference pulse at Facility 2 is about 0.5–1.5 THz. For Facility 3, the spectral range of the reference pulse is about 0.5–2.7 THz. In the frequency range above 1.5 THz, strong absorption of THz radiation by the DTGS crystal is observed at both facilities. Since most of the reference pulse spectrum at Facility 2 falls into the low absorption region, the maxima of the temporal forms of the pulses transmitted through the crystal relative to the input pulse in this case are higher than at Facility 3.

4. Discussion

A standard theoretical approach was applied to determine the refractive index and extinction coefficient of the DTGS crystal in the terahertz range [30,31]. Denoting the complex spectral amplitudes of the reference and sample pulses as E r e f ω and E s a m p ω , respectively, the spectral transmittance H ω can be expressed as
H ω = E s a m p ω E r e f ω = T ω e i φ ω = t ~ 12 t ~ 23 e α d 2 e i n 1 ω d c ,
where T ω is the real part of the spectral transmittance, φ ω is the phase, t ~ 12 and t ~ 23 are the Fresnel coefficients for transmission on the front and back sides of the sample, respectively, and d is the sample thickness. The complex refractive index of the sample is n ~ = n + i k , where k is the extinction coefficient, which is related to the absorption coefficient α by the expression k ω = α ω c 2 ω .
Generally, the Fresnel coefficients t ~ 12 and t ~ 23 are complex, which leads to additional phase shifts relative to the reference pulse. However, for materials with a low absorption coefficient, where k n , the Fresnel coefficients become real. As we will see below, the extinction coefficient of the studied material within our spectral range actually turns out to be more than an order of magnitude lower than the refractive index. In this approximation, it is possible to express n ω and k ω as
n ω = 1 + φ ω c ω d ,
k ω = c ω d l n n + 1 2 4 n T ω .
These equations allow for the direct calculation of the refractive index n ( ω ) and absorption coefficient α ( ω ) from the phase ϕ ( ω ) and transmittance T ( ω ) in the low-absorption limit.
The graphs in Figure 5 show the n ( ω ) and k ( ω ) , calculated using the described method. The values are presented in the spectral range from 0.3 to 1.5 THz in accordance with the spectrum of the reference pulse. In the low-frequency region, the values of n ( ω ) are underestimated, since phase shifts at the interface between the sample and air are not taken into account in the low-absorption approximation [30].
The most exciting result of our work was found for the extinction coefficient kx. This is a strong absorption peak at 40 cm−1 (1.2 THz), which is absent on the kx dispersion curves at the low-field facilities. It is clear that the spectral amplitude of this peak solely increases with increasing field strength from 0.46 to 3.6 MV/cm, while the other spectra (for kz within the whole spectral range, measured as well as for kx everywhere excluding the range of the peak itself) coincide for both facilities and do not depend on the power applied.
As is known [32], all modes in the TGS crystal at frequencies below 170 cm−1 correspond to phonon modes. The mode we observed corresponds to the lowest phonon mode (A-mode) of the TGS crystal, which is both Raman and IR active [33]. Its appearance can be explained by the excitation of this mode by the strong electric field of the THz pulse.
According to the literature, this mode is also observed in TGS crystals by Raman scattering [34,35]. This mode appears in the case of the propagation of incident radiation along the polar axis C2, with mutually perpendicular orientations of the polarization of the incident radiation and the radiation transmitted through the sample. Thus, experimental conditions for the case of Figure 3b) correspond to the A-mode appearance.
This mode was also observed in experiments on terahertz transmission in TGS crystals. This type of mode corresponds to the propagation direction of the incident electromagnetic wave along the C2 symmetry axis of the DTGS crystal. In this case, when the vector E is polarized along the X axis in the generally accepted notation [33], in accordance with the literature, a phonon mode occurs at a frequency of about 40 cm−1. With a perpendicular orientation of the vector E (along the Z axis), this mode does not appear. This fact also confirms that the crystal position for maximum of the THz pulse X-component in Figure 3a corresponds to the case of E X and k C 2 , where k is the wave vector of the incident electromagnetic wave. The crystal position for the lower maximum of the THz pulse X-component in Figure 3a corresponds to the case E Z and k C 2 . The experimental results in this work correspond to the data in previous works for the TGS crystal. The spectral dependences of the optical constants of the crystal in this work correspond to the values along the main axes of the refractive indices’ ellipsoid, that is, the values of nx and nz.
The possibility of resonant and non-resonant excitation of IR-active and Raman-active phonon modes by THz radiation has been demonstrated previously in other materials. In [36], the possibility of the coherent excitation of the large-amplitude lattice displacements associated with non-fully symmetric phonon modes in single-crystal SrCu2(BO3)2 by the narrow-band THz source was demonstrated. In [37], it was demonstrated that narrow-band THz radiation can resonantly excite the soft mode in BST films for different crystallographic orientations. In [38], the mechanism for a coherent parametric excitation of a low-energy Raman-active phonon in the LaAlO3 by broad-band THz pulse was present. This mechanism is based on the absorption of photons through an optical transition involving a pair of acoustic vibrational modes.
The results for Facility 2 show a monotonic increase in the refractive indices n x and n z with increasing frequency, except for areas at the edges of the reference pulse spectrum, where the signal-to-noise ratio is high. Oscillations of refractive index and extinction coefficient in the range below 20 cm−1 (including absorption peak at 18 cm−1) can be attributed to interference effects similar to that described in Ref. [39]. k x and k z also increase monotonically, except for the areas at the edges of the spectral range.
As determined as a result of calculations, in the DTGS in the frequency range of 20–55 cm−1, the values of the refractive indices n x and n z lie in the range of 2.8–3.0 and 2.1–2.3, respectively. The extinction coefficients k x and k z lie in the range of 0.05–0.25.
The dependences of the DTGS optical constants on the applied THz field magnitude are also presented in Figure 5 (for Facility 3). Figure 5 shows that, for the k x extinction coefficient, an absorption increase on THz field near 1.2 THz is observed. It may indicate an increase in terahertz radiation influence on the excitation of the phonon mode at 40 cm−1. As mentioned above, modes in the TGS crystal at frequencies below 170 cm−1 correspond to optical phonon modes. Thus, as the field strength of the incident radiation increases, the forced electric dipole oscillations increase, which leads to an increase in the electromagnetic wave absorption.

5. Conclusions

In conclusion, by measuring the transmission anisotropy of the X- and Y-components of the THz radiation in the DTGS crystal, the orientations of the X and Z axes of the refractive index ellipsoid were identified, and the optical constants in the range of 0.3–1.5 THz were determined. The refractive indices n x and n z are in the range of 2.8–3.0 and 2.1–2.3, respectively, while the extinction coefficients k x and k x are in the range of 0.05–0.25. This knowledge is in demand for the development of optoelectronic devices based on DTGS, operating in the THz range.
The key finding is that the phonon A-mode with a frequency of about 40 cm−1 can be excited in the DTGS crystal by a strong THz field of several MV/cm, when k C 2 , and the THz radiation polarization is aligned with the X axis of the crystal. These results allow us to determine the boundary between invasive and non-invasive action of the THz pulse on the DTGS crystal. The former determines the THz field range in which nonlinear THz modulation of optical properties occurs. This range can be used in devices based on phonon excitations and resonances [40,41,42]. In the latter, no excitation of nonlinear processes takes place, and the material can be used for passive elements and sample substrates. These insights are valuable for the development of sensor and device technologies in the terahertz range and contribute to the emerging field of terahertz phononics.

Author Contributions

Conceptualization: E.M.; methodology: O.C. and S.Z.; software: O.C.; validation: S.Z.; formal analysis: A.K.; investigation: K.B., A.G., E.L. and P.A.; sample preparation: P.A.; data curation: A.K.; writing—original draft preparation: K.B. and A.K.; writing—review and editing: K.B. and E.M.; visualization: A.G.; supervision: E.M.; project administration: E.M.; funding acquisition: E.M. All authors have read and agreed to the published version of the manuscript.

Funding

The work of P.A., A.K. and E.M. (TDS experimental study at low fields, data processing and writing the paper) was supported by the Russian Science Foundation, grant № 22-12-00334. The work of A.G. and K.B. (experimental studies of DTGS anisotropy in the THz range, XRD and TDS experimental study at high fields, writing the paper) was supported by the Ministry of Science and Higher Education of the Russian Federation (Project № FSFZ-2024-0047). Experimental studies in a strong THz field were carried out on a unique experimental setup of JIHT RAS operated by O.C., who is supported by the Ministry of Science and Higher Education of the Russian Federation (state task № 075-00270-24-00).

Data Availability Statement

The data presented in this study are available on request from the corresponding author.

Conflicts of Interest

The authors declare no conflicts of interest.

References

  1. Shirokov, V.B.; Biryukov, S.V.; Mukhortov, V.M.; Yuzyuk, Y.I. Polarization of thin barium-strontium titanate films by an external electric field. Tech. Phys. 2011, 56, 1175–1180. [Google Scholar] [CrossRef]
  2. Turygin, A.P.; Shikhova, V.A.; Kosobokov, M.S.; Akhmatkhanov, A.R.; Sergeeva, O.N.; Shur, V.Y. Highly Anisotropic Tip-Induced Domain Growth in Polydomain Triglycine Sulfate. ACS Appl. Electron. Mater. 2022, 4, 5215–5220. [Google Scholar] [CrossRef]
  3. Asada, K.; Miyamoto, T.; Yamakawa, H.; Hirata, J.; Takamura, N.; Morimoto, T.; Suzuki, K.; Otaki, T.; Kida, N.; Nakamura, T.; et al. Ultrafast control of electronic states by a terahertz electric field pulse in the quasi-one-dimensional organic ferroelectric (TMTTF)2PF6. Phys. Rev. B 2021, 104, 195148. [Google Scholar] [CrossRef]
  4. Bilyk, V.; Brekhov, K.; Ovchinnikov, A.; Chefonov, O.; Mishina, E. Terahertz-induced polar state in quantum paraelectric SrTiO3. MRS Adv. 2023, 8, 943–946. [Google Scholar] [CrossRef]
  5. Mishina, E.; Bilyk, V.; Sherstyuk, N.; Sigov, A. Ferroelectric switching by (sub)-picosecond electromagnetic pulse. Ferroelectrics 2021, 577, 1–12. [Google Scholar] [CrossRef]
  6. Shin, D.; Latini, S.; Schäfer, C.; Sato, S.A.; Baldini, E.; De Giovannini, U.; Hübener, H.; Rubio, A. Simulating Terahertz Field-Induced Ferroelectricity in Quantum Paraelectric SrTiO3. Phys. Rev. Lett. 2022, 129, 167401. [Google Scholar] [CrossRef]
  7. Zhou, S.; Ji, J.; Tian, Y.; Ling, F.; Yu, W. Optically tuned dielectric property of barium titanate thin film by THz spectroscopy. Opt. Mater. 2017, 73, 623–627. [Google Scholar] [CrossRef]
  8. Wang, L.; Zhang, Y.; Guo, X.; Chen, T.; Liang, H.; Hao, X.; Hou, X.; Kou, W.; Zhao, Y.; Zhou, T.; et al. A Review of THz Modulators with Dynamic Tunable Metasurfaces. Nanomaterials 2019, 9, 965. [Google Scholar] [CrossRef]
  9. Yue, J.; Ling, F.; Yao, J. All-optical tunable terahertz modulator based on a BiFeO3 /Si heterostructure. Opt. Mater. Express 2020, 10, 2919. [Google Scholar] [CrossRef]
  10. Sanjuan, F.; Tocho, J.O. Optical properties of silicon, sapphire, silica and glass in the Terahertz range. In Proceedings of the Latin America Optics and Photonics Conference, São Sebastião, Brazil, 11–13 November 2012; OSA: Washington, DC, USA, 2012; p. LT4C.1. [Google Scholar]
  11. Rogalin, V.E.; Kaplunov, I.A.; Kropotov, G.I. Optical Materials for the THz Range. Opt. Spectrosc. 2018, 125, 1053–1064. [Google Scholar] [CrossRef]
  12. Naftaly, M.; Gregory, A. Terahertz and Microwave Optical Properties of Single-Crystal Quartz and Vitreous Silica and the Behavior of the Boson Peak. Appl. Sci. 2021, 11, 6733. [Google Scholar] [CrossRef]
  13. Duvillaret, L.; Garet, F.; Coutaz, J.-L. Highly precise determination of optical constants and sample thickness in terahertz time-domain spectroscopy. Appl. Opt. 1999, 38, 409. [Google Scholar] [CrossRef]
  14. Bilyk, V.R.; Grishunin, K.A. Complex Refractive Index of Strontium Titanate in the Terahertz Frequency Range. Russ. Technol. J. 2019, 7, 71–80. [Google Scholar] [CrossRef]
  15. Białek, M.; Ito, T.; Rønnow, H.; Ansermet, J.-P. Terahertz-optical properties of a bismuth ferrite single crystal. Phys. Rev. B 2019, 99, 064429. [Google Scholar] [CrossRef]
  16. Lal, R.B.; Batra, A.K. Growth and properties of triglycine sulfate (TGS) crystals: Review. Ferroelectrics 1993, 142, 51–82. [Google Scholar] [CrossRef]
  17. Sabarish, V.C.B.; Kumar, G.R.; Raj, S.G.; Durairajan, A.; Rajashekar, B.N. Growth and Characterization of Triglycine Sulphate Single Crystal by Sankaranaryanan–Ramasamy Method. Mater. Today Proc. 2018, 5, 18815–18822. [Google Scholar] [CrossRef]
  18. Gowda, J.; Moolya, B.N.; Ravindraswami, K. Growth and characterization of barium doped triglycine sulphate (BaTGS) single crystals. In Proceedings of the AIP Conference, Mumbai, India, 10 April 2018; p. 100016. [Google Scholar]
  19. Alemu, D.; Firehun, S.; Abza, T.; Peter, M.E. The Study of Structural, Optical, and Dielectric Properties of Magnesium Chloride-Doped Triglycine Sulphate Ferroelectric Single Crystals. Adv. Mater. Sci. Eng. 2022, 2022, 1–6. [Google Scholar] [CrossRef]
  20. Iwasaki, K.; Fujii, S.; Kimura, T.; Yamamoto, M.; Tanabe, T. Crystal Growth of Triglycine Sulfate Crystals Under 40-GHz Irradiation and the Infrared Detection of their Device Characteristics. J. Electron. Mater. 2024, 53, 4841–4847. [Google Scholar] [CrossRef]
  21. Bilyk, V.; Grishunin, K.; Tinnemans, P.; Rasing, T.; Kirilyuk, A.; Sergeeva, O.; Sherstyuk, N.; Mishina, E.; Lavrov, S.; Sigov, A. Terahertz wave rectification in a ferroelectric triglycine sulfate single crystal. Opt. Lett. 2023, 48, 2889. [Google Scholar] [CrossRef]
  22. Sivakumar, A.; Dai, L.; Dhas, S.S.J.; Dhas, S.A.M.B.; Freire, P.T.C.; Kumar, R.S.; Almansour, A.I. Acoustic shock wave-induced ordered to disordered switchable phase transitions: A case study of ferroelectric triglycine sulphate single crystal for the application of molecular switches. J. Solid. State Chem. 2024, 332, 124552. [Google Scholar] [CrossRef]
  23. Ghane-Motlagh, R.; Woias, P. A pyroelectric thin film of oriented triglycine sulfate nano-crystals for thermal energy harvesting. Smart Mater. Struct. 2019, 28, 104002. [Google Scholar] [CrossRef]
  24. Sudhakaran, J.M.; Philip, J. Triglycine sulphate and its deuterated analog in polyurethane matrix for thermal/infrared detection: A comparison. J. Appl. Polym. Sci. 2015, 132, 42250. [Google Scholar] [CrossRef]
  25. Alomari, A.; Kropachev, A.; Baliga, S.; Chakraborty, R.; Batra, A.K.; Bowen, C.R. Synthesis, growth, and characterization of deuterated l-alanine triglycine sulfate (DLaTGS) single crystal for infra-red detector applications. Opt. Mater. 2024, 150, 115152. [Google Scholar] [CrossRef]
  26. Liu, C.; Yang, T.; Xie, M.; He, Z.; Xie, H.; Wei, Y.; Geng, D.; Guan, H.; Lu, H. Pyro-Phototronic Circularly Polarized Light Detection Based on Deuterated L-Alanine Doped Triglycine Sulfate’s Bulk Photovoltaic Effect. Laser Photon. Rev. 2024, 18, 2400527. [Google Scholar] [CrossRef]
  27. MenloSystems (Official Cite). Tera K15. Available online: https://www.menlosystems.com/products/thz-time-domain-solutions/terak15-terahertz-spectrometer/ (accessed on 4 December 2024).
  28. Zainullin, F.A.; Khusyainov, D.I.; Kozintseva, M.V.; Buryakov, A.M. Polarization analysis of THz radiation using a wire grid polarizer and ZnTe crystal. Russ. Technol. J. 2022, 10, 74–84. [Google Scholar] [CrossRef]
  29. Vicario, C.; Jazbinsek, M.; Ovchinnikov, A.V.; Chefonov, O.V.; Ashitkov, S.I.; Agranat, M.B.; Hauri, C.P. High efficiency THz generation in DSTMS, DAST and OH1 pumped by Cr:forsterite laser. Opt. Express 2015, 23, 4573. [Google Scholar] [CrossRef]
  30. Jepsen, P.U.; Cooke, D.G.; Koch, M. Terahertz spectroscopy and imaging—Modern techniques and applications. Laser Photon. Rev. 2011, 5, 124–166. [Google Scholar] [CrossRef]
  31. Jepsen, P.U.; Fischer, B.M. Dynamic range in terahertz time-domain transmission and reflection spectroscopy. Opt. Lett. 2005, 30, 29. [Google Scholar] [CrossRef]
  32. Santra, L.; Verma, A.L.; Bajpai, P.K.; Hilczer, B.; Huong, P.V. Raman spectroscopic study of alanine doped triglycine sulphate ferroelectric single crystals. J. Phys. Chem. Solids 1994, 55, 405–411. [Google Scholar] [CrossRef]
  33. Hadni, A.; Gerbaux, X. Far IR excitation of longitudinal optical phonons in triglycine sulphate. Ferroelectrics 2000, 248, 15–26. [Google Scholar] [CrossRef]
  34. Bajpai, P.K.; Verma, A.L. Molecular dynamics of glycine ions in alanine doped TGS single crystal as probed by polarized laser raman spectroscopy. Spectrochim. Acta Part A Mol. Biomol. Spectrosc. 2012, 96, 906–915. [Google Scholar] [CrossRef]
  35. Tashiro, K.; Yagi, N.; Kobayashi, M.; Kawaguchi, T. Determination of the LO–TO Splittings in the Raman Spectra of Ferroelectric Triglycine Sulfate (TGS). Jpn. J. Appl. Phys. 1987, 26, 699. [Google Scholar] [CrossRef]
  36. Vicario, C.; Trisorio, A.; Allenspach, S.; Rüegg, C.; Giorgianni, F. Narrow-band and tunable intense terahertz pulses for mode-selective coherent phonon excitation. Appl. Phys. Lett. 2020, 117, 101101. [Google Scholar] [CrossRef]
  37. Brekhov, K.; Bilyk, V.; Ovchinnikov, A.; Chefonov, O.; Mukhortov, V.; Mishina, E. Resonant Excitation of the Ferroelectric Soft Mode by a Narrow-Band THz Pulse. Nanomaterials 2023, 13, 1961. [Google Scholar] [CrossRef]
  38. Basini, M.; Unikandanunni, V.; Gabriele, F.; Cross, M.; Derrico, A.M.; Gray, A.X.; Hoffmann, M.C.; Forte, F.; Cuoco, M.; Bonetti, S. Terahertz-driven parametric excitation of Raman-active phonons in LaAlO3. arXiv 2024, arXiv:2410.06748. [Google Scholar]
  39. Nishizawa, S.; Sakai, K.; Hangyo, M.; Nagashima, T.; Takeda, M.W.; Tominaga, K.; Oka, A.; Tanaka, K.; Morikawa, O. Terahertz Time-Domain Spectroscopy. In Terahertz Optoelectronics; Springer: Berlin/Heidelberg, Germany, 2005; pp. 203–270. [Google Scholar]
  40. Afanasiev, D.; Hortensius, J.R.; Ivanov, B.A.; Sasani, A.; Bousquet, E.; Blanter, Y.M.; Mikhaylovskiy, R.V.; Kimel, A.V.; Caviglia, A.D. Ultrafast control of magnetic interactions via light-driven phonons. Nat. Mater. 2021, 20, 607–611. [Google Scholar] [CrossRef]
  41. Lejman, M.; Vaudel, G.; Infante, I.C.; Chaban, I.; Pezeril, T.; Edely, M.; Nataf, G.F.; Guennou, M.; Kreisel, J.; Gusev, V.E.; et al. Ultrafast acousto-optic mode conversion in optically birefringent ferroelectrics. Nat. Commun. 2016, 7, 12345. [Google Scholar] [CrossRef]
  42. Handa, H.; Okamura, Y.; Yoshimi, R.; Tsukazaki, A.; Takahashi, K.S.; Tokura, Y.; Takahashi, Y. Terahertz field driven giant nonlinear phonon response in ferroelectric semiconductor In-doped (Sn,Pb)Te. Phys. Rev. B 2024, 109, L081102. [Google Scholar] [CrossRef]
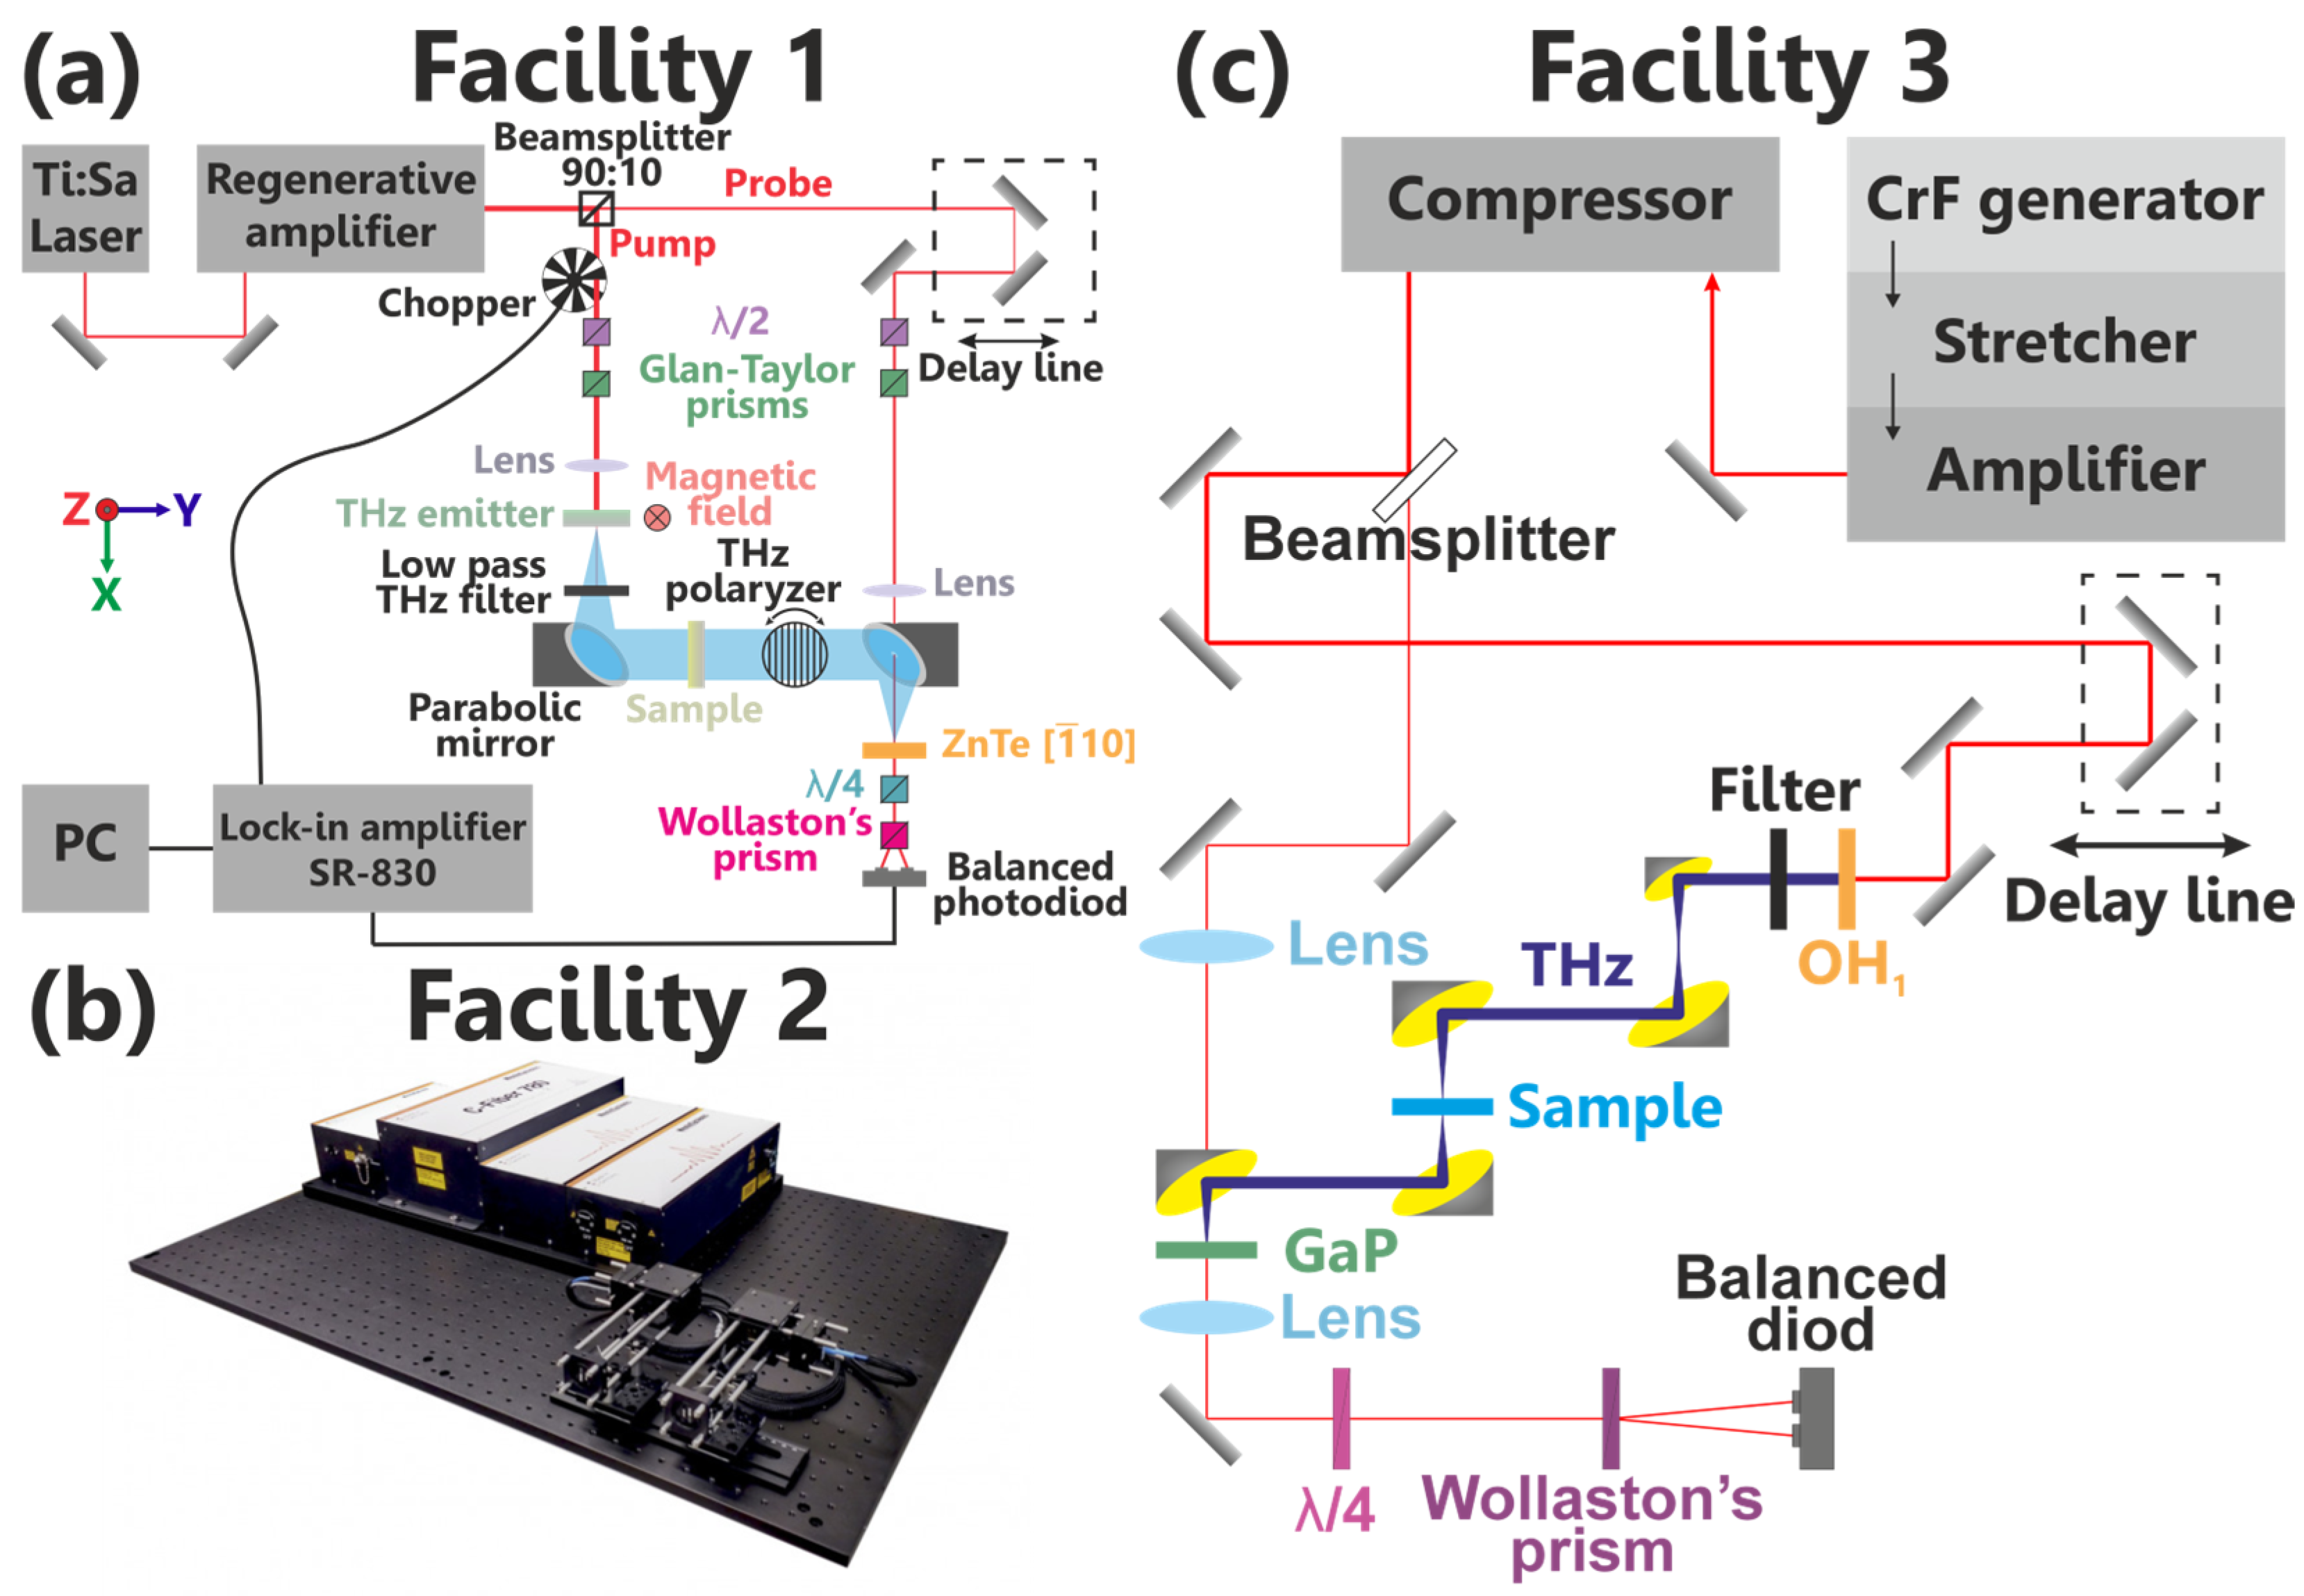
Figure 1. XRD pattern of the DTGS crystal.
Crystals 14 01093 g001
Figure 2. Schematic and photo of the experimental terahertz spectroscopy facilities used in this work: (a) Facility 1, (b) Facility 2–commercial THz spectrometer Tera K15 (Menlo System) [27], (c) Facility 3.
Crystals 14 01093 g002
Figure 3. Azimuthal dependences of the (a) X-and (b) Y-components of the THz signal on DTGS crystal rotation angle (Facility 1). X- and Y-components of the THz field are directed along the X and Y axes of the laboratory frame (blue axes in the left panel). The gray area is the refractive indices ellipsoid. Red axes on the left panel denote its main axes.
Crystals 14 01093 g003
Figure 4. Temporal (left panels) and spectral (right panels) forms of the THz signals for facilities 2 and 3.
Crystals 14 01093 g004
Figure 5. Optical constants of DTGS crystal for different THz field strength and two sample orientations: (a) spectra of the refractive indices n x and n z (Facility 2); (d) spectra of the extinction coefficients k x and k z (Facility 2); (b,c,e,f) spectra of the optical constants for different values of the maximum field strength: n x , n z , k x , and k z , correspondingly (Facility 3).
Crystals 14 01093 g005
Table 1. Comparison of the three facilities.
Facility 1Facility 2Facility 3
THz sourceSE CoFeB/PtPhotoconductive antennaOH1 organic crystal
Repetition rate3 kHz100 MHz10 Hz
Possibility of sample
rotation
YesNoNo
Possibility of X and Y THz component
measurements
YesNoNo
THz field<50 kV/cm<50 kV/cmUp to 3.6 MV/cm
Possibility of THz field changingNoNoYes
Evaluate of the error4%<1%12%
Disclaimer/Publisher’s Note: The statements, opinions and data contained in all publications are solely those of the individual author(s) and contributor(s) and not of MDPI and/or the editor(s). MDPI and/or the editor(s) disclaim responsibility for any injury to people or property resulting from any ideas, methods, instructions or products referred to in the content.

