Article

Metastable Racemic Ibuprofen Supercooled Liquid

1
College of Material Engineering, Fujian Agriculture and Forestry University, Fuzhou 350100, China
2
School of Resources and Chemical Engineering, Sanming University, Sanming 365004, China
*
Authors to whom correspondence should be addressed.
Crystals 2024, 14(12), 1037; https://doi.org/10.3390/cryst14121037
Submission received: 8 November 2024 / Revised: 24 November 2024 / Accepted: 26 November 2024 / Published: 28 November 2024
(This article belongs to the Section Crystal Engineering)

Abstract

:
Amorphous solid dispersions are good candidates for improving solubility in water and the oral bioavailability of poorly water-soluble active pharmaceutical ingredients (APIs). Amorphous solids become supercooled liquids when the temperature reaches the glass transition temperature (Tg). For APIs with low melting points, Tg can be below room temperature, which makes it difficult to prepare long-term stable amorphous solids. Studies on the physicochemical properties of supercooled liquids shed light on the design of ASDs for APIs with low melting points. Racemic ibuprofen (IBU) supercooled liquid has been detected using differential scanning calorimetry and powder X-ray diffraction during the melt-quenching of IBU at a low temperature (0 °C). In this work, gram-scaled IBU supercooled liquid was prepared using the melt-quenching method, maintaining a liquid state for minutes at room temperature and for hours at 10 °C, as confirmed by visual observation. The Raman spectra, IR spectra, and UV-vis spectra results indicate that the structure of the IBU supercooled liquid is similar to that of an IBU solution instead of IBU Form I. The rate of recrystallization into Form I can be adjusted by controlling the temperature and additives, as confirmed by visual observation. Moreover, long-term stable IBU dispersions, with improved aqueous solubility, were inspired by the IBU supercooled liquid. The IBU supercooled liquid model can guide the preparation of ASDs for low melting point drugs.

1. Introduction

Amorphous systems (pure amorphous drugs, amorphous solid dispersions (ASDs), co-amorphous (CAM) systems, etc.) are good candidates for improving solubility in water and the oral bioavailability of poorly water-soluble active pharmaceutical ingredients (APIs) [1]. Amorphous solids become supercooled liquids when the temperature reaches the glass transition temperature (Tg) [2]. For APIs with low melting points, Tg can be below room temperature, which makes it difficult to prepare long-term stable amorphous solids. The addition of polymers or surfactants can increase the Tg predicted by the Gordon–Taylor equation [3]. Since the supercooled liquids of most APIs cannot be maintained at room temperature, the use of supercooled liquids to improve the solubility and bioavailability of poorly water-soluble APIs is lacking in practice. A study on supercooled liquids could help us know more about their fundamental physicochemical properties and shed light on the design of ASDs for APIs with low melting points.
Ibuprofen (2-(p-isobutylphenyl)propanoic acid, IBU, Figure 1a top) is a widely used nonsteroidal anti-inflammatory drug. Racemic IBU is used in clinics due to the metabolic activation of inactive R-enantiomer to the active S-enantiomer in vivo [4]. IBU is a typical poorly water-soluble API (solubility 0.02 mg·mL−1 at 293 K) [5]. ASDs, CAM systems, and nanocarrier systems (Table 1) have been used to improve its solubility. Marianna et al. prepared an ASD of IBU with PVP, which improved the solubility of IBU by 2.5 times [6]. Uddin et al. prepared an ASD of IBU using melt fusion and the freeze-drying method, improving IBU solubility by up to 35 times [7]. ASD preparation can help improve the solubility and dissolution rate of IBU, by improving its bioavailability. IBU is also a typical drug with a low melting point (349 K of stable Form I and 290 K of metastable Form II), and the Tg of amorphous IBU is 228 K [8,9]. The existing form of the IBU disorder phase at room temperature is the IBU supercooled liquid due to its low Tg, which has been observed and confirmed in some rigorous experiments. The differences between the glassy state and the supercooled liquid of IBU are ignored in the literature due to their similarity in characterization results (PXRD and various spectra) and properties (dissolution) [10,11]. The IBU supercooled liquid can be prepared via cooling the IBU melt or melting IBU Form II [8,9]. The IBU supercooled liquid has also been observed in nanostructured silica materials [12]. The dense liquid phase is identified as a precursor phase in the nucleation of IBU with a liquid–liquid phase separation mechanism [13,14], inducing an oiling-out phenomenon during the crystallization process of the IBU aqueous solution [15]. However, studies on the stability and physicochemical properties of the IBU supercooled liquid are insufficient, limiting the guidance for preparing a suitable ASD of IBU and other insoluble drugs with low melting points.
Table 1. Summary of Ibuprofen (IBU) solid dispersions reported in the literature.
SystemMethodIBU
Concentration
Dispersion MediumRef
ASDsCo-milling35%SBA-15[11]
Impregnated evaporation40.4%
26.8%
47.8%
SBA-15
SBA-16
DIM
[16]
Hot melt extrusion30%
30%
30%
30%
RSPO
PVPVA 64
Soluplus
EC
[17]
Spray drying20%CCAB[18]
Solvent evaporation0.15 w/vPVP[6]
Hot melt extrusion65%EPO[19]
Spray drying;
electrospinning;
Rotary evaporation
10%Cellulose excipients: HPMCAS and HPMCP-HP55[20]
Co-milling37.7%SBA-15[21]
In situ loading Mesoporous silica[22]
Vacuum capillary wetting and heating SBA-15[12]
NanoparticlesAntisolvent [10]
In this work, we found that racemic IBU supercooled liquid can maintain a liquid state for minutes at room temperature and for hours at 10 °C, which is a feasible model to research supercooled liquid. The structure of the IBU supercooled liquid is similar to an IBU solution rather than IBU Form I, which has been confirmed by the low-frequency Raman spectra (LFRS), mid-frequency Raman spectra (MFRS), IR spectra, and UV-vis spectra. The solubility in water of the IBU supercooled liquid is better than that of Form I, and the IBU supercooled liquid can easily recrystallize into Form I in minutes. The recrystallization rate of the IBU supercooled liquid can be adjusted by controlling the temperature and additives. The long-term stable IBU dispersions, with improved aqueous solubility, were prepared and inspired by the IBU supercooled liquid. Knowledge of supercooled liquids is helpful for the solubilization designs of poorly water-soluble APIs with low melting points.

2. Materials and Methods

2.1. Materials

Ibuprofen (IBU, C13H18O2, Form I), S-IBU ((CH3)2CHCH2C6H4CH(CH3)CO2H), polyvinylpyrrolidone K30 (PVP), polyethylene glycol 200 (PEG-200), and ethyl acetate (AR) were bought from Aladdin. Acetone (AR) and ethanol (AR) were bought from Shanghai Hushi. All of the reagents were used without further purification.

2.2. Methods

  • IBU Form I and supercooled liquid: Raw IBU was in Form I. The IBU supercooled liquid was prepared by quickly quenching the melt of raw IBU from 100 °C to room temperature.
  • Evaporation crystallization of IBU solutions: 100 μL of IBU ethanol, acetone, or ethyl acetate solution (0.1 g·mL−1) was dropped on an aluminum plate and evaporated at room temperature. The low-frequency Raman spectra of the samples were tested during the evaporation process.
  • Stability of the IBU supercooled liquid:
    • Effect of temperature: 1 g of racemic IBU was heated at 100 °C in a water bath for 10 min to completely melt and crystallize at different temperatures (0 °C, 10 °C, 25 °C, 40 °C, 50 °C).
    • Effect of additives: 1 g mixtures of raw IBU and S-IBU/water/ethanol were heated at 100 °C in a water bath for 10 min to completely melt and crystallize at 0 °C. The additive contents (S-IBU/water/ethanol) were 1%, 5%, 10%, 25%, 50%, 75%, and 90%.
    • Each experiment was conducted three times in parallel.
  • Preparation of IBU formulation: 1 g mixtures of raw IBU (10%, 25%, 50%, 75%, or 90%) and PEG-200 or PVP were heated at 100 °C in a water bath for 10 min and quenched at 0 °C. The samples were named IBU-PEG/PVP-IBU contents. Each experiment was conducted three times in parallel.
For the IBU-PVP systems, when the IBU content was higher than 50%, PVP and IBU powders formed a liquid phase when heated at 100 °C, and the liquid state could be maintained after cooling. When the IBU content was lower than 25%, IBU powders could melt and penetrate PVP powders; very hard solids would form after cooling.
  • Working curve: Standard solutions with concentrations of 0.1, 0.2, 0.3, 0.4, 0.5, 0.6, 0.7, 0.8, 0.9, and 1.0 mg/mL were prepared by dissolving 100 mg of IBU into 100 mL of 50 vol. % ethanol and further dilutions. The 263 nm absorbance was used to establish the standard curve.
  • Dissolution: Raw IBU or IBU dispersions (the IBU content was 25% or 10%) containing 0.2 g of IBU were added to 200 mL of water and kept at 0 or 37 °C in a water bath; 5 mL of supernatant was taken at predetermined time points (0.5, 1, 2, 4, 8, 12, and 24 h) and then filtered (PES membrane, 0.22 μm). Moreover, 2 mL of filtrate was added to 2 mL of ethanol, respectively, which was used for the UV-vis test (UV-vis, Shimadzu UV-2550, Shimadzu, Japan, 200~400 nm) to measure the supernatant’s IBU contents. The dissolution test was performed in triplicate.
  • Characterization: Samples were characterized conventionally via powder X-ray diffraction (PXRD, Philips X’Pert Pro, PANalytical, Netherlands, Cu Kα, 40 kV, 30 mA, 5–30°, 4°·min−1), infrared spectrometer (IR, Shimadzu IRAffinity-1S, Shimadzu, Japan, 400–4000 cm−1, 2 cm−1), confocal Raman spectroscopy (Thermo Fisher Scientific, USA, DXR3xi, 532 nm, 40 mW, 0.1 s, 1000 scanning times, 50–3400 cm−1, 50× objective lens), thermogravimetric analysis, and differential scanning calorimetry (DSC-TG, NETZSCH STA 449F3, NETZSCH, Germany, nitrogen, 10 °C·min−1 or 1 °C·min−1).

3. Results

3.1. Preparation of the IBU Supercooled Liquid

Raw IBU consists of white powder crystals, and the IBU supercooled liquid obtained by cooling IBU melt was transparent (Figure 1a, bottom). The IBU supercooled liquid was flowable and could easily be transferred via a pipe as liquid (Figure 1a, bottom right inset), indicating its low viscosity at room temperature. The powder X-ray diffraction (PXRD) results indicate that raw IBU was stable in Form I and the IBU supercooled liquid showed a ‘budge’ at around 2θ of 18° (d spacing, ~0.5 nm) (Figure 1b). Raw IBU is a completely crystallized solid, while IBU supercooled liquid is a liquid without any solid-state phases. It is not possible to distinguish between the IBU amorphous phase and the supercooled liquid only using the PXRD test due to their similar PXRD pattern. The observed flowability of the sample may be the main criterion for the product being a supercooled liquid.

3.2. Structure Similarity Analysis Using Spectroscopy

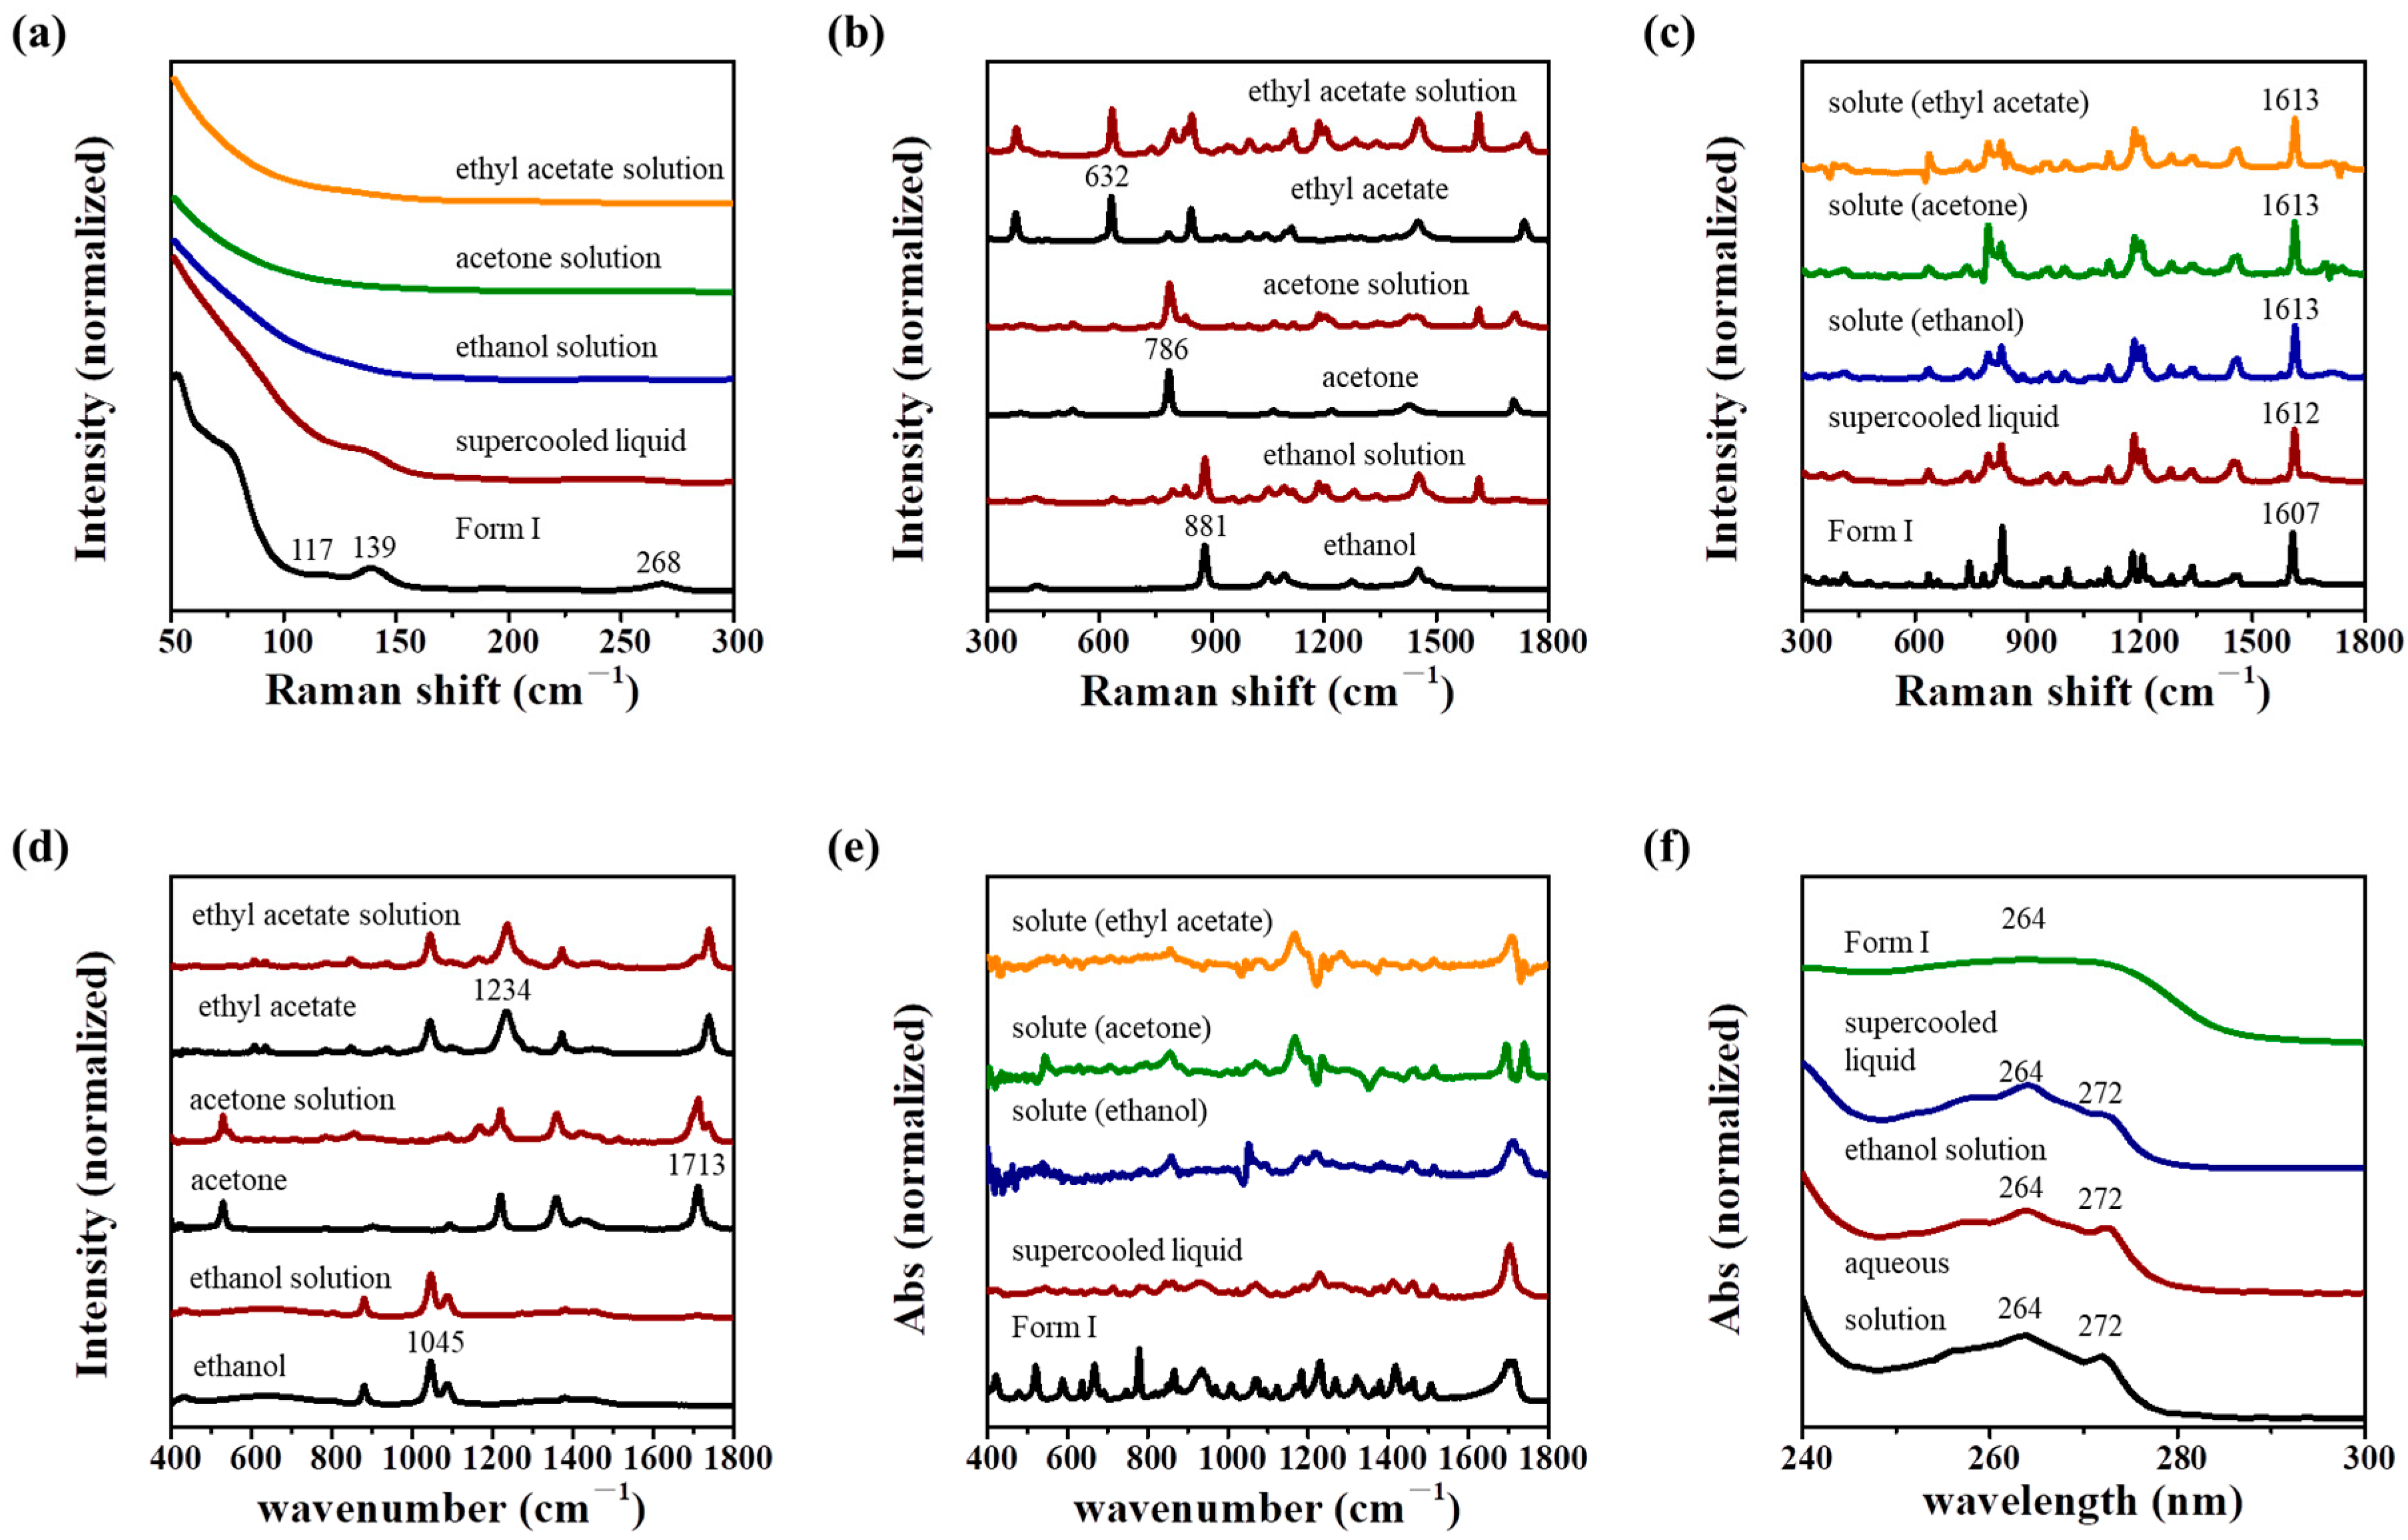
As shown in Figure 2a, the low-frequency Raman spectra (LFRS, in the range of 50–300 cm−1) of IBU Form I show characteristic bands at 117, 139, and 268 cm−1, while the LFRS of the IBU supercooled liquid shows a weak shoulder band at around 135 cm−1, and the LFRS values of IBU ethanol, acetone, and ethyl acetate solutions (0.4 g·mL−1) do not show obvious bands. The LFRS feature of the IBU supercooled liquid is similar to that of the IBU amorphous phase [23], indicating that LFRS is not able to distinguish between the IBU supercooled liquid and the amorphous phase. Both the PXRD and LFRS results confirm the disordered features of the IBU supercooled liquid.
In order to determine which IBU supercooled liquid is more similar in structure to which IBU phase, the molecular conformations and short-range orders of various IBU samples are compared using mid-frequency Raman spectra (MFRS, in the range of 300–1800 cm−1, Figure 2b,c), IR (400–1800 cm−1 Figure 2d,e), and UV-vis spectra (Figure 2f). Three IBU solutions (ethanol, acetone, and ethyl acetate) are studied here. The MFRS values of the three IBU solutions consist of the IBU and solvent signals. Thus, the MFRS values of solute IBU in ethanol, acetone, and ethyl acetate solution were obtained by subtracting the MFRS values of the related solvents from the MFRS values of IBU solutions, respectively (Figure 2c). The Raman bands of ethanol at 881 cm−1, acetone at 786 cm−1, and ethyl acetate at 632 cm−1 were used to calculate the MFRS values of solute IBU, which were normalized at 1610 cm−1 for further comparison. The MFRS of the IBU supercooled liquid and Form I are similar, and most of their characteristic bands correspond (Table 2) due to their same composition. The MFRS values of solute IBU in different solvents are similar, indicating that the conformations of IBU in the three solvents are similar.
To determine which phase’s MFRS is more similar to that of the supercooled liquid, three methods, including visual comparison, the MFRS band locations comparison, and mid-frequency Raman difference spectra (MFRDS), were carried out. It can be concluded that the MFRS values of the supercooled liquid are more similar to those of solutions, except for the residual solvent signals of Form I (as noted by visual observation). In the analysis using the traditional MFRS band location comparison method, 17 MFRS bands of supercooled liquid with enough intensity were selected as references. Moreover, 8 of 17 band locations of supercooled liquids were the same (difference < 2 cm−1) as those of Form I and solute IBU (the band at 636 cm−1 lacked solute IBU in the acetone solution due to the influence of the acetone solvent); 2 of 17 bands of the supercooled liquid did not show related MFRS bands in solute IBU due to the poor signal-to-noise; and 7 of 17 band locations of the supercooled liquid were more similar to those of solute IBU than those of Form I. Thus, the results of the MFRS band location comparison can signify that the structure of the supercooled liquid is more similar to that of the solution. The mid-frequency Raman difference spectra (MFRDS) analysis—considering the locations and strengths of Raman bands at the same time—was proposed in our group for a structure comparison of different phases of the same molecule, semi-quantitatively [24,25,26]. The smoother the MFRDS curve, the more similar the structures are between the related two phases. The average deviation (a. d.) and standard deviation (s. d.) of all the data in the MFRDS are used to indicate the degree of similarity. The smaller the a. d. and s. d., the more similar the related two phases are.
a . d . = x n
s . d . = x 2 n 1
The MFRDS analysis results (Figure S1, Table 3) directly indicate that the MFRS values of supercooled liquid are more similar to those of solute IBU than those of Form I.
Table 2. The characteristic mid-frequency Raman spectra (MFRS, in the range of 300–1800 cm−1) bands and IR bands of various IBU samples; 17 MFRS bands of the IBU supercooled liquid with sufficiently strong intensity are chosen as references. Several IR bands of IBU solutions are visible (not affected by solvents) and chosen to be compared, avoiding interference from solvent signals.
Form ISupercooled LiquidSolute in SolutionAssignment [27,28]
Ethanol Acetone Ethyl Acetate
MFRS
(300–1800 cm−1)
311304 τ
359352
413409410409410Deformation
637636636637 In-plane ring deformation
745741740739740
783795797796795
833831830829830
958955956956955
1007100299910001003Ring breathing
11151117111711181118
11811184118511851185
12061206120612031204
12831283128312831284
13391339134013391340
14501448145214481451
14621458145914591460
16071612161316131613ν asym a C-C in Φ b
IR
(400–1800 cm−1)
714 705707
865848, 862 853
11681168118111661164
122912291222
15061512151415111510ν asym C-C in Φ
171117021711 1706
17331738
a ν-stretching, b Φ-benzene ring.
Because the IR activity of IBU is not as good as its Raman activity, the IR spectra of solute IBU have a poor signal-to-noise ratio. The IR spectra of IBU solutions show strong signals of solvents and weak signals of IBU molecules (Figure 2d). It is hard to compare the calculated IR spectra of solute IBU with the IR spectra of supercooled liquid and Form I (Figure 2e). The IR bands of the IBU supercooled liquid and Form I are similar (<8 cm−1, Table 2). The UV-vis spectra of the IBU supercooled liquid and solutions are almost the same, both of which are different from that of Form I (Figure 2f). Thus, the MFRS and UV-vis spectra analysis indicate that the short-range order of the IBU supercooled liquid is more similar to that of the IBU solution than that of IBU Form I.

3.3. Formation of the IBU Supercooled Liquid During the Evaporation Crystallization Process

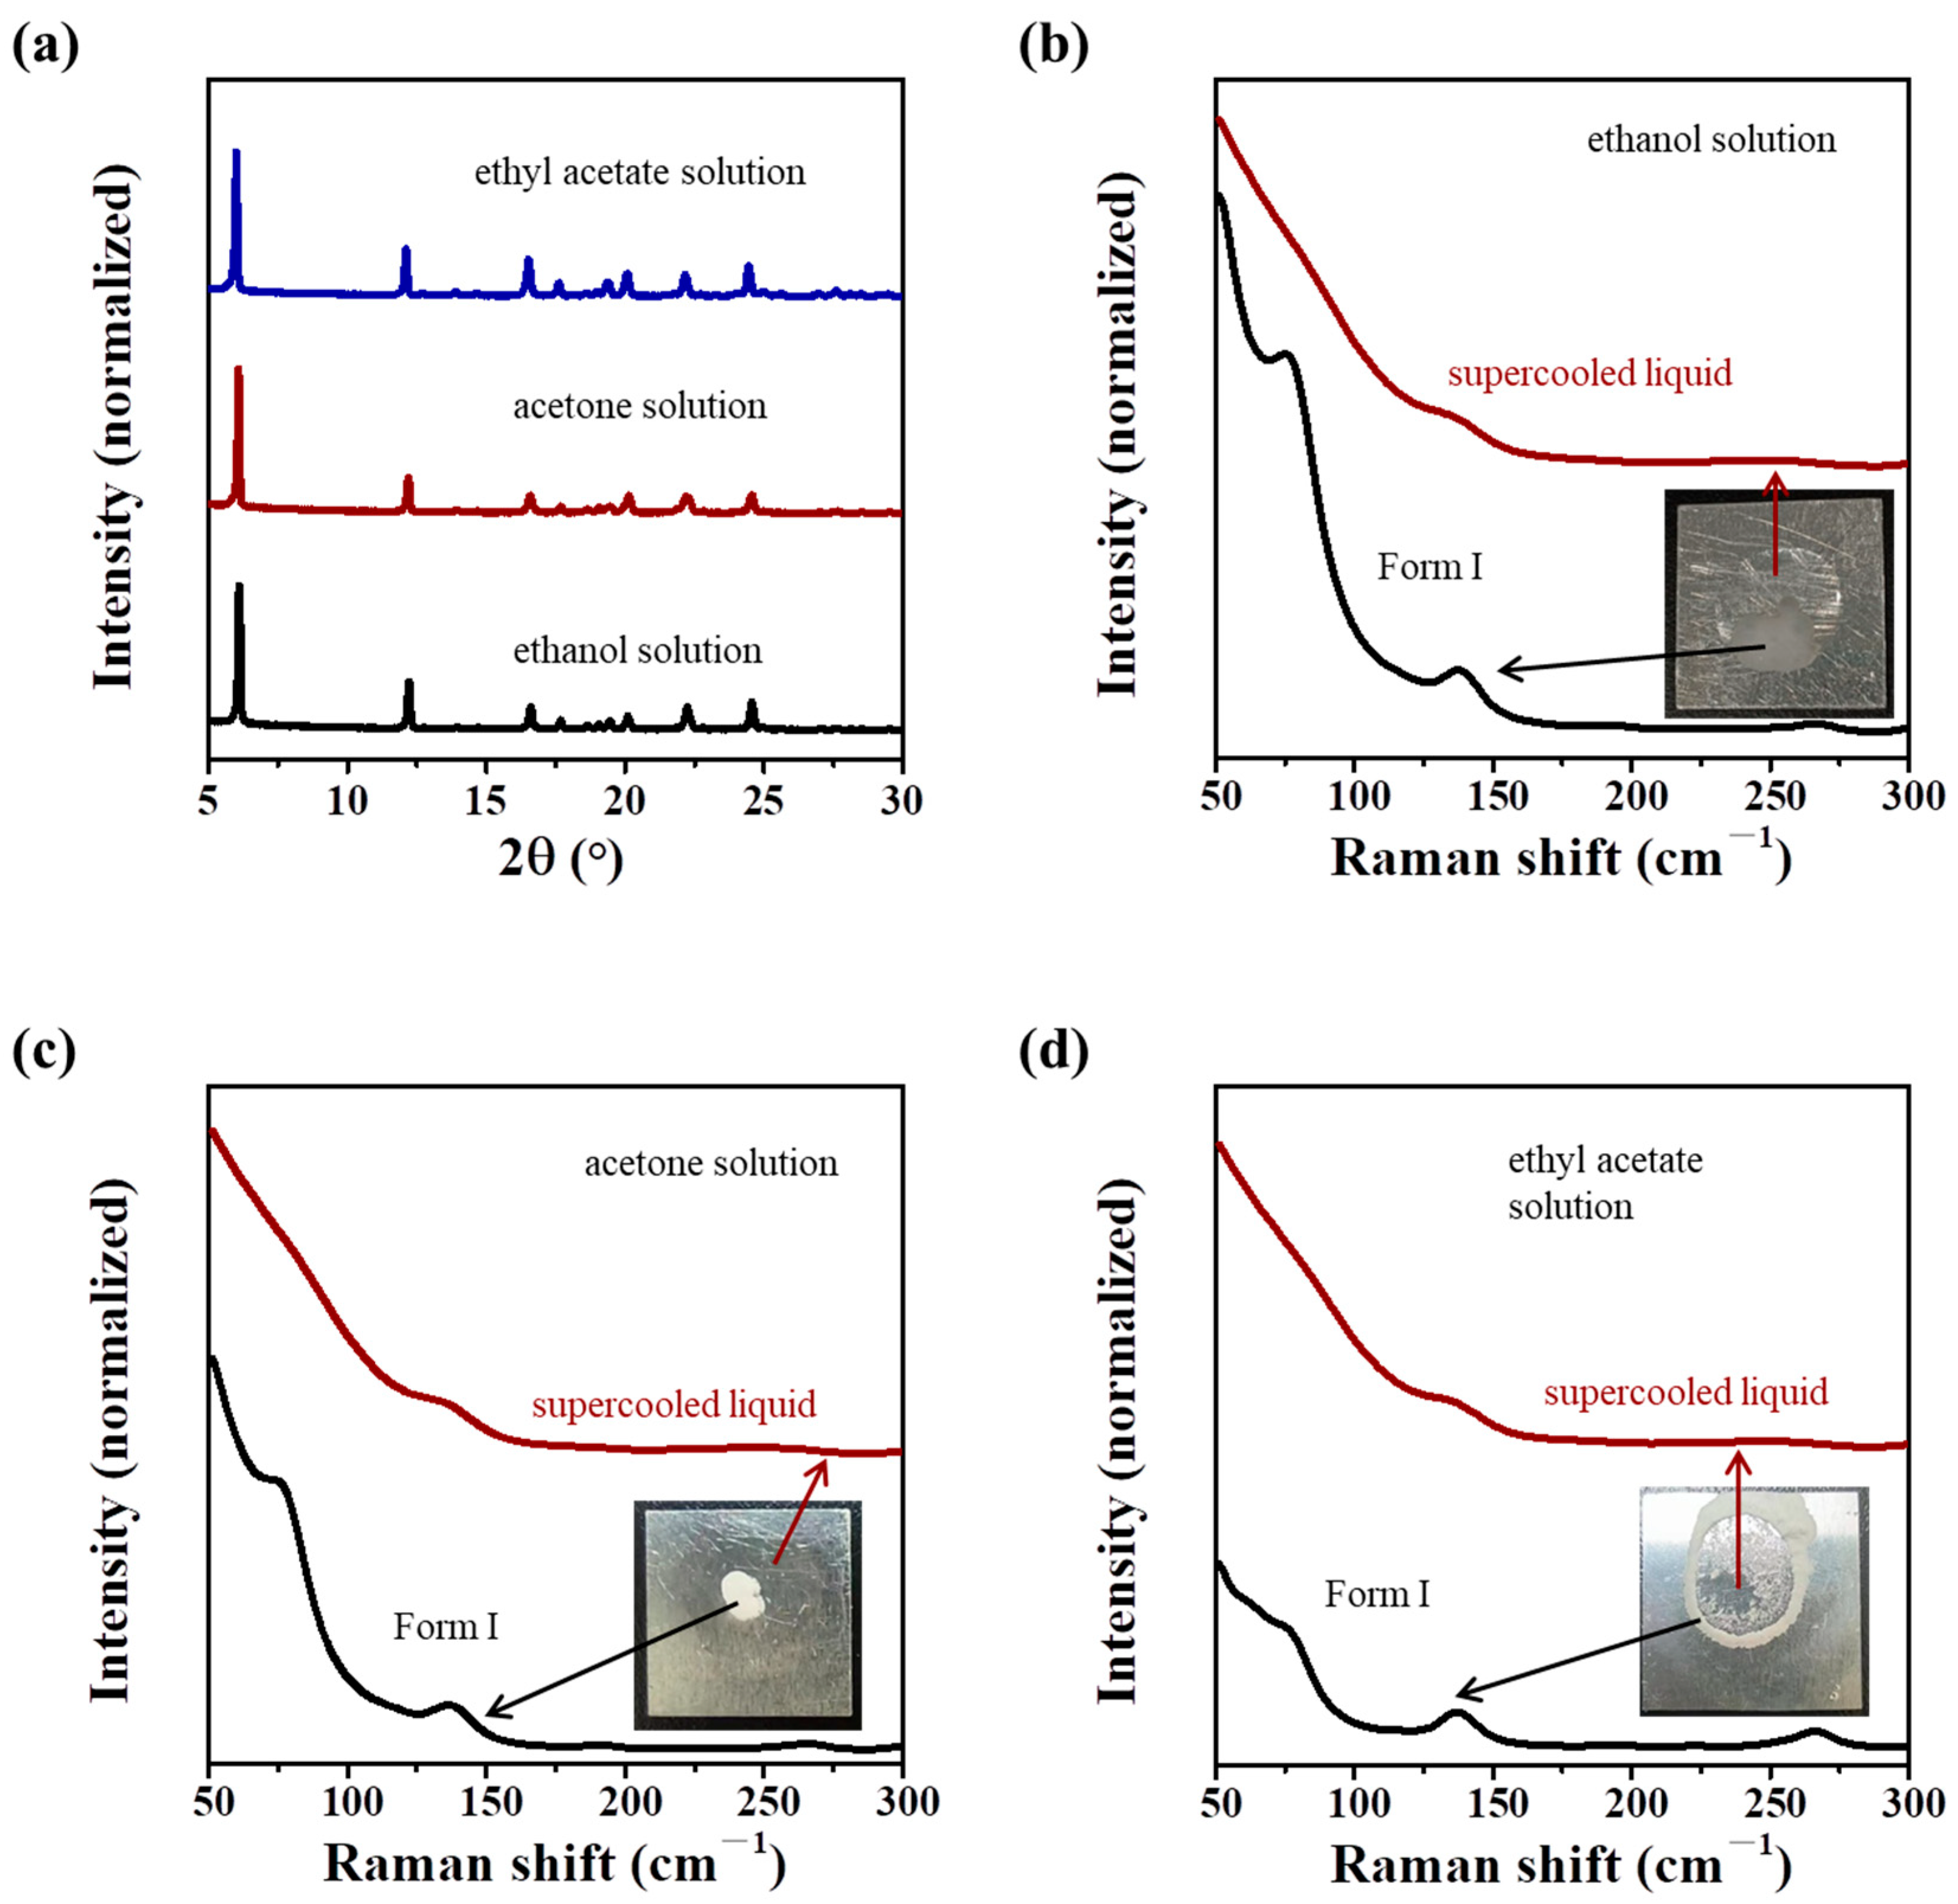
The spectra analysis results mentioned above indicate that the transition from the IBU solution to the IBU supercooled liquid is a kinetic process. It is prior to obtaining the IBU supercooled liquid from the IBU solution. The low Tg of IBU is a key factor in the difficulty of the recrystallization process [29] and in the formation of the IBU supercooled liquid from the IBU solution. However, due to the instability of the IBU supercooled liquid, the evaporation crystallization products of IBU ethanol, acetone, and ethyl acetate solutions only show the features of Form I (Figure 3a), leading to the appearance of the supercooled liquid during the evaporation crystallization process being ignored. The presence of the supercooled liquid can be observed by the naked eye during the evaporation crystallization of the three solutions in this work. And the coexistence of the supercooled liquid and Form I during the evaporation crystallization process was proved by the LFRS test (Figure 3b–d).

3.4. Stability of the IBU Supercooled Liquid

The IBU supercooled liquid was not stable at room temperature and would spontaneously recrystallize into Form I. The DSC curve (Figure 4a and Figure S2) of the IBU supercooled liquid indicates that the supercooled liquid would crystallize into Form I at around 28 °C (exothermic peak), nearly room temperature, and melt at 76 °C (endothermic peak) with a heating rate of 1 °C·min−1, and at 84 °C with a heating rate of 10 °C·min−1, which is consistent with the melting point of Form I.
The stability of the IBU supercooled liquid can be adjusted by controlling the temperature and additives. The time for the supercooled liquid to completely become a white solid (Figure 4b inset) during recrystallization was recorded in macroscopic visual experiments, which can be used to roughly compare the stability of the supercooled liquid under different conditions.
For the 1 g IBU system, the IBU supercooled liquid recrystallized into Form I within 1 h when the storage temperature was higher than room temperature (Figure 4b), which is consistent with the DSC result. When the storage temperature of the IBU supercooled liquid was 0 or 10 °C, the stability of the supercooled liquid was significantly increased and the recrystallization time was extended to hours. Therefore, low temperatures are conducive to stabilizing the IBU supercooled liquid under this condition. A volcanic curve of recrystallization time at 0 °C was observed when extra S-IBU was added (Figure 4c). When the proportion of additional S-IBU was in the range of 25–75 wt.%, the recrystallization time of the sample reached its maximum, which is about twice that of the racemic sample and the pure S-IBU sample. The addition of water as a poor solvent significantly reduced the recrystallization time (Figure 4d). When the water ratios were up to 25 wt.% and 50 wt.%, the systems were suspended and recrystallized quickly. The addition of ethanol, as a good solvent, also reduced the recrystallization time at a low concentration (e.g., 1 wt.%), demonstrating a better effect on reducing the recrystallization time compared to the same amount of water (Figure 4d). When the ratio of ethanol was increased from 1 to 10 wt.%, the recrystallization time increased. The supercooled liquid could maintain stability for over one day with an ethanol concentration of 25 wt.%, and maintain this stability for over one week when the ratio of ethanol was 50 wt.%. Considering that the solubility of IBU in ethanol at 10 °C was 37 wt.% (63 wt.% ethanol) [30], the concentrations of 25 wt.% and 50 wt.% ethanol exceeded the saturation state.

3.5. IBU Formulation Inspired by the IBU Supercooled Liquid

The IBU supercooled liquid is a metastable phase, which has a higher energy than Form I, and theoretically has better dissolution behavior, but the unstable characteristics limit its application. The use of polymers to stabilize metastable phases is a common method in pharmaceutical preparations, such as the supersaturated drug-delivery systems [17] and amorphous solid dispersions [31]. Many examples of IBU solid dispersions (Table 1) have been reported. In this work, long-term stable IBU dispersions with improved aqueous solubility were prepared and inspired by the IBU supercooled liquid. Common pharmaceutical excipients, i.e., PEG 200 and PVP, were used here. PEG 200 is liquid at room temperature, and it was used to prepare the liquid IBU dispersions. PVP has high Tg (164 °C) [32] and Tα (176 °C) [33]; it was used to construct the ASDs of IBU. The preparation method of IBU dispersions was similar to that of the IBU supercooled liquid, and the obtained dispersions, named the IBU–polymer–IBU content, were stored at room temperature to investigate their stability.
The PXRD pattern of the newly prepared IBU-PEG-0.75, which was a liquid, showed no diffraction peak (Figure 5a), but it was not stable in storage, and white crystals appeared after storage at room temperature for two days. The stability of IBU-PEG-0.5 was worse, i.e., white crystals appeared after being kept at room temperature for one day, and its PXRD pattern (signals of the solid and liquid mixture) showed the signal of IBU Form I. For IBU-PEG-0.25 and samples with lower IBU contents, the liquid state could be maintained for a longer time; no crystallization was observed during a long storage period (about one week), and its PXRD pattern showed no diffraction peak. Thus, the liquid IBU-PEG 200 dispersions are stable when the IBU contents do not exceed 25%.
The sample IBU-PVP-0.75 appears to be mainly liquid (Figure 5b), which has high viscosity and is difficult to process and transfer. There are already IBU crystals in it, however, this is difficult to observe due to its high viscosity. Its PXRD pattern shows weak signals of IBU Form I, indicating that PVP in this concentration is not enough to stabilize the liquid phase. The sample IBU-PVP-0.5 is also in the liquid state (Figure 5b) and also has very high viscosity. A large number of bubbles can be observed in it, which may appear to have impurities, but there is no signal of a crystal in its PXRD pattern, indicating that it is a pure phase. The sample IBU-PVP-0.25 is completely different; it is a white solid at room temperature, and its PXRD pattern shows no crystal signal, only a bulge peak, indicating that IBU-PVP-0.25 is an ASD of IBU. According to the Gordon–Taylor model [34], the Tg values of the IBU-PVP samples are about −17 °C (IBU-PVP-0.75), 22 °C (IBU-PVP-0.5), and 77 °C (IBU-PVP-0.2), respectively. Therefore, IBU-PVP-0.5 and IBU-PVP-0.75 should be supercooled liquids with high viscosity, while IBU-PVP-0.25 should be solid at room temperature, which is consistent with the experimental phenomenon. Despite the good stability of the sample IBU-PVP-0.5, it is difficult to handle in practice. For the IBU-PVP dispersions, considering the stability and operability, the content of IBU not exceeding 25% is appropriate for preparing IBU dispersions.

3.6. Dissolution Behavior of IBU Phases

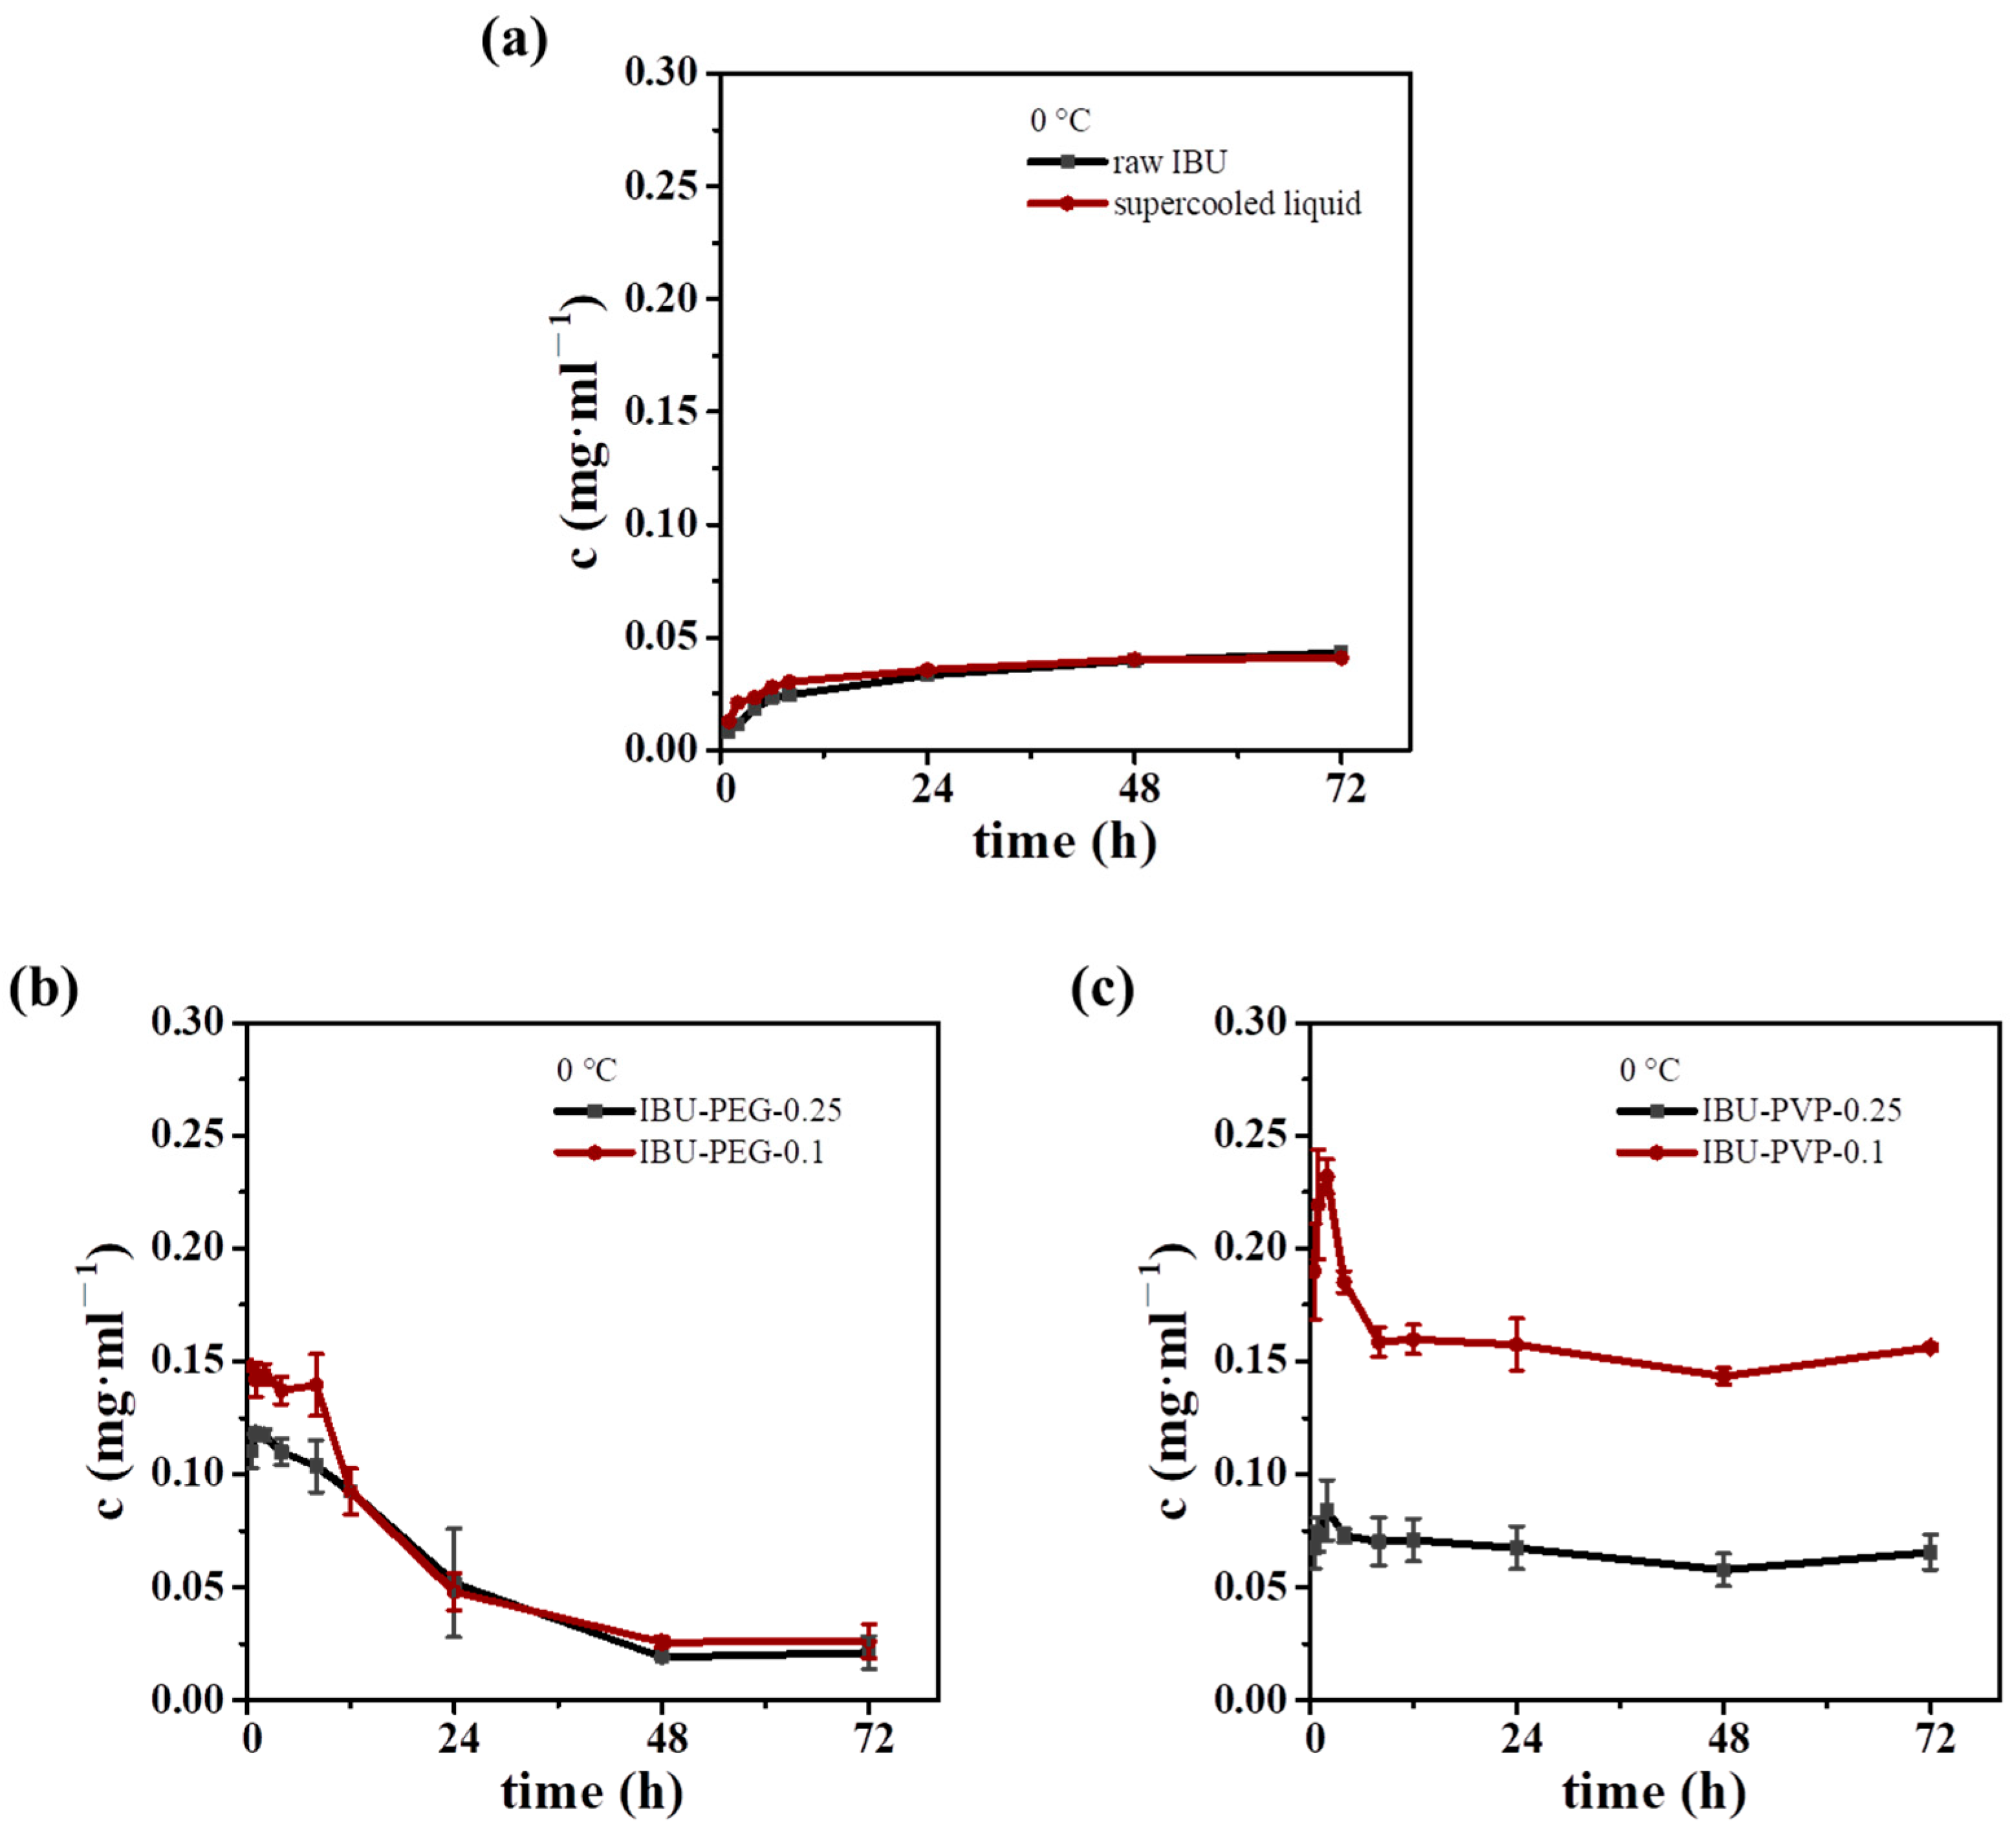
The feasibility of the IBU supercooled liquid used for the solubilization of IBU was studied. Dissolution curves of different IBU samples at 0 or 37 °C were tested (Figure 6 and Figure S2). Due to its unstable nature, the IBU supercooled liquid will quickly convert into a stable Form I in aqueous solution, and its dissolution behavior is not good. As shown in Figure 6a, the dissolution curve of the IBU supercooled liquid is very similar to that of Form I. The dissolution concentration of the IBU supercooled liquid at 48 h is the same as that of Form I (0.040 mg·mL−1), possibly because the supercooled liquid has completely transformed into Form I. However, it can be observed that at the early stage of the dissolution process, the dissolution concentration of the supercooled liquid (0.021 mg·mL−1 at 2 h) is higher than that of Form I (0.012 mg·mL−1), indicating that the supercooled liquid has a higher dissolution rate. The supercooled liquid is expected to be used as the dosage of IBU if its stability can be improved.
The dissolution behaviors of IBU dispersions with good stability (IBU-PEG-0.25, IBU-PEG-0.1, IBU-PVP-0.25, and IBU-PVP-0.1) prepared in this work were also studied. The dissolution concentrations of IBU-PEG-0.25 and IBU-PEG-0.1 at 48 h were 0.019 ± 0.001 mg·mL−1 and 0.026 ± 0.002 mg·mL−1, respectively (Figure 6b), which were even lower than those of Form I. The results show that the liquid IBU dispersions do not have a good solubilization effect. Although the dissolution concentrations of IBU-PEG-0.25 and IBU-PEG-0.1 in the early stage (at 2 h, 0.117 ± 0.002 mg·mL−1 and 0.144 ± 0.005 mg·mL−1, respectively) had a relatively significant increase, their dissolution concentration decreased significantly after 12 h, which may have been caused by the recrystallization of IBU. Therefore, IBU-PEG samples showed a solubilization effect in a short time, but could not be maintained over a long period.
The dissolution concentrations of IBU-PVP-0.25 (0.084 ± 0.013 mg·mL−1) and IBU-PVP-0.1 (0.231 ± 0.008 mg·mL−1) reached their maximum at 2 h and remained basically unchanged after 8 h. The dissolution concentrations of IBU-PVP-0.25 and IBU-PVP-0.1 at 48 h were 0.058 ± 0.007 mg·mL−1 and 0.143 ± 0.004 mg·mL−1, respectively (Figure 6c). Compared with Form I, the solubility values increased 1.5 and 3.6 times, respectively. The IBU-PVP samples show a certain degree of a solubilization effect, however, compared with the ASDs of drugs with high melting points reported in the literature [35], the solubilization effect is not good.

4. Discussion

4.1. Disadvantage of the Supercooled Liquid in Drug Formulation

For poorly soluble drugs with low melting points, such as IBU, when preparing their formulations (such as ASDs and CAM), it is important to consider their Tg values. If the Tg is below room temperature, the product will exist in the form of a supercooled liquid. Our research results of the IBU supercooled liquid indicate that, although supercooled liquid is kinetically metastable, its dissolution property is not satisfactory for two main reasons. Firstly, under dissolution conditions, the supercooled liquid exhibits interfacial tension and has a relatively small specific surface area, which is unfavorable for the diffusion process. Secondly, the supercooled liquid could crystallize during the dissolution process, which is detrimental to the maintenance of metastable phases and high supersaturation levels.
Therefore, when preparing the formulations of poorly soluble drugs with low melting points, it is crucial to select appropriate excipients, such as polymers with high Tg values, and to ensure polymer contents are high enough, to increase the Tg at the same time; this is so they can exist in an amorphous glassy state and have improved solubility, an improved dissolution rate, and bioavailability. On the one hand, the polymer can reduce the surface tension, which is conducive to the dissolution process, and on the other hand, the polymer can stabilize the metastable phase by avoiding the appearance of crystals. Choosing polymers with relatively high Tg can improve the overall Tg and avoid generating a supercooled liquid. Its essence is to avoid the movement of drug molecules; the quick movement will induce crystallization and interface formation.

4.2. Distinguish Between the Glassy State and the Supercooled Liquid

The existence form of the amorphous phase of a molecule, whether a glassy state or supercooled liquid, depends on its Tg. The differences between the glassy state and supercooled liquid of IBU have been ignored in the literature due to their similarity in characterization results (PXRD, and various spectra) and properties (dissolution) [10,11]. Thus, the IBU supercooled liquid was sometimes identified as an amorphous IBU, which caused misunderstandings. In this work, an IBU supercooled liquid—rather than an amorphous solid—was observed in the non-classical evaporating crystallization process. The fluidity of the samples is the main criterion for the product being a supercooled liquid. However, the fluidity is difficult to observe in many systems. Developing new methods to distinguish between the glassy state and the supercooled liquid, especially for systems in which the Tg cannot be measured, is highly necessary.

4.3. Stability of the IBU Supercooled Liquid

The instability factor of the supercooled liquid can avert the phenomenon of oiling out, and the stability factor of the supercooled liquid can make it suitable for applications in drug delivery. It is important to know how to accelerate and slow the crystallization rate of the metastable supercooled liquid. For IBU, some strategies are found to prevent it from oiling out, including high storage temperatures, and the addition of water as a poor solvent.

4.4. Inspiration for the Design of IBU Formulations

Currently, the preparation methods of IBU ASDs can be categorized into two types: the first type requires the use of solvents, such as impregnation [16], solvent evaporation [6,16,20], and spray drying [18,20]; the second type does not require solvents, such as melt-quenching and milling [11,20]. Since IBU with low Tg readily forms a supercooled liquid, which is unstable and exhibits poor dissolution properties, the reported IBU ASDs always have low IBU contents, so the Tg values of the ASDs are higher than room temperature, avoiding the formation of the IBU supercooled liquid. Therefore, the selection of polymers and their contents is crucial during the preparation of IBU dispersions. Ibuprofen is acidic; thus, preparing its salt forms, such as crystal and amorphous salts, could be a good method to improve its solubility; the salt forms of CAM [36], such as the CAM of IBU and the CAM of arginine [37], would be preferable choices.

5. Conclusions

In this work, we studied the physicochemical properties and formulation design of the racemic IBU supercooled liquid as a model for drugs with low melting points. The racemic IBU supercooled liquid was prepared using the melt-quenching method, and it can maintain a liquid state for minutes at room temperature and for hours at 10 °C. The Raman spectra, IR spectra, and UV-vis spectra results indicate that the structure of the IBU supercooled liquid is similar to the IBU solution instead of IBU Form I. Thus, it is prior to obtaining the IBU supercooled liquid from the IBU solution. The presence of supercooled liquid can be observed by the naked eye during the evaporation crystallization of IBU ethanol/acetone/ethyl acetate solutions. And the coexistence of supercooled liquid and Form I during the evaporation crystallization process was proved by LFRS. The IBU supercooled liquid is not stable at room temperature and would recrystallize into Form I spontaneously. The recrystallization rate of the IBU supercooled liquid can be adjusted by controlling the temperature and additives. Although the IBU supercooled liquid has a higher dissolution rate, it has similar solubility to Form I due to its instability. Moreover, the long-term stability of the IBU dispersion, with improved aqueous solubility, was prepared and inspired by the IBU supercooled liquid. The liquid IBU-PEG 200 dispersions are stable when the IBU contents do not exceed 25%. For IBU-PVP dispersions, considering their stability and operability, IBU contents that do not exceed 25% are appropriate for preparing IBU dispersions.

Supplementary Materials

The following supporting information can be downloaded at https://www.mdpi.com/article/10.3390/cryst14121037/s1, Figure S1: Mid-frequency Raman difference spectra (MFRDS) of solute ibuprofen in ethanol solution, supercooled liquid and Form I; Figure S2: DSC curves of the IBU supercooled liquid and Form I with a heating rate of 1 °C·min−1; Figure S3: Dissolution curves of IBU samples at 37 °C. (a) raw IBU Form I and IBU supercooled liquid, (b) liquid dispersions of IBU (IBU-PEG-0.1 and IBU-PEG-0.25), (c) ASDs of IBU (IBU-PVP-0.1 and IBU-PVP-0.25).

Author Contributions

Conceptualization, methodology, supervision, F.C. and R.X.; project administration, investigation, data curation, validation, T.L.; resources, S.R.; visualization, writing—original draft preparation, F.C.; writing—review and editing, R.X.; funding acquisition, W.X., F.C. and R.X. All authors have read and agreed to the published version of the manuscript.

Funding

This research was funded by the National Natural Science Foundation of China (grant number 22005175), the Natural Science Foundation of Fujian Province (grant number 2020J01374, 2021J011116), and the Provincial University Industry Research Cooperation Project (2023H6021).

Data Availability Statement

The original contributions presented in the study are included in the article/Supplementary Materials; further inquiries can be directed to the corresponding author/s.

Conflicts of Interest

The authors declare no conflicts of interest.

References

  1. Tomar, D.; Singh, P.K.; Hoque, S.; Modani, S.; Sriram, A.; Kumar, R.; Madan, J.; Khatri, D.; Dua, K. Amorphous systems for delivery of nutraceuticals: Challenges opportunities. Crit. Rev. Food Sci. Nutr. 2022, 62, 1204–1221. [Google Scholar] [CrossRef] [PubMed]
  2. Berthier, L.; Reichman, D.R. Modern computational studies of the glass transition. Nat. Rev. Phys. 2023, 5, 102–116. [Google Scholar] [CrossRef]
  3. Li, R.; Lin, D.; Roos, Y.H.; Miao, S. Glass transition, structural relaxation and stability of spray-dried amorphous food solids: A review. Dry. Technol. 2019, 37, 287–300. [Google Scholar] [CrossRef]
  4. Mather, L. Do the pharmacodynamics of the nonsteroidal anti-inflammatory drugs suggest a role in the management of postoperative pain? Drugs 1992, 44, 1–13. [Google Scholar] [CrossRef] [PubMed]
  5. Akay, S.; Öztürk, S.; Kalderis, D.; Kayan, B. Degradation, solubility and chromatographic studies of ibuprofen under high temperature water conditions. Chemosphere 2021, 277, 130307. [Google Scholar] [CrossRef] [PubMed]
  6. Ivone, M.; Denora, N.; D’Amico, V.; Mareczek, L.; Mueller, L.K.; Arduino, I.; Ambruosi, A.; Lopedota, A.A. Microbeads produced by prilling/vibration technique: A new way to use polyvinyl alcohol in pediatric and veterinary formulations. J. Drug Deliv. Sci. Technol. 2024, 99, 105974. [Google Scholar] [CrossRef]
  7. Uddin, A.; Halder, S.; Deb, N.; Das, H.; Shuma, M.L.; Hasan, I.; Shill, M.C.; Haider, S.S. Impact of methods of preparation on mechanical properties, dissolution behavior, and tableting characteristics of ibuprofen-loaded amorphous solid dispersions. Adv. Pharmacol. Pharm. Sci. 2024, 2024, 2303942. [Google Scholar] [CrossRef]
  8. Williams, P.A.; Hughes, C.E.; Harris, K.D.M. New insights into the preparation of the low-melting polymorph of racemic ibuprofen. Cryst. Growth Des. 2012, 12, 5839–5845. [Google Scholar] [CrossRef]
  9. Dudognon, E.; Correia, N.T.; Danède, F.; Descamps, M. Solid-solid transformation in racemic ibuprofen. Pharm. Res. 2013, 30, 81–89. [Google Scholar] [CrossRef]
  10. Melzig, S.; Finke, J.H.; Schilde, C.; Kwade, A. Formation of long-term stable amorphous ibuprofen nanoparticles via antisolvent melt precipitation (AMP). Eur. J. Pharm. Biopharm. 2018, 131, 224–231. [Google Scholar] [CrossRef]
  11. Moutamenni, B.; Tabary, N.; Mussi, A.; Dhainaut, J.; Ciotonea, C.; Fadel, A.; Paccou, L.; Dacquin, J.-P.; Guinet, Y.; Hédoux, A. Milling-assisted loading of drugs into mesoporous silica carriers: A green and simple method for obtaining tunable customized drug delivery. Pharmaceutics 2023, 15, 390. [Google Scholar] [CrossRef] [PubMed]
  12. Brás, A.R.; Merino, E.G.; Neves, P.D.; Fonseca, I.M.; Dionísio, M.; Schönhals, A.; Correia, N.T. Amorphous ibuprofen confined in nanostructured silica materials: A dynamical approach. J. Phys. Chem. C 2011, 115, 4616–4623. [Google Scholar] [CrossRef]
  13. Wiedenbeck, E.; Kovermann, M.; Gebauer, D.; Cölfen, H. Liquid metastable precursors of ibuprofen as aqueous nucleation intermediates. Angew. Chem. Int. Ed. 2019, 58, 19103–19109. [Google Scholar] [CrossRef] [PubMed]
  14. Tsarfati, Y.; Biran, I.; Wiedenbeck, E.; Houben, L.; Cölfen, H.; Rybtchinski, B. Continuum crystallization model derived from pharmaceutical crystallization mechanisms. ACS Cent. Sci. 2021, 7, 900–908. [Google Scholar] [CrossRef] [PubMed]
  15. Codan, L.; Casillo, S.; Bäbler, M.U.; Mazzotti, M. Phase diagram of a chiral substance exhibiting oiling out. 2. Racemic compound forming ibuprofen in water. Cryst. Growth Des. 2012, 12, 5298–5310. [Google Scholar] [CrossRef]
  16. Quevedo, G.P.; Celis, A.C.; Ordonez, C.V.; Martinez, M.L.O. SBA-type mesoporous materials with cylindrical and spherical structures for the controlled loading and release of ibuprofen. J. Sol-Gel Sci. Technol. 2017, 85, 486–494. [Google Scholar] [CrossRef]
  17. Chen, L.; Hu, E.; Shen, P.; Qian, S.; Heng, W.; Zhang, J.; Gao, Y.; Wei, Y. Development of amorphous solid dispersion sustained-release formulations with polymer composite matrix-regulated stable release plateaus. Pharm. Res. 2024, 41, 1233–1245. [Google Scholar] [CrossRef]
  18. Marks, J.A.; Nichols, B.L.B.; Mosquera-Giraldo, L.I.; Yazdi, S.T.; Taylor, L.S.; Edgar, K.J. 6-Carboxycellulose acetate butyrate: Effectiveness as an amorphous solid dispersion polymer. Mol. Pharm. 2024, 21, 4589–4602. [Google Scholar] [CrossRef]
  19. Tian, Y.; Jacobs, E.; Jones, D.S.; McCoy, C.P.; Wu, H.; Andrews, G.P. The design and development of high drug loading amorphous solid dispersion for hot-melt extrusion platform. Int. J. Pharm. 2020, 586, 119545. [Google Scholar] [CrossRef]
  20. Ziaee, A.; O’Dea, S.; Howard-Hildige, A.; Padrela, L.; Potter, C.; Iqbal, J.; Albadarin, A.B.; Walker, G.; O’Reilly, E.J. Amorphous solid dispersion of ibuprofen: A comparative study on the effect of solution based techniques. Int. J. Pharm. 2019, 572, 118816. [Google Scholar] [CrossRef]
  21. Malfait, B.; Correia, N.T.; Mussi, A.; Paccou, L.; Guinet, Y.; Hédoux, A. Solid-state loading of organic molecular materials within mesoporous silica matrix: Application to ibuprofen. Microporous Mesoporous Mater. 2019, 277, 203–207. [Google Scholar] [CrossRef]
  22. Wan, M.M.; Li, Y.Y.; Yang, T.; Zhang, T.; Sun, X.D.; Zhu, J.H. In situ loading of drugs into mesoporous silica SBA-15. Chem.-Eur. J. 2016, 22, 6294–6301. [Google Scholar] [CrossRef] [PubMed]
  23. Kirkham, J.; Korter, T.M.; Bērziņš, K.R.; McGoverin, C.M.; Gordon, K.C.; Fraser-Miller, S.J. Characterization of variably substituted hydroxyapatites using low-frequency Raman spectroscopy. Cryst. Growth Des. 2023, 23, 5748–5761. [Google Scholar] [CrossRef]
  24. Chen, F.; Yang, C.; Cheng, X.; Fan, Y.; Chen, X.; Ren, S.; Xue, R. Explanation for the selective crystallization from inosine solutions using mid-frequency Raman difference spectra analysis. RSC Adv. 2022, 12, 18301–18306. [Google Scholar] [CrossRef] [PubMed]
  25. Fan, Y.; Liang, C.; Li, Y.; Xiao, W.; Niu, Y.; Jin, H.; Xue, R.; Chen, F. Explanation and prediction of the selective crystallization of boscalid by mid-frequency Raman difference spectroscopy analysis. CrystEngComm 2023, 25, 3548–3555. [Google Scholar] [CrossRef]
  26. Ren, S.; Nian, F.; Chen, X.; Xue, R.; Chen, F. Routes of theophylline monohydrate dehydration process proposed by mid-frequency Raman difference spectra. J. Pharm. Sci. 2023, 112, 2863–2868. [Google Scholar] [CrossRef]
  27. Logacheva, K.; Gergelezhiu, P.; Raksha, E.; Savostina, L.; Arzumanyan, G.; Eresko, A.; Malakhov, S.; Mamatkulov, K.; Ponomareva, O.; Belushkin, A.; et al. Vibrational spectroscopic features of ibuprofen and ketoprofen: IR and Raman spectroscopy combined with DFT calculations. Phys. Part. Nucl. Lett. 2024, 21, 839–842. [Google Scholar] [CrossRef]
  28. Jubert, A.; Legarto, M.L.; Massa, N.E.; Tévez, L.L.; Okulik, N.B. Vibrational and theoretical studies of non-steroidal anti-inflammatory drugs ibuprofen [2-(4-isobutylphenyl)propionic acid]; Naproxen [6-methoxy-α-methyl-2-naphthalene acetic acid] and Tolmetin acids [1-methyl-5-(4-methylbenzoyl)-1H-pyrrole-2-acetic acid]. J. Mol. Struct. 2006, 783, 34–51. [Google Scholar] [CrossRef]
  29. Phaechamud, T.; Tuntarawongsa, S. Transformation of eutectic emulsion to nanosuspension fabricating with solvent evaporation and ultrasonication technique. Int. J. Nanomed. 2016, 11, 2855. [Google Scholar] [CrossRef]
  30. Rashid, A.; White, E.T.; Howes, T.; Litster, J.D.; Marziano, I. Effect of solvent composition and temperature on the solubility of ibuprofen in aqueous tthanol. J. Chem. Eng. Data 2014, 59, 2699–2703. [Google Scholar] [CrossRef]
  31. Zhang, J.; Jiang, Q.; Xu, Z.; Yang, Q.; Hao, G.; Liu, M.; Zeng, Z. Recent progress on crystal nucleation of amorphous solid dispersion. Cryst. Growth Des. 2024, 24, 8655–8666. [Google Scholar] [CrossRef]
  32. Patel, N.G.; Serajuddin, A.T.M. Moisture sorption by polymeric excipients commonly used in amorphous solid dispersion and its effect on glass transition temperature: I. Polyvinylpyrrolidone and related copolymers. Int. J. Pharm. 2022, 616, 121532. [Google Scholar] [CrossRef] [PubMed]
  33. Lapuk, S.; Ponomareva, M.; Ziganshin, M.; Larionov, R.; Mukhametzyanov, T.; Schick, C.; Lounev, I.; Gerasimov, A. Some aspects of the glass transition of polyvinylpyrrolidone depending on the molecular mass. Phys. Chem. Chem. Phys. 2023, 25, 10706–10714. [Google Scholar] [CrossRef] [PubMed]
  34. Constantin, J.G.; Schneider, M.; Corti, H.R. Glass transition temperature of saccharide aqueous solutions estimated with the free volume/percolation model. J. Phys. Chem. B 2016, 120, 5047–5055. [Google Scholar] [CrossRef] [PubMed]
  35. Baghel, S.; Cathcart, H.; O’Reilly, N.J. Polymeric amorphous solid dispersions: A review of amorphization, crystallization, stabilization, solid-state characterization, and aqueous solubilization of biopharmaceutical classification system class II drugs. J. Pharm. Sci. 2016, 105, 2527–2544. [Google Scholar] [CrossRef]
  36. Ojarinta, R.; Saarinen, J.; Strachan, C.J.; Korhonen, O.; Laitinen, R. Preparation and characterization of multi-component tablets containing co-amorphous salts: Combining multimodal non-linear optical imaging with established analytical methods. Eur. J. Pharm. Biopharm. 2018, 132, 112–126. [Google Scholar] [CrossRef]
  37. Guinet, Y.; Paccou, L.; Hédoux, A. Co-amorphous versus deep eutectic solvents formulations for transdermal administration. Pharmaceutics 2023, 15, 1710. [Google Scholar] [CrossRef]
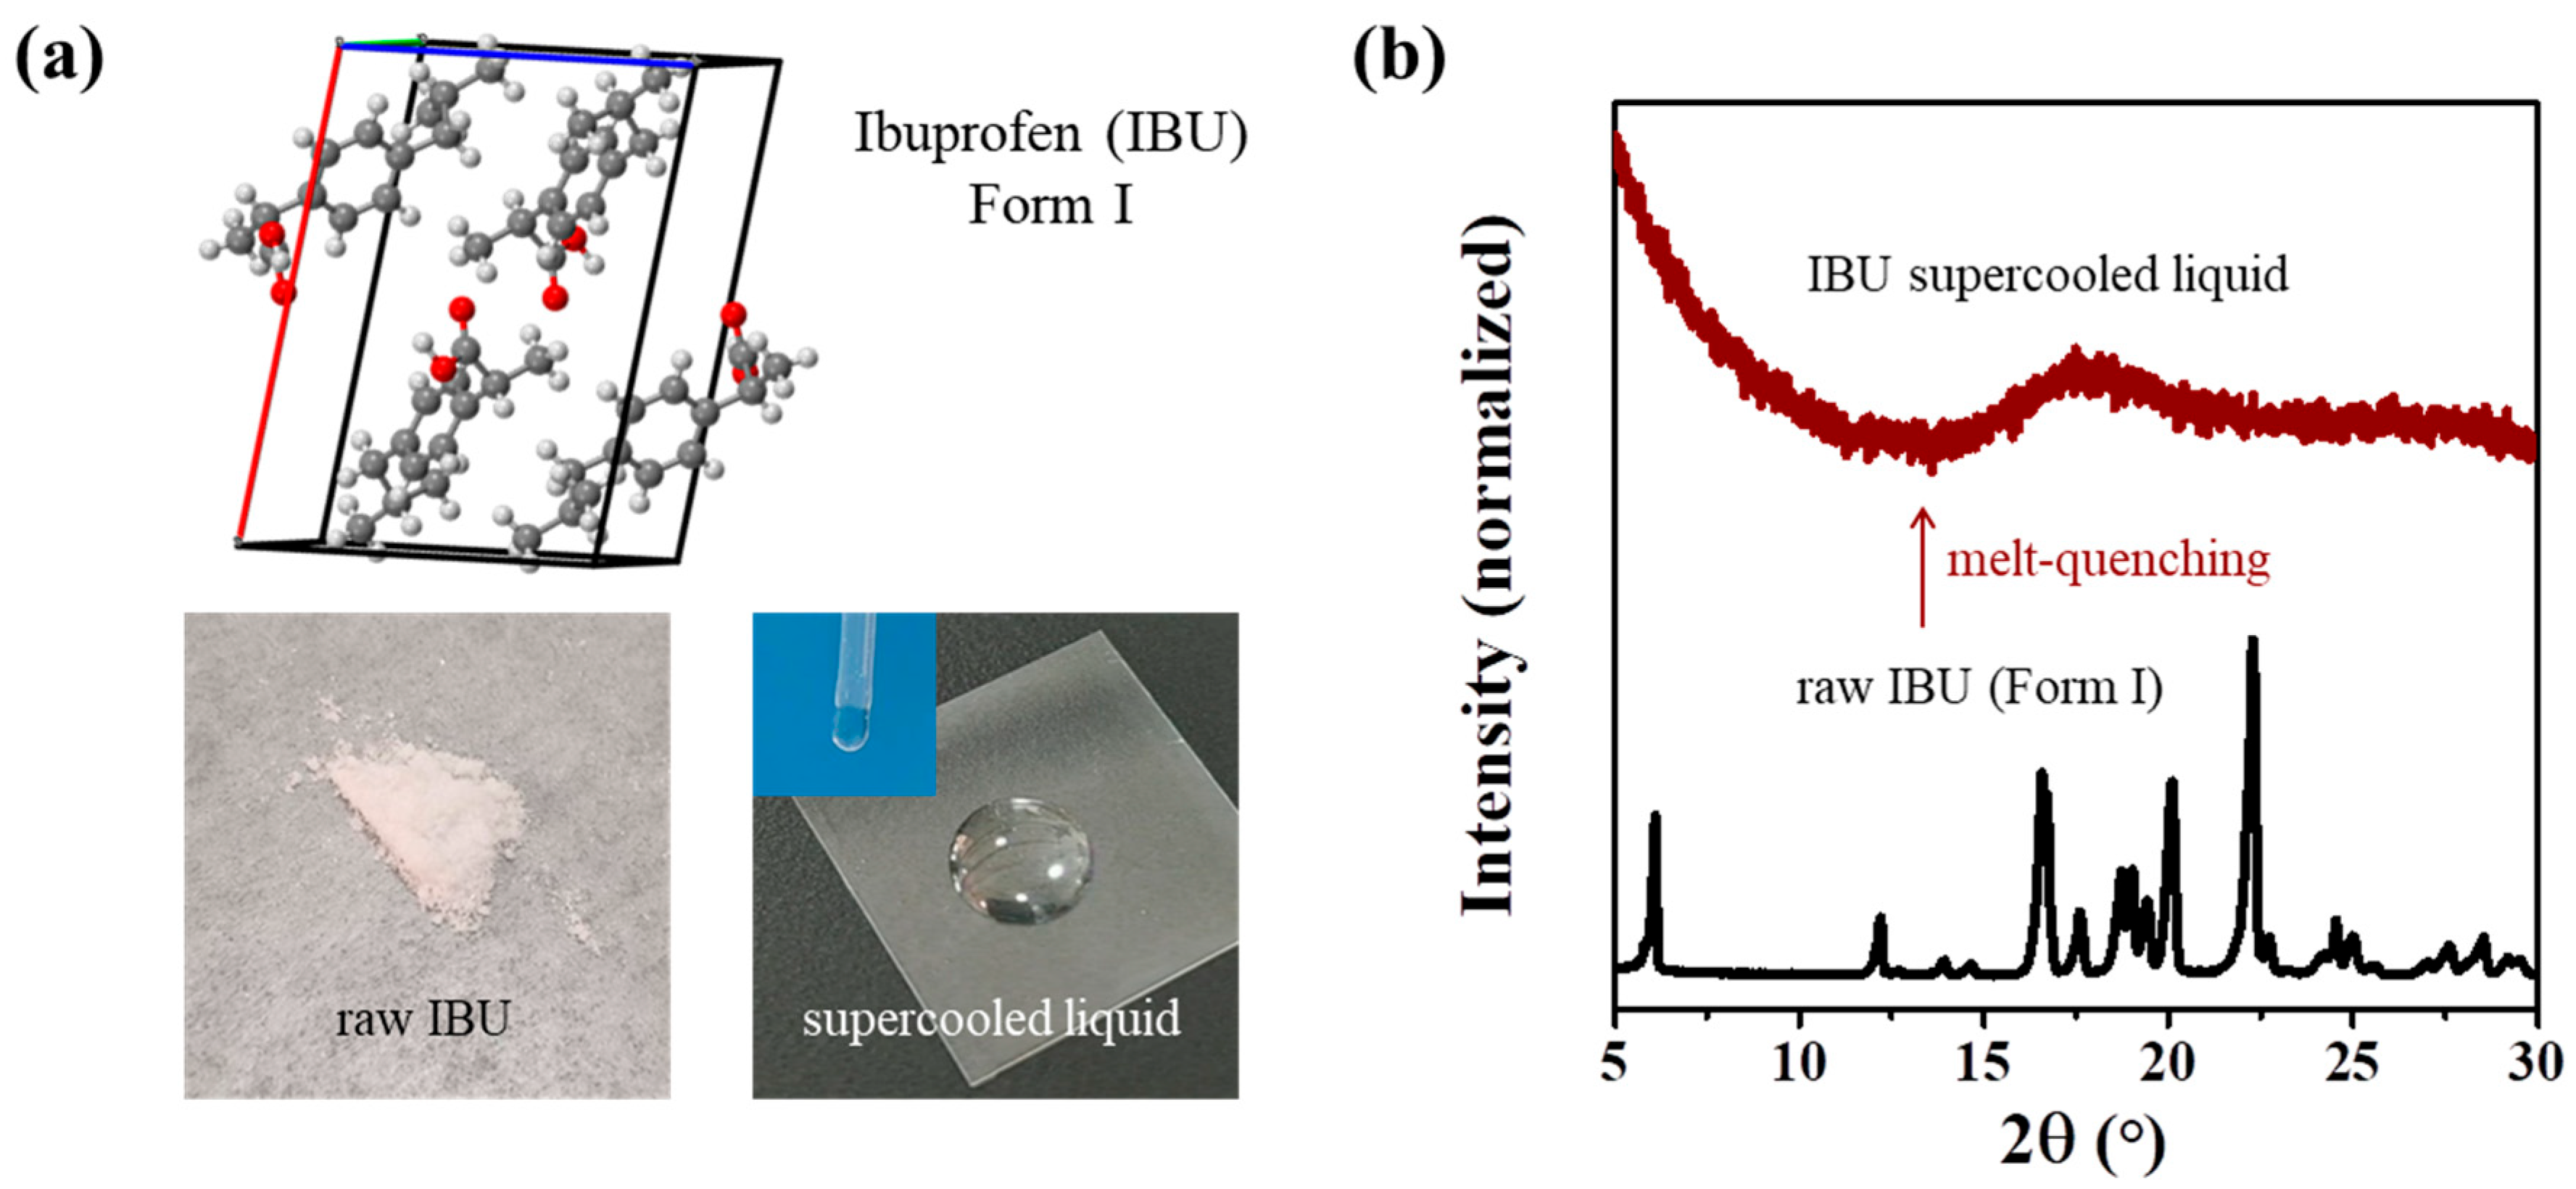
Figure 1. Synthesis of the ibuprofen (IBU) supercooled liquid. (a) Crystal structure of IBU Form I copied from CCDC (top, CCDC number IBPRAC), optical image of raw IBU powder (bottom left) and IBU supercooled liquid on an aluminum substrate (bottom right, inset in pipe at room temperature), (b) powder X-ray diffraction (PXRD) patterns of raw IBU (Form I) and supercooled liquid prepared by the melt-quenching method.
Crystals 14 01037 g001
Figure 2. Structure similarity analysis of the IBU supercooled liquid using spectroscopy. (a) Low-frequency Raman spectra (LFRS, in the range of 50–300 cm−1), (bd) mid-frequency Raman spectra (MFRS, in the range of 300–1800 cm−1) (the normalized bands marked), (d,e) IR and (f) UV-vis spectra of various IBU phases. The MFRS and IR spectra of solute IBU in ethanol, acetone, and ethyl acetate solutions differ from the spectra of IBU solutions with the related solvents, respectively; the normalized bands are marked.
Crystals 14 01037 g002
Figure 3. Formation of the IBU supercooled liquid during the evaporation crystallization process of IBU solutions. (a) PXRD patterns of the evaporation crystallization products of IBU ethanol, acetone, and ethyl acetate solutions (0.1 g·mL−1, 100 μL) at room temperature; LFRS of Form I and the supercooled liquid formed during the evaporation process of IBU (b) ethanol, (c) acetone, and (d) ethyl acetate solutions. Insets are the optical images of the samples used for the Raman test.
Crystals 14 01037 g003
Figure 4. Stability of the IBU supercooled liquid. (a) DSC curves with a heating rate of 1 °C·min−1 of the IBU supercooled liquid and Form I, the total recrystallization time with various (b) temperatures, (c) extra S-IBU, (d) and solvents (water and ethanol).
Crystals 14 01037 g004
Figure 5. IBU formulations (liquid and amorphous solid dispersions) inspired by the IBU supercooled liquid. The PXRD patterns of the product were prepared by (a) melting-quench of the mixtures of raw IBU with PEG 200, and (b) melting-quench of the mixtures of raw IBU with PVP K30. (IBU contents: 25%, 50%, and 75%).
Crystals 14 01037 g005
Figure 6. Dissolution curves of IBU samples at 0 °C; (a) raw IBU Form I and the IBU supercooled liquid; (b) liquid dispersions of IBU (IBU-PEG-0.1 and IBU-PEG-0.25); (c) ASDs of IBU (IBU-PVP-0.1 and IBU-PVP-0.25).
Crystals 14 01037 g006
Table 3. Mid-frequency Raman difference spectra (MFRDS) analysis among IBU Form I, supercooled liquid, solute IBU in ethanol, acetone, and ethyl acetate solutions.
MFRDSa. d. × 103s. d. × 103
Form I with supercooled liquid50 (3)104 (9)
Form I with solute in ethanol57 (5)114 (11)
Form I with solute in acetone64 (4)135 (11)
Form I with solute in ethyl acetate61 (6)120 (12)
Supercooled liquid with solute in ethanol19 (1)32 (1)
Supercooled liquid with solute in acetone26 (1)53 (1)
Supercooled liquid with solute in ethyl acetate26 (1)45 (1)
Solute in ethanol with solute in acetone21 (1)48 (1)
Solute in ethanol with solute in ethyl acetate19 (1)36 (1)
Solute in acetone with solute in ethyl acetate27 (1)53 (1)
Disclaimer/Publisher’s Note: The statements, opinions and data contained in all publications are solely those of the individual author(s) and contributor(s) and not of MDPI and/or the editor(s). MDPI and/or the editor(s) disclaim responsibility for any injury to people or property resulting from any ideas, methods, instructions or products referred to in the content.