
Influence of Y2O3 Concentration on the Optical Properties of Multicomponent Glasses and Glass–Ceramics


Abstract
1. Introduction
2. Materials and Methods
2.1. Samples Preparation
2.2. Characterization Techniques
3. Results
3.1. Y2O3-Containing Glasses
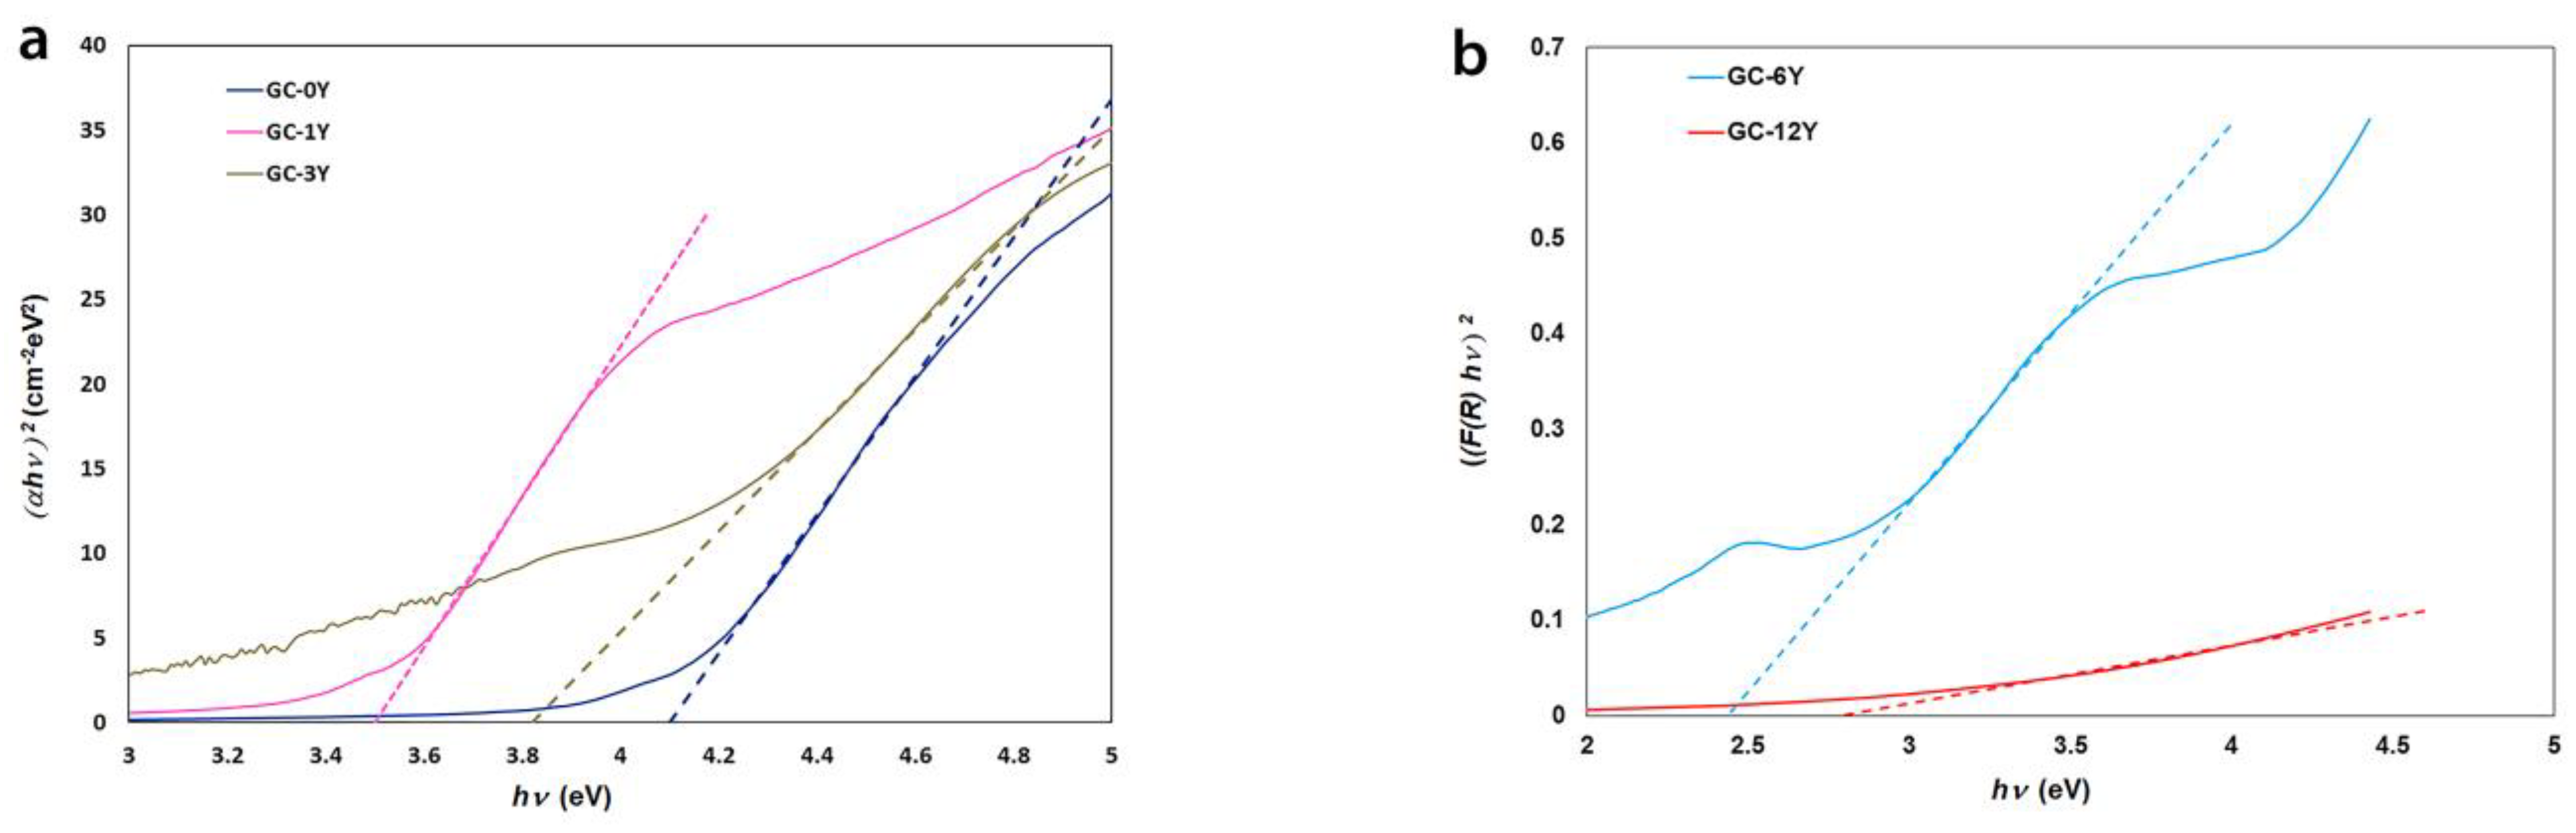
3.2. Y2O3 Glass–Ceramics
4. Discussion
5. Conclusions
Author Contributions
Funding
Data Availability Statement
Acknowledgments
Conflicts of Interest
References
- Zhao, Z.; Yin, Q.; Tian, Y.; Wang, Y.; He, F.; Cao, L.; Wei, L. Effect of Y2O3 on crystallization and mechanical properties of sodium aluminium silicate glass containing ZrO2. Ceram. Int. 2024, 50, 29613–29619. [Google Scholar] [CrossRef]
- Wang, M.; Fang, L.; Li, M.; Li, A.; Zhang, X.; Hu, Y.; Liu, Z.; Dongol, R. Glass transition and crystallization of ZnO-B2O3-SiO2 glass doped with Y2O3. Ceram. Int. 2019, 45, 4351–4359. [Google Scholar] [CrossRef]
- Zheng, W.; Zhang, H.; Wang, Q.; Yuan, J.; Tian, P. Effect of P2O5 on nucleation, crystallization and mechanical properties of Y2O3–Al2O3–SiO2 glasses. Ceram. Int. 2024, 50, 13467–13477. [Google Scholar] [CrossRef]
- Seidel, W.W.S.; Patzig, C.; Rüssel, C. Surface Crystallization of a MgO/Y2O3/SiO2/Al2O3/ZrO2 Glass: Growth of an Oriented β-Y2Si2O7 Layer and Epitaxial ZrO2. Sci. Rep. 2017, 7, 44144. [Google Scholar] [CrossRef]
- Huang, J.; Zhang, J.; Yu, Y.; Bai, H.; Zhang, Z.; Huang, Y. Transparent MgO-Al2O3-SiO2 glass-ceramics prepared with ZrO2 and SnO2 as nucleating agents. J. Non-Cryst. Solids 2022, 588, 121585. [Google Scholar] [CrossRef]
- Li, X.; Wang, Y.; Yang, P.; Han, T.; Shi, X.; He, K.; Zu, C. Effect of Y2O3/La2O3 on structure and mechanical properties of Li2O–Al2O3–SiO2 glass. J. Non-Cryst. Solids 2022, 596, 121847. [Google Scholar] [CrossRef]
- Makishima, A.; Shimohira, T. Alkaline durability of high elastic modulus alumino-silicate glasses containing Y2O3, La2O3 and TiO2. J. Non-Cryst. Solids 1980, 38&39, 661–666. [Google Scholar] [CrossRef]
- Zhao, J.; Lu, Y.; Kang, J.; Qu, Y.; Khater, G.A.; Li, S.; Wang, Y.; Yue, Y. Effect of Y2O3 and La2O3 on structure and dielectric properties of aluminoborosilicate glasses. J. Non-Cryst. Solids 2018, 496, 1–5. [Google Scholar] [CrossRef]
- Samal, S.; Lee, J.; Jeong, D.-Y.; Kim, H. Characterization of thermal conductivity of SiO2–Al2O3–Y2O3 glasses. Thermochim. Acta 2015, 604, 1–6. [Google Scholar] [CrossRef]
- Hou, Y.; Cheng, J.; Kang, J.; Yuan, J.; Cui, J. Structure, glass stability and rheological properties of Na2O-CaO-Al2O3-SiO2 glasses dopped with Y2O3. Ceram. Silikaty 2018, 62, 173–180. [Google Scholar] [CrossRef]
- Liu, S.; Luo, Z.; Zhang, P.; Liu, X.; He, P.; Liang, H.; Lu, A. Luminescence properties and thermal stability of Sm3+-doped Na2O–Y2O3–SiO2–P2O5 transparent glass-ceramics containing Na3YSi2O7 crystals. Opt. Mater. 2022, 134, 113224. [Google Scholar] [CrossRef]
- Kumar, V.; Pandey, O.P.; Singh, K. Effect of A2O3 (A = La, Y, Cr, Al) on thermal and crystallization kinetics of borosilicate glass sealants for solid oxide fuel cells. Ceram. Int. 2010, 36, 1621–1628. [Google Scholar] [CrossRef]
- Tarafder, A.; Molla, A.R.; Karmakar, B. Effects of nano-YAG (Y3Al5O12) crystallization on the structure and photoluminescence properties of Nd3+-doped K2O-SiO2-Y2O3-Al2O3 glasses. Solid State Sci. 2010, 12, 1756–1763. [Google Scholar] [CrossRef]
- El-Rehim, A.F.A.; Zahran, H.Y.; Yahia, I.S.; Abdel Wahab, E.A.; Shaaban, K.S. Structural, elastic moduli, and radiation shielding of SiO2-TiO2-La2O3-Na2O glasses containing Y2O3. J. Mater. Eng. Perform. 2021, 30, 1872–1884. [Google Scholar] [CrossRef]
- Sayyed, M.I.; Abdo, M.A.; Ali, H.E.; Sadeq, M.S. Effect of Y2O3 on the structural, optical and radiation shielding properties of transparent Na-rich borate glass with diluted and fixed Fe2O3. Ceram. Int. 2022, 48, 24310–24318. [Google Scholar] [CrossRef]
- Ariane, K.; Aitana, A.; Chorfa, A.; Rubio, F.; Rubio, J. Kinetic study on the effect of adding P2O5 to the LMAS glass-ceramics. Bol. Soc. Esp. Ceram. Vidrio 2020, 59, 239–250. [Google Scholar] [CrossRef]
- Alekseev, R.O.; Romanov, N.A.; Savinkov, V.I.; Klimenko, N.N.; Sigaev, V.N. Multicomponent optical glasses with high refractive index. Glass Ceram. 2021, 78, 3–7. [Google Scholar] [CrossRef]
- Beniaiche, A.; Tamayo, A.; Belkhir, N.; Rubio, F.; Chorfa, A.; Rubio, J. Effect of Y2O3 Concentration on the Surface and Bulk Crystallization of Multicomponent Silicate Glasses. Crystals 2024, 14, 214. [Google Scholar] [CrossRef]
- Edney, C.V.; Condrate, R.A.; Crandall, W.B.; Washburn, M.E. Infrared and Raman spectra of Y2O3-SiO2 glasses prepared by sol-gel processes. J. Mater. Sci. Lett. 1987, 6, 308–312. [Google Scholar] [CrossRef]
- Negm, H.H.; Abdo, M.A.; Sadeq, M.S. Impact of Y2O3 on the structural, linear and nonlinear optical parameters of Na2O-Fe2O3-B2O3 glass. Opt. Int. J. Light Elect. Opt. 2023, 283, 170923. [Google Scholar] [CrossRef]
- Mahdy, E.A.; Ibrahim, S. Influence of Y2O3 on the structure and properties of calcium magnesium aluminosilicate glasses. J. Mol. Struct. 2012, 1027, 81–86. [Google Scholar] [CrossRef]
- Singh, S.; Kalia, G.; Singh, K. Effect of intermediate oxide (Y2O3) on thermal, structural and optical properties of lithium boro-silicate glasses. J. Mol. Struct. 2015, 1806, 239–245. [Google Scholar] [CrossRef]
- Jiusti, J.; Zanotto, E.D.; Feller, S.A.; Austin, H.J.; Detar, H.M.; Bishop, I.; Manzani, D.; Nakatsuka, Y.; Watanabe, Y.; Inoue, H. Effect of network formers and modifiers on the crystallization resistance of oxide glasses. J. Non-Cryst. Solids 2020, 550, 120359. [Google Scholar] [CrossRef]
- Taallah, H.; Chorfa, A.; Rubio, F.; Rubio, J.; Tamayo, A. Investigating the effect of WO3 on the crystallization behavior of SiO2–B2O3–Al2O3–Na2O–CaO–ZnO high VIS-NIR reflecting glazes. Ceram. Int. 2021, 47, 26789–26799. [Google Scholar] [CrossRef]
- Kissinger, H.E. Variation of Peak Temperature with Heating Rate in Differential Thermal Analysis. J. Res. Natl. Bur. Stand. 1956, 57, 217–221. [Google Scholar] [CrossRef]
- Chen, L.; Long, Y.; Zhou, M.; Wang, H. Structure and Crystallization of High-Calcium, CMAS Glass Ceramics Synthesized with a High Content of Slag. Materials 2022, 15, 657. [Google Scholar] [CrossRef]
- Zhang, P.; Chen, Z.; Li, B. Effect of BaO on crystallization, sintering, and properties of MgO-Al2O3-SiO2 glass–ceramics. J. Mater. Sci. Mater. Electon. 2022, 33, 2846–2854. [Google Scholar] [CrossRef]
- Mu, N.; Chen, D.; Li, B. Influence of Zn/Ba ratio on crystallization, sintering behaviour and properties of CaO-Al2O3-SiO2 glass-ceramics. J. Non-Cryst. Solids 2023, 622, 122662. [Google Scholar] [CrossRef]
- Kaur, G.; Kumar, M.; Arora, A.; Pandey, O.P.; Singh, K. Influence of Y2O3 on structural and optical properties of SiO2–BaO–ZnO–xB2O3–(10−x) Y2O3 glasses and glass ceramics. J. Non-Cryst. Solids 2011, 357, 858–863. [Google Scholar] [CrossRef]
- Chaudhry, M.A.; Altaf, M. Optical absorption studies of sodium cadmium phosphate glasses. Mater. Lett. 1998, 34, 213–216. [Google Scholar] [CrossRef]
- Mott, N.F.; Davis, E.A. Electronic Processes in Non-Crystalline Materials; Oxford University Press: Oxford, UK, 1979. [Google Scholar]
- Morales, E.E.; Mora, E.S.; Pal, U. Use of diffuse reflectance spectroscopy for optical characterization of un-supported nanostructures. Rev. Mex. Fís. 2007, 53, 18–22. [Google Scholar]
- Rodríguez Chialanza, M.; Faccio, R.; Bentos Pereira, H.; Marotti, R. The non-direct band gap in borate glasses; a brief discussion on analysis methodologies and its interpretation. Opt. Mater. 2022, 123, 111890. [Google Scholar] [CrossRef]
- Studenyak, I.; Kranjčec, M.; Kurik, M. Urbach Rule in Solid State Physics. Int. J. Opt. Appl. 2014, 4, 76–83. [Google Scholar] [CrossRef]
- Ticha, H.; Tichy, L. Semiemprirical relation between non-linear susceptibility (refractive index), linear refractive index and optical gap and its application to amorphous chalcogenides. J. Optoelectron. Adv. Mater. 2002, 4, 381–386. [Google Scholar]
- Dimitrov, V.; Komatsu, T. An interpretation of optical properties of oxides and oxide glasses in terms of the electronic ion polarizability and average single bond strength. J. Univ. Chem. Technol. Metall. 2010, 45, 219–250. [Google Scholar]
- Morshidya, H.Y.; Sadeq, M.S.; Mohamed, A.R.; EL-Okr, M.M. The role of CuCl2 in tuning the physical, structural and optical properties of some Al2O3–B2O3 glasses. J. Non-Cryst. Solids 2020, 528, 119749. [Google Scholar] [CrossRef]
- El-Daly, A.A.; Abdo, M.A.; Bakr, H.A.; Sadeq, M.S. Structure, stability, and optical parameters of cobalt zinc borate glasses. Ceram. Int. 2021, 47, 31470–31475. [Google Scholar] [CrossRef]

| Oxide | AK3A-0Y | AK3A-1Y | AK3A-3Y | AK3A-6Y | AK3A-12Y |
|---|---|---|---|---|---|
| SiO2 | 42.70 | 40.42 | 38.13 | 32.72 | 28.80 |
| Y2O3 | 0 | 0.83 | 2.72 | 5.53 | 11.12 |
| Al2O3 | 2.15 | 2.78 | 2.52 | 2.97 | 2.71 |
| ZrO2 | 3.10 | 3.31 | 3.01 | 3.57 | 3.40 |
| Li2O | 0.32 | 0.73 | 0.24 | 0.76 | 0.24 |
| Na2O | 1.28 | 1.53 | 0.90 | 1.54 | 2.01 |
| K2O | 1.14 | 1.33 | 1.20 | 1.56 | 1.21 |
| MgO | 7.91 | 8.43 | 8.31 | 8.82 | 9.21 |
| CaO | 15.20 | 14.91 | 16.60 | 16.50 | 17.02 |
| BaO | 19.61 | 19.7 | 19.40 | 19.6 | 19.40 |
| ZnO | 3.29 | 3.35 | 2.82 | 3.42 | 2.21 |
| SnO2 | 3.20 | 3.17 | 3.40 | 2.62 | 2.30 |
| Tg (°C) | Tx (°C) | Tp1 (°C) | Tp2 (°C) | Tl (°C) | ΔT1 (°C) | β | KH | ΔT | |
|---|---|---|---|---|---|---|---|---|---|
| AK3A-0Y | 620 | 858 | 821 | 907 | 1092 | 201 | 9.72 | 1.02 | 0.50 |
| AK3A-1Y | 580 | 811 | 834 | 875 | 1066 | 254 | 7.23 | 0.91 | 0.48 |
| AK3A-3Y | 581 | 821 | 851 | 852 | 1028 | 270 | 11.13 | 1.13 | 0.54 |
| AK3A-6Y | 602 | 744 | 787 | 846 | 1039 | 185 | 5.15 | 0.48 | 0.32 |
| AK3A-12Y | 609 | 700 | 757 | 820 | 1032 | 148 | 3.87 | 0.27 | 0.22 |
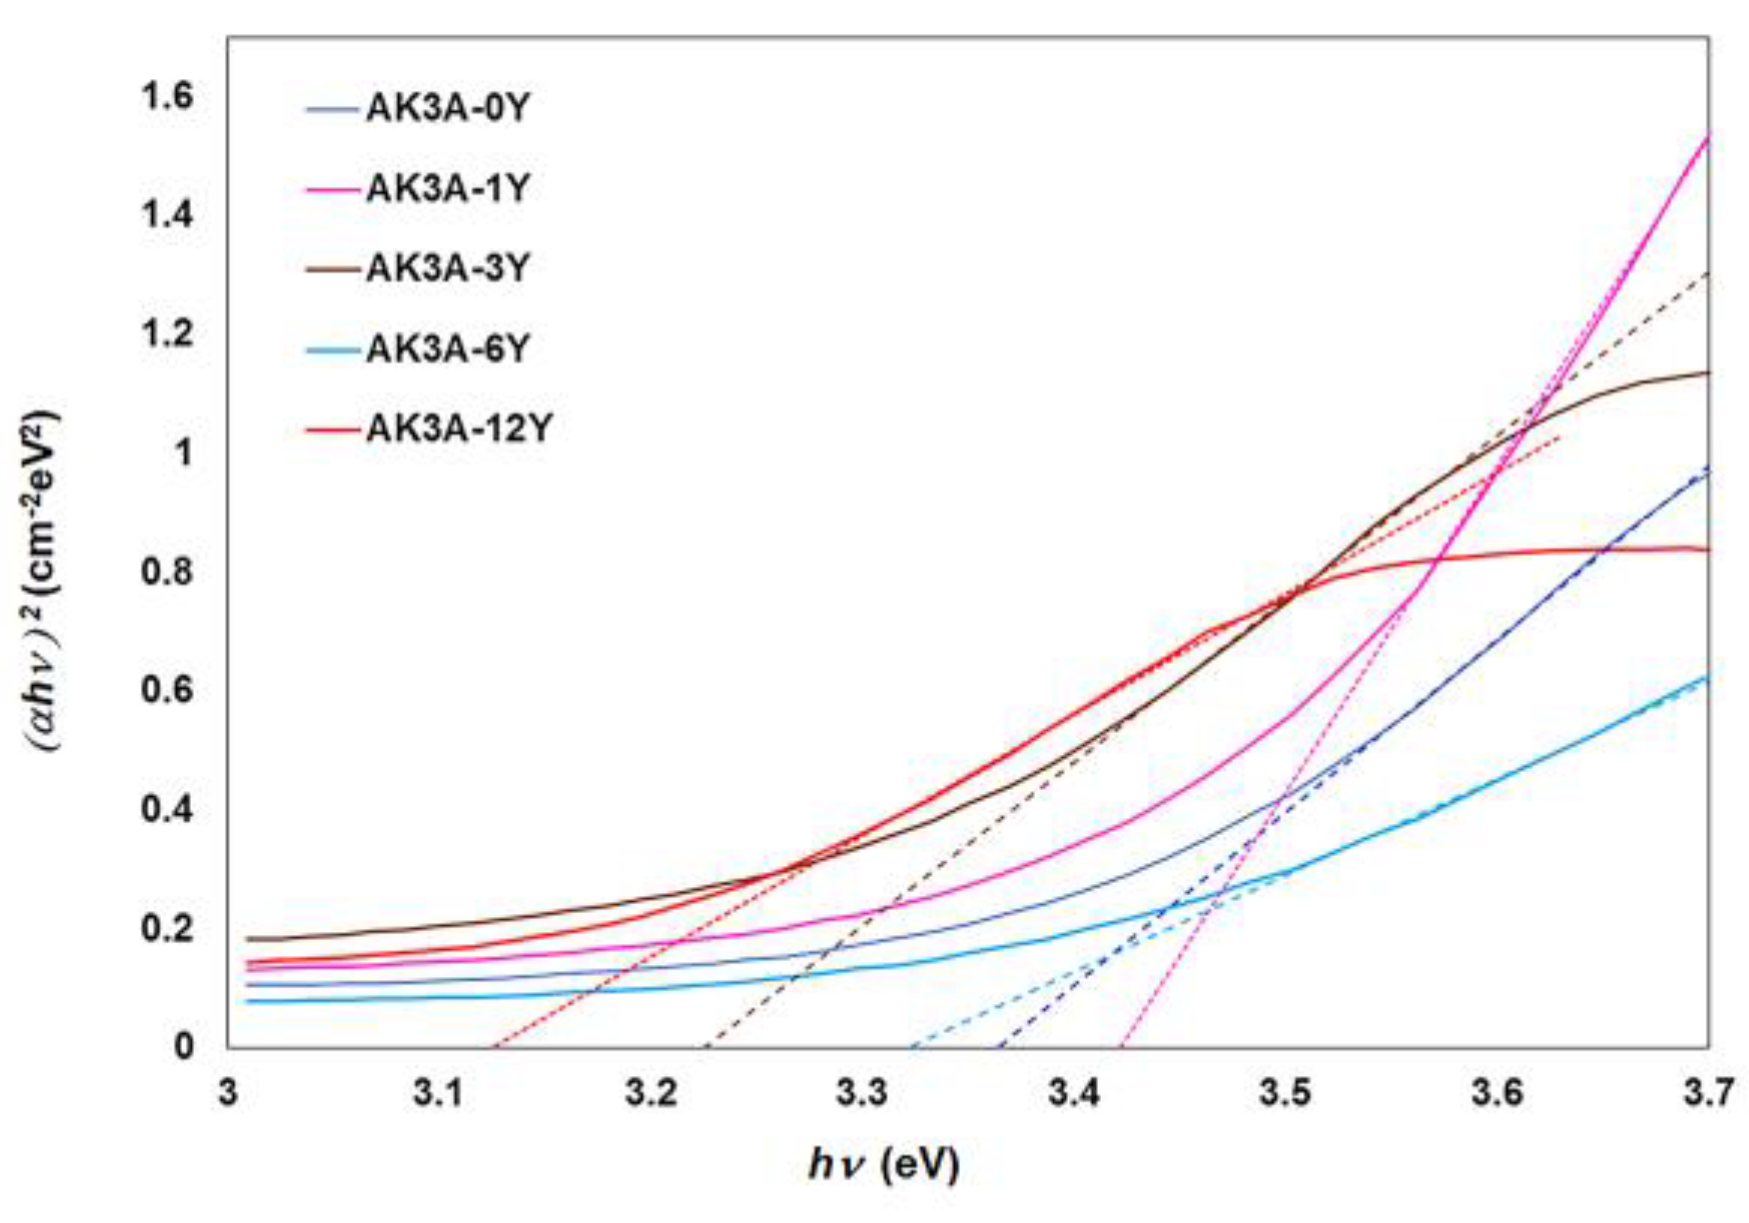
| Glasses | Eg (eV) | Eu (eV) | Cut-Off (nm) | Glass–Ceramics | Eg (eV) | Eu (eV) | Cut-Off (nm) |
|---|---|---|---|---|---|---|---|
| AK3A-0Y | 3.36 | 0.20 | 340 | GC-0Y | 4.10 | 0.65 | 280 |
| AK3A-1Y | 3.43 | 0.20 | 340 | GC-1Y | 3.39 | 0.50 | 324 |
| AK3A-3Y | 3.23 | 0.25 | 348 | GC-3Y | 3.73 | 0.21 | 251 |
| AK3A-6Y | 3.32 | 0.24 | 334 | GC-6Y | 2.44 | 0.26 | 294 |
| AK3A-12Y | 3.12 | 0.21 | 358 | GC-12Y | 2.78 | 0.34 | 303 |
| Glasses | n0 | n2 (×10−11 esu) | M | Glass–Ceramics | n0 | n2 (×10−11 esu) | M |
|---|---|---|---|---|---|---|---|
| AK3A-0Y | 2.32 | 0.99 | 0.41 | GC-0Y | 2.19 | 0.45 | 0.45 |
| AK3A-1Y | 2.31 | 0.91 | 0.41 | GC-1Y | 2.31 | 0.95 | 0.41 |
| AK3A-3Y | 2.35 | 1.16 | 0.40 | GC-3Y | 2.25 | 0.65 | 0.43 |
| AK3A-6Y | 2.33 | 1.04 | 0.41 | GC-6Y | 2.55 | 3.55 | 0.35 |
| AK3A-12Y | 2.37 | 1.33 | 0.39 | GC-12Y | 2.45 | 2.11 | 0.37 |
Disclaimer/Publisher’s Note: The statements, opinions and data contained in all publications are solely those of the individual author(s) and contributor(s) and not of MDPI and/or the editor(s). MDPI and/or the editor(s) disclaim responsibility for any injury to people or property resulting from any ideas, methods, instructions or products referred to in the content. |
© 2024 by the authors. Licensee MDPI, Basel, Switzerland. This article is an open access article distributed under the terms and conditions of the Creative Commons Attribution (CC BY) license (https://creativecommons.org/licenses/by/4.0/).
Share and Cite
Beniaiche, A.; Belkhir, N.; Pérez-Román, B.; Rubio, J.; Rubio, F. Influence of Y2O3 Concentration on the Optical Properties of Multicomponent Glasses and Glass–Ceramics. Crystals 2024, 14, 970. https://doi.org/10.3390/cryst14110970
Beniaiche A, Belkhir N, Pérez-Román B, Rubio J, Rubio F. Influence of Y2O3 Concentration on the Optical Properties of Multicomponent Glasses and Glass–Ceramics. Crystals. 2024; 14(11):970. https://doi.org/10.3390/cryst14110970
Chicago/Turabian StyleBeniaiche, Akram, Nabil Belkhir, Berta Pérez-Román, Juan Rubio, and Fausto Rubio. 2024. "Influence of Y2O3 Concentration on the Optical Properties of Multicomponent Glasses and Glass–Ceramics" Crystals 14, no. 11: 970. https://doi.org/10.3390/cryst14110970
APA StyleBeniaiche, A., Belkhir, N., Pérez-Román, B., Rubio, J., & Rubio, F. (2024). Influence of Y2O3 Concentration on the Optical Properties of Multicomponent Glasses and Glass–Ceramics. Crystals, 14(11), 970. https://doi.org/10.3390/cryst14110970