Article

Optimization of Magnetic Field-Assisted Laser Cladding Based on Hierarchical Analysis and Gray Correlation Method

1
School of Mechanical and Electrical Engineering, Shandong Jianzhu University, Jinan 250101, China
2
Lu Feng Registered Safety Engineers Office (Beijing) Co., Ltd., Beijing 100062, China
3
Haihui Group Co., Ltd., Rizhao 276500, China
*
Author to whom correspondence should be addressed.
Crystals 2024, 14(11), 927; https://doi.org/10.3390/cryst14110927
Submission received: 10 October 2024 / Revised: 17 October 2024 / Accepted: 23 October 2024 / Published: 26 October 2024
(This article belongs to the Special Issue Microstructure and Properties of Metals and Alloys)

Abstract

:
Process parameters directly affect the quality of laser cladding. In this study, magnetic field-assisted laser cladding experiments were carried out on the surface of 300 M ultra-high-strength steel by setting laser energy density, magnetic field strength, and frequency as processing parameters. The optimization of laser cladding process parameters was investigated based on evaluating the quality of the laser cladding layer through hierarchical analysis and gray correlation analysis. Based on orthogonal test data, the correlation coefficients of the process parameters with the single objective function and the correlation degree of the multi-objective function were calculated by using the gray theory. Then the comprehensive objective optimization was carried out according to the gray correlation degree. The optimization problem with multiple process objectives was transformed into a single gray correlation degree optimization method to realize the optimization of process objectives and obtain the optimal combination of process parameters. The validation experiments indicate that the quality of the laser cladding layer can be greatly improved by employing optimal process parameters. The optimized laser cladding layer shows a reduced microstructure size and enhanced wear resistance, indicating the effectiveness of the optimization approach.

1. Introduction

Laser cladding technology is a new type of surface modification technology. By preparing a high-performance surface alloy layer on metal materials or partially repairing the surface of parts, it can obtain the performance required for workpiece service, save materials, and reduce energy consumption [1]. The advantages of laser cladding technology determine its application advantages in the industrial field. Studies have demonstrated that the laser cladding layer enhances the wear resistance of the workpiece and exhibits excellent operational performance. For example, Li et al. [2] prepared multiple overlapping Fe-based WC composite coatings on 16 Mn steel substrates and measured the wear performance of the cladding layer under different test parameters. In the wear test, the load of the friction test was set to 50 N, the speed to 50 mm/s, and the friction time to 1 h. The results show that the wear rate of the laser cladding layers was 50% less than that of the substrate. Yang et al. [3] prepared a TiCN/Ti coating on the surface of a titanium alloy, and the hardness of the cladding layer was higher than that of the substrate. A MG-2000 disc pin wear tester was used to carry out wear resistance experiments at room temperature with a linear speed of 0.314 m/s and loads of 10, 20, 30, and 40 N. The results indicate that the wear resistance of the cladding layers had also been greatly improved. Laser cladding layers have the advantages of small repair deformation, high speed, high quality, and low pollution and are widely used in industrial fields such as automobiles and ships [4].
The process parameters of laser cladding technology are crucial for improving the quality and reliability of the repaired workpiece; if the process parameters are unreasonable, it will lead to different degrees of defects in the workpiece, resulting in a significant reduction in the quality of the workpiece, leading to the workpiece being directly scrapped [5]. The control of laser cladding layer quality is a crucial factor in the widespread adoption and application of laser cladding technology. Mismatch of laser cladding process parameters is the main cause of defects in laser-cladded layers such as pores, cracks, and surface unevenness. This is due to the complex mapping relationship between process parameters and the quality of the laser cladding layer, which involves the coupling of the three phases of light, powder, and gas [6]. Optimization of the laser cladding process parameters is essential to achieve high-quality cladding.
At present, research on laser cladding process optimization mainly uses experiments or numerical simulation methods to study the influence of different process parameters on the laser cladding layer and find the best combination of process parameters to improve the density, uniformity, and stability of the cladding layer [7,8]. For example, Fan et al. used the laser cladding method to deposit a Co-based composite coating with a WC content of 40 wt.% on the surface of 15MnNi4Mo steel [9]. By designing single-factor experiments, the changes in the geometric dimensions, dilution rate, and hardness of the coating as various factors were studied. The optimal parameters for the laser cladding process were determined through an orthogonal experiment. The results demonstrate that increasing the laser power leads to an increase in the width of the coating, depth of the melt pool, and dilution rate, while the height of the coating remains relatively unchanged. Conversely, increasing the scanning speed results in a decrease in the height of the coating and depth of the molten pool, as well as a slight decrease in the width of the coating. To optimize the processing technology, it is necessary to continuously adjust the process parameters for different laser cladding materials, and the universality is poor. Wu et al. used a laser cladding process to deposit Ni60A-25% WC powder on a 42CrMo alloy structural steel substrate to form a composite coating with high microhardness [10]. Response surface methodology was used to optimize the process parameters. The results demonstrate that the dilution rate of the Ni60A-25% laser cladding layer is most affected by laser processing parameters. The mechanical properties of the alloy are improved by producing a large amount of martensite microstructure under optimal process conditions.
In summary, the rapid solidification during the laser cladding process, as well as the mixing uniformity and particle size distribution of the powder, can easily lead to the uneven microstructure of the coatings and phenomena such as cracks, non-equilibrium phases, and amorphous states, which can affect the mechanical and wear-resistant properties of the coatings [11]. Most of the current literature focuses on understanding the relationship between the final microstructure and properties of materials and solidification conditions. The complex metallurgical phenomena during deposition are closely related to the material and the process, and the quantitative relationship between the process parameters and the microstructure of the laser cladding layer is not sufficiently deep and comprehensive. For example, to improve the performance of laser cladding layers, research on using magnetic field-assisted methods to prepare laser cladding layers has attracted the attention of many scholars [12,13,14]. However, there has been no in-depth study on the microstructure and performance characteristics of laser cladding layers under multi-magnetic field process parameters.
Since many factors affect the laser cladding process, it is difficult to accurately establish the relationship between process parameters and the quality of the laser cladding layer. Choosing a reasonable match of process parameters is the key to ensuring that the cladding layer is dense, crack-free, and has good performance [15]. This paper uses laser energy density, magnetic frequency, and magnetic intensity as independent variables, based on orthogonal test data, and evaluates the quality of the workpiece by using the hierarchical analysis–gray correlation method. Taking crack rate, hardness, and wear volume of the cladding layer as evaluation indicators, the gray theory is used to calculate the correlation coefficient of the process parameters to the single objective function and the correlation degree to the multi-objective function, and then the synthesis is carried out based on the gray correlation degree. This paper intends to convert the optimization problem of multiple process objectives into a single gray correlation optimization problem, thereby achieving the optimization of the process objectives, obtaining the optimal combination of process parameters, and providing theoretical support for the further industrial application of laser cladding technology.

2. Experiments and Methods

2.1. Material

A 300 M ultra-high hardness alloy steel (Ni 1.7 wt.%, Si 1.7 wt.%, Cr 0.9 wt.%, Mn 0.6 wt.%, Ti 0.4 wt.%, Mo 0.5 wt.%, Fe Bal.) was used as the substrate with a size of 80 mm × 30 mm × 5 mm. A cobalt-based alloy powder with a chemical composition of Co 51.0 wt.%, Cr 5.0 wt.%, B 6.0 wt.%, Fe 37.0 wt.%, and C 1 wt.% was used as the laser cladding powder, with a particle size between 25 and 106 μm, which was also dried before laser cladding experiments. The drying temperature was set to 120 °C, and the drying time was 1 h. The chemical composition of the laser cladding material is shown in Table 1.

2.2. Modeling and Experimental Design

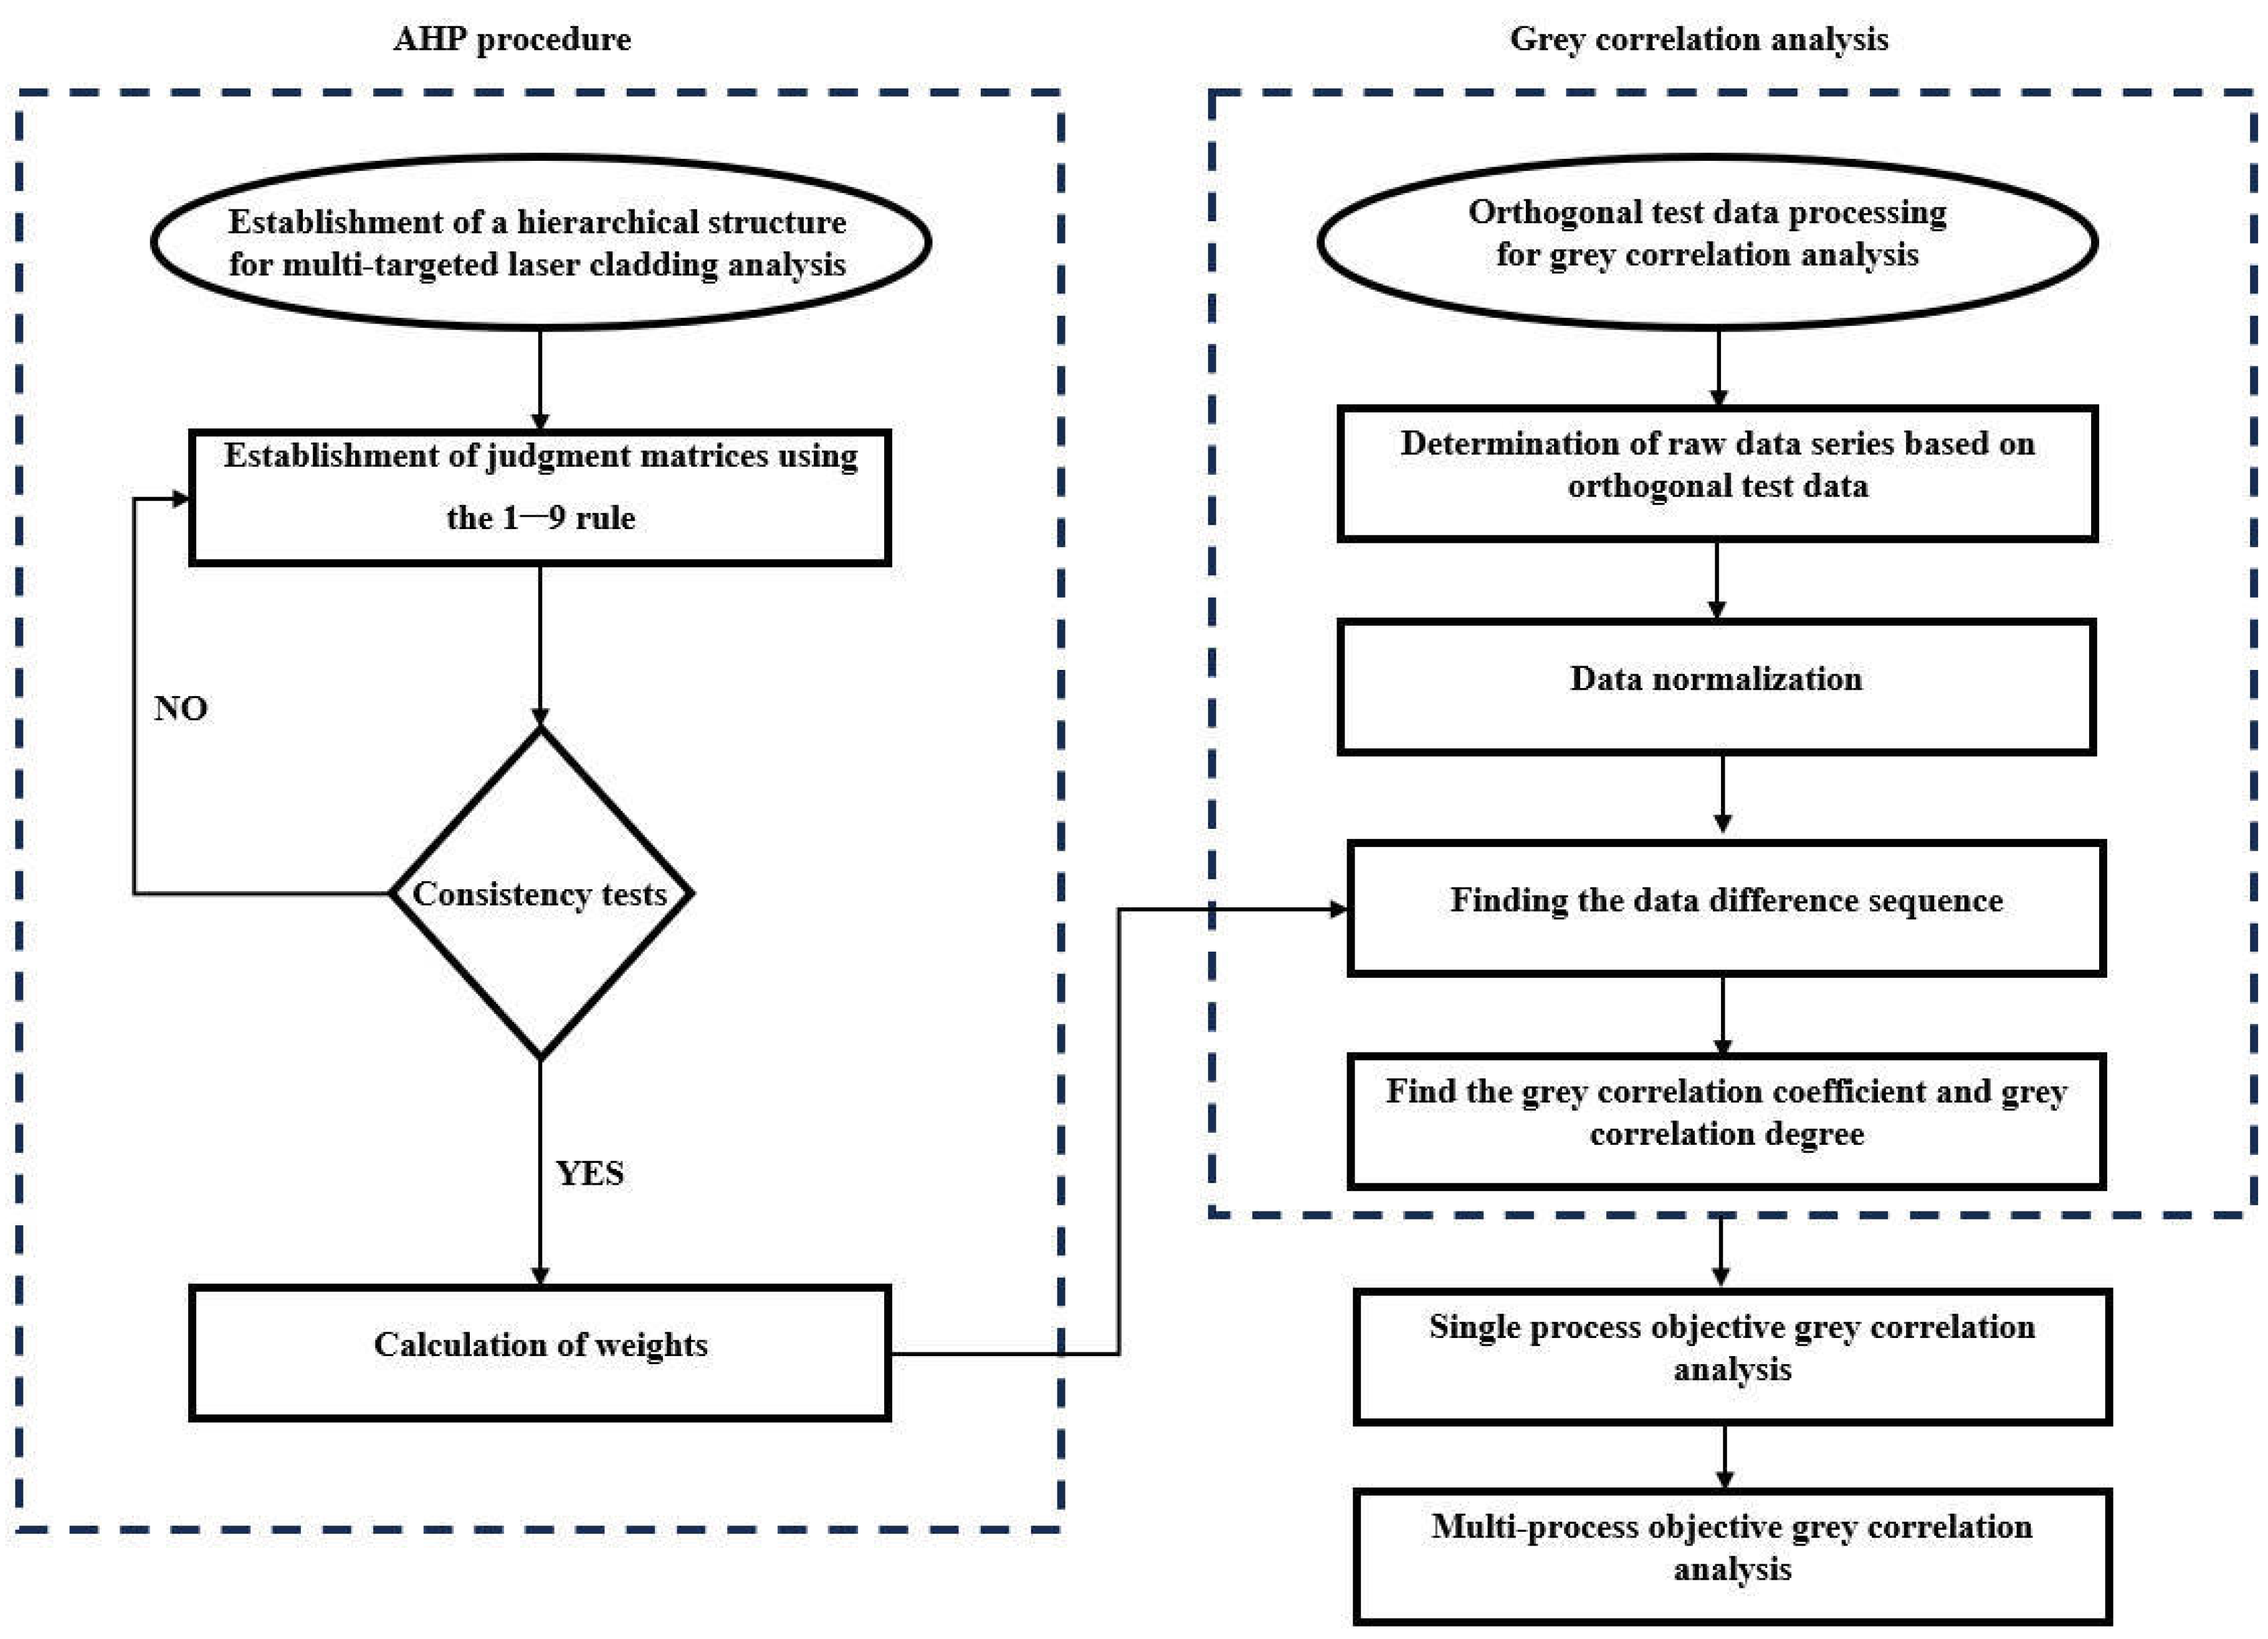
In this study, the laser energy density, alternating magnetic field intensity, and alternating magnetic field frequency were used as independent variables, and the quality of laser cladding was evaluated based on gray correlation analysis with orthogonal test data. Taking the crack rate, hardness, and friction coefficient of the deposited layer as evaluation indexes, the correlation coefficients of the process parameters to the single-objective function and the correlation degree of the multi-objective function were calculated by using the gray theory, and then the comprehensive objective optimization was carried out according to the gray correlation degree; the optimization problem of multiple process objectives was converted into the optimization problem of a single gray correlation degree to achieve the optimization of the process objectives and obtain the optimal process parameter combinations. Figure 1 shows the flow chart of the hierarchical analysis–gray correlation method. Multi-process objective gray correlation: Multi-objective optimization is a type of complex optimization method in reality. The improvement of one objective performance in multi-objective optimization may lead to a change in the performance of another or more objectives. Multi-objective optimization is a dynamic development process in which multiple objectives compromise with each other. Generally, it is impossible to obtain a solution that makes multiple objectives reach the optimal state. Only a set of optimal solutions that compromise with each other can be obtained [16]. In multi-objective optimization, choosing a reasonable optimization method is a key factor affecting the performance of multi-objective algorithms [17]. Gray correlation analysis is a simple and effective method for dealing with uncertain or partially insufficient information problems. The gray correlation degree in gray correlation analysis is an indicator to measure whether the dynamic development sequence is closely connected [18]. It is suitable for the analysis of the dynamic system development process. The gray correlation degree is used to determine the complex relationship between the test sample behavior sequences. This approach is used in decision-making, helping to identify the best process configurations and parameters based on multiple criteria.
Multi-targeted laser cladding analysis involves analyzing the effects of laser cladding on multiple targets or objectives, such as microstructural and mechanical properties. The analysis can include the evaluation of different laser parameters to achieve desired outcomes. Integrating multi-process objective gray correlation with multi-targeted laser cladding analysis can lead to enhanced decision-making and optimized processes in manufacturing.
In the laser cladding process, laser power (P), laser scanning speed (V), and laser spot diameter (D) are the main laser processing parameters, and to facilitate the experimental design and data statistics, the laser energy density is used in this study as an index to measure the laser processing parameters. Different laser energy densities can be obtained by changing the laser processing parameters. The laser energy density formula is shown below [19]:
E = P D V
In this experiment, an alternating magnetic field is used to assist in the shaping of the laser cladding layer, and the magnetic field intensity and magnetic field frequency are chosen as the parameters of the alternating magnetic field. The orthogonal table of L9(33) was used for the orthogonal test, and three levels were taken for each variable, as shown in Table 1. The crack rate, hardness, and wear volume of the laser cladding layer were taken as the evaluation indexes. The orthogonal experimental design of laser cladding process parameters is shown in Table 2.

2.3. Experimental Process

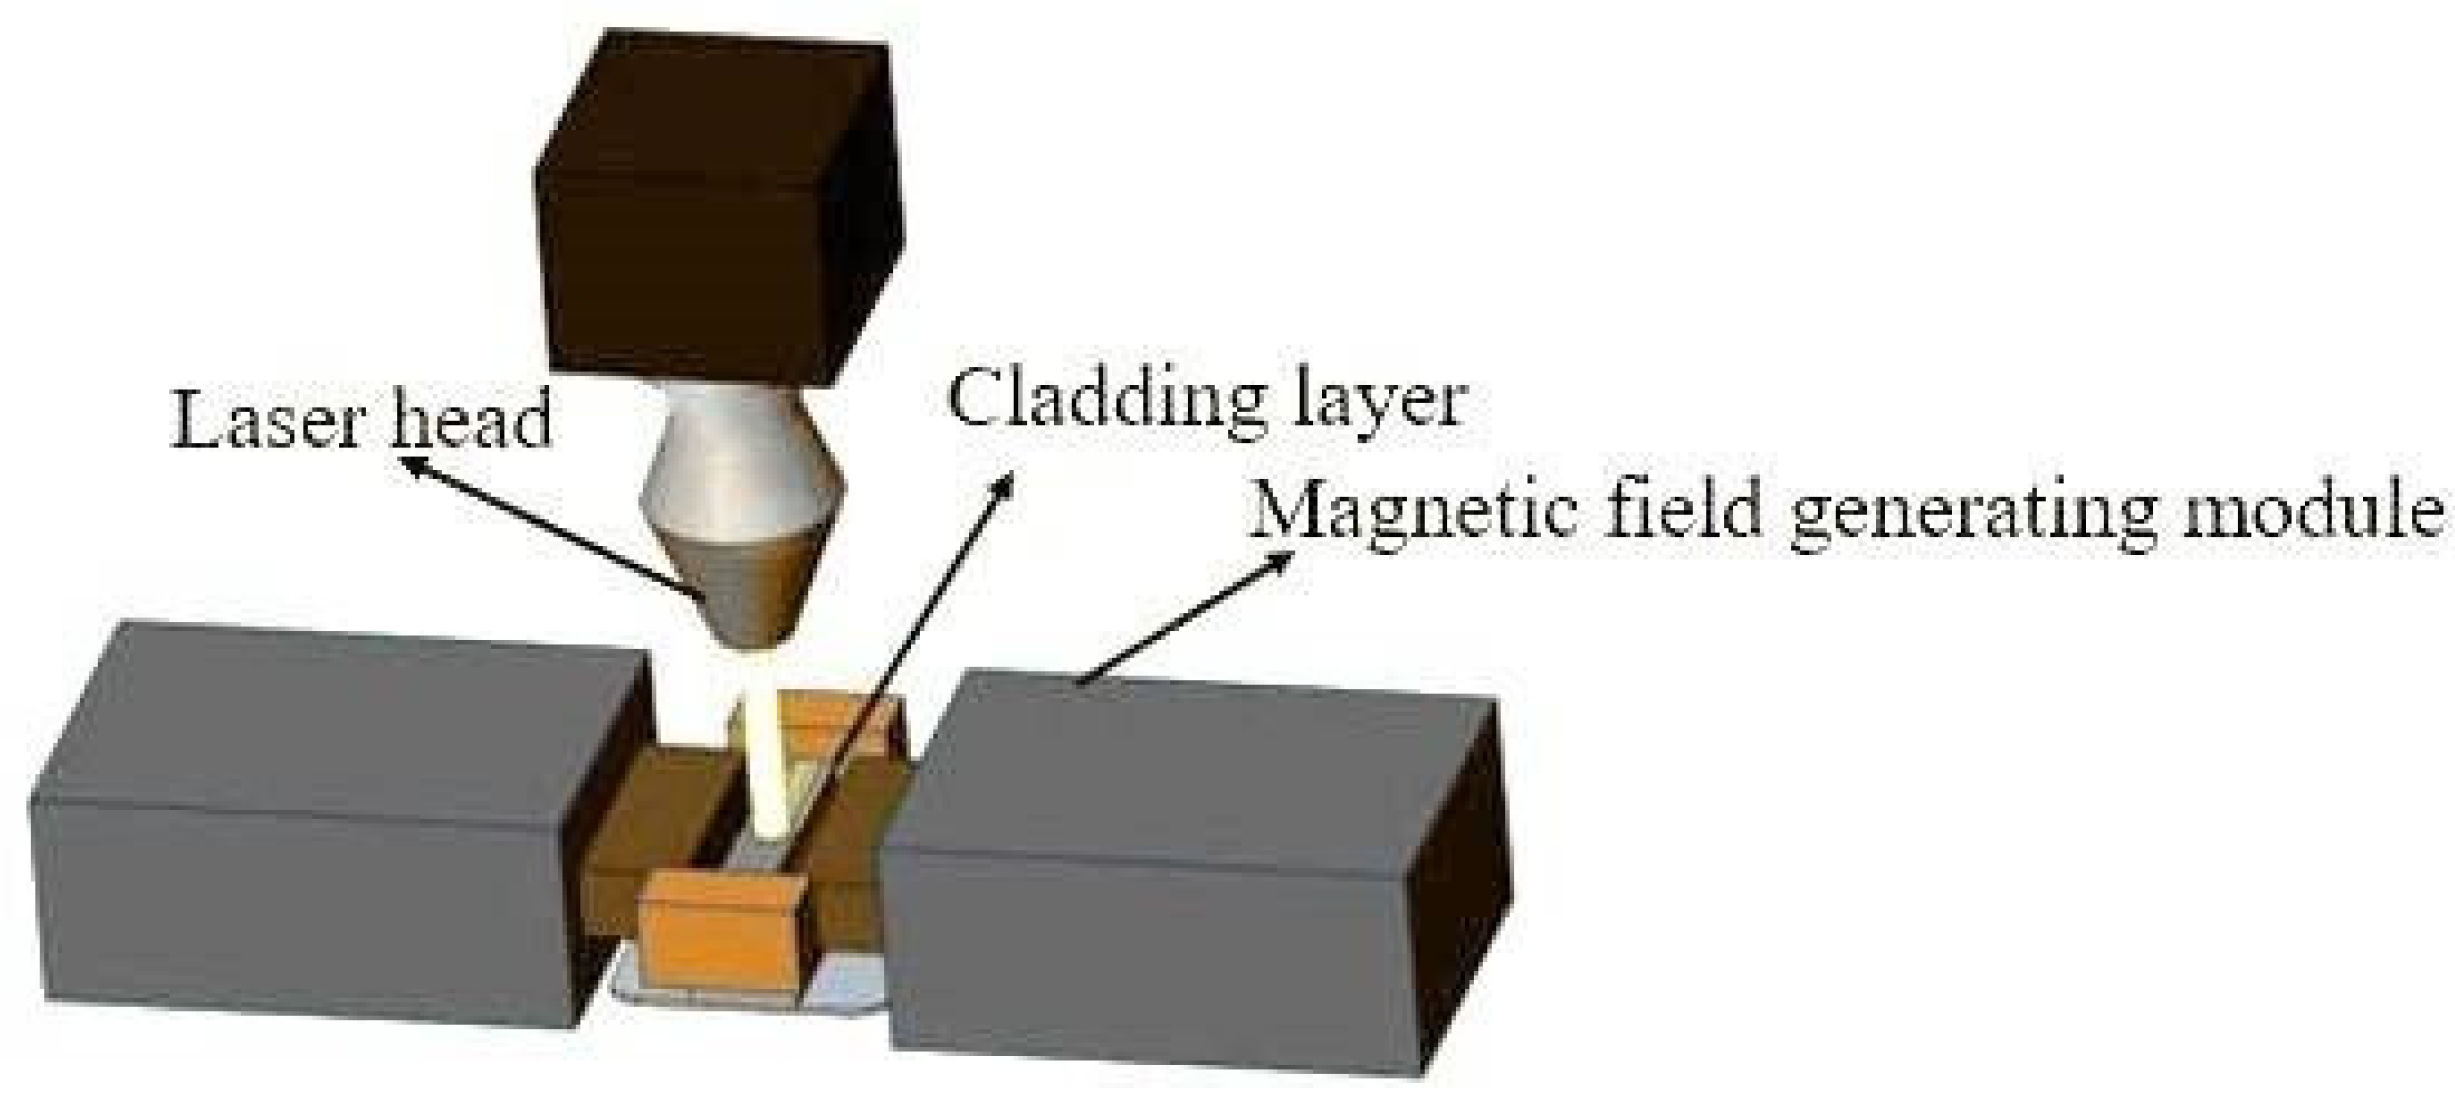
The laser cladding experimental equipment includes a continuous-wave fiber laser processing system and a magnetic field-assisted laser cladding device. The magnetic field-assisted laser cladding process is shown in Figure 2. The magnetic field-generating device consists of an electromagnet and a coil, which is powered by an external power supply. The magnetic field intensity and frequency are changed by adjusting the voltage and frequency of the power supply. In this study, all experiments were single-track laser cladding experiments with a pre-placed powder supply. The thickness of the pre-placed powder bed was about 0.8 mm. The Gauss meter was used to test the magnetic field intensity at the middle position of the workpiece. Comparative experiments were carried out by changing the magnetic field parameters during the laser cladding process, and high-purity argon was used as a protective gas to prevent the oxidation of the powder during the laser cladding process.

2.4. Characterization Method

Wire cutting was used to intercept 10 mm × 10 mm × 10 mm specimens in the center of the workpiece after laser cladding. Aqua regia solution (HCl:HNO3 = 1 mL:3 mL) was used to corrode the specimens after they had been polished and sanded. The laser cladding layer’s microstructure was examined using scanning electron microscopy (SEM, ZEISS, Oberkochen, Germany), and its composition was examined using energy dispersive spectroscopy (EDS). The hardness measurement was carried out using a microhardness tester with equal spacing of 0.1 mm along the longitudinal depth of the layer; 5 points were measured at the same depth to take the average value; the load was 1.961 N (HV0.2); and the holding time was 15 s (HV-1000STA, Laizhou weiyi ExperimentalMachine Manufacturing Co., Ltd., Laizhou, China). Dry friction tests were carried out using a UMT-3 friction tester (Bruker, Billerica, MA, USA), and the friction partner was a diameter of 9.525 mm Si3N4 ball, the loading was 20 N, the frequency was 2 Hz, and the wear test time was set to 0.5 h. SEM was used to examine the specimens’ wear morphology. By dividing the crack’s length by the laser cladding layer’s length and multiplying the result by 100%, the crack rate was determined.

2.5. Evaluation Methodology

In the problem of multi-objective optimization of laser cladding, it is difficult to ensure that each process objective is in the optimum state; each process objective cannot be treated equally, so the emphasis on each process objective is different according to the specific service requirements of the coatings. The importance of individual process objectives is generally expressed in terms of weights, and the importance of integrated process objectives is generally determined in the form of weight summation. In this paper, we adopt a scale method from 1 to 9 to determine the weights of the comprehensive process objectives [20]. The calculation process is as follows:
  • Establishment of the hierarchical analysis structure.
Hierarchical analysis consists of three top–down structural levels: objective level, criterion level, and plan level. The objective level is usually the overall goal used for decision-making; the criterion level is the classification to which parts of the plan level belong; and the plan level is the relevant elements needed to solve the problem. Based on the actual problem and the final decision, each factor is categorized according to the above levels, and the logical levels provide a narrative of the intrinsic relationships of the relevant elements. The hierarchical analysis structure is shown in Figure 3.
2.
Establishment of the judgment matrix
The judgment matrix is developed from the nine-point scale in Table 3, where the numbers need to be filled in by experts in the relevant fields to compare two and two elements in the same hierarchy [21,22,23]. The general form of the judgment matrix is shown in Equation (2).
A = a 11 a 12 a 1 k a 21 a 22 a 2 k a k 1 a k 2 a i j a k k     ( i = 1,2 , , k ,       j = 1,2 , , k )
where aij indicates the importance of factor i to factor j, which needs to be satisfied:
a i j = 1 a i j , i j ,     a i j = 1   ( i = j )
The judgment matrix for the criterion in this study can be identified as follows:
A = 1 1 / 2 3 2 1 / 3 1 1 / 4 4 1
Based on the above judgment matrix method, the comparison judgment matrix for the plan level is
P 1 = 1 7   7 1 / 7 1 / 7 1 2 1 / 2 1
P 2 = 1 5   5 1 / 5 1 / 5 1 2 1 / 2 1
P 3 = 1   4   4 1 / 4 1 / 4 1 1 / 2 2 1
3.
Weighting calculation
The algorithm of geometric mean to obtain judgment weights is calculated as follows:
V i = j = 1 n a i j
Based on Equation (4), the judgment weights can be obtained: V1 = 1.500, V2 = 8.000, V3 = 0.083.
Calculate the third root of the judgment weight:
W i ¯ = V i 3
Based on Equation (5), the third root of the judgment weight can be obtained: W ¯ = W 1 ¯ , W 2 ¯ , W 3 ¯ = ( 1.144 ,   2.000 ,   0.436 ) .
The sub-goal weights can be expressed as:
W i = W i ¯ j = 1 n W j ¯
The weight X of the criterion level to the plan level can be obtained: X = (0.320, 0.558, 0.122). Based on the above calculation method, the calculated weights of the objective level concerning the plan level are X1 = (0.773, 0.087, 0.140), X2 = (0.709, 0.112, 0.179), and X3 = (0.661, 0.208, 0.131).
4.
Hierarchical total ordering
Develop a weighting matrix for the objective level with respect to the plan level:
B = 0.773 0.087 0.140 0.709 0.661 0.112 0.208 0.179 0.131
The overall hierarchical ranking is
W = XB
Thus, it can be obtained that W = (0.723, 0.116, 0.161).
According to the analytic hierarchy process consistency test method, this result meets the test requirements of the analytic hierarchy process [24]. Therefore, the weights of laser energy density, magnetic field frequency, and magnetic field intensity relative to reasonable processing process parameters are 0.723, 0.116, and 0.161, respectively.
5.
Determination of raw data series for gray correlation analysis
A set of data sequences X i k under each process objective in the experimental results shown in Table 4. Here, i is the indicator representing crack rate, hardness, and wear volume, i = 1, 2, 3, and k is the experimental sequence number, k = 1, 2, 3, 4, 5, 6, 7, 8, 9.
6.
Standardization of gray relational data.
Since the dimensions of the original data sequences are different, the original data sequences need to be dimensionless. The calculation formula is
y i k = x i k m i n x i ( k ) m a x x i k m i n x i ( k )
In the formula, y i k is the normalized value of the kth experimental value under index i. The results of the original data normalization and data sequence difference are shown in Table 5.
7.
Finding the data difference sequence.
The formula for calculating the data difference sequence is as follows:
i k = y i 0 y i ( k )
In the formula, y i 0 is the ideal value under the process target of index I, the ideal value of crack rate and wear volume is 0, and the ideal value of hardness is 1. The results are shown in Table 5.
8.
Finding the gray correlation coefficient and gray correlation degree.
The calculation formula for the gray correlation coefficient is
  g i j k = m i n i m i n j i j ( k ) + ρ m a x i m a x j i j ( k ) i j ( k ) + ρ m a x i m a x j i j ( k )
In the formula, ρ is the resolution coefficient, which is taken as 0.5.
Gray correlation degree disclosure can be expressed as
G k = i = 1 3 w i g i ( k )
Calculate the gray correlation coefficient and gray correlation degree of the corresponding parameters according to Equations (10) and (11). The results are shown in Table 6.
9.
Univariate analysis
The correlation coefficient indicates the degree of association of every single factor with the desired parameter, so it can be used to analyze the single factors. According to the data calculated in Table 6, the gray correlation analysis of single process objectives is carried out for crack rate, hardness, and wear volume in the laser cladding results, respectively. Table 7, Table 8 and Table 9 display the average gray correlation coefficients for each process objective that were derived from the gray correlation coefficients corresponding to various levels of each parameter in Table 6.
The combination of process parameters with the highest average correlation value is the optimal one, according to the concept of gray correlation. As shown in Table 7, the optimal combination of process parameters is A3B1C3. This combination includes level 3 parameters for factor A (laser energy density), level 1 parameters for factor B (magnetic field frequency), and level 3 parameters for factor C (magnetic field intensity).
According to the range column analysis in Table 7, the impact order on the crack rate of the cladding layer, from large to small, is magnetic field frequency, magnetic field intensity, and laser energy density. Table 8 shows that the best process parameter combination for hardness is A3B2C3, that is, the combination of factor A (laser energy density) level 3 parameters, factor B (magnetic field frequency) level 2 parameters, and factor C (magnetic field intensity) level 3 parameters. According to the range column analysis in Table 8, the impact order on the hardness of the cladding layer, from large to small, is magnetic field frequency, laser energy density, and magnetic field intensity. Table 9 indicates that for the laser cladding wear volume, the optimal process parameter combination is A3B1C3, that is, factor A (laser energy density) level 3 parameter, factor B (magnetic field frequency) level 1 parameter, and factor C (magnetic field intensity) level 3 combination of parameters. According to the range column analysis in Table 9, the effects on the wear volume of the cladding layer from large to small are magnetic field frequency, magnetic field intensity, and laser energy density.
10.
Gray relational analysis of multi-process targets
Multi-process target optimization was carried out for the crack rate, hardness, and wear volume of the cladding layer; that is, gray correlation analysis was performed on the optimization objects. The analysis results are shown in Table 10.
According to the nature of gray correlation, the magnitude of gray correlation reflects the degree of influence of different levels of each process parameter on multiple process objectives. Comparing the process levels, the level with the highest gray correlation value is the optimal level for the combined optimization of multiple process objectives [25]. The following conclusions are obtained:
(a)
The gray correlation ranking of the influence of laser energy density on cladding layer quality is: A3 > A2 > A1;
(b)
The gray correlation ranking of the influence of magnetic field frequency on cladding layer quality is B2 > B1 > B3;
(c)
The gray correlation ranking of the influence of magnetic field intensity on cladding layer quality is C3 > C1 > C2.
Consequently, A3B2C3 is the optimal process parameter combination for the cladding layer’s quality, which is 33 J/mm2 (scanning laser energy density), 90 Hz (magnetic field frequency), and 90 mT (magnetic field intensity). In addition, according to the range column analysis in Table 9, the process parameters that have an impact on the quality of the cladding layer from large to small are magnetic field frequency, magnetic field intensity, and laser energy density.

2.6. Results and Discussion

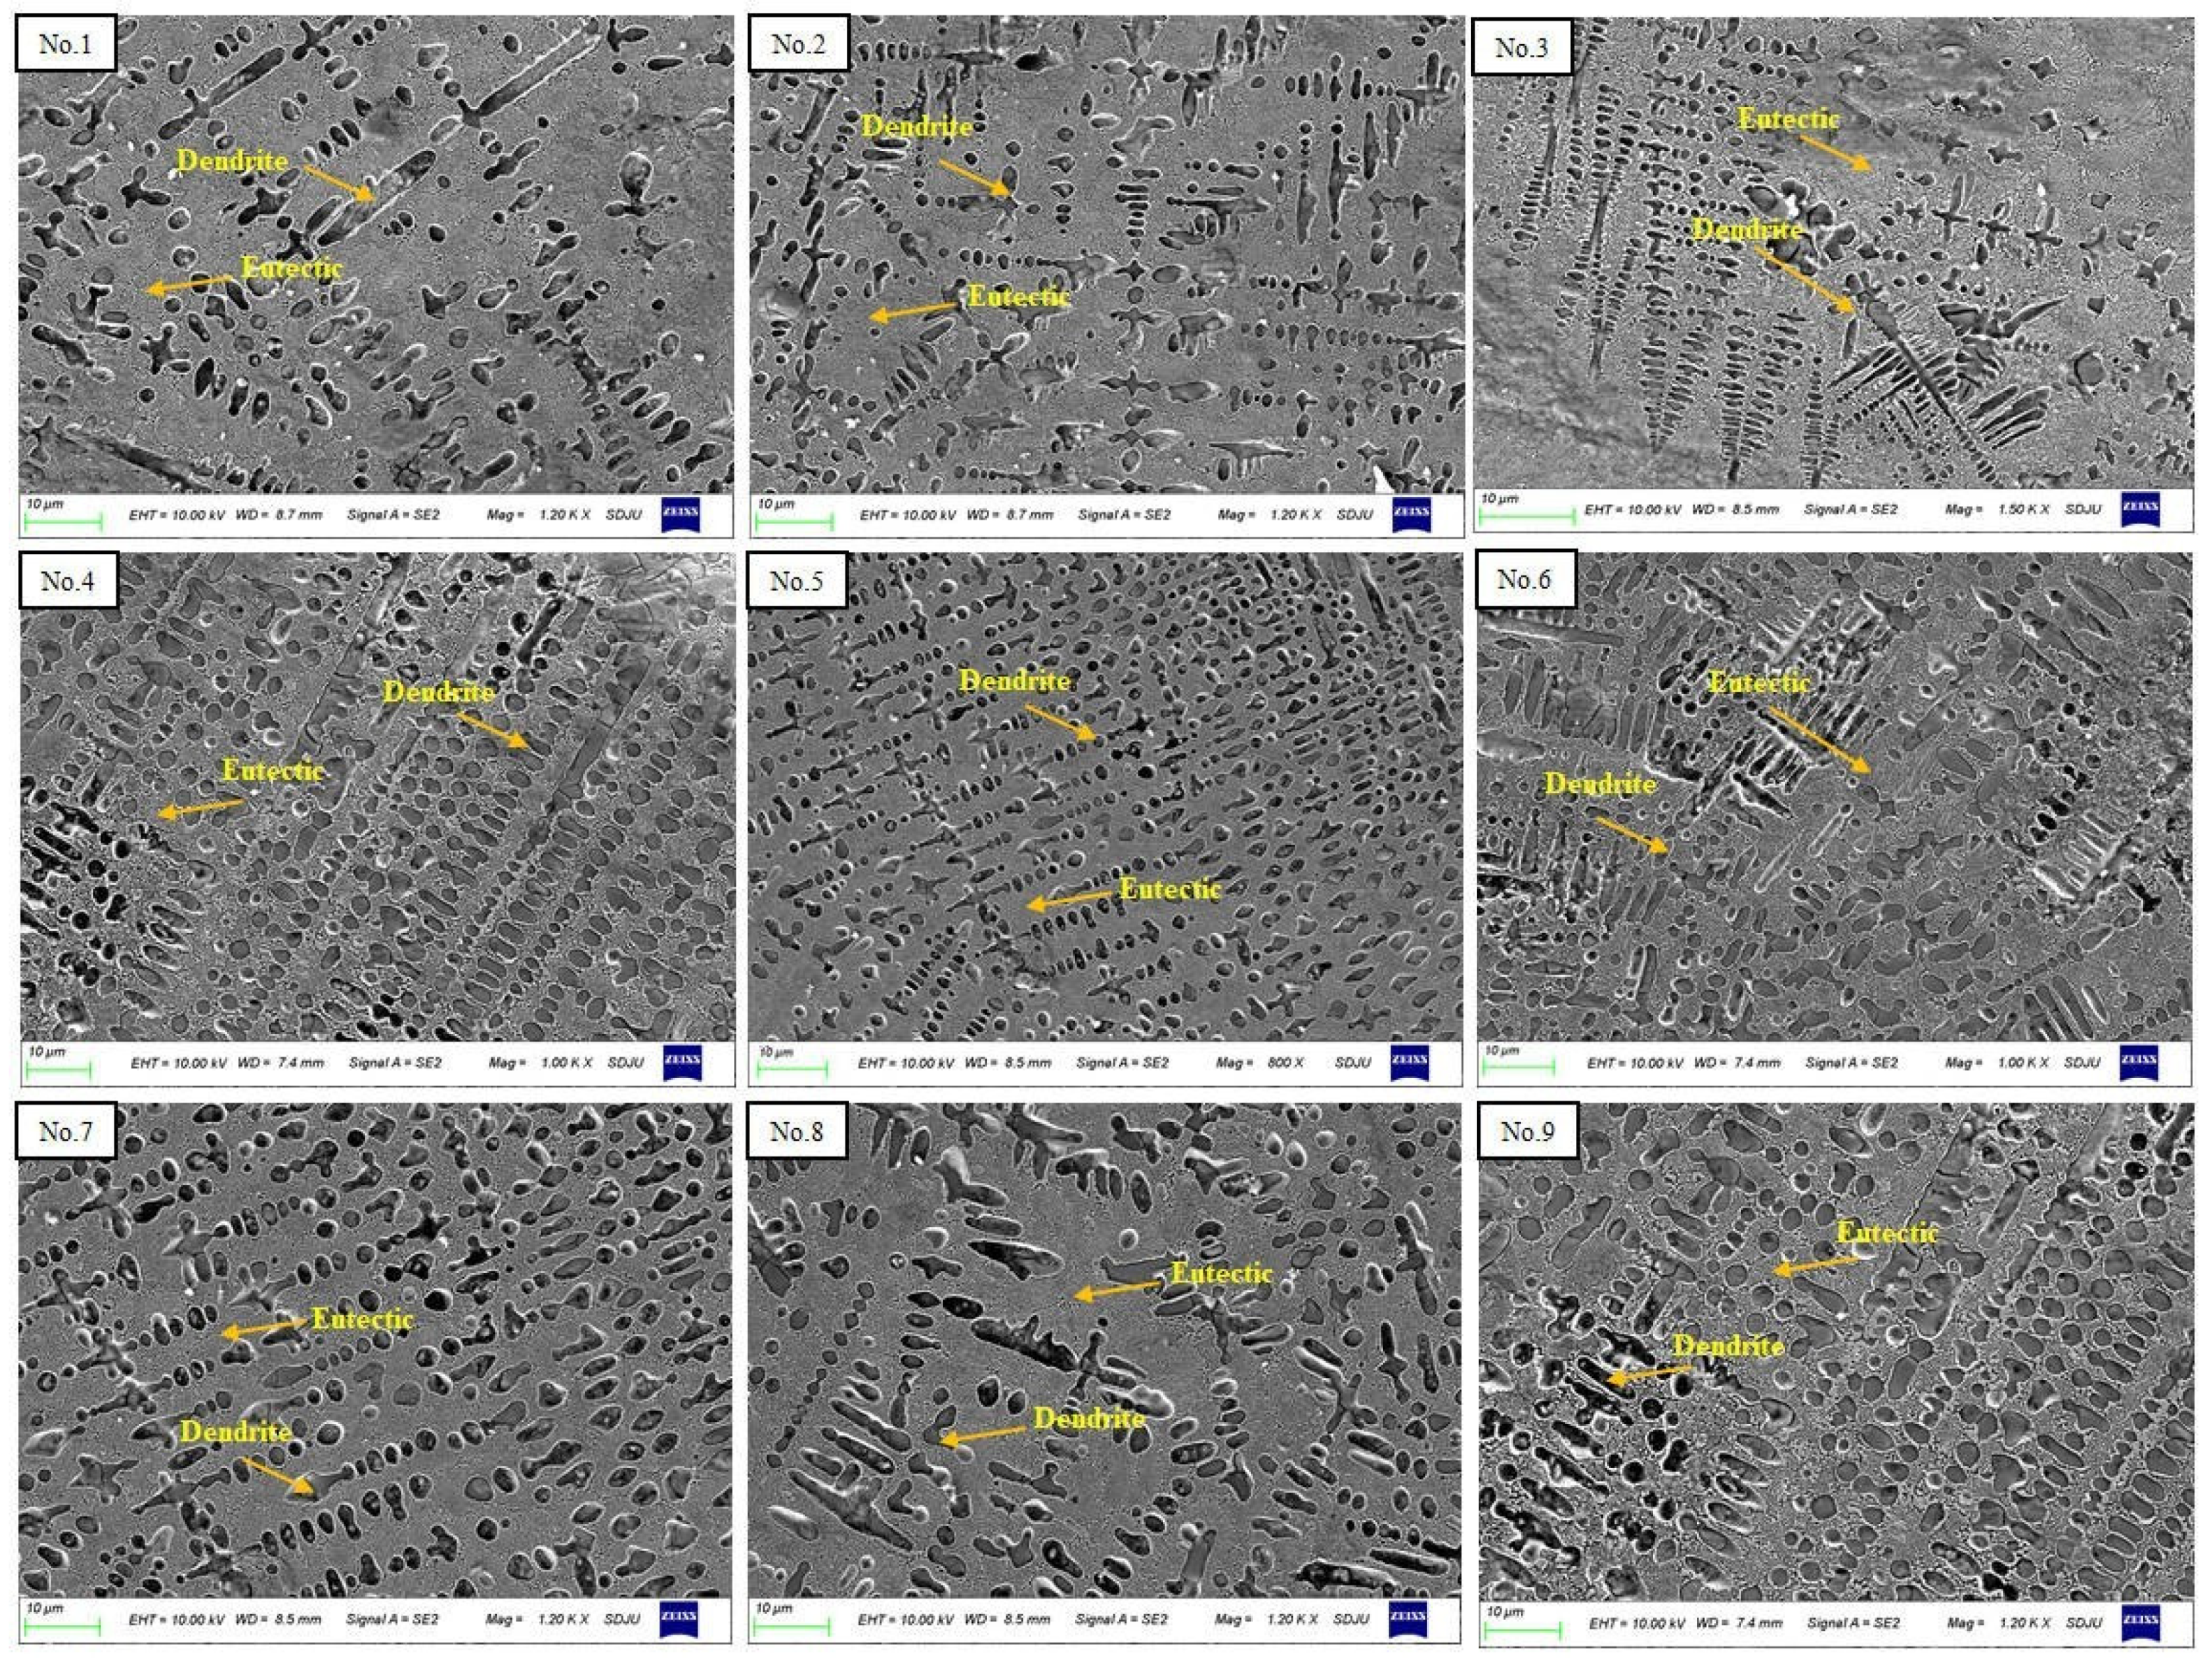
The laser cladding layer’s microstructure is shown in Figure 4. The cladding layer’s microstructure is primarily made up of eutectics and dendrites. The size of the dendrites in the microstructure has an important influence on the mechanical and wear-resistant properties of the cladding layer [26]. The microstructure sizes of the laser cladding layers No. 1–No. 9 were 12.9 μm, 12.8 μm, 15.1 μm, 15.2 μm, 14.8 μm, 11.3 μm, 15.1 μm, 15.6 μm, and 14.9 μm. The microscopic size of the dendrite tends to rise as the laser energy density increases. The average microstructure size of the laser cladding layers No. 1–No. 3 was 13.6 μm; the average microstructure size of the laser cladding layers No. 4–No. 6 was 13.7 μm; and the average microstructure size of the laser cladding layers No. 7–No. 9 was 15.2 μm.
This phenomenon may be due to the fact that a higher laser energy density increases the heat input to the laser cladding layer, which raises the temperature of the molten pool and prolongs the existence of the molten pool, leading to the full growth of the dendritic microstructure [27]. It is worth noting that an increase in the frequency of the external magnetic field does not lead to a decrease in the size of the dendrites at the same laser energy density parameter. In samples No. 1–No. 3, the microstructure size of the cladding layer increases abnormally with an increase in the frequency of the magnetic field. Similarly, the increase in magnetic field intensity does not necessarily lead to a decrease in the microstructure size of the cladding layer.
When the magnetic field intensity and magnetic field frequency are very small, the Lorentz force and Joule heating effect on the metal melt are very small, and the degree of refinement of the grain size is not obvious. As the magnetic field intensity and magnetic field frequency increase, the two effects of the magnetic field on the microstructure are enhanced. If the Lorentz force’s effect on the solidification microstructure is greater than the Joule heating effect, the grains will be refined. When the two effects are equivalent, the grain refinement effect is the best [28]. Thereafter, as the magnetic field intensity and magnetic field frequency increase, the Joule heating effect on the solidification microstructure is greater than the Lorentz force, and the grains begin to grow larger, reaching a certain level, and the grains appear larger than those without magnetic field treatment. This shows that it is not that the greater the magnetic field intensity and magnetic field frequency, the higher the refinement effect of the magnetic field effect on the microstructure of the laser cladding layer.
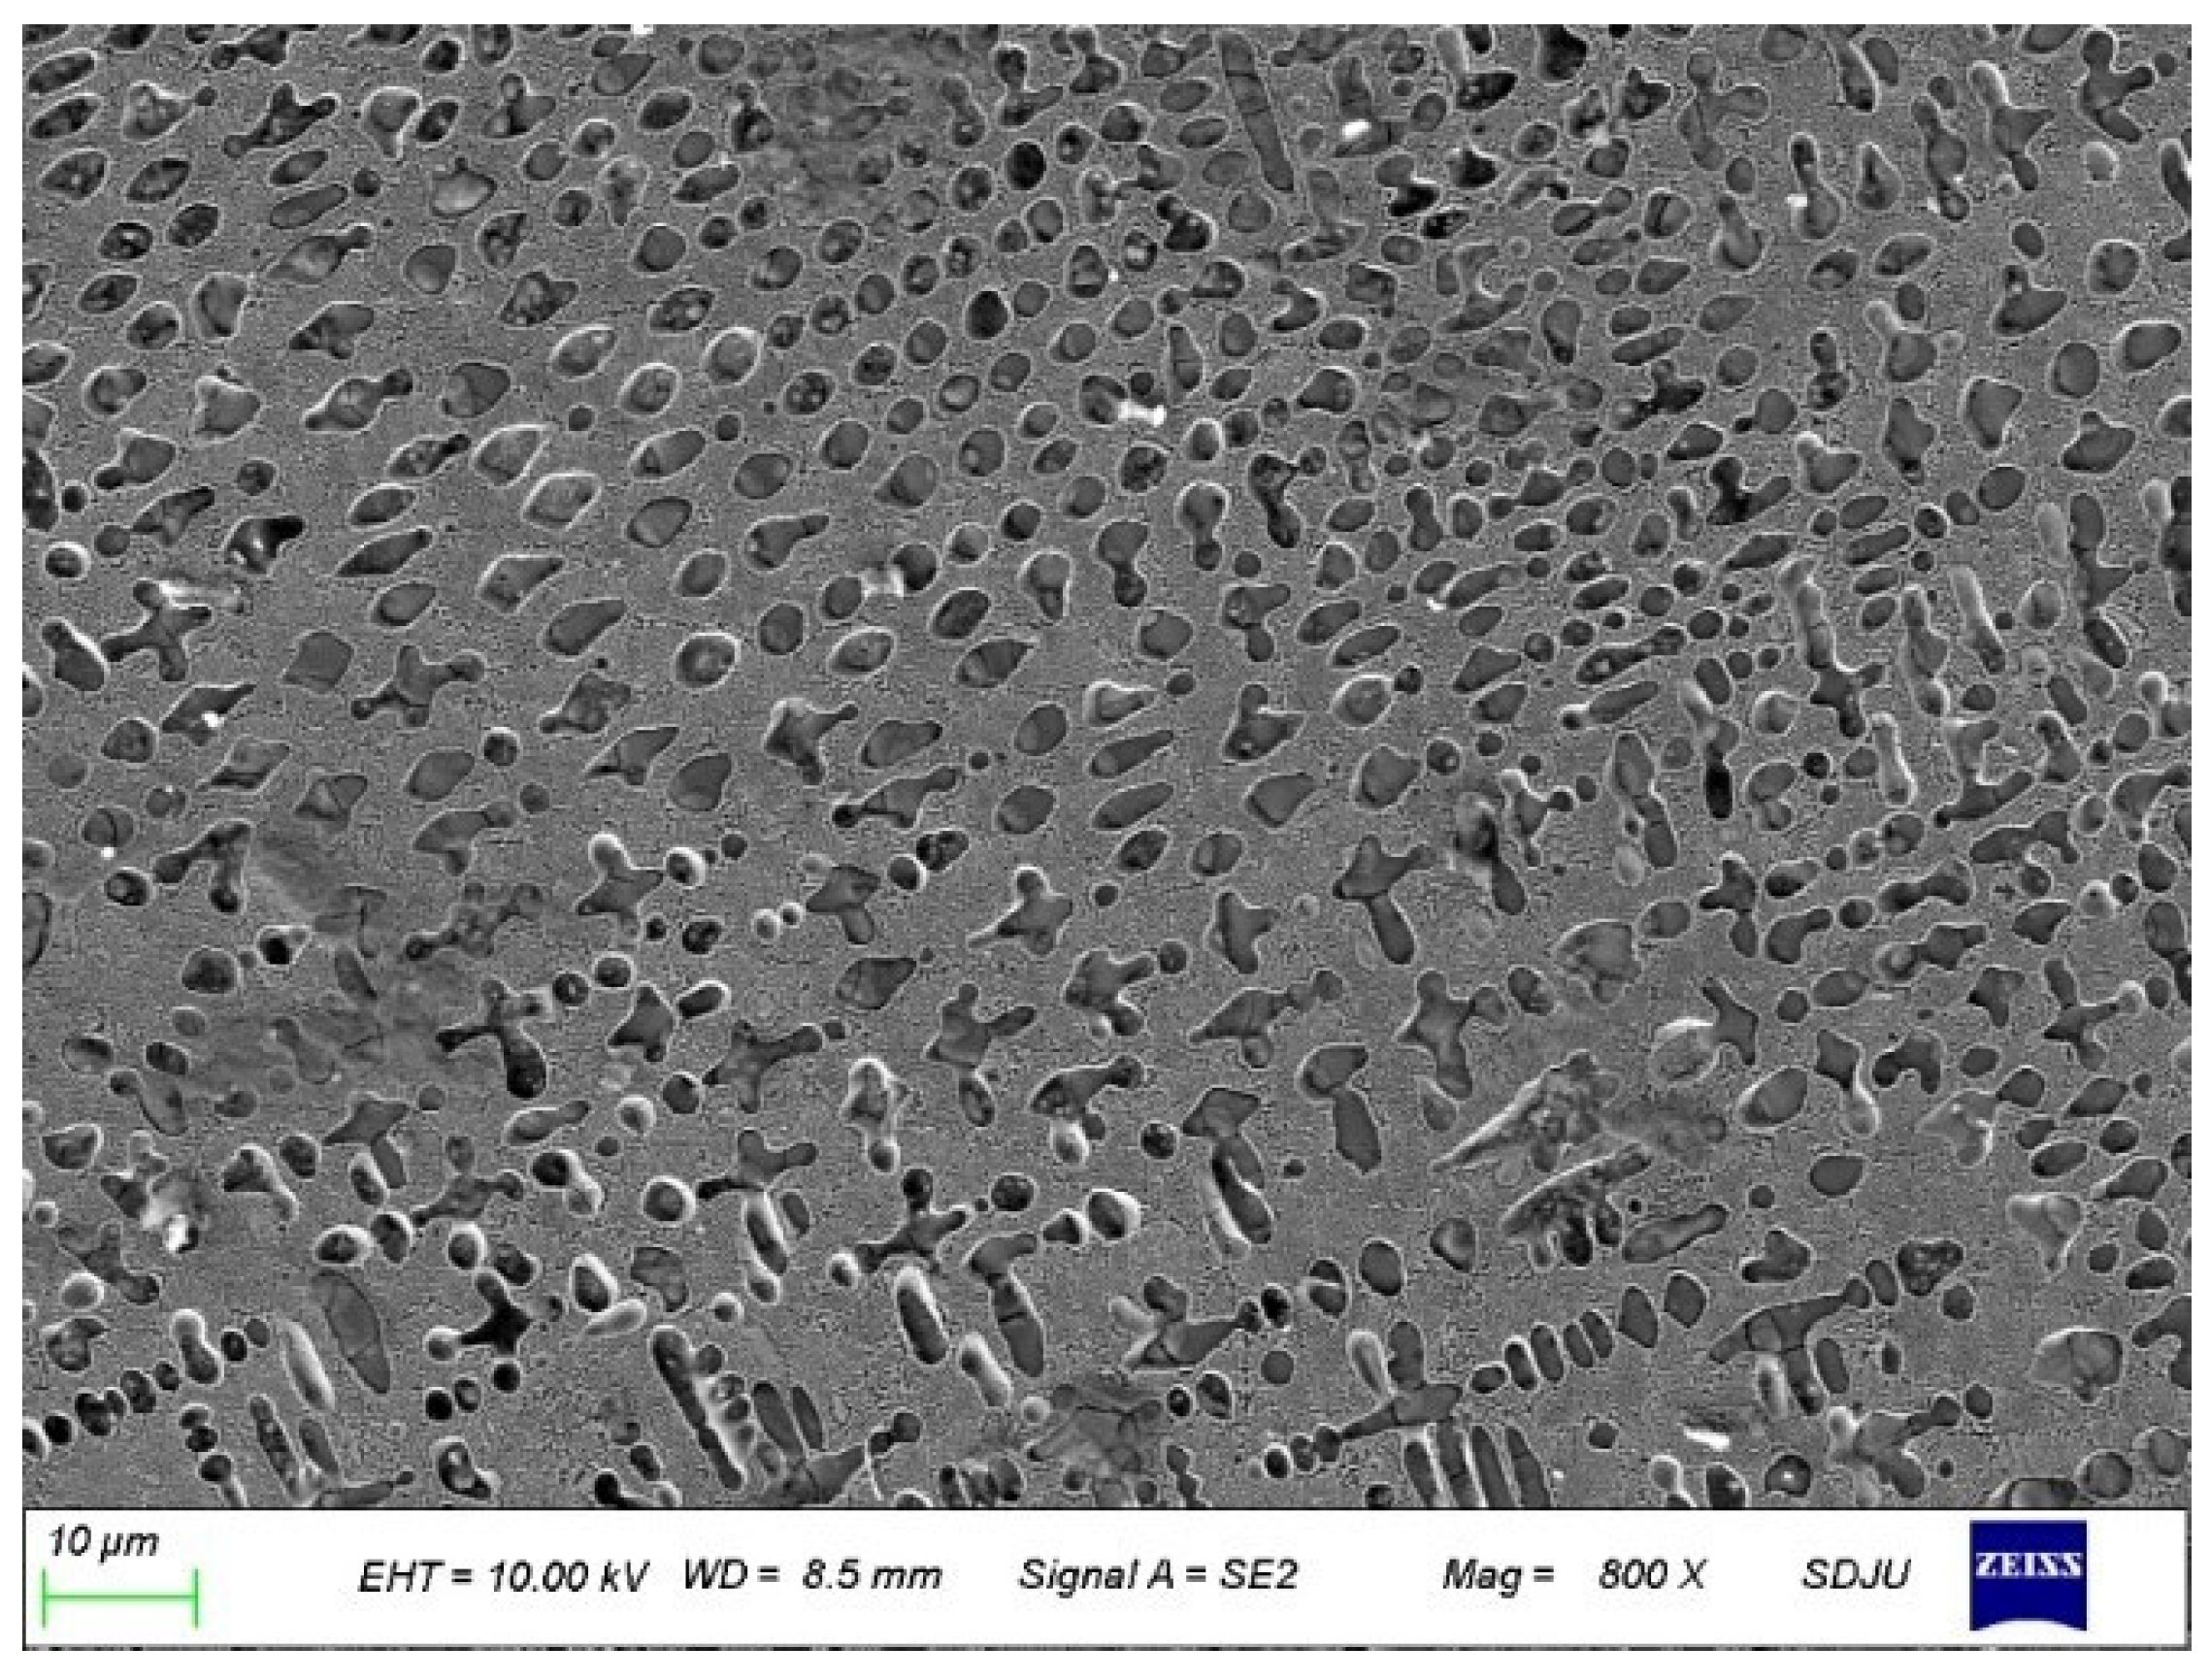
The microstructure of the laser cladding layer optimized by the hierarchical analysis–gray correlation method is shown in Figure 5. The dendrite size in the microstructure of the optimized laser cladding layer is 4.81 μm, which is much lower than that of the unoptimized cladding layer, and the dendrite morphology tends to be equiaxed. This shows that the hierarchical analysis–gray correlation method is effective in optimizing the microstructure size of the laser cladding layer.
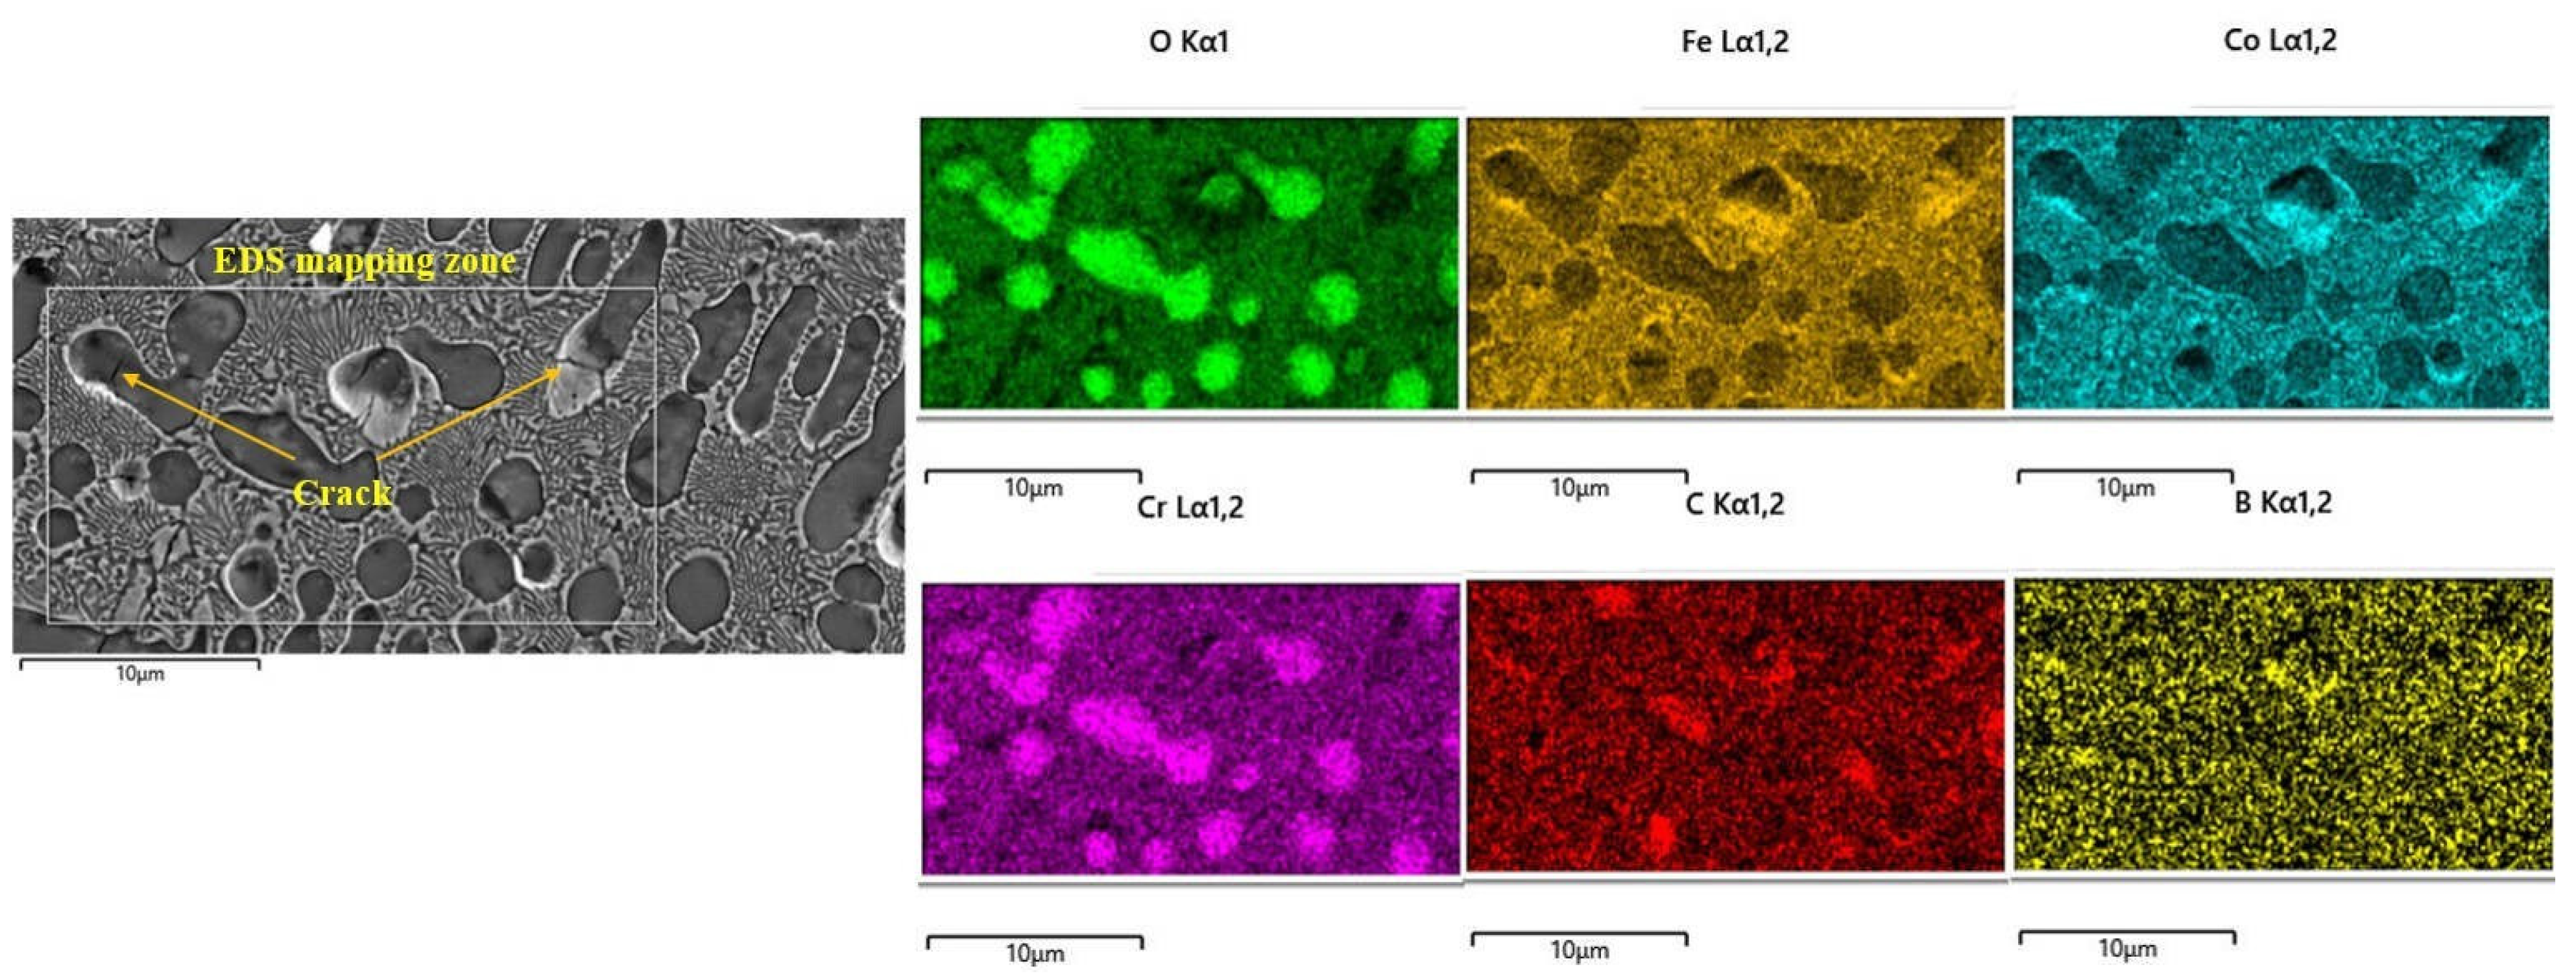
Many microcracks were found in the unoptimized laser cladding layer. To further analyze the characteristics of microcracks, Figure 6 shows the element distribution in the microcrack area of the No. 7 laser cladding layer. Obvious Cr oxides were found in the dendrites of the cladding layer. Due to the low toughness of CrO and the large thermal stress existing during the laser cladding process, it is easy to cause microcracks in this area [29]. It is worth noting that the cracks are mainly concentrated in the dendrite, and no obvious cracks are found in the eutectic microstructure.
This shows that the generation of laser cladding cracks is closely related to the generation of metal oxides, and the dendrite microstructure has greater crack sensitivity than the eutectic microstructure. This phenomenon could be caused by the laser cladding layer’s consecutive solidification and shaping. Metal oxides often have higher melting points and solidify before the eutectic structure. Due to the existence of higher thermal stress, metals with lower toughness are oxidized. The material is pulled apart, causing microcracks. The eutectic microstructure forms later, and thermal stress causes cracks in the dendrites and also reduces the stress, so it is difficult to initiate cracks in the eutectic microstructure. There are no cracks in the optimized laser cladding layer, which shows that the crack sensitivity of the cladding layer optimized by the hierarchical analysis–gray correlation method is greatly reduced. The reason for the reduction in cracks in the cladding layer is related to the refinement of the optimized microstructure. The smaller dendrite size is conducive to strengthening the strength of the cladding layer, thereby reducing crack sensitivity.
The change in hardness of the laser cladding layer after optimization can reach 1100 HV. The hardness is improved compared to non-optimized laser cladding layers. This behavior can be explained by the optimized laser cladding layer’s finer microstructure and lower dendritic size when compared to the unoptimized laser cladding layer. The Hall–Petch criterion states that strength increases with decreasing grain size [30]. Therefore, the hardness of the optimized laser cladding layer is improved.
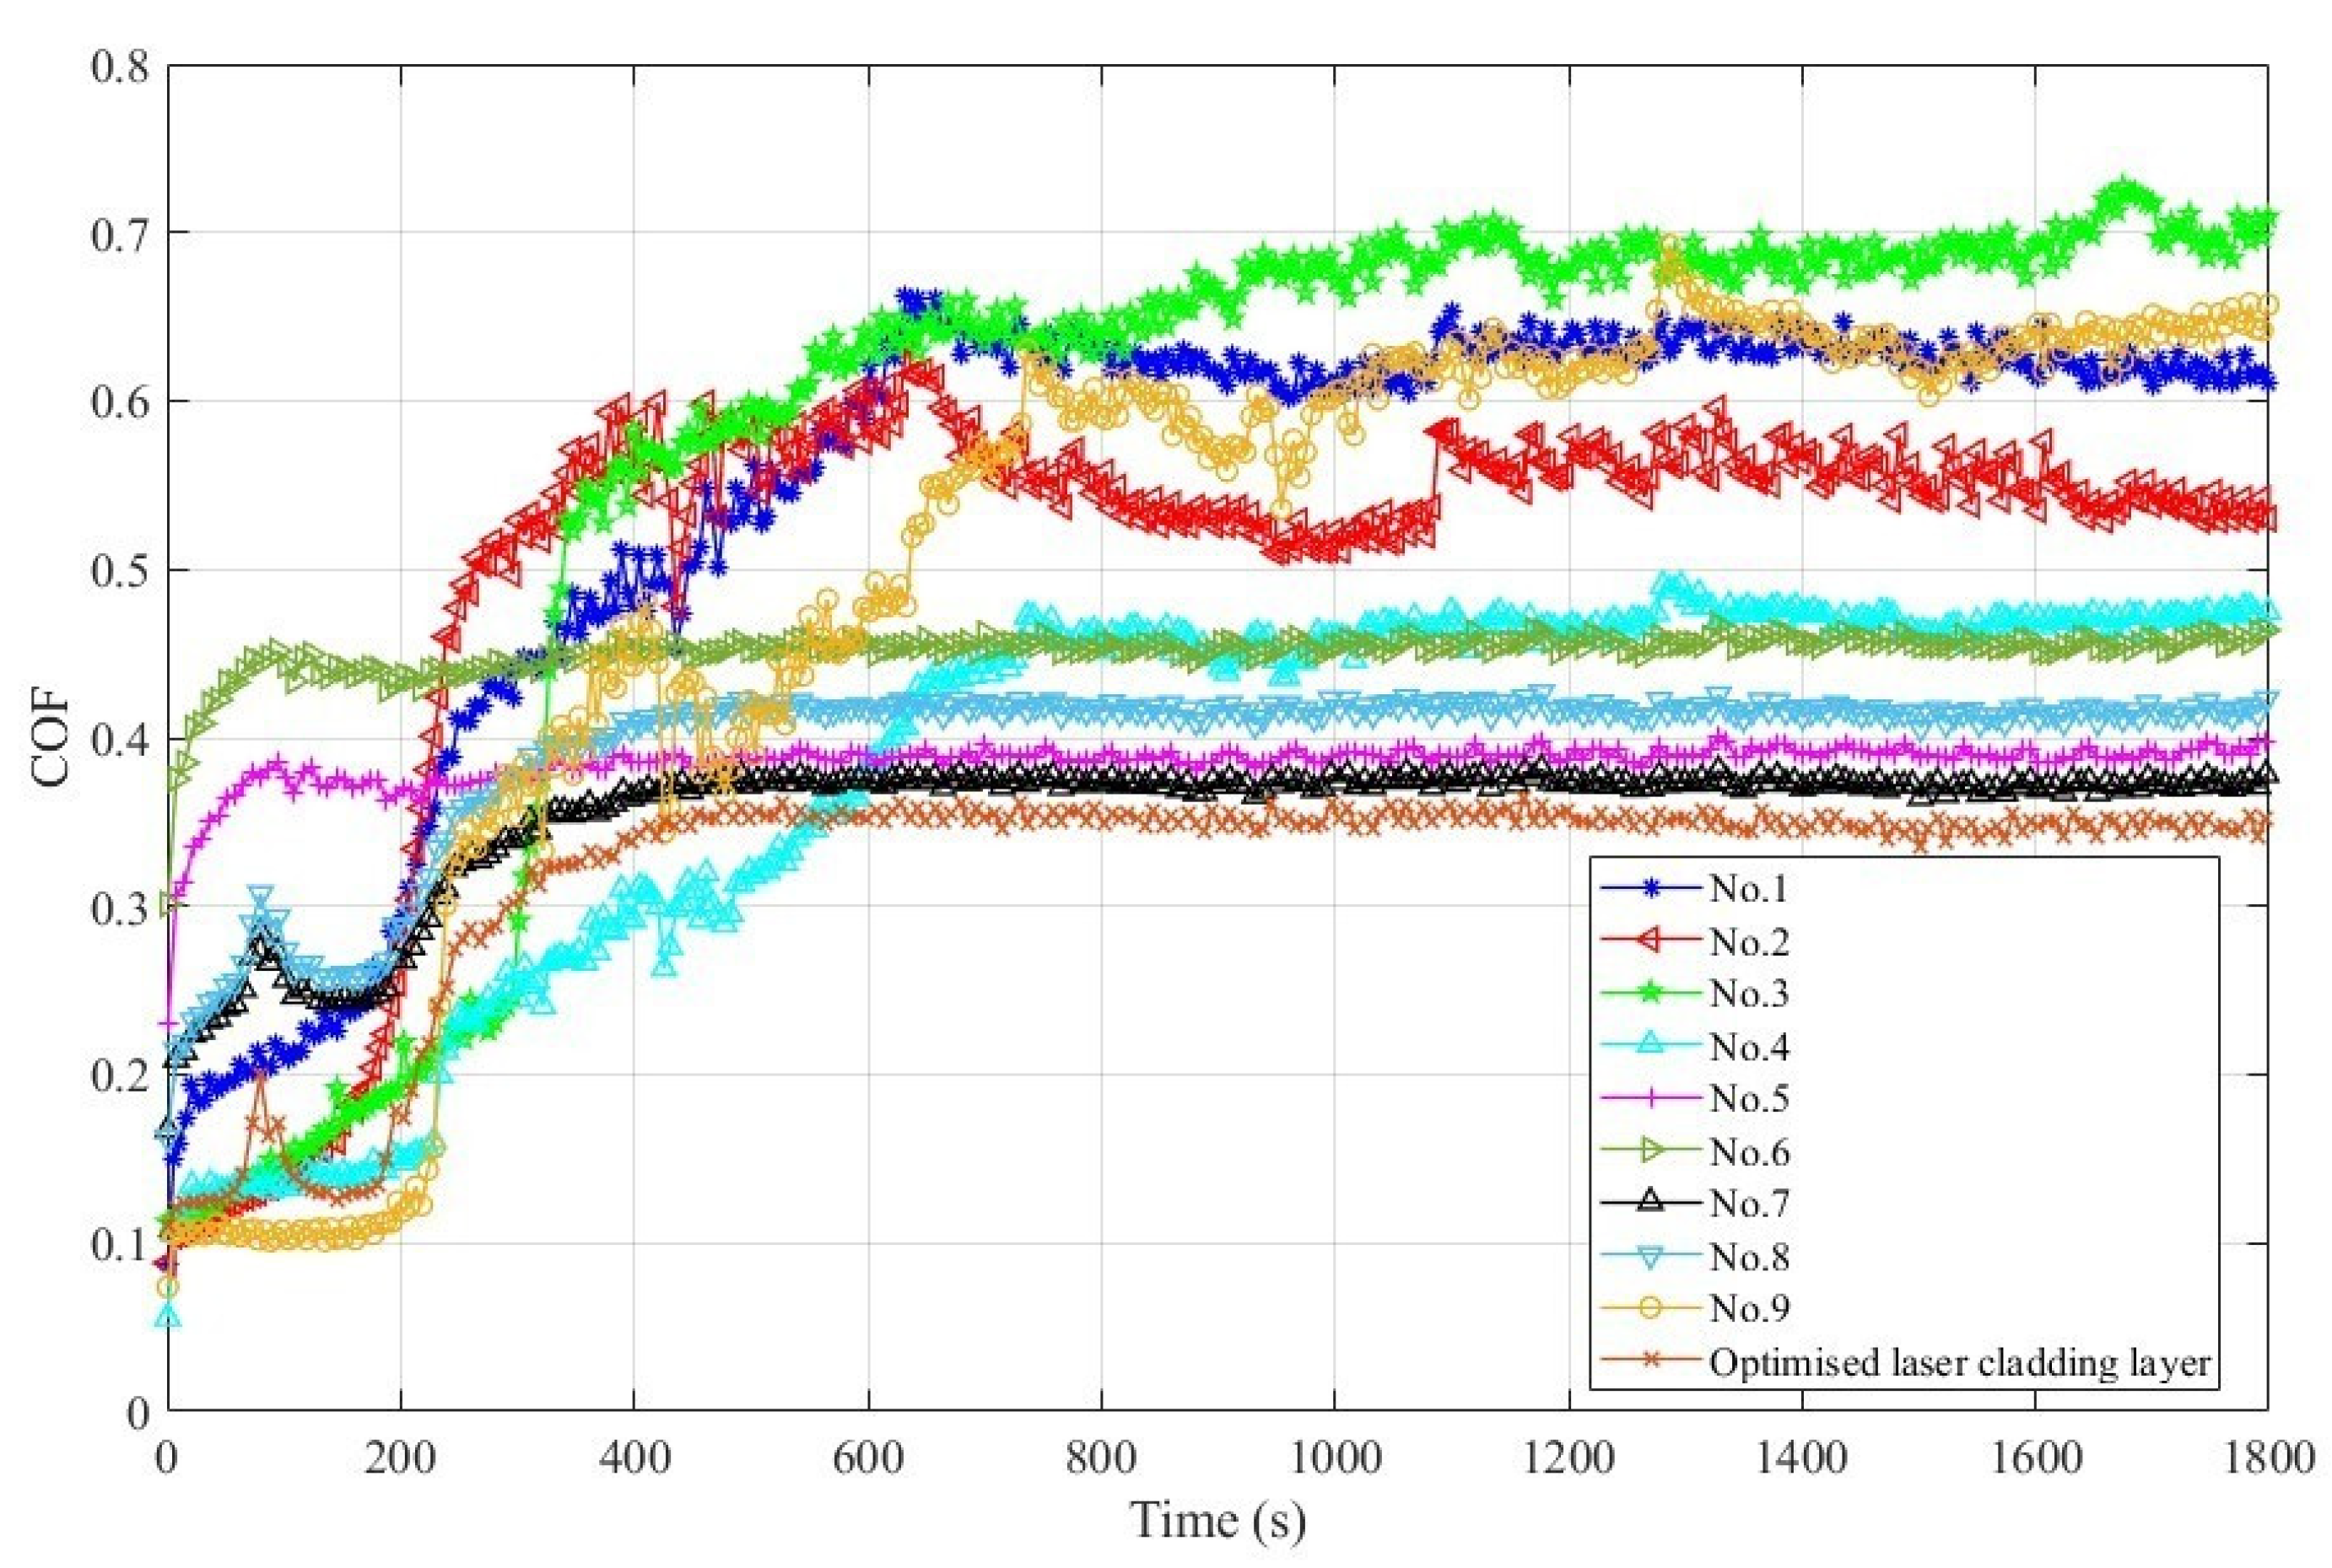
The laser cladding layer’s coefficient of friction (COF) curve is displayed in Figure 7 for room-temperature dry friction experimental conditions.
Friction experiments are usually divided into two stages: break-in and steady wear. It can be seen from Figure 7 that in the early stage of the friction and wear experiment, the wear is in the running-in stage, the friction coefficient is small, and the fluctuation is large. The reason is that in the early stage of the friction and wear experiment, the contact form between the grinding ball and the coating surface is point contact, and the contact area is small. The contact surface is smooth, resulting in lower friction between the coatings and the grinding ball. As the friction and wear experiment proceeds, a large amount of debris begins to be generated on the contact surface, which affects subsequent experiments and gradually increases the coefficient of friction. On the other hand, changes in surface roughness cause the contact form to change from point contact to surface contact. The contact surface gradually becomes larger, causing the coefficient of friction to fluctuate within a certain range, and the wear tends to a stable state. It can also be seen from Figure 7 that the coefficient of friction of the optimized coating is the most stable among all samples, and the friction coefficient is the lowest.
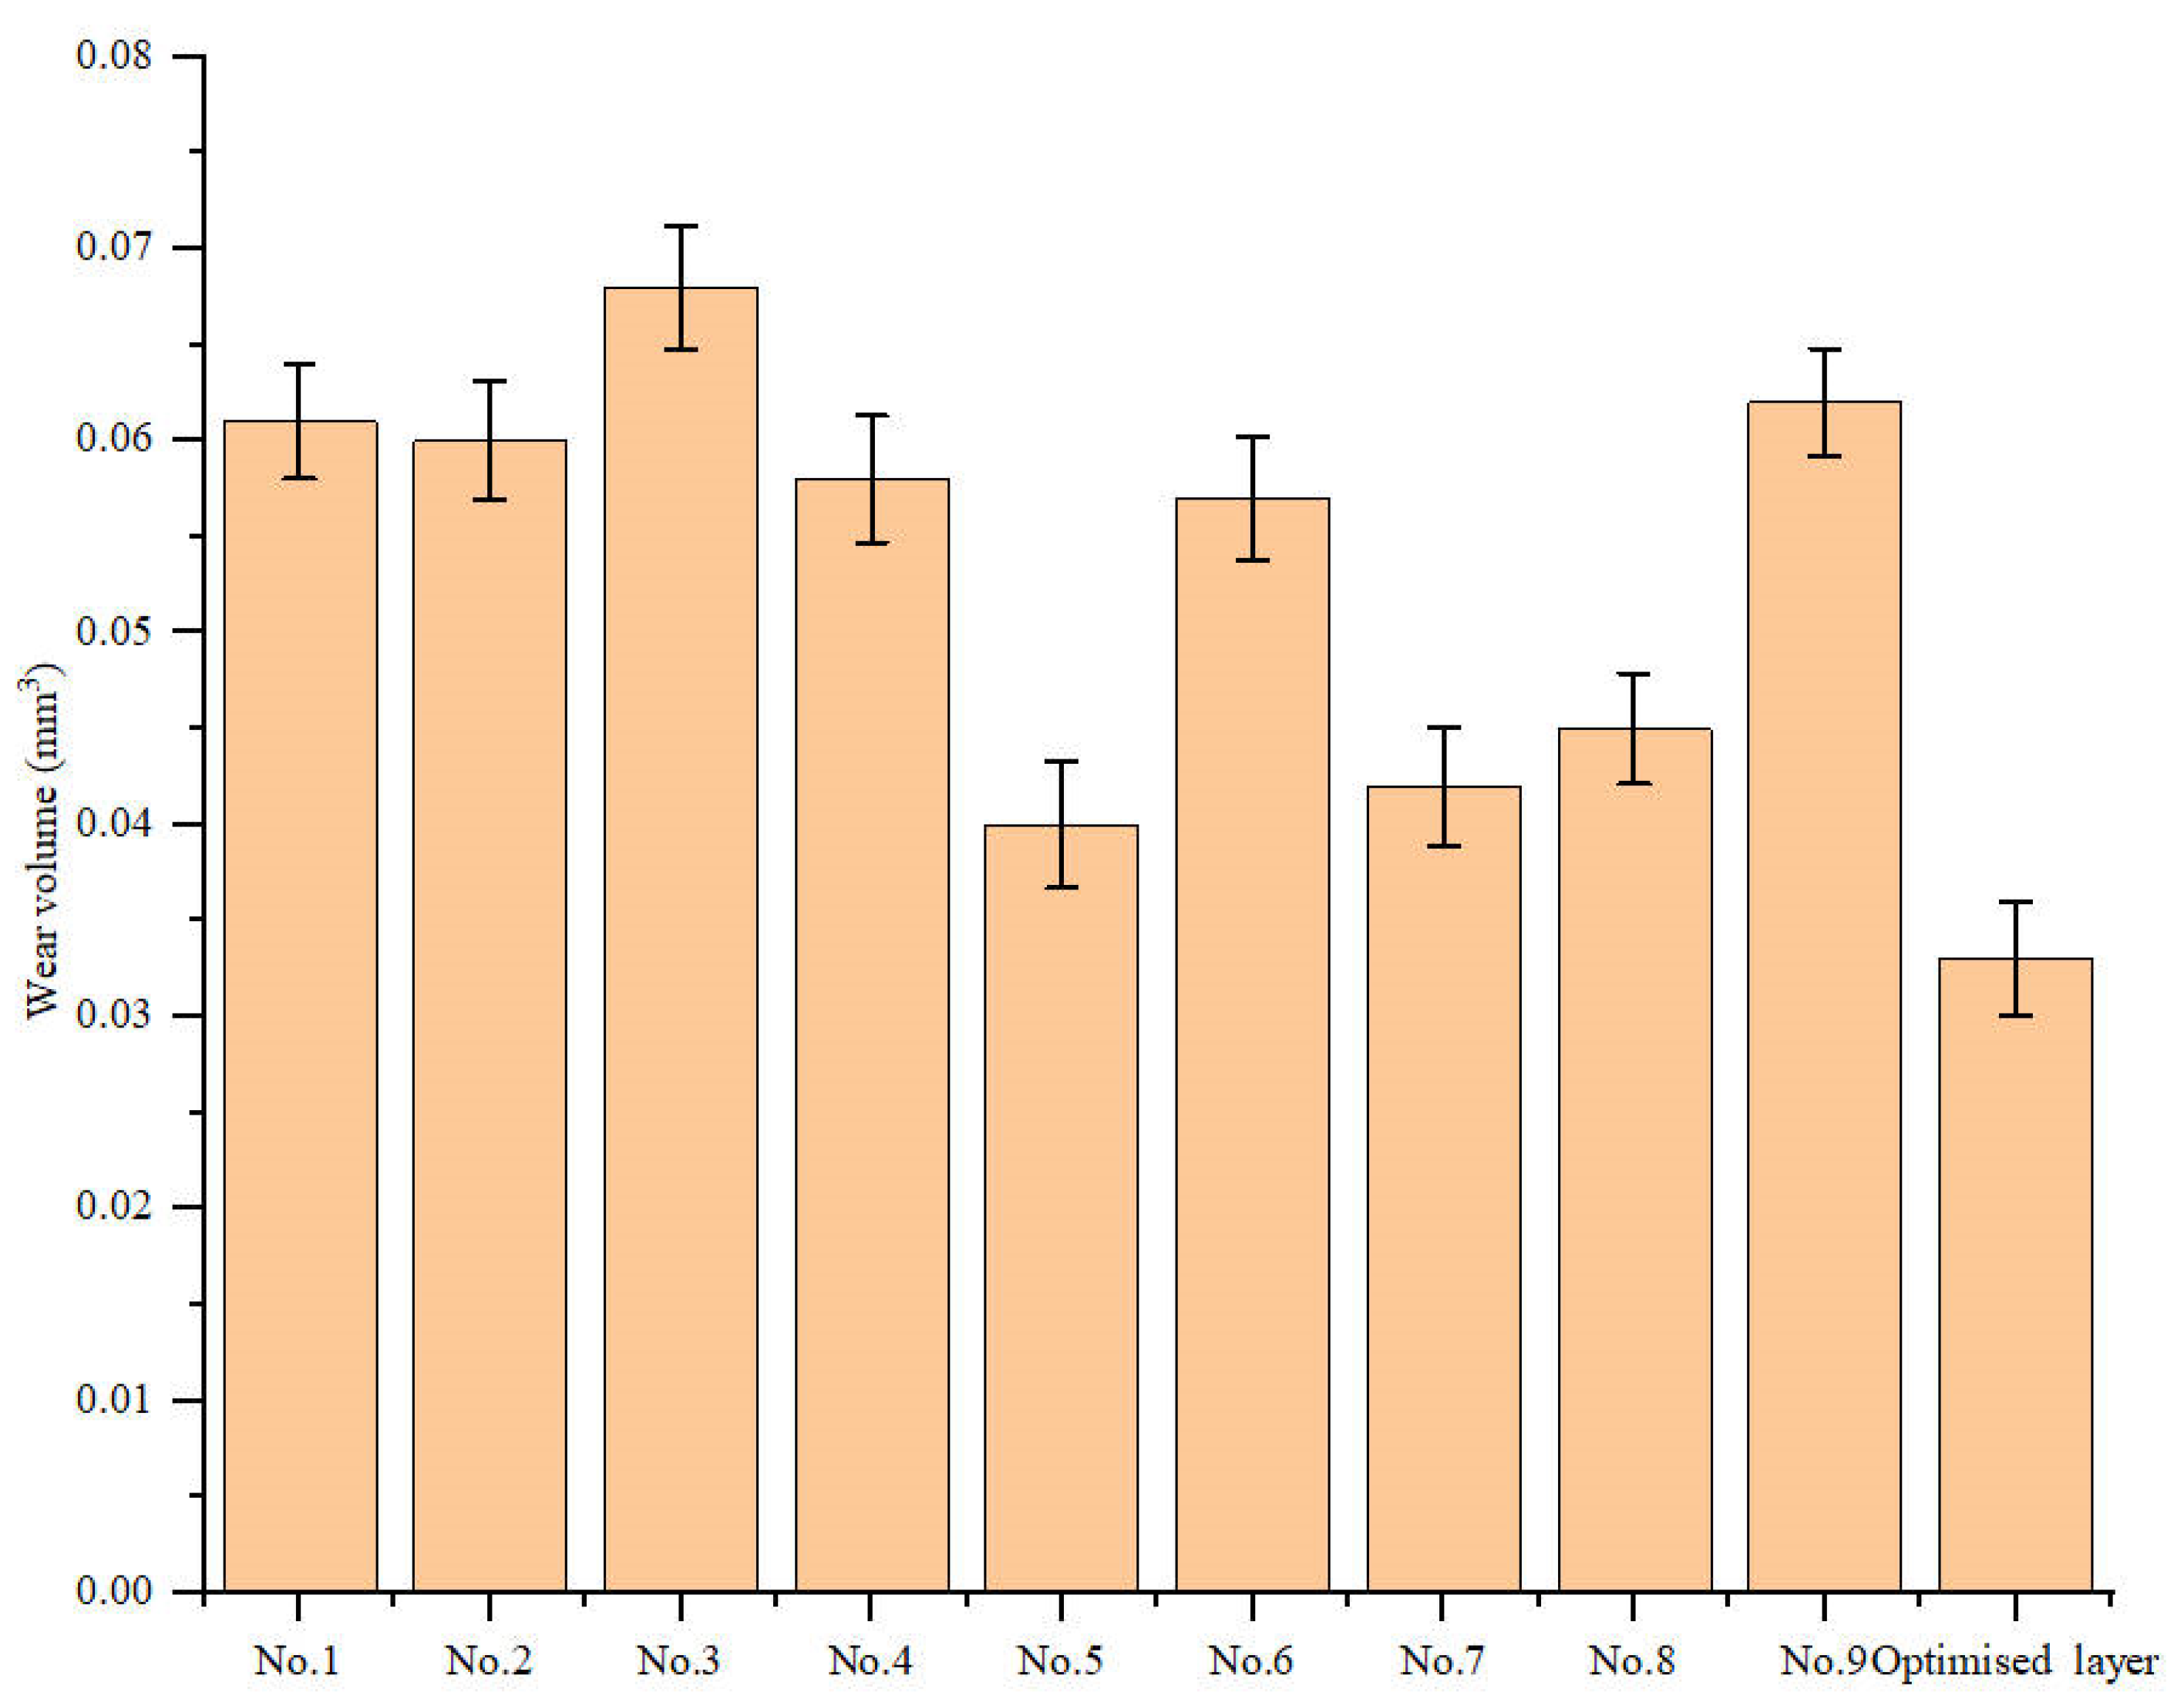
Figure 8 shows the wear volume of the laser cladding layer. It can be seen from the figure that the wear volume of the optimized laser cladding layer is the lowest among all samples. Wear resistance is usually positively related to material hardness. Higher microhardness improves the plastic deformation resistance of the coating and effectively resists damage to the coating by grinding balls [31]. Since the optimized sample has the smallest friction coefficient and wear volume, it indicates that the laser cladding layer has the best wear resistance.
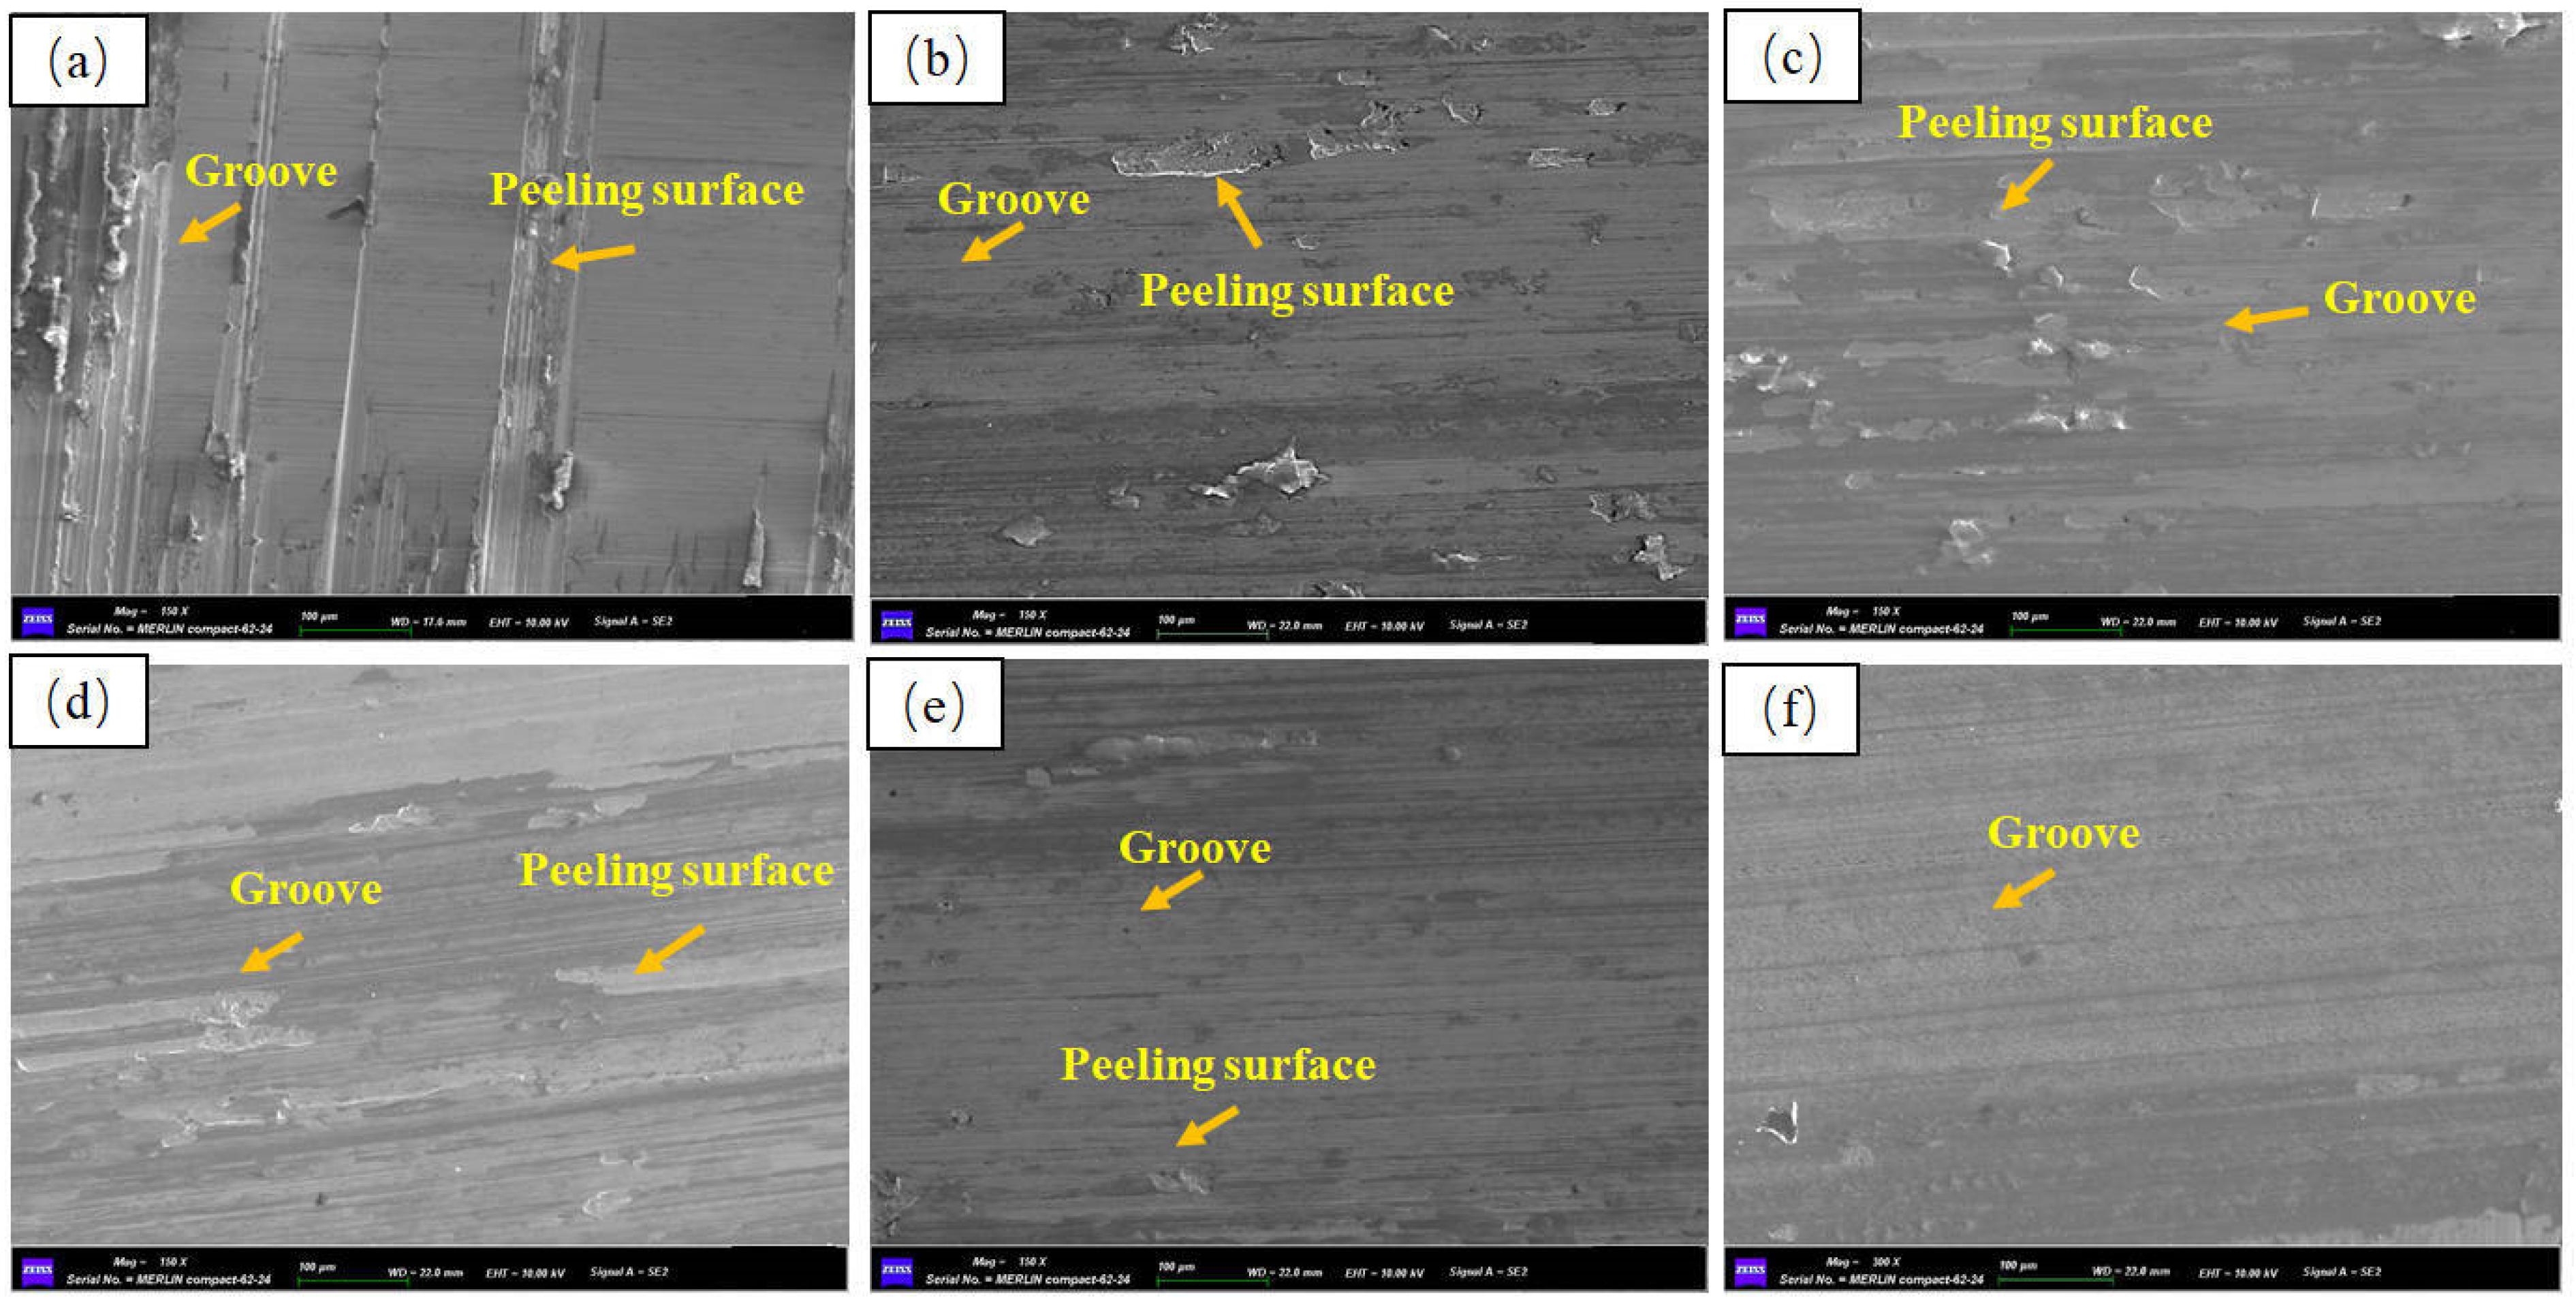
To further analyze the wear mechanism of the laser cladding coating, the wear surface morphology of the laser cladding layer was observed. It can be seen from Figure 9a–e that the wear surface of the unoptimized laser cladding layer contains a large number of grooves and large spalling pits. The microhardness and microstructure of the laser cladding are the key factors determining the wear pattern and wear volume of the coating. The optimized wear pattern is relatively flat compared to other coatings and shows good wear resistance, with shallow and narrow furrows distributed on the contact surface parallel to the wear direction. Due to the high hardness of the optimized laser cladding, the material is torn into abrasive debris by shear force under friction side effect. Part of the debris is detached from the cladding layers, and then some craters are formed, while the other part of the abrasive debris continues to adhere to the surface of the coating in the form of abrasive particles, which generate multiple grooves and form abrasive grain wear. No. 4, No. 6, No. 8, and No. 7 laser cladding layers have similar wear morphology, with some grooves and abrasive chips, and the presence of large-sized grooves including multiple parallel wear directions and large areas of adhesion on the contact surfaces indicate that the coatings have poor wear resistance. Due to the low hardness and weak shear resistance of the coating, the surface of the coating is prone to plastic deformation and wear debris [32]. The shedding wear debris and friction pairs continue to squeeze and slide, causing the wear debris to turn into lumps or layers, and a large amount of wear debris constantly accumulates on the contact surface, and as the experiment proceeds, it gradually adheres to the friction pair. The wear debris further adheres to other wear areas through the friction pair, thus forming adhesive wear. In addition, the crack sensitivity of the optimized cladding layer is greatly reduced, which is also beneficial for improving the wear resistance of the cladding layer. In summary, the wear resistance of the cladding layer optimized by the hierarchical analysis–gray correlation method is improved.
3. Conclusions

This paper adopts the hierarchical structure method, takes the quality of the cladding layer as the goal, uses the crack rate, hardness, and wear volume as the evaluation indicators to establish an evaluation model, and uses the gray correlation analysis method to analyze the test results. The influence on the quality of the cladding layer is obtained. The process parameters from large to small are magnetic field frequency, magnetic field intensity, and laser energy density. The optimized process parameter combination is 33 J/mm2 (scanning laser energy density), 90 Hz (magnetic field frequency), and 90 mT (magnetic field intensity). The laser cladding layer obtained using the optimized process parameters has a good microstructure and morphology, as well as a dense coating free of defects such as porosity and cracks. The wear resistance of the optimized laser cladding layer has been significantly improved. In magnetic field-assisted laser cladding, reasonable magnetic field parameters should be used to obtain better-quality cladding layers.

Author Contributions

L.J.: experimental analysis, review, and editing; K.Q.: conceptualization, investigation, methodology, writing original draft, measurements, and validating the results; H.Z.: review and editing; Y.Y.: software and validating the results; Q.S.: review and editing. All authors have read and agreed to the published version of the manuscript.

Funding

This research was funded by Shandong Provincial Natural Science Foundation, China grant number ZR2023QE084.

Data Availability Statement

The original contributions presented in this study are included in this article, and further inquiries can be directed to the corresponding authors.

Conflicts of Interest

We declare that we do not have any commercial or associative interests that represent a conflict of interest in connection with the submitted work.

References

  1. Barnes, S.; Timms, N.; Bryden, B.; Pashby, I. High power diode laser cladding. J. Mater. Process. Technol. 2003, 138, 411–416. [Google Scholar] [CrossRef]
  2. Li, J.; Zhu, Z.; Peng, Y.; Shen, G. Phase evolution and wear resistance of in-situ synthesized (Cr, W) 23C6-WC composite ceramics reinforced Fe-based composite coatings produced by laser cladding. Vacuum 2021, 190, 110242. [Google Scholar] [CrossRef]
  3. Yang, Y.; Zhang, D.; Yan, W.; Zheng, Y. Microstructure and wear properties of TiCN/Ti coatings on titanium alloy by laser cladding. Opt. Lasers Eng. 2010, 48, 119–124. [Google Scholar] [CrossRef]
  4. Zhu, L.; Xue, P.; Lan, Q.; Meng, G.; Ren, Y.; Yang, Z.; Xu, P.; Liu, Z. Recent research and development status of laser cladding: A review. Opt. Laser Technol. 2021, 138, 106915. [Google Scholar] [CrossRef]
  5. Lizzul, L.; Sorgato, M.; Bertolini, R.; Ghiotti, A. On the influence of laser cladding parameters and number of deposited layers on as-built and machined AISI H13 tool steel multilayered claddings. CIRP J. Manuf. Sci. Technol. 2021, 35, 361–370. [Google Scholar] [CrossRef]
  6. Siddiqui, A.A.; Dubey, A.K. Recent trends in laser cladding and surface alloying. Opt. Laser Technol. 2021, 134, 106619. [Google Scholar] [CrossRef]
  7. Han, X.; Li, C.; Chen, X.; Jia, S. Numerical simulation and experimental study on the composite process of submerged arc cladding and laser cladding. Surf. Coat. Technol. 2022, 439, 128432. [Google Scholar] [CrossRef]
  8. Sun, Y.; Hao, M. Statistical analysis and optimization of process parameters in Ti6Al4V laser cladding using Nd: YAG laser. Opt. Lasers Eng. 2012, 50, 985–995. [Google Scholar] [CrossRef]
  9. Fan, P.; Zhang, G. Study on process optimization of WC-Co50 cermet composite coating by laser cladding. Int. J. Refract. Met. Hard Mater. 2020, 87, 105133. [Google Scholar] [CrossRef]
  10. Wu, S.; Liu, Z.; Gong, Y.; Liang, X.; Wu, Y.; Zhao, X. Analysis of the sequentially coupled thermal–mechanical and cladding geometry of a Ni60A-25% WC laser cladding composite coating. Opt. Laser Technol. 2023, 167, 109595. [Google Scholar] [CrossRef]
  11. Hu, Y.; Wang, Z.; Pang, M. Effect of WC content on laser cladding Ni-based coating on the surface of stainless steel. Mater. Today Commun. 2022, 31, 103357. [Google Scholar] [CrossRef]
  12. Lu, Y.; Yang, C.; Wang, H.; Ma, L.; Xu, M.; Xi, L. Structure, principle, and application of magnetic field-assisted pulsed laser deposition: An overview. Vacuum 2023, 211, 111912. [Google Scholar] [CrossRef]
  13. Liang, G.; Jin, G.; Cui, X.; Qiu, Z.; Wang, J. The directional array TiN-reinforced AlCoCrFeNiTi high-entropy alloy synthesized in situ via magnetic field-assisted laser cladding. Appl. Surf. Sci. 2022, 572, 151407. [Google Scholar] [CrossRef]
  14. Wang, Q.; Zhai, L.L.; Zhang, L.; Zhang, J.W.; Ban, C.Y. Effect of steady magnetic field on microstructure and properties of laser cladding Ni-based alloy coating. J. Mater. Res. Technol. 2022, 17, 2145–2157. [Google Scholar] [CrossRef]
  15. Heng, W.; Pang, M. Microstructure and wear resistance of laser cladding NiCrAlY/TC4 composite coatings with in-situ synthesized transition layer by modulating thermal boundary in nitrogen atmosphere. J. Mater. Sci. 2023, 58, 16119–16143. [Google Scholar] [CrossRef]
  16. Li, J.Y.; Zhan, Z.H.; Li, Y.; Zhang, J. Multiple tasks for multiple objectives: A new multiobjective optimization method via multitask optimization. IEEE Trans. Evol. Comput. 2023. [Google Scholar] [CrossRef]
  17. Pereira, J.L.J.; Oliver, G.A.; Francisco, M.B.; Cunha, S.S., Jr.; Gomes, G.F. A review of multi-objective optimization: Methods and algorithms in mechanical engineering problems. Arch. Comput. Methods Eng. 2022, 29, 2285–2308. [Google Scholar] [CrossRef]
  18. Xu, R.; Jiang, C.; Sun, L. A Novel Three-Way Decision Model for Improving Computational Thinking Based on Grey Correlation Analysis. Sci. Program. 2022, 2022, 3575457. [Google Scholar] [CrossRef]
  19. Ma, M.; Wang, Z.; Zeng, X. A comparison on metallurgical behaviors of 316L stainless steel by selective laser melting and laser cladding deposition. Mater. Sci. Eng. A 2017, 685, 265–273. [Google Scholar] [CrossRef]
  20. Liang, W.; Yang, Y.; Qi, K.; Jin, K.; Xiong, L. Quality evaluation of multi-path laser cladding coatings based on integrated fuzzy comprehensive evaluation and improved analytical hierarchy process method. Surf. Coat. Technol. 2021, 427, 127816. [Google Scholar] [CrossRef]
  21. Saaty, T.L.; Hu, G. Ranking by eigenvector versus other methods in the analytic hierarchy process. Appl. Math. Lett. 1998, 11, 121–125. [Google Scholar] [CrossRef]
  22. Saaty, T.L. A new macroeconomic forecasting and policy evaluation method using the analytic hierarchy process. Math. Model. 1987, 9, 219–231. [Google Scholar] [CrossRef]
  23. Sipahi, S.; Timor, M. The analytic hierarchy process and analytic network process: An overview of applications. Manag. Decis. 2010, 48, 775–808. [Google Scholar] [CrossRef]
  24. Kurttila, M.; Pesonen, M.; Kangas, J.; Kajanus, M. Utilizing the analytic hierarchy process (AHP) in SWOT analysis—A hybrid method and its application to a forest-certification case. For. Policy Econ. 2000, 1, 41–52. [Google Scholar] [CrossRef]
  25. Yan, J.; Li, L. Multi-objective optimization of milling parameters–the trade-offs between energy, production rate and cutting quality. J. Clean. Prod. 2013, 52, 462–471. [Google Scholar] [CrossRef]
  26. Bai, Q.; Ouyang, C.; Zhao, C.; Han, B.; Liu, Y. Microstructure and Wear Resistance of Laser Cladding of Fe-Based Alloy Coatings in Different Areas of Cladding Layer. Materials 2021, 14, 2839. [Google Scholar] [CrossRef]
  27. Song, B.; Yu, T.; Jiang, X.; Xi, W.; Lin, X. Development mechanism and solidification morphology of molten pool generated by laser cladding. Int. J. Therm. Sci. 2021, 159, 106579. [Google Scholar] [CrossRef]
  28. Qi, K.; Jiang, L. Magnetic Field-Assisted Laser Cladding of Cobalt-Based Alloy on 300 M Steel. JOM 2024, 76, 238–249. [Google Scholar] [CrossRef]
  29. Jeyaprakash, N.; Yang, C.H.; Sivasankaran, S. Laser cladding process of Cobalt and Nickel based hard-micron-layers on 316L-stainless-steel-substrate. Mater. Manuf. Process. 2020, 35, 142–151. [Google Scholar] [CrossRef]
  30. Lasalmonie, A.; Strudel, J.L. Influence of grain size on the mechanical behaviour of some high strength materials. J. Mater. Sci. 1986, 21, 1837–1852. [Google Scholar] [CrossRef]
  31. Wenlong, D.; Xuefeng, Y.; Fei, S.; Min, W.; Yeqi, Z.; Zhiyuan, W. Anti-friction and wear resistance analysis of cemented carbide coatings. Int. J. Adv. Manuf. Technol. 2022, 122, 2795–2821. [Google Scholar] [CrossRef]
  32. Zhai, W.; Bai, L.; Zhou, R.; Fan, X.; Kang, G.; Liu, Y.; Zhou, K. Recent progress on wear-resistant materials: Designs, properties, and applications. Adv. Sci. 2021, 8, 2003739. [Google Scholar] [CrossRef] [PubMed]
Figure 1. Flow chart of the hierarchical analysis–gray correlation method.
Crystals 14 00927 g001
Figure 2. Magnetic field-assisted laser cladding process.
Crystals 14 00927 g002
Figure 3. Laser cladding of hierarchical analysis diagram.
Crystals 14 00927 g003
Figure 4. Microstructure of the laser cladding layers.
Crystals 14 00927 g004
Figure 5. Microstructure of optimized laser cladding layer.
Crystals 14 00927 g005
Figure 6. Element distribution in the microcrack area of the No. 7 laser cladding layer.
Crystals 14 00927 g006
Figure 7. Coefficient of friction of laser cladding layer.
Crystals 14 00927 g007
Figure 8. Wear volume of the laser cladding layer.
Crystals 14 00927 g008
Figure 9. Wear surface of the laser cladding layer: (a) No. 4, (b) No. 6, (c) No. 8, (d) No. 7, (e) No. 5, and (f) optimized laser cladding layer.
Crystals 14 00927 g009
Table 1. Level values of each variable in the orthogonal test.
Factor
A/Laser Energy Density
(J/mm2)
B/Magnetic Field Frequency
(Hz)
C/Magnetic Field Intensity
(mT)
1276030
2309060
33312090
Table 2. Orthogonal experimental design of laser cladding process parameters.
No.Factor
A (J/mm2)B (Hz)C (mT)
1276030
2279060
32712090
4306060
5309090
63012030
7336090
8339030
93312060
Table 3. The 1–9-point scale and corresponding definitions.
Digital ScaleInversionDefinition
11Equally important
31/3Moderately important
51/5Strongly important
71/7Extremely important
91/9Completely important
2, 4, 6, 81/2, 1/4, 1/6, 1/8Intermediate value of the above importance
Table 4. Orthogonal experimental results of laser metal deposition.
No.Crack Rate/%Hardness/HVWear Volume/mm3
1107520.061
259200.060
3206830.068
4128110.058
5310120.040
6187640.057
7210080.042
889960.045
9158800.062
Table 5. Raw data normalization and data sequence differences.
No.y1y2y3 1 ( k ) 2 ( k ) 3 ( k )
10.2770.2090.7850.2770.7910.062
20.1660.7200.7140.1660.2800.714
3101111
40.5550.3890.6420.5550.6110.642
50.055100.05500
60.8880.2460.6070.8880.7540.607
700.9870.07100.0130.071
80.3330.9510.1780.3330.0490.178
90.7220.5980.7850.7220.4020.785
Table 6. Gray correlation coefficient and gray correlation degree results.
No.g1 (k)g2 (k)g3 (k)G (k)
10.6430.3870.8890.652
20.7500.6410.4110.682
30.3330.3330.3330.333
40.4730.4500.4370.464
50.901110.928
60.3600.3980.4510.379
710.9740.8750.976
80.6000.9100.7370.658
90.4090.5540.3890.422
Table 7. Average gray correlation coefficients for different levels of cracking rate.
FactorLevel 1Level 2Level 3Range
A0.5750.5780.6690.094
B0.7050.7500.3670.383
C0.5340.5440.7440.210
Table 8. Average gray correlation coefficients for different levels of hardness.
FactorLevel 1Level 2Level 3Range
A0.4530.6160.8120.359
B0.6030.8500.4280.422
C0.5650.5480.7690.221
Table 9. Average gray correlation coefficients for different levels of wear volume.
FactorLevel 1Level 2Level 3Range
A0.5440.6290.6670.123
B0.7330.7160.3910.342
C0.6920.4120.7360.324
Table 10. Average gray correlation degree of each level of process parameters.
FactorLevel 1Level 2Level 3Range
A0.5240.6070.7160.192
B0.6800.7720.3950.377
C0.5970.5010.7490.248
Disclaimer/Publisher’s Note: The statements, opinions and data contained in all publications are solely those of the individual author(s) and contributor(s) and not of MDPI and/or the editor(s). MDPI and/or the editor(s) disclaim responsibility for any injury to people or property resulting from any ideas, methods, instructions or products referred to in the content.