2.2. Modeling and Experimental Design
In this study, the laser energy density, alternating magnetic field intensity, and alternating magnetic field frequency were used as independent variables, and the quality of laser cladding was evaluated based on gray correlation analysis with orthogonal test data. Taking the crack rate, hardness, and friction coefficient of the deposited layer as evaluation indexes, the correlation coefficients of the process parameters to the single-objective function and the correlation degree of the multi-objective function were calculated by using the gray theory, and then the comprehensive objective optimization was carried out according to the gray correlation degree; the optimization problem of multiple process objectives was converted into the optimization problem of a single gray correlation degree to achieve the optimization of the process objectives and obtain the optimal process parameter combinations.
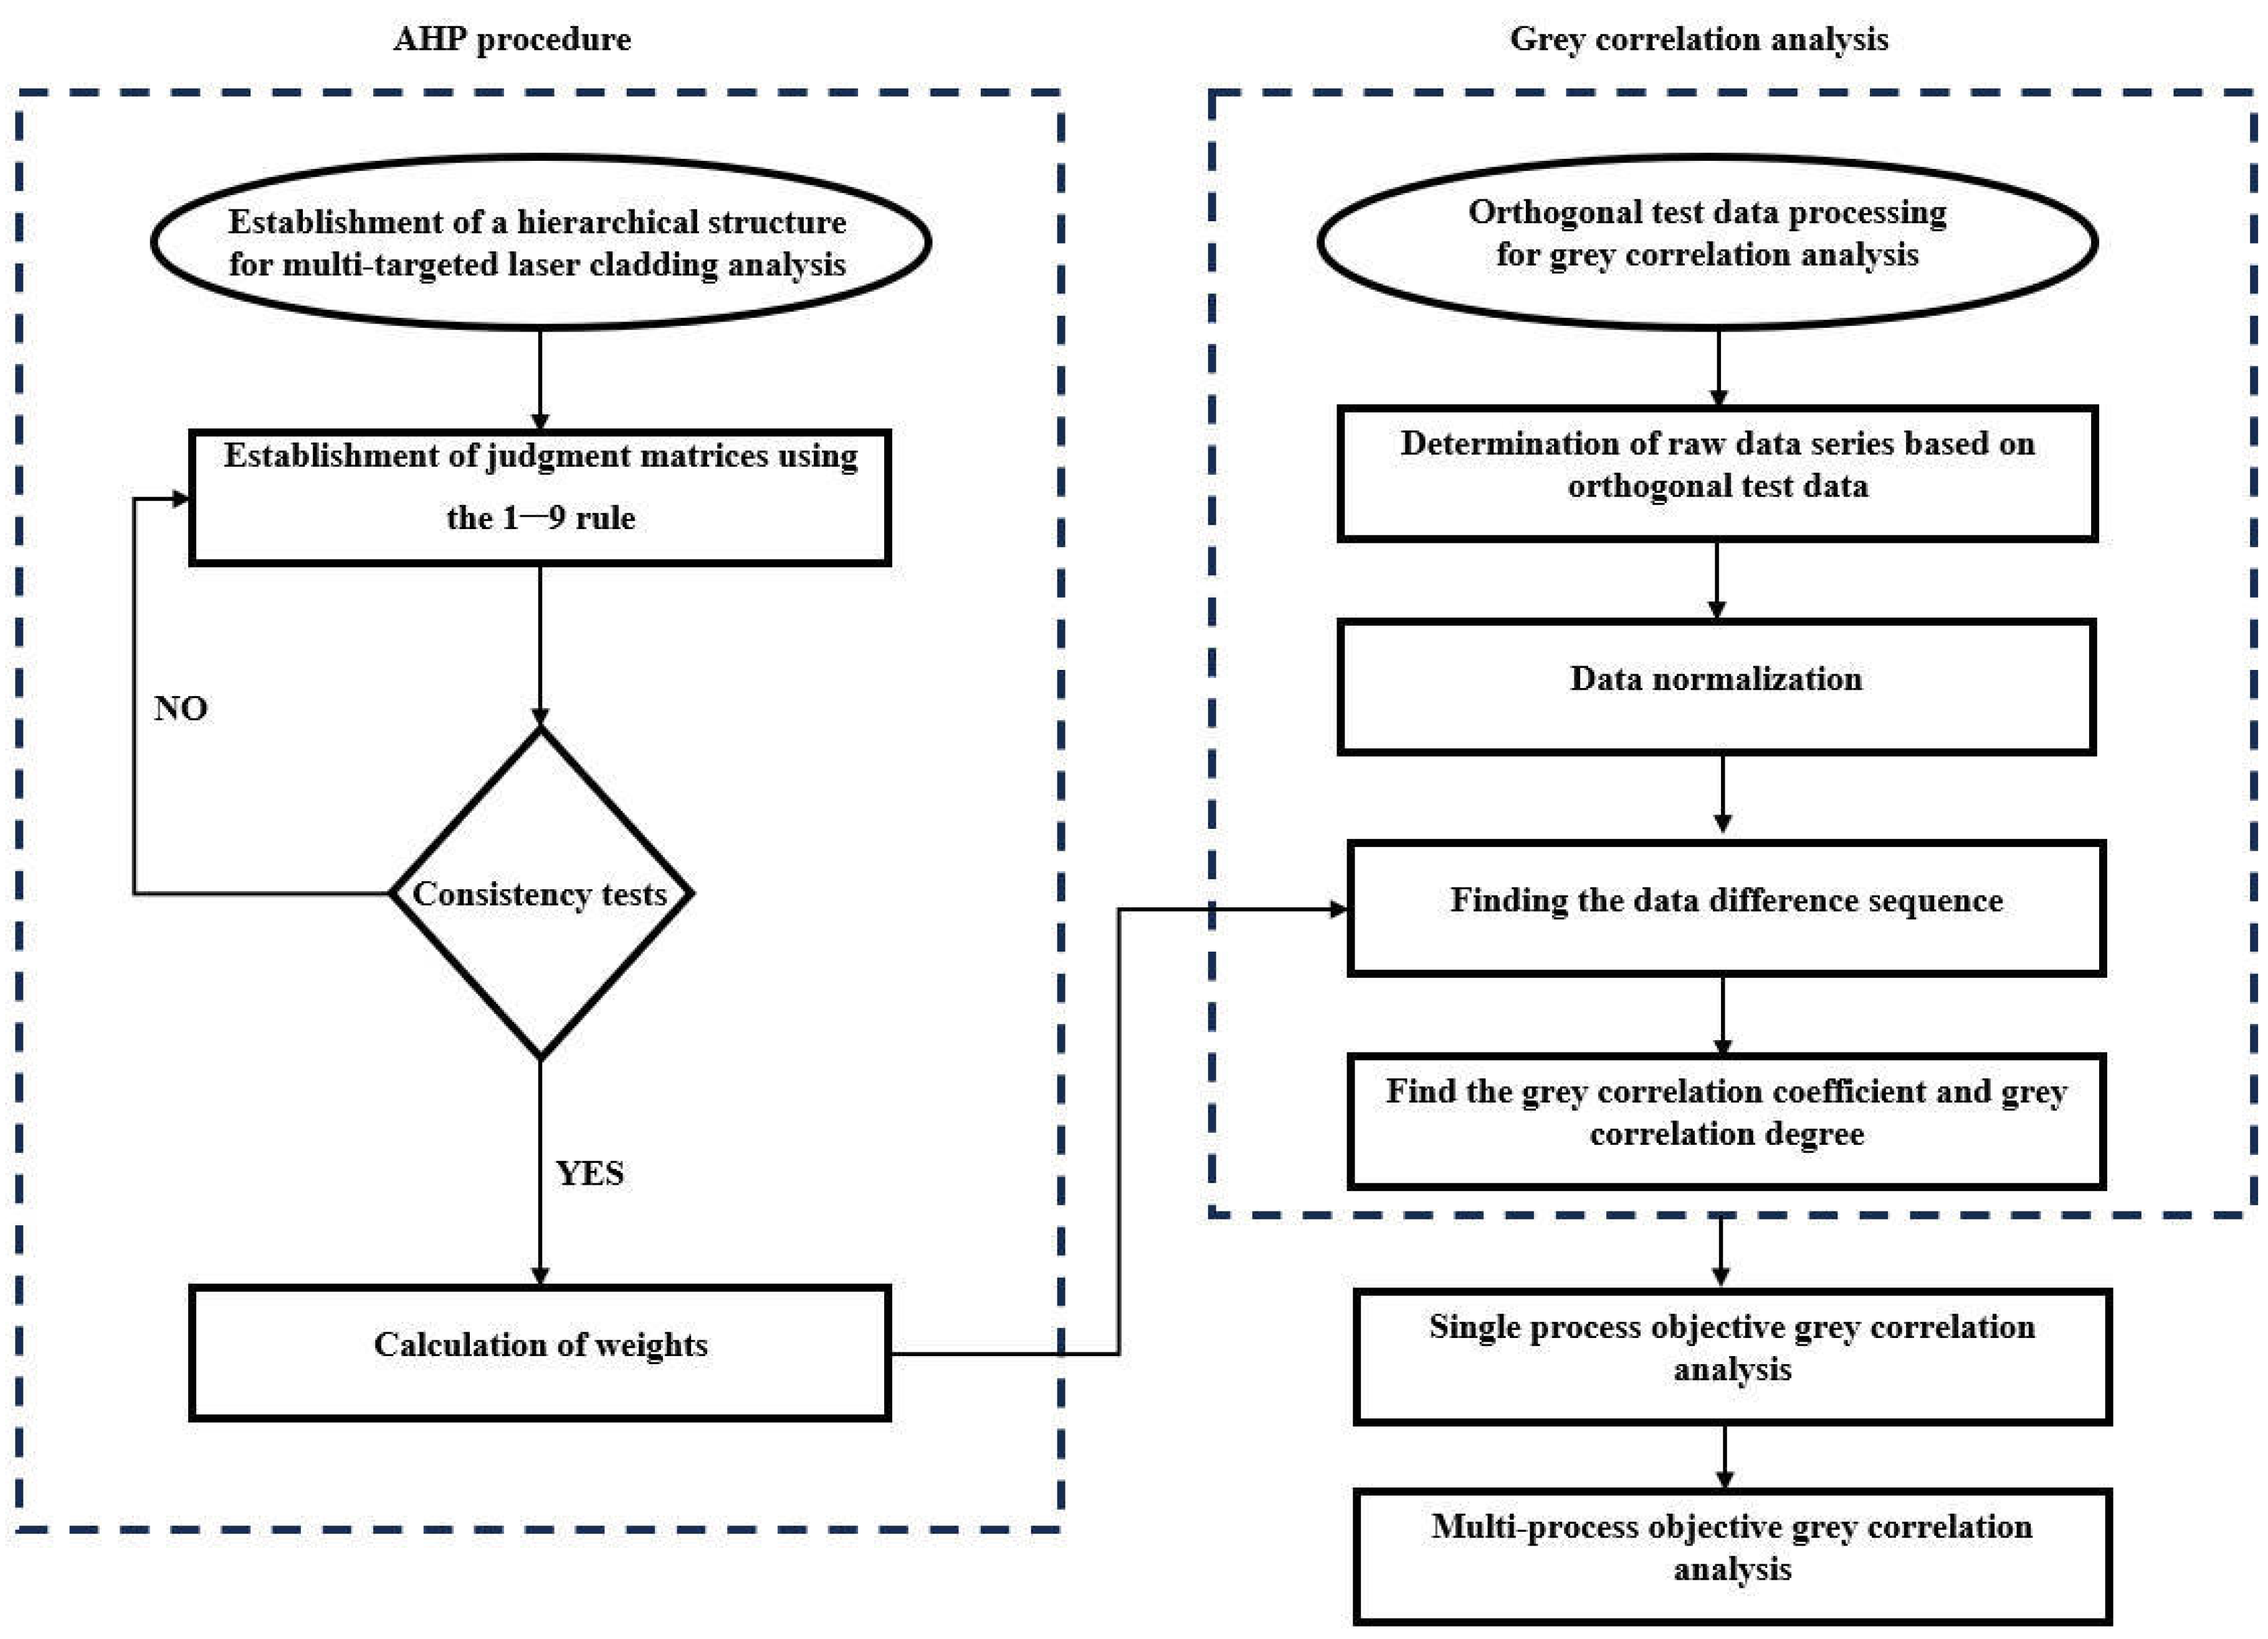
Figure 1 shows the flow chart of the hierarchical analysis–gray correlation method. Multi-process objective gray correlation: Multi-objective optimization is a type of complex optimization method in reality. The improvement of one objective performance in multi-objective optimization may lead to a change in the performance of another or more objectives. Multi-objective optimization is a dynamic development process in which multiple objectives compromise with each other. Generally, it is impossible to obtain a solution that makes multiple objectives reach the optimal state. Only a set of optimal solutions that compromise with each other can be obtained [
16]. In multi-objective optimization, choosing a reasonable optimization method is a key factor affecting the performance of multi-objective algorithms [
17]. Gray correlation analysis is a simple and effective method for dealing with uncertain or partially insufficient information problems. The gray correlation degree in gray correlation analysis is an indicator to measure whether the dynamic development sequence is closely connected [
18]. It is suitable for the analysis of the dynamic system development process. The gray correlation degree is used to determine the complex relationship between the test sample behavior sequences. This approach is used in decision-making, helping to identify the best process configurations and parameters based on multiple criteria.
Multi-targeted laser cladding analysis involves analyzing the effects of laser cladding on multiple targets or objectives, such as microstructural and mechanical properties. The analysis can include the evaluation of different laser parameters to achieve desired outcomes. Integrating multi-process objective gray correlation with multi-targeted laser cladding analysis can lead to enhanced decision-making and optimized processes in manufacturing.
In the laser cladding process, laser power (P), laser scanning speed (V), and laser spot diameter (D) are the main laser processing parameters, and to facilitate the experimental design and data statistics, the laser energy density is used in this study as an index to measure the laser processing parameters. Different laser energy densities can be obtained by changing the laser processing parameters. The laser energy density formula is shown below [
19]:
In this experiment, an alternating magnetic field is used to assist in the shaping of the laser cladding layer, and the magnetic field intensity and magnetic field frequency are chosen as the parameters of the alternating magnetic field. The orthogonal table of L
9(3
3) was used for the orthogonal test, and three levels were taken for each variable, as shown in
Table 1. The crack rate, hardness, and wear volume of the laser cladding layer were taken as the evaluation indexes. The orthogonal experimental design of laser cladding process parameters is shown in
Table 2.
2.5. Evaluation Methodology
In the problem of multi-objective optimization of laser cladding, it is difficult to ensure that each process objective is in the optimum state; each process objective cannot be treated equally, so the emphasis on each process objective is different according to the specific service requirements of the coatings. The importance of individual process objectives is generally expressed in terms of weights, and the importance of integrated process objectives is generally determined in the form of weight summation. In this paper, we adopt a scale method from 1 to 9 to determine the weights of the comprehensive process objectives [
20]. The calculation process is as follows:
Hierarchical analysis consists of three top–down structural levels: objective level, criterion level, and plan level. The objective level is usually the overall goal used for decision-making; the criterion level is the classification to which parts of the plan level belong; and the plan level is the relevant elements needed to solve the problem. Based on the actual problem and the final decision, each factor is categorized according to the above levels, and the logical levels provide a narrative of the intrinsic relationships of the relevant elements. The hierarchical analysis structure is shown in
Figure 3.
- 2.
Establishment of the judgment matrix
The judgment matrix is developed from the nine-point scale in
Table 3, where the numbers need to be filled in by experts in the relevant fields to compare two and two elements in the same hierarchy [
21,
22,
23]. The general form of the judgment matrix is shown in Equation (2).
where a
ij indicates the importance of factor i to factor j, which needs to be satisfied:
The judgment matrix for the criterion in this study can be identified as follows:
Based on the above judgment matrix method, the comparison judgment matrix for the plan level is
- 3.
Weighting calculation
The algorithm of geometric mean to obtain judgment weights is calculated as follows:
Based on Equation (4), the judgment weights can be obtained: V1 = 1.500, V2 = 8.000, V3 = 0.083.
Calculate the third root of the judgment weight:
Based on Equation (5), the third root of the judgment weight can be obtained: .
The sub-goal weights can be expressed as:
The weight X of the criterion level to the plan level can be obtained: X = (0.320, 0.558, 0.122). Based on the above calculation method, the calculated weights of the objective level concerning the plan level are X1 = (0.773, 0.087, 0.140), X2 = (0.709, 0.112, 0.179), and X3 = (0.661, 0.208, 0.131).
- 4.
Hierarchical total ordering
Develop a weighting matrix for the objective level with respect to the plan level:
The overall hierarchical ranking is
Thus, it can be obtained that W = (0.723, 0.116, 0.161).
According to the analytic hierarchy process consistency test method, this result meets the test requirements of the analytic hierarchy process [
24]. Therefore, the weights of laser energy density, magnetic field frequency, and magnetic field intensity relative to reasonable processing process parameters are 0.723, 0.116, and 0.161, respectively.
- 5.
Determination of raw data series for gray correlation analysis
A set of data sequences
under each process objective in the experimental results shown in
Table 4. Here, i is the indicator representing crack rate, hardness, and wear volume, i = 1, 2, 3, and k is the experimental sequence number, k = 1, 2, 3, 4, 5, 6, 7, 8, 9.
- 6.
Standardization of gray relational data.
Since the dimensions of the original data sequences are different, the original data sequences need to be dimensionless. The calculation formula is
In the formula,
is the normalized value of the kth experimental value under index i. The results of the original data normalization and data sequence difference are shown in
Table 5.
- 7.
Finding the data difference sequence.
The formula for calculating the data difference sequence is as follows:
In the formula,
is the ideal value under the process target of index I, the ideal value of crack rate and wear volume is 0, and the ideal value of hardness is 1. The results are shown in
Table 5.
- 8.
Finding the gray correlation coefficient and gray correlation degree.
The calculation formula for the gray correlation coefficient is
In the formula, ρ is the resolution coefficient, which is taken as 0.5.
Gray correlation degree disclosure can be expressed as
Calculate the gray correlation coefficient and gray correlation degree of the corresponding parameters according to Equations (10) and (11). The results are shown in
Table 6.
- 9.
Univariate analysis
The correlation coefficient indicates the degree of association of every single factor with the desired parameter, so it can be used to analyze the single factors. According to the data calculated in
Table 6, the gray correlation analysis of single process objectives is carried out for crack rate, hardness, and wear volume in the laser cladding results, respectively.
Table 7,
Table 8 and
Table 9 display the average gray correlation coefficients for each process objective that were derived from the gray correlation coefficients corresponding to various levels of each parameter in
Table 6.
The combination of process parameters with the highest average correlation value is the optimal one, according to the concept of gray correlation. As shown in
Table 7, the optimal combination of process parameters is A3B1C3. This combination includes level 3 parameters for factor A (laser energy density), level 1 parameters for factor B (magnetic field frequency), and level 3 parameters for factor C (magnetic field intensity).
According to the range column analysis in
Table 7, the impact order on the crack rate of the cladding layer, from large to small, is magnetic field frequency, magnetic field intensity, and laser energy density.
Table 8 shows that the best process parameter combination for hardness is A3B2C3, that is, the combination of factor A (laser energy density) level 3 parameters, factor B (magnetic field frequency) level 2 parameters, and factor C (magnetic field intensity) level 3 parameters. According to the range column analysis in
Table 8, the impact order on the hardness of the cladding layer, from large to small, is magnetic field frequency, laser energy density, and magnetic field intensity.
Table 9 indicates that for the laser cladding wear volume, the optimal process parameter combination is A3B1C3, that is, factor A (laser energy density) level 3 parameter, factor B (magnetic field frequency) level 1 parameter, and factor C (magnetic field intensity) level 3 combination of parameters. According to the range column analysis in
Table 9, the effects on the wear volume of the cladding layer from large to small are magnetic field frequency, magnetic field intensity, and laser energy density.
- 10.
Gray relational analysis of multi-process targets
Multi-process target optimization was carried out for the crack rate, hardness, and wear volume of the cladding layer; that is, gray correlation analysis was performed on the optimization objects. The analysis results are shown in
Table 10.
According to the nature of gray correlation, the magnitude of gray correlation reflects the degree of influence of different levels of each process parameter on multiple process objectives. Comparing the process levels, the level with the highest gray correlation value is the optimal level for the combined optimization of multiple process objectives [
25]. The following conclusions are obtained:
- (a)
The gray correlation ranking of the influence of laser energy density on cladding layer quality is: A3 > A2 > A1;
- (b)
The gray correlation ranking of the influence of magnetic field frequency on cladding layer quality is B2 > B1 > B3;
- (c)
The gray correlation ranking of the influence of magnetic field intensity on cladding layer quality is C3 > C1 > C2.
Consequently, A3B2C3 is the optimal process parameter combination for the cladding layer’s quality, which is 33 J/mm
2 (scanning laser energy density), 90 Hz (magnetic field frequency), and 90 mT (magnetic field intensity). In addition, according to the range column analysis in
Table 9, the process parameters that have an impact on the quality of the cladding layer from large to small are magnetic field frequency, magnetic field intensity, and laser energy density.
2.6. Results and Discussion
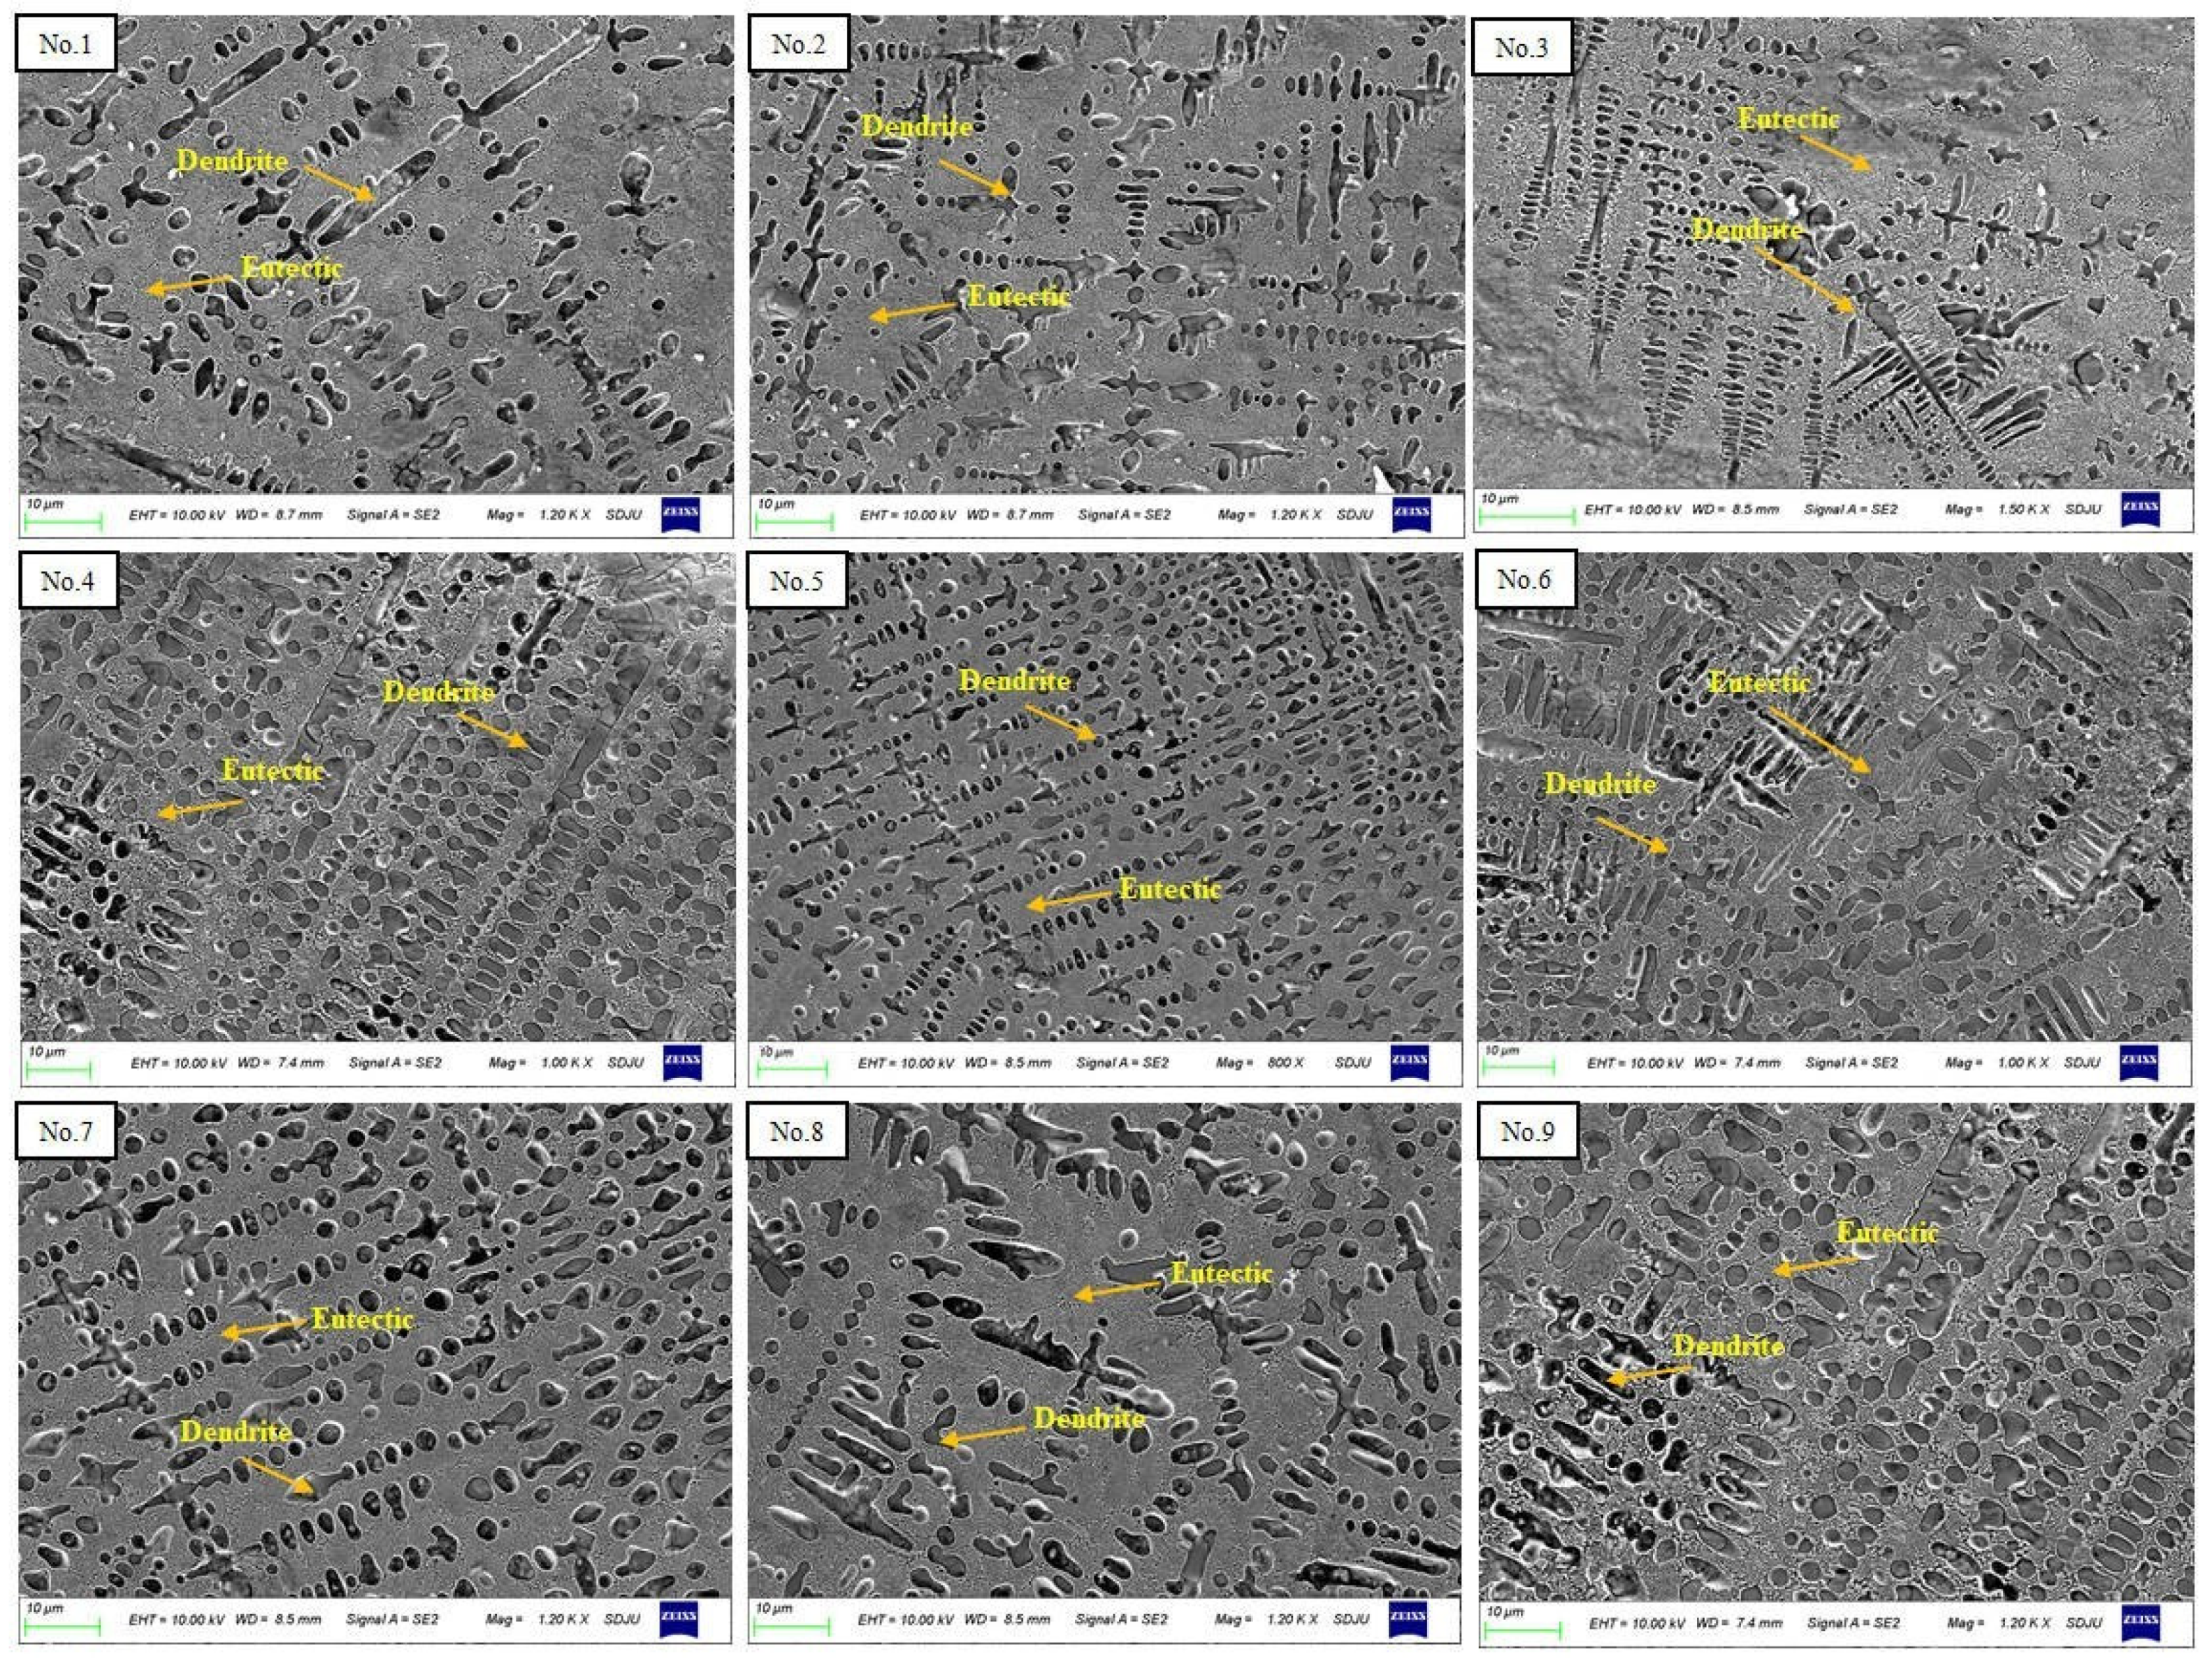
The laser cladding layer’s microstructure is shown in
Figure 4. The cladding layer’s microstructure is primarily made up of eutectics and dendrites. The size of the dendrites in the microstructure has an important influence on the mechanical and wear-resistant properties of the cladding layer [
26]. The microstructure sizes of the laser cladding layers No. 1–No. 9 were 12.9 μm, 12.8 μm, 15.1 μm, 15.2 μm, 14.8 μm, 11.3 μm, 15.1 μm, 15.6 μm, and 14.9 μm. The microscopic size of the dendrite tends to rise as the laser energy density increases. The average microstructure size of the laser cladding layers No. 1–No. 3 was 13.6 μm; the average microstructure size of the laser cladding layers No. 4–No. 6 was 13.7 μm; and the average microstructure size of the laser cladding layers No. 7–No. 9 was 15.2 μm.
This phenomenon may be due to the fact that a higher laser energy density increases the heat input to the laser cladding layer, which raises the temperature of the molten pool and prolongs the existence of the molten pool, leading to the full growth of the dendritic microstructure [
27]. It is worth noting that an increase in the frequency of the external magnetic field does not lead to a decrease in the size of the dendrites at the same laser energy density parameter. In samples No. 1–No. 3, the microstructure size of the cladding layer increases abnormally with an increase in the frequency of the magnetic field. Similarly, the increase in magnetic field intensity does not necessarily lead to a decrease in the microstructure size of the cladding layer.
When the magnetic field intensity and magnetic field frequency are very small, the Lorentz force and Joule heating effect on the metal melt are very small, and the degree of refinement of the grain size is not obvious. As the magnetic field intensity and magnetic field frequency increase, the two effects of the magnetic field on the microstructure are enhanced. If the Lorentz force’s effect on the solidification microstructure is greater than the Joule heating effect, the grains will be refined. When the two effects are equivalent, the grain refinement effect is the best [
28]. Thereafter, as the magnetic field intensity and magnetic field frequency increase, the Joule heating effect on the solidification microstructure is greater than the Lorentz force, and the grains begin to grow larger, reaching a certain level, and the grains appear larger than those without magnetic field treatment. This shows that it is not that the greater the magnetic field intensity and magnetic field frequency, the higher the refinement effect of the magnetic field effect on the microstructure of the laser cladding layer.
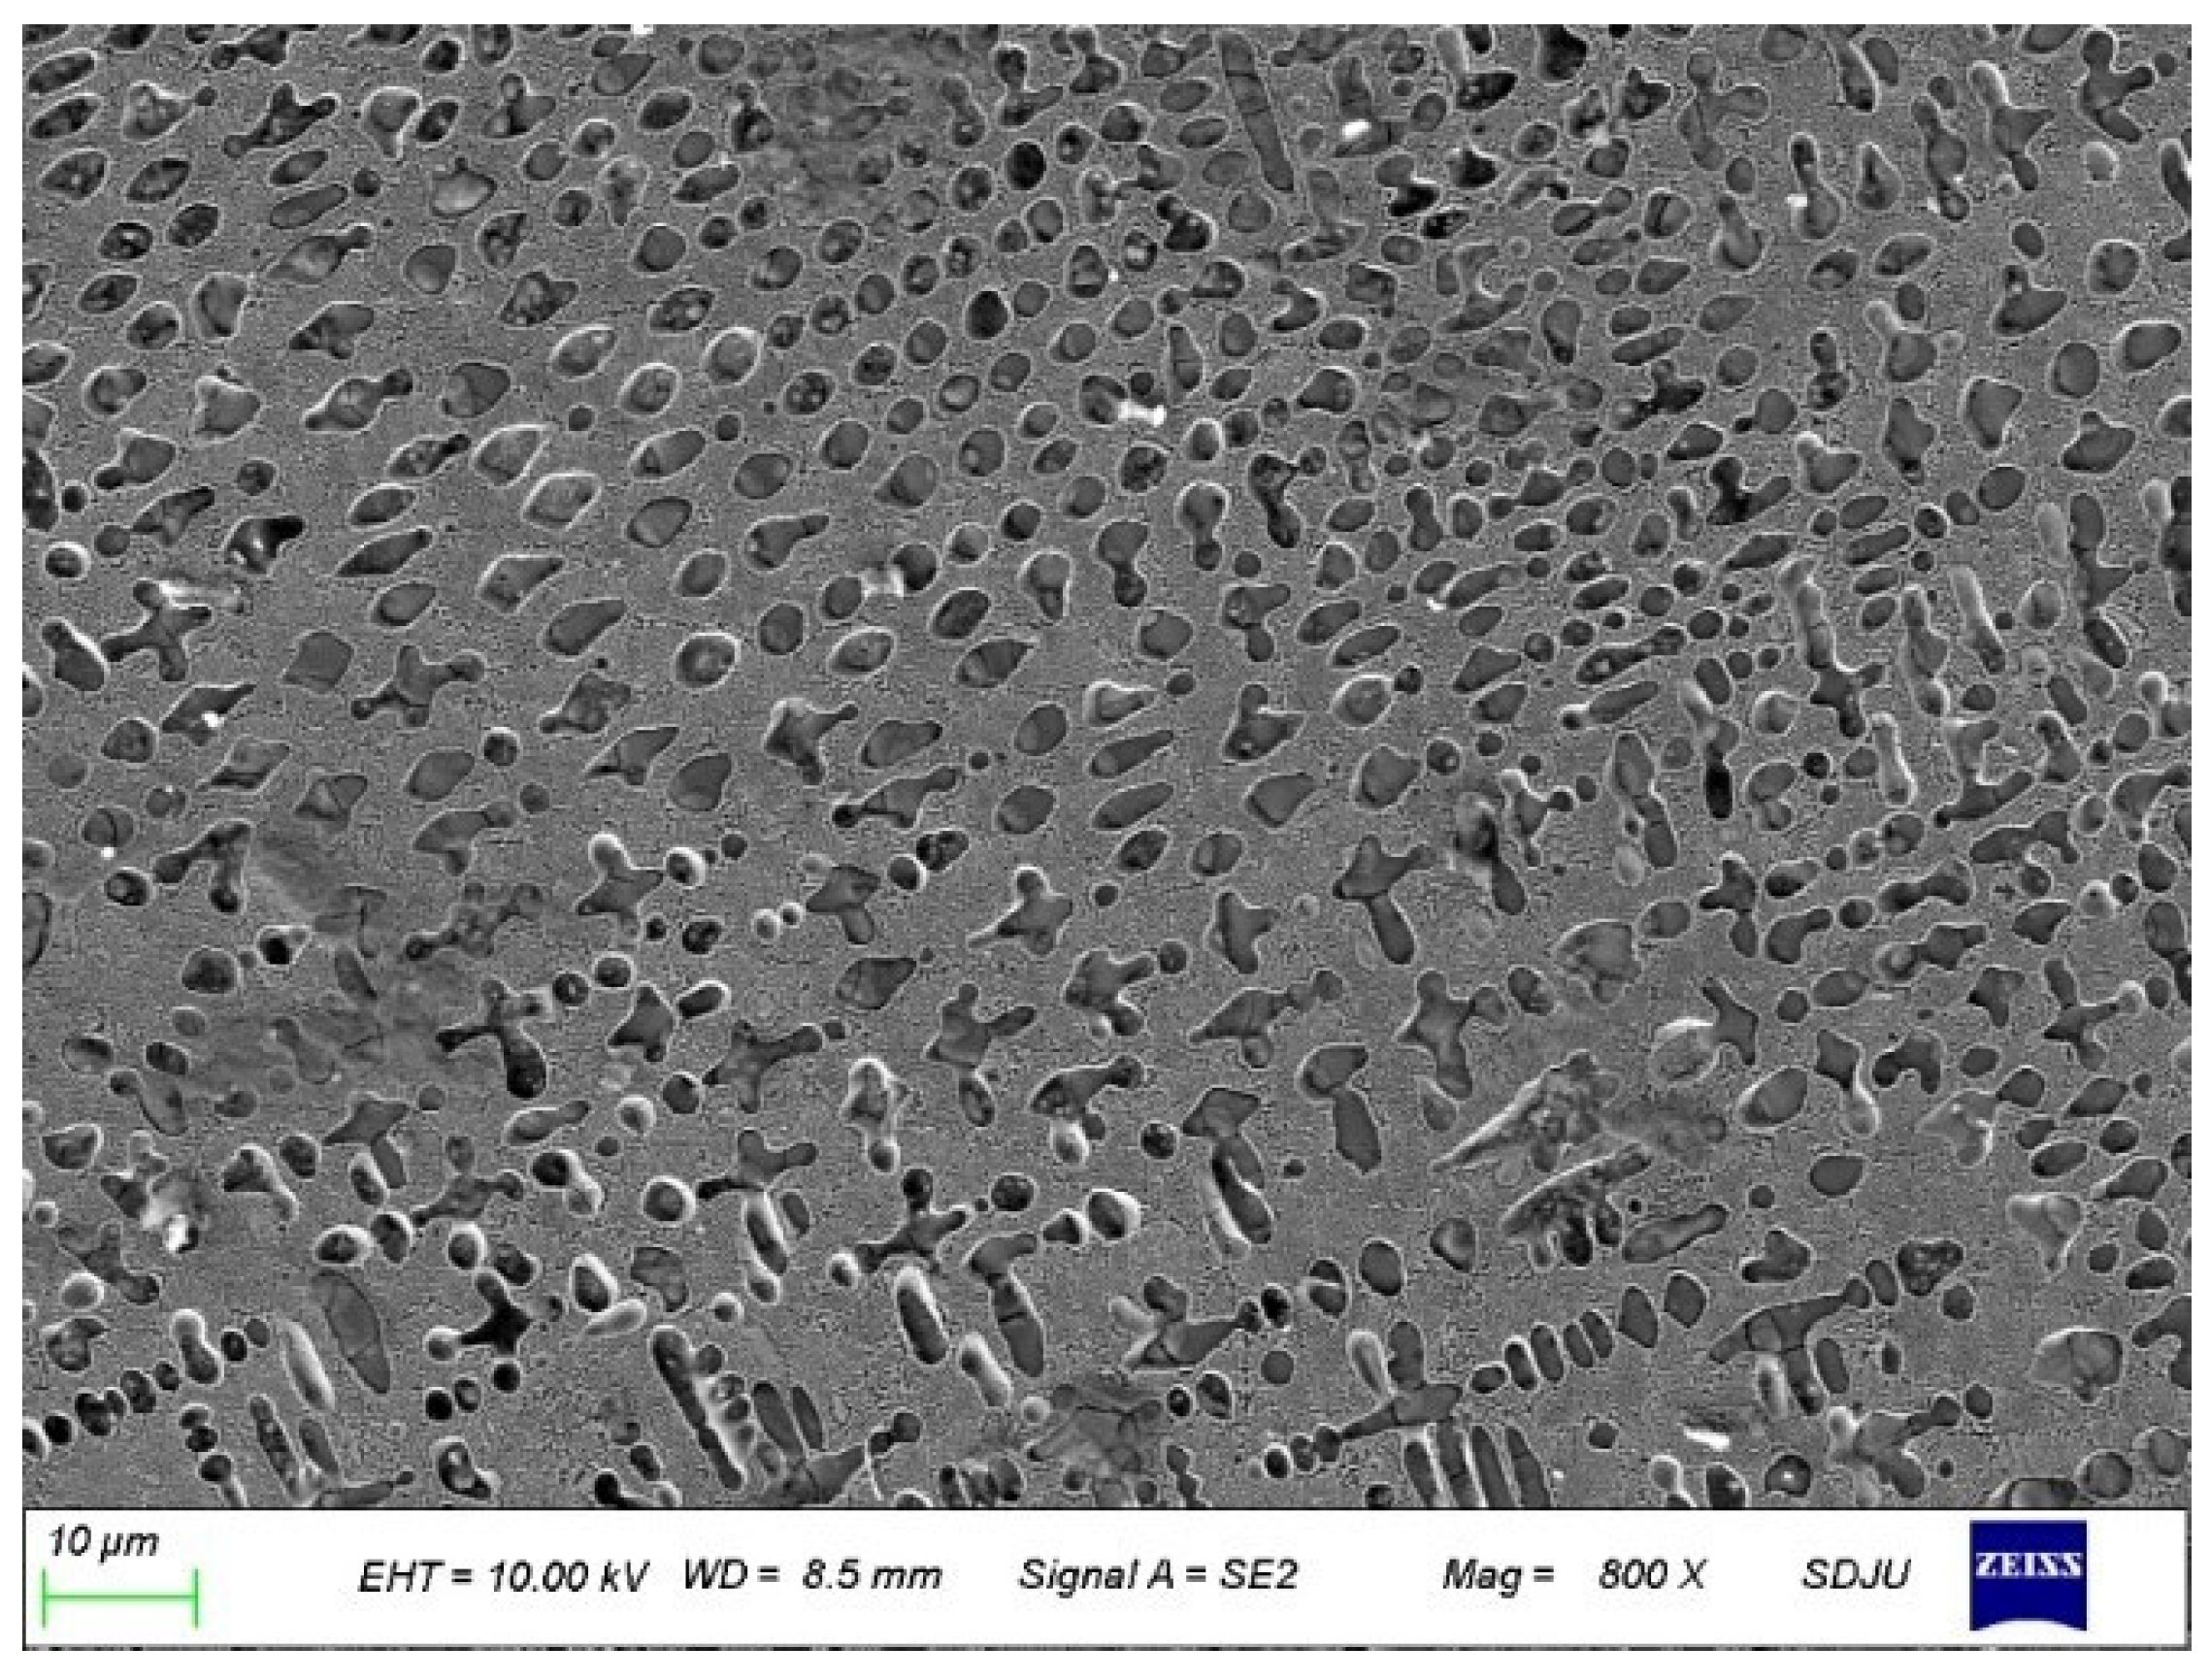
The microstructure of the laser cladding layer optimized by the hierarchical analysis–gray correlation method is shown in
Figure 5. The dendrite size in the microstructure of the optimized laser cladding layer is 4.81 μm, which is much lower than that of the unoptimized cladding layer, and the dendrite morphology tends to be equiaxed. This shows that the hierarchical analysis–gray correlation method is effective in optimizing the microstructure size of the laser cladding layer.
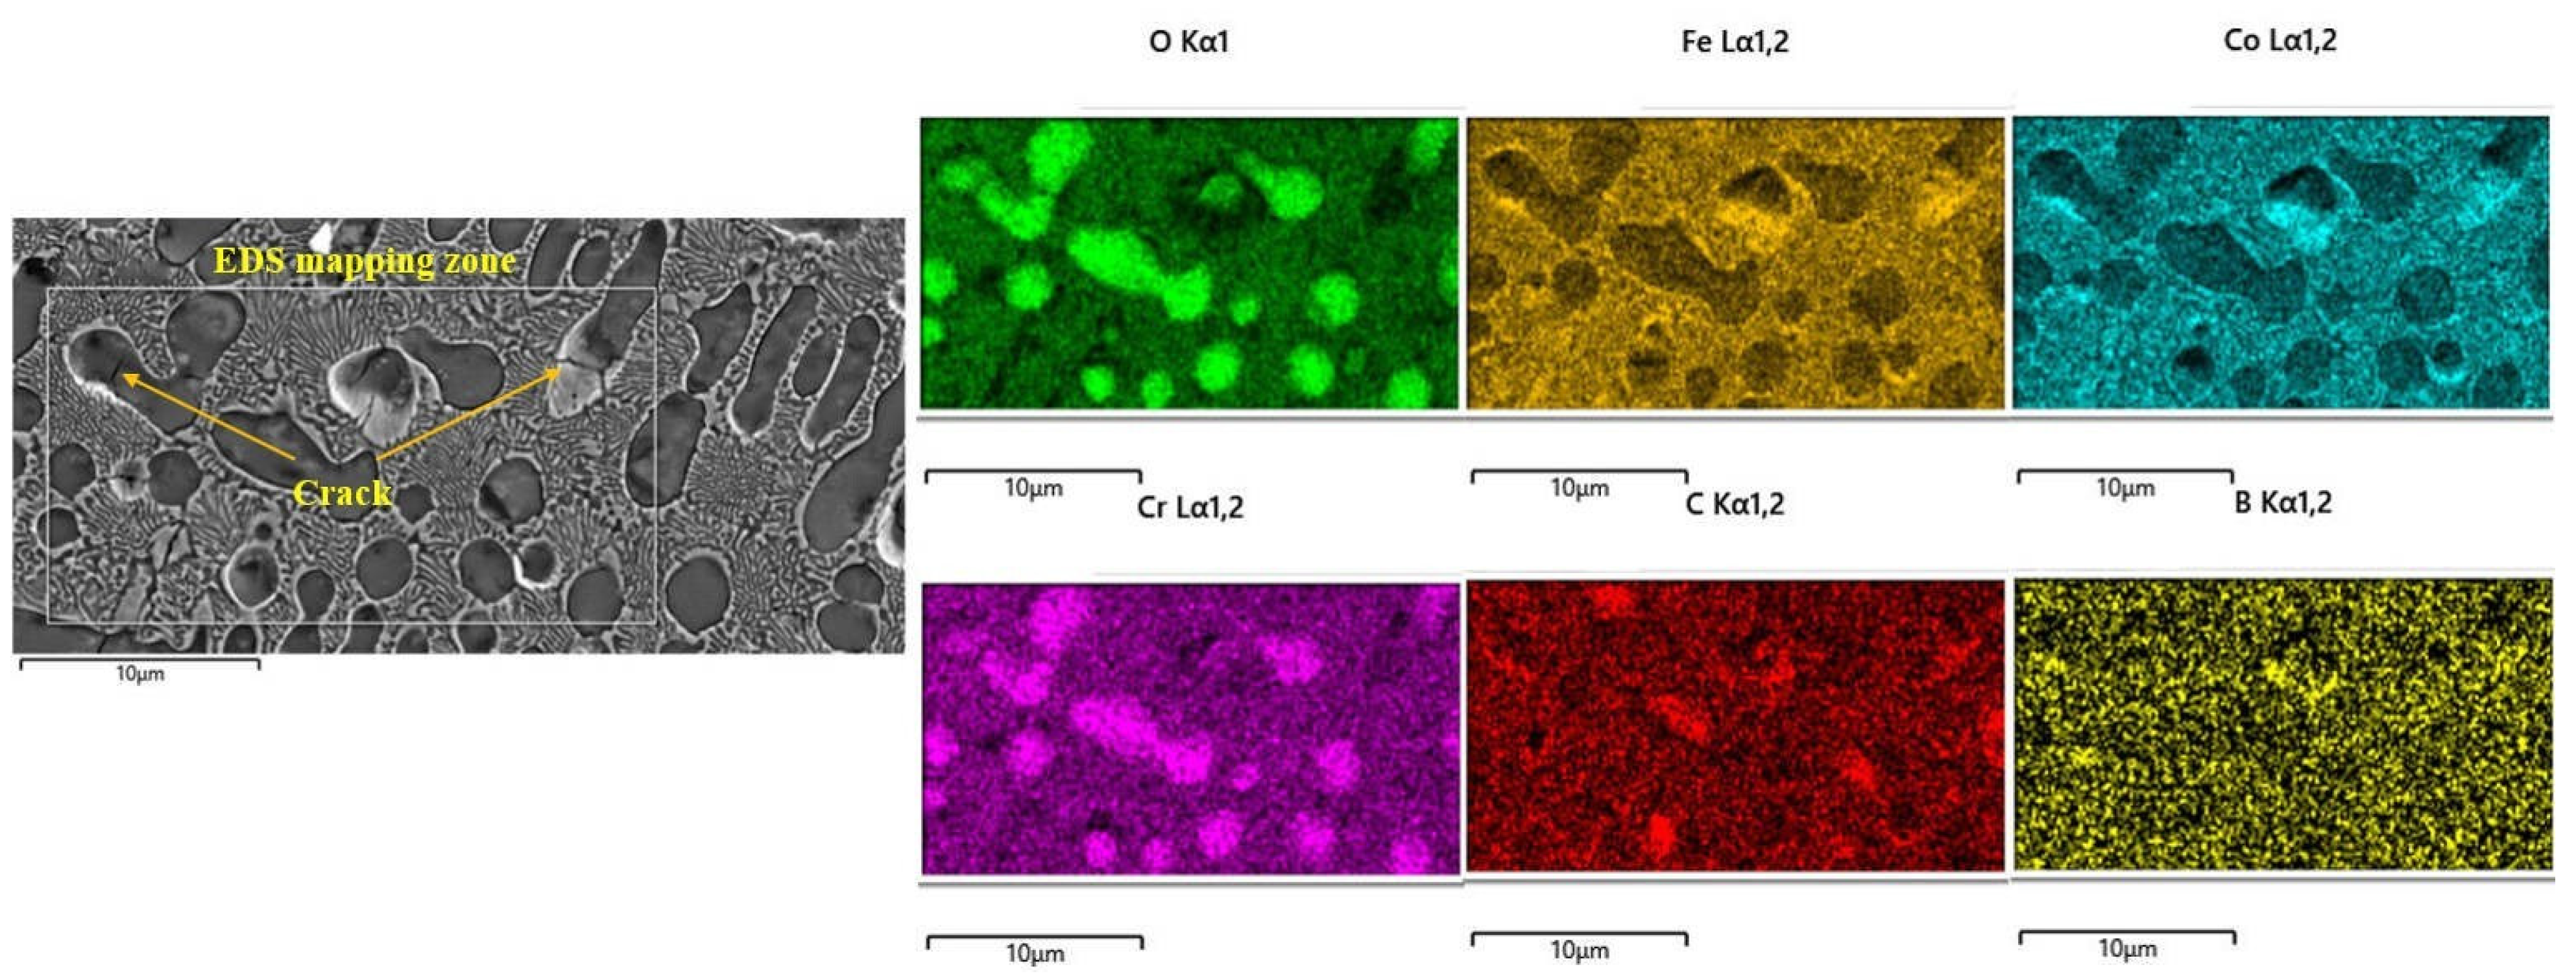
Many microcracks were found in the unoptimized laser cladding layer. To further analyze the characteristics of microcracks,
Figure 6 shows the element distribution in the microcrack area of the No. 7 laser cladding layer. Obvious Cr oxides were found in the dendrites of the cladding layer. Due to the low toughness of CrO and the large thermal stress existing during the laser cladding process, it is easy to cause microcracks in this area [
29]. It is worth noting that the cracks are mainly concentrated in the dendrite, and no obvious cracks are found in the eutectic microstructure.
This shows that the generation of laser cladding cracks is closely related to the generation of metal oxides, and the dendrite microstructure has greater crack sensitivity than the eutectic microstructure. This phenomenon could be caused by the laser cladding layer’s consecutive solidification and shaping. Metal oxides often have higher melting points and solidify before the eutectic structure. Due to the existence of higher thermal stress, metals with lower toughness are oxidized. The material is pulled apart, causing microcracks. The eutectic microstructure forms later, and thermal stress causes cracks in the dendrites and also reduces the stress, so it is difficult to initiate cracks in the eutectic microstructure. There are no cracks in the optimized laser cladding layer, which shows that the crack sensitivity of the cladding layer optimized by the hierarchical analysis–gray correlation method is greatly reduced. The reason for the reduction in cracks in the cladding layer is related to the refinement of the optimized microstructure. The smaller dendrite size is conducive to strengthening the strength of the cladding layer, thereby reducing crack sensitivity.
The change in hardness of the laser cladding layer after optimization can reach 1100 HV. The hardness is improved compared to non-optimized laser cladding layers. This behavior can be explained by the optimized laser cladding layer’s finer microstructure and lower dendritic size when compared to the unoptimized laser cladding layer. The Hall–Petch criterion states that strength increases with decreasing grain size [
30]. Therefore, the hardness of the optimized laser cladding layer is improved.
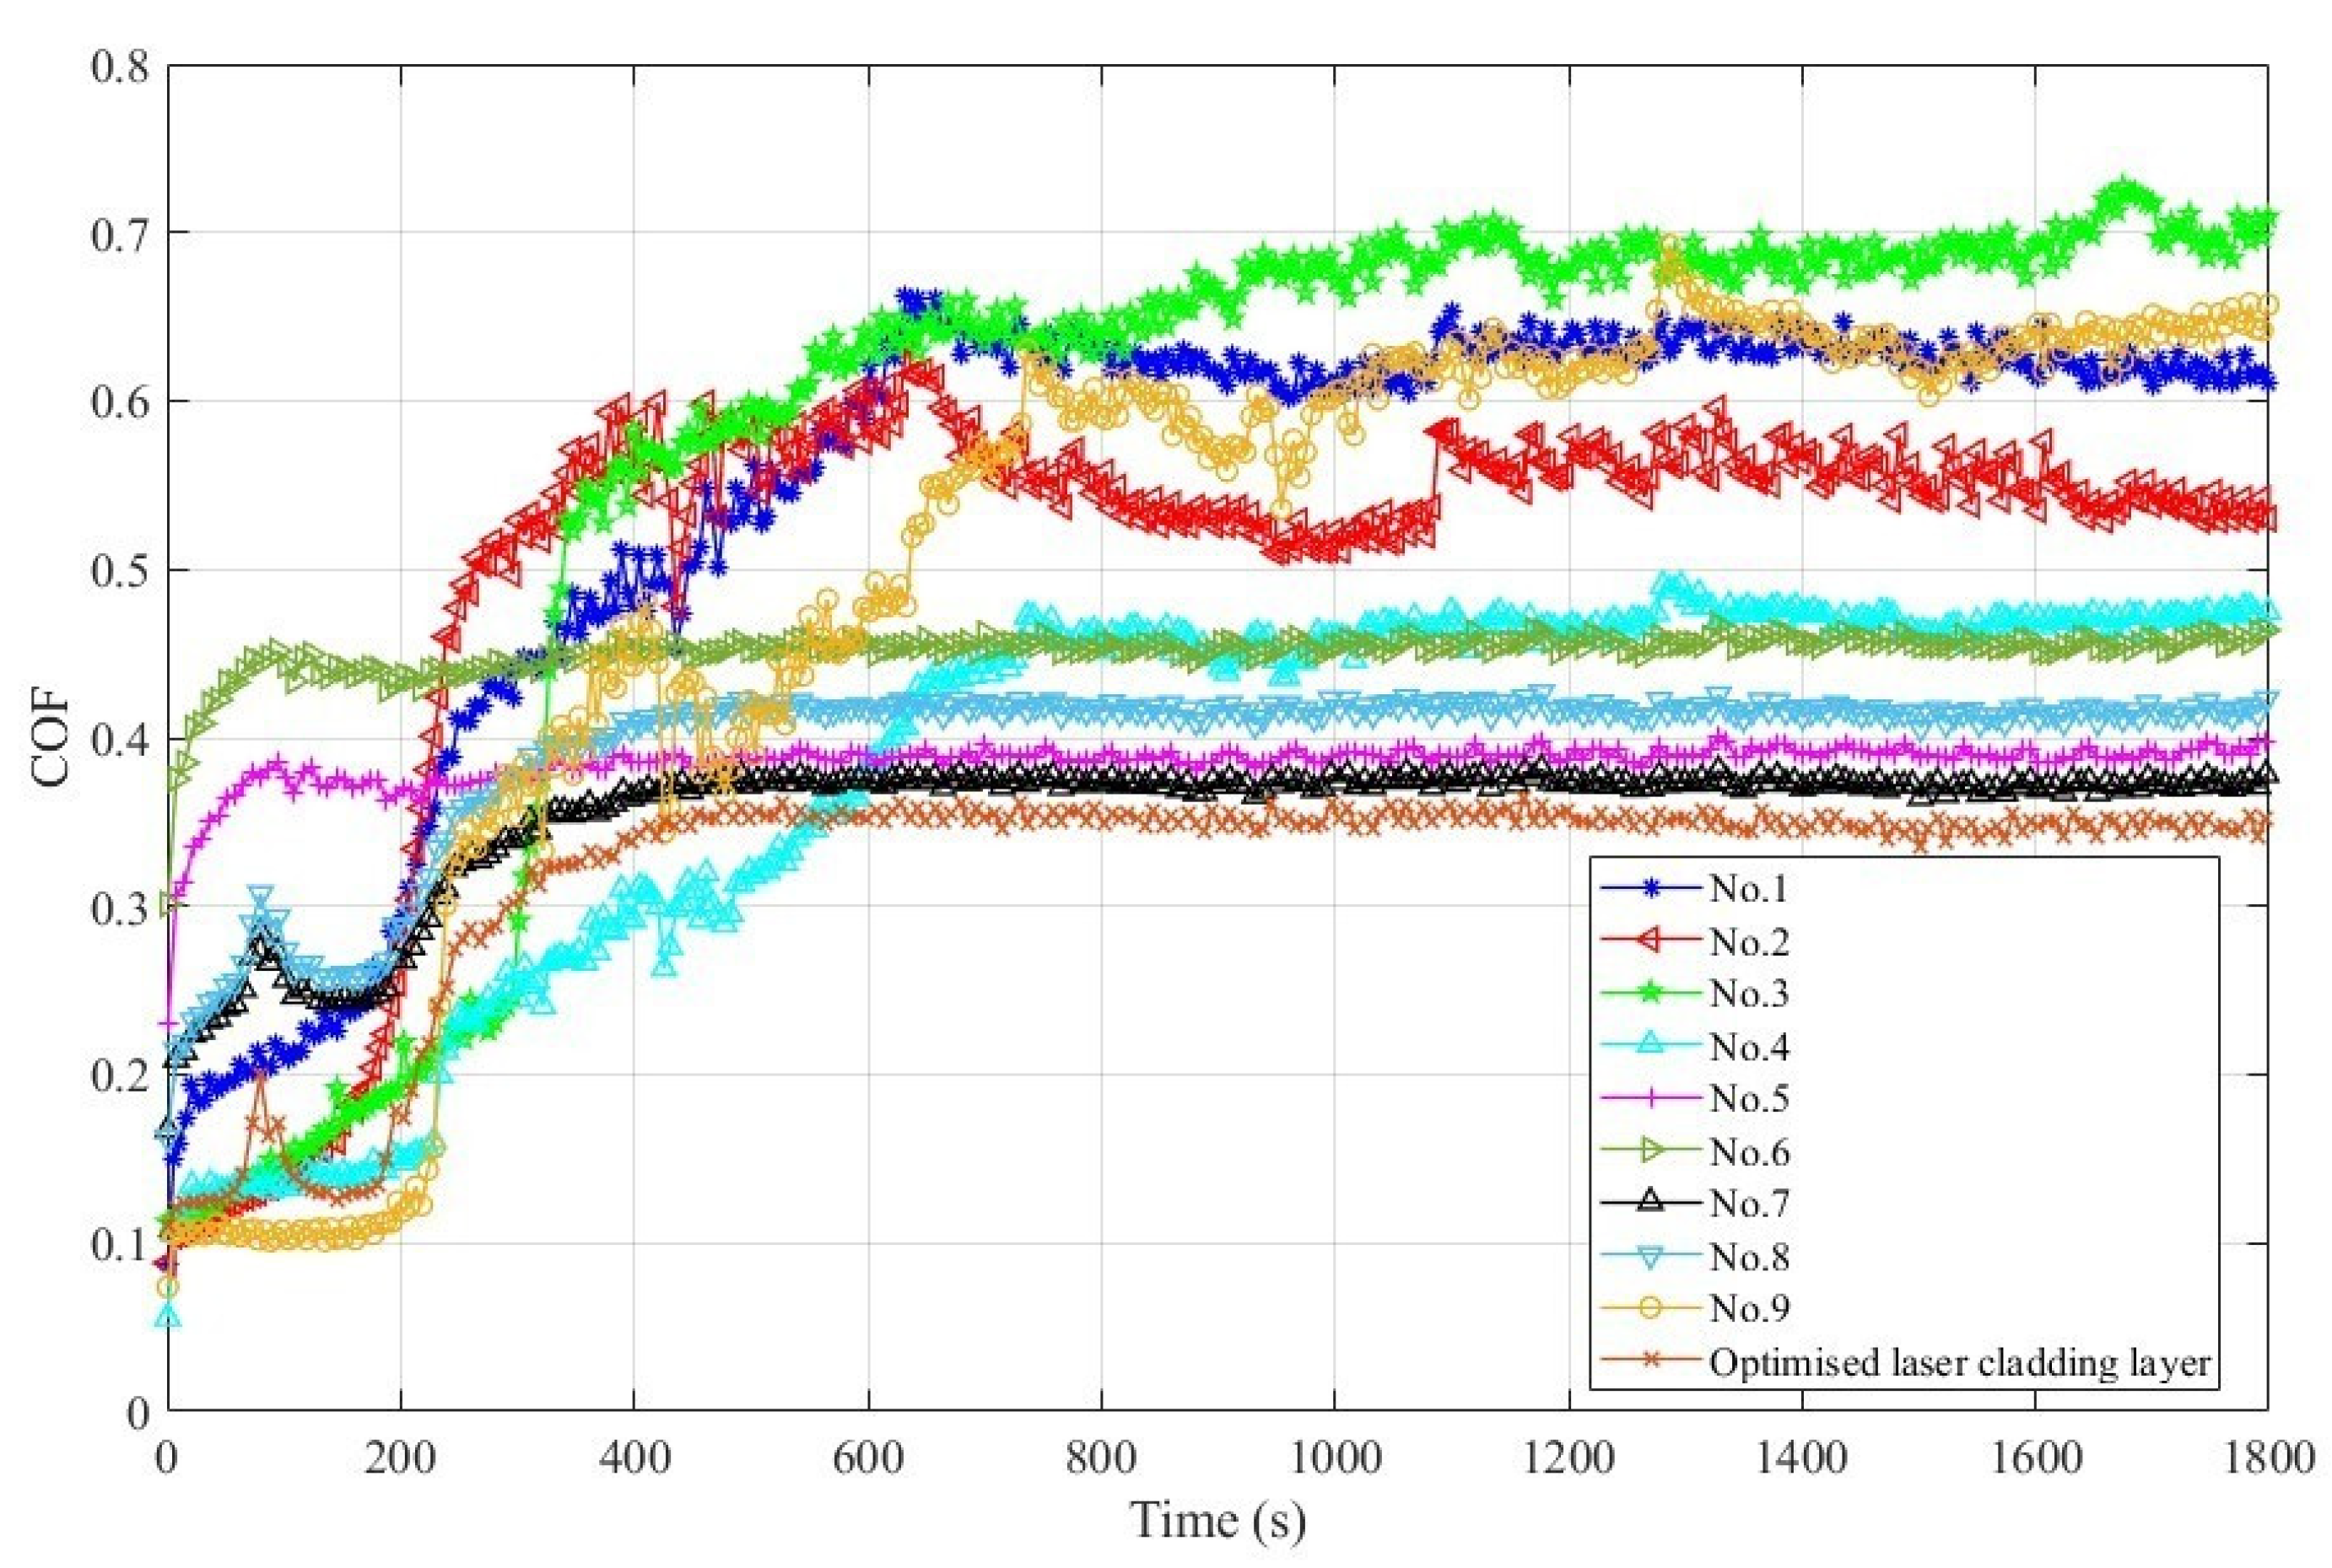
The laser cladding layer’s coefficient of friction (COF) curve is displayed in
Figure 7 for room-temperature dry friction experimental conditions.
Friction experiments are usually divided into two stages: break-in and steady wear. It can be seen from
Figure 7 that in the early stage of the friction and wear experiment, the wear is in the running-in stage, the friction coefficient is small, and the fluctuation is large. The reason is that in the early stage of the friction and wear experiment, the contact form between the grinding ball and the coating surface is point contact, and the contact area is small. The contact surface is smooth, resulting in lower friction between the coatings and the grinding ball. As the friction and wear experiment proceeds, a large amount of debris begins to be generated on the contact surface, which affects subsequent experiments and gradually increases the coefficient of friction. On the other hand, changes in surface roughness cause the contact form to change from point contact to surface contact. The contact surface gradually becomes larger, causing the coefficient of friction to fluctuate within a certain range, and the wear tends to a stable state. It can also be seen from
Figure 7 that the coefficient of friction of the optimized coating is the most stable among all samples, and the friction coefficient is the lowest.
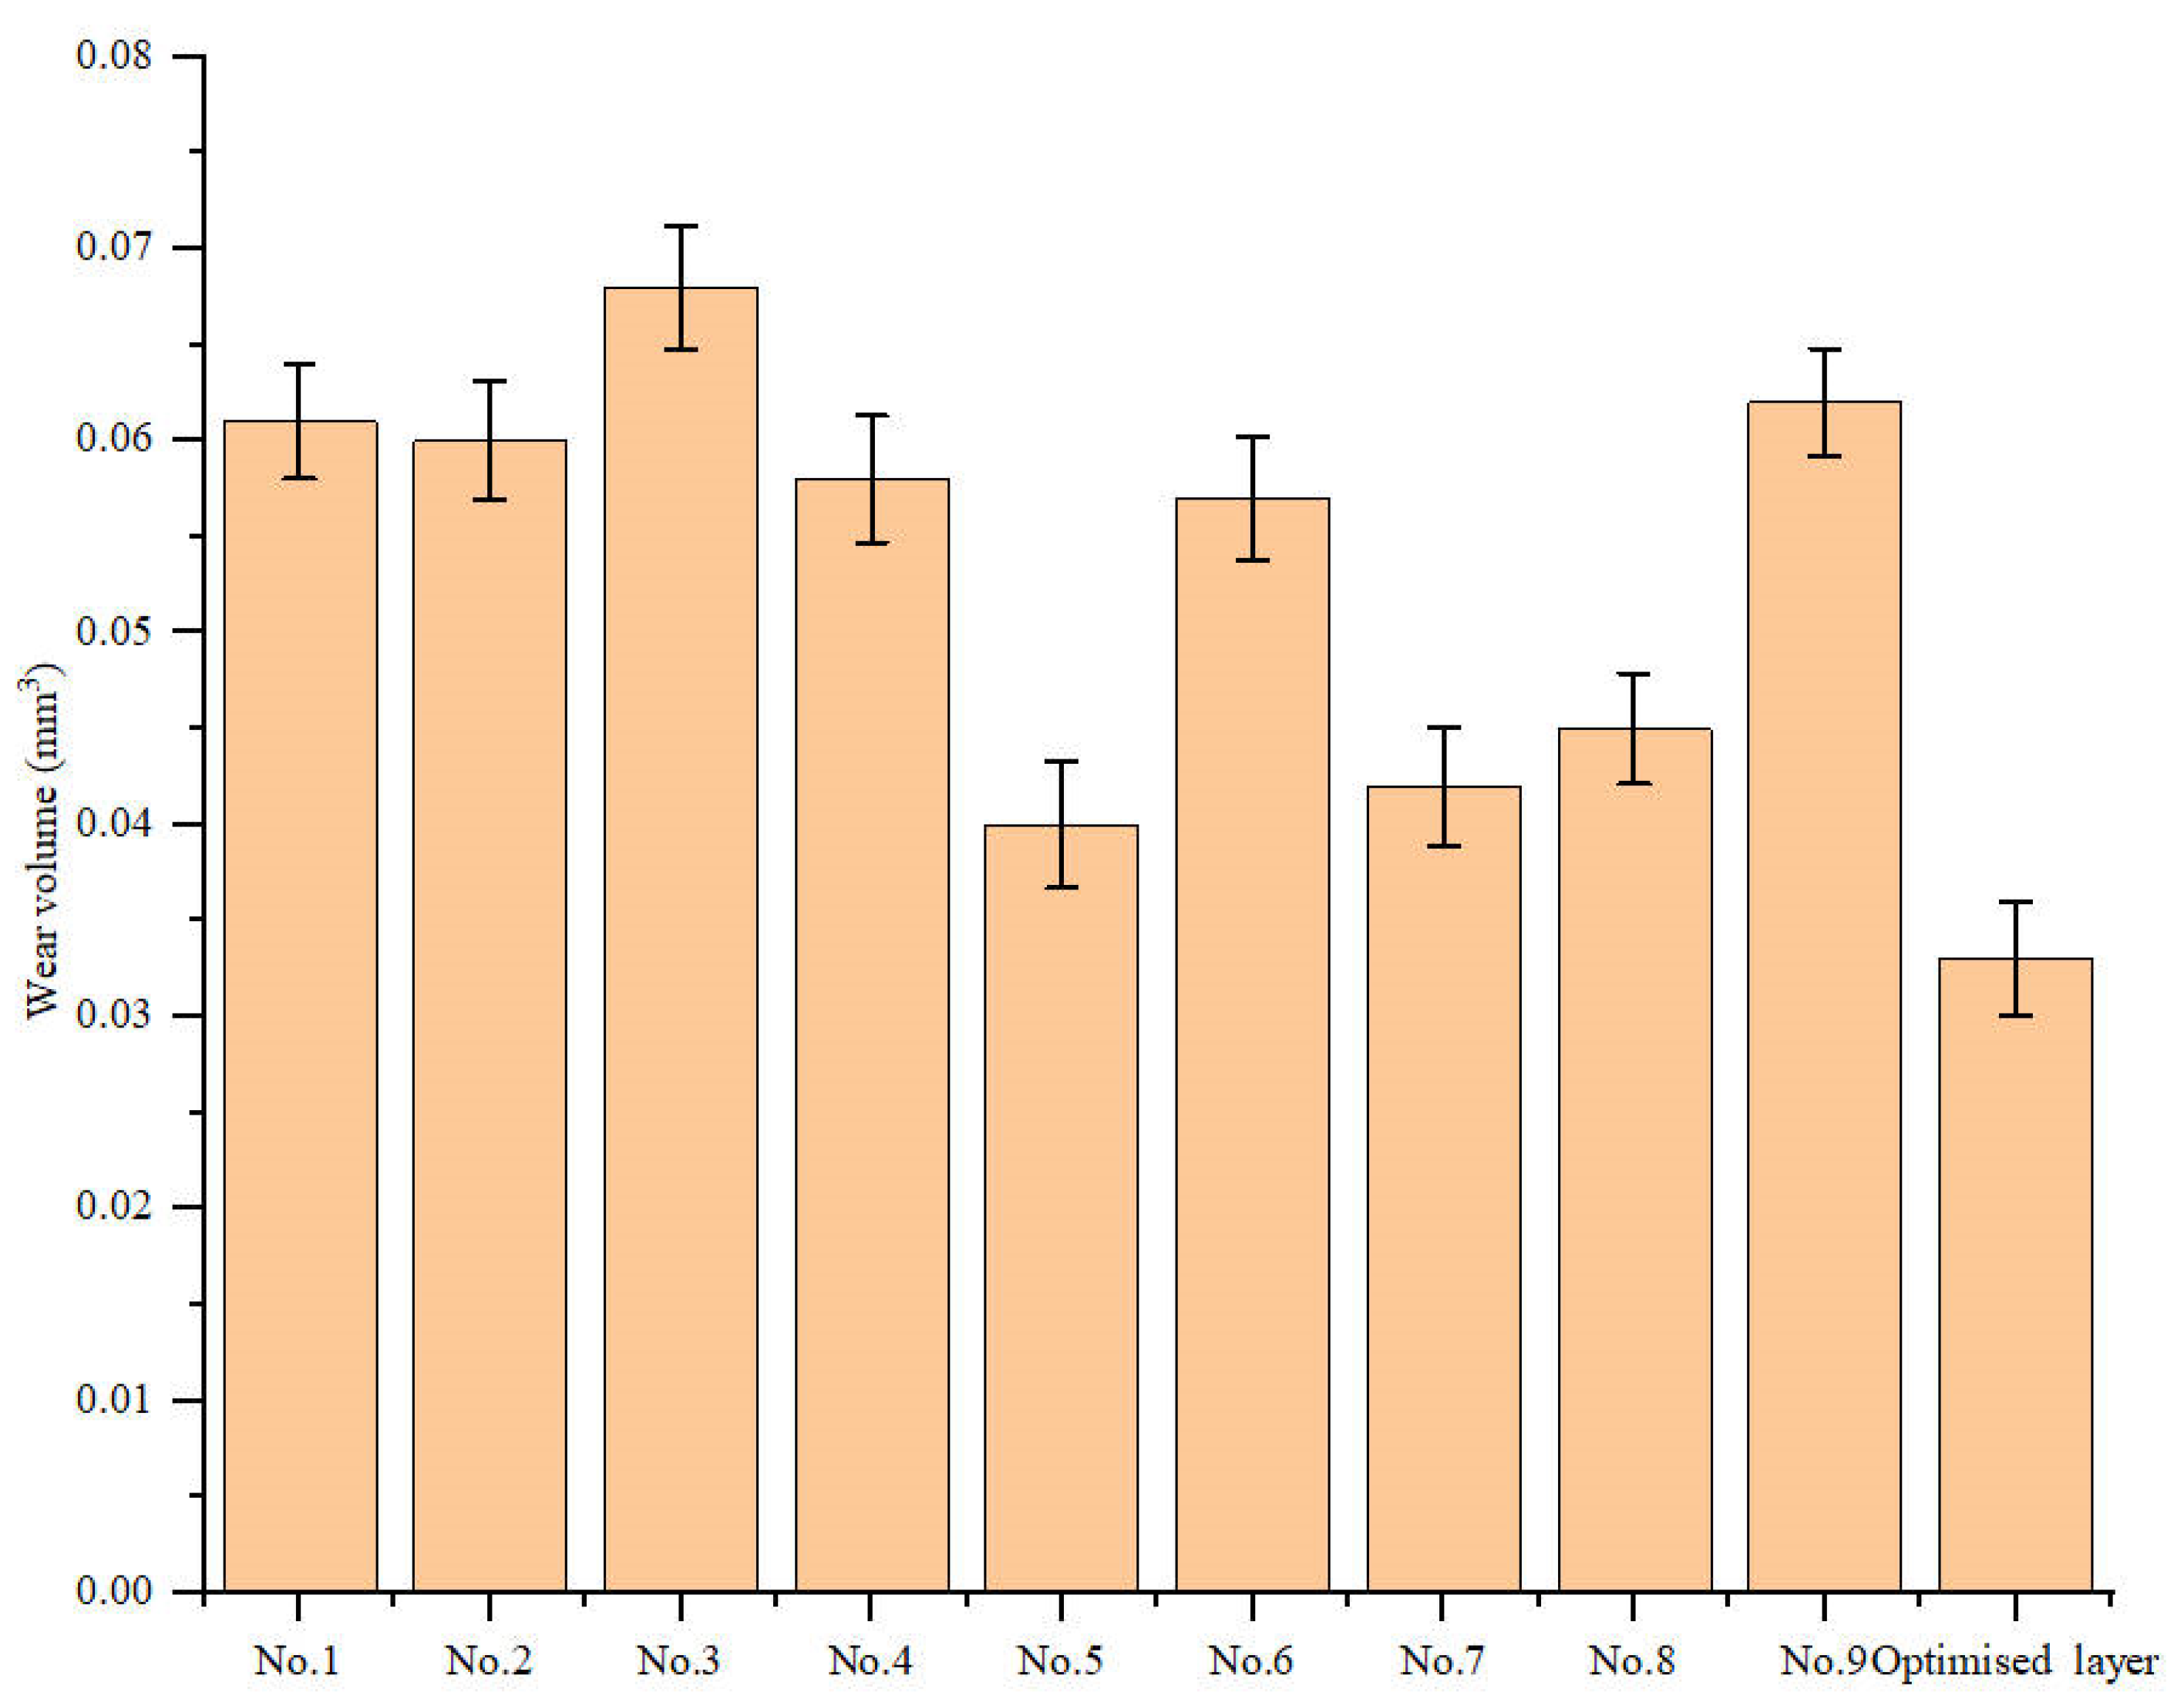
Figure 8 shows the wear volume of the laser cladding layer. It can be seen from the figure that the wear volume of the optimized laser cladding layer is the lowest among all samples. Wear resistance is usually positively related to material hardness. Higher microhardness improves the plastic deformation resistance of the coating and effectively resists damage to the coating by grinding balls [
31]. Since the optimized sample has the smallest friction coefficient and wear volume, it indicates that the laser cladding layer has the best wear resistance.
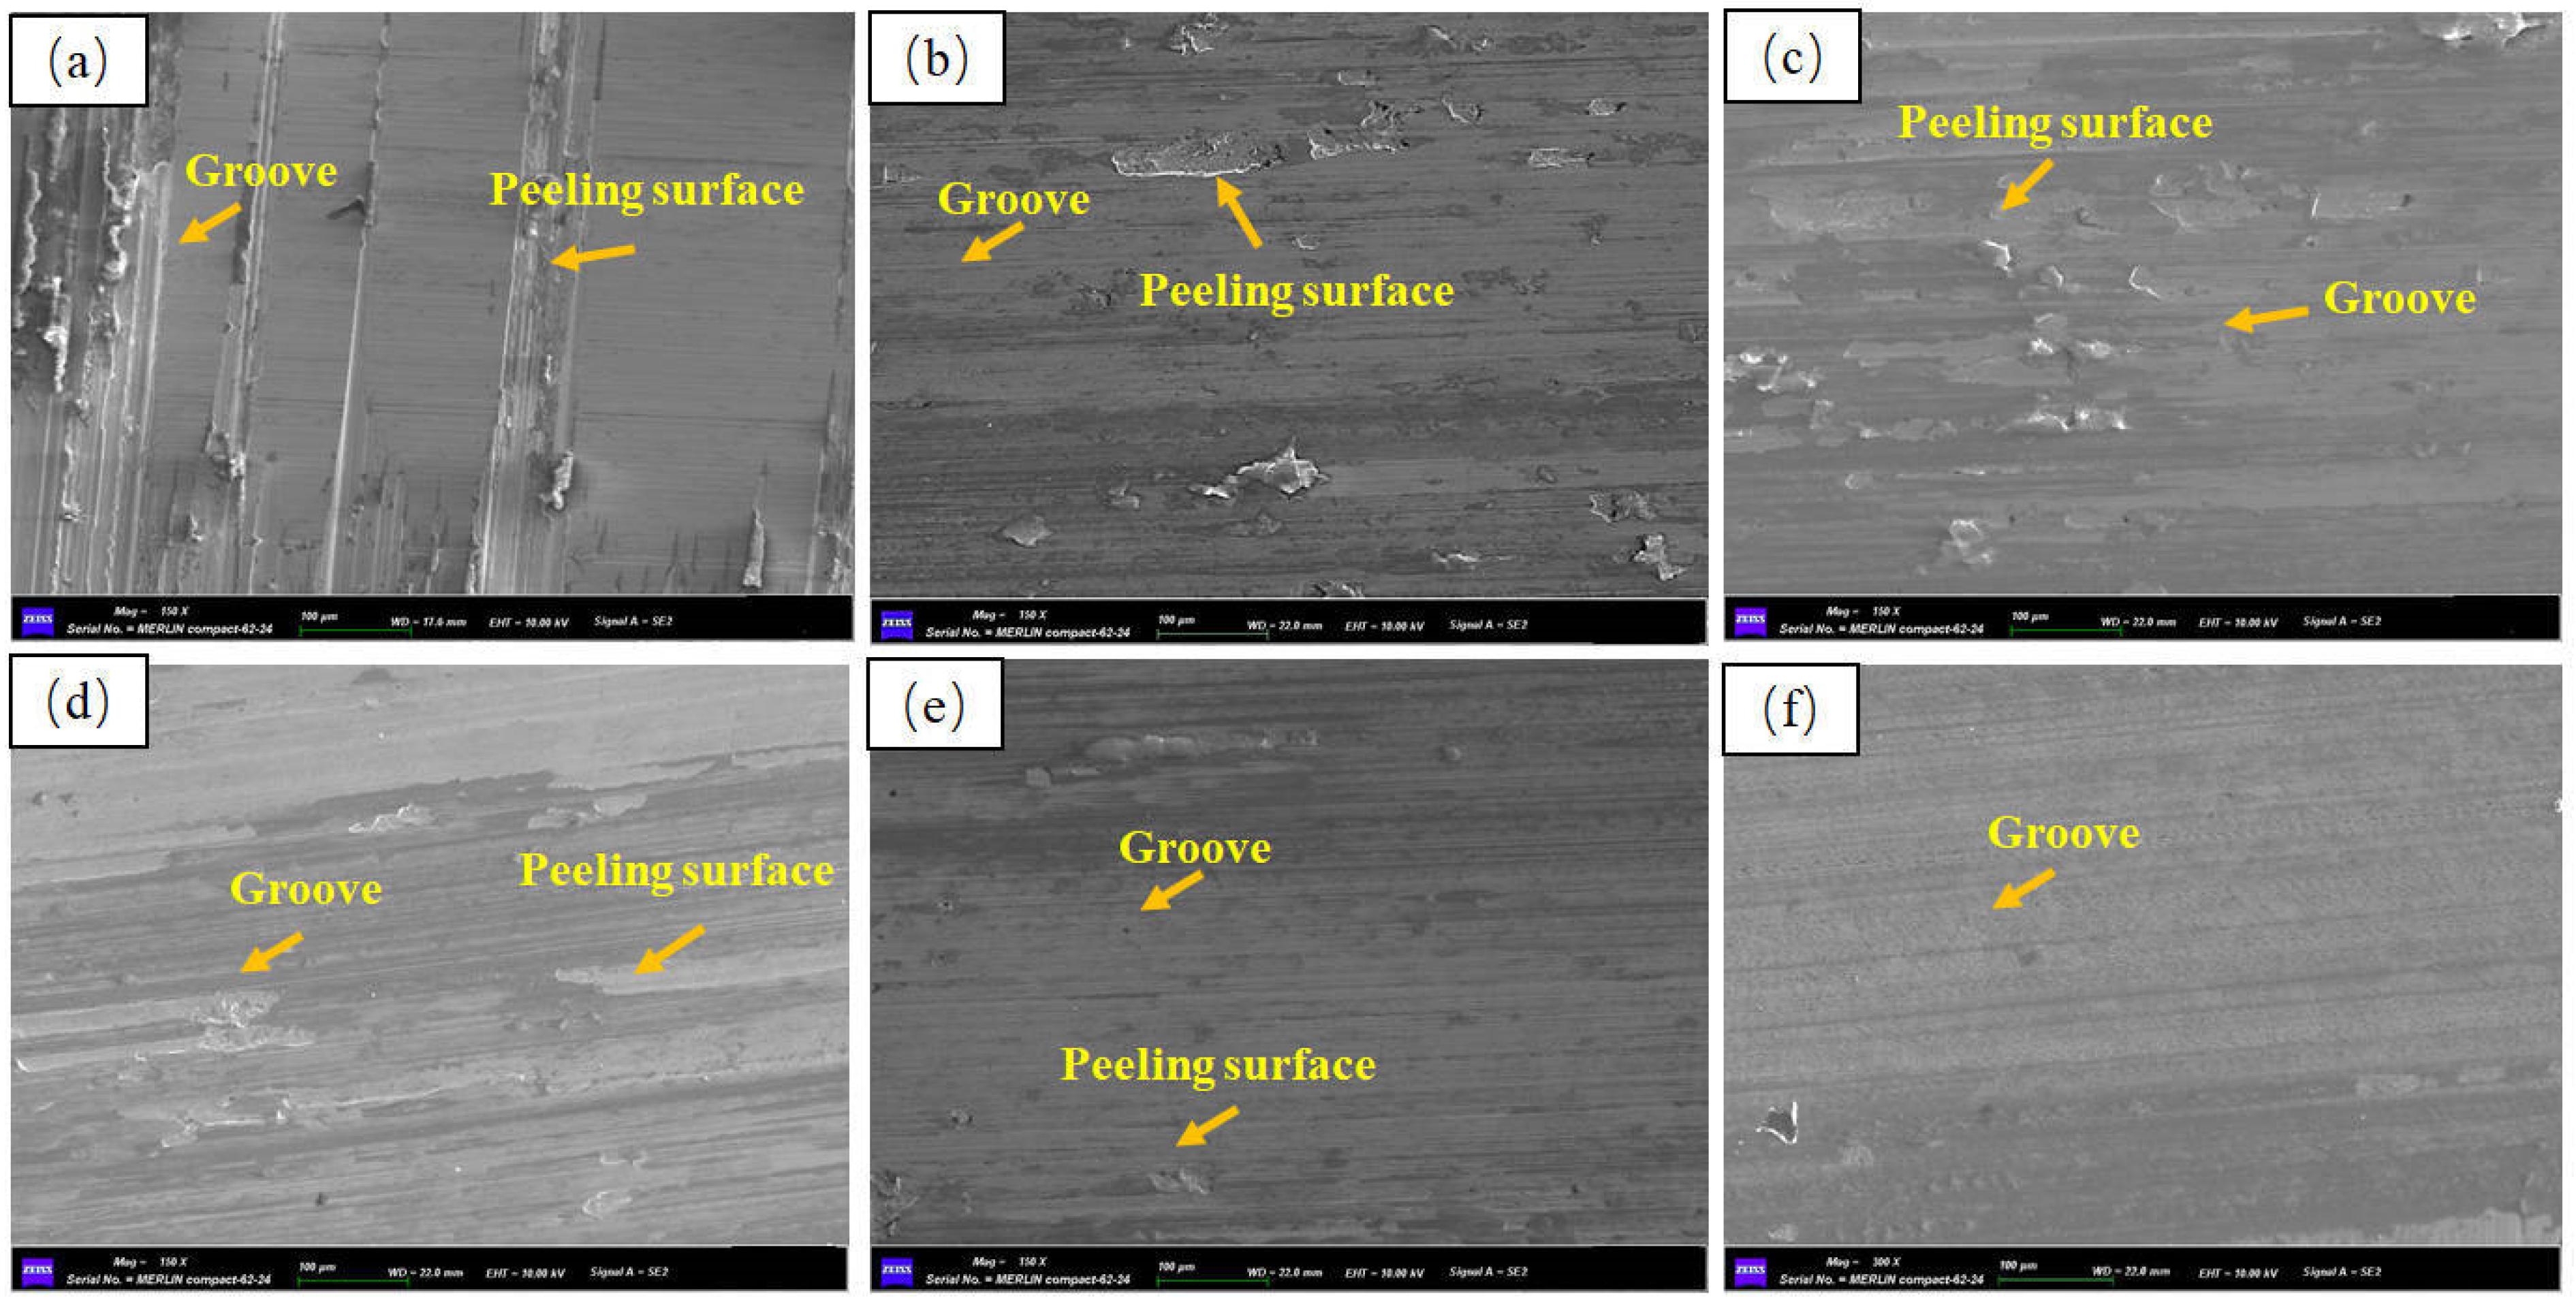
To further analyze the wear mechanism of the laser cladding coating, the wear surface morphology of the laser cladding layer was observed. It can be seen from
Figure 9a–e that the wear surface of the unoptimized laser cladding layer contains a large number of grooves and large spalling pits. The microhardness and microstructure of the laser cladding are the key factors determining the wear pattern and wear volume of the coating. The optimized wear pattern is relatively flat compared to other coatings and shows good wear resistance, with shallow and narrow furrows distributed on the contact surface parallel to the wear direction. Due to the high hardness of the optimized laser cladding, the material is torn into abrasive debris by shear force under friction side effect. Part of the debris is detached from the cladding layers, and then some craters are formed, while the other part of the abrasive debris continues to adhere to the surface of the coating in the form of abrasive particles, which generate multiple grooves and form abrasive grain wear. No. 4, No. 6, No. 8, and No. 7 laser cladding layers have similar wear morphology, with some grooves and abrasive chips, and the presence of large-sized grooves including multiple parallel wear directions and large areas of adhesion on the contact surfaces indicate that the coatings have poor wear resistance. Due to the low hardness and weak shear resistance of the coating, the surface of the coating is prone to plastic deformation and wear debris [
32]. The shedding wear debris and friction pairs continue to squeeze and slide, causing the wear debris to turn into lumps or layers, and a large amount of wear debris constantly accumulates on the contact surface, and as the experiment proceeds, it gradually adheres to the friction pair. The wear debris further adheres to other wear areas through the friction pair, thus forming adhesive wear. In addition, the crack sensitivity of the optimized cladding layer is greatly reduced, which is also beneficial for improving the wear resistance of the cladding layer. In summary, the wear resistance of the cladding layer optimized by the hierarchical analysis–gray correlation method is improved.


