
Gemological and Chemical Characterization of Gem-Quality Titanite from Morocco


Abstract
1. Introduction
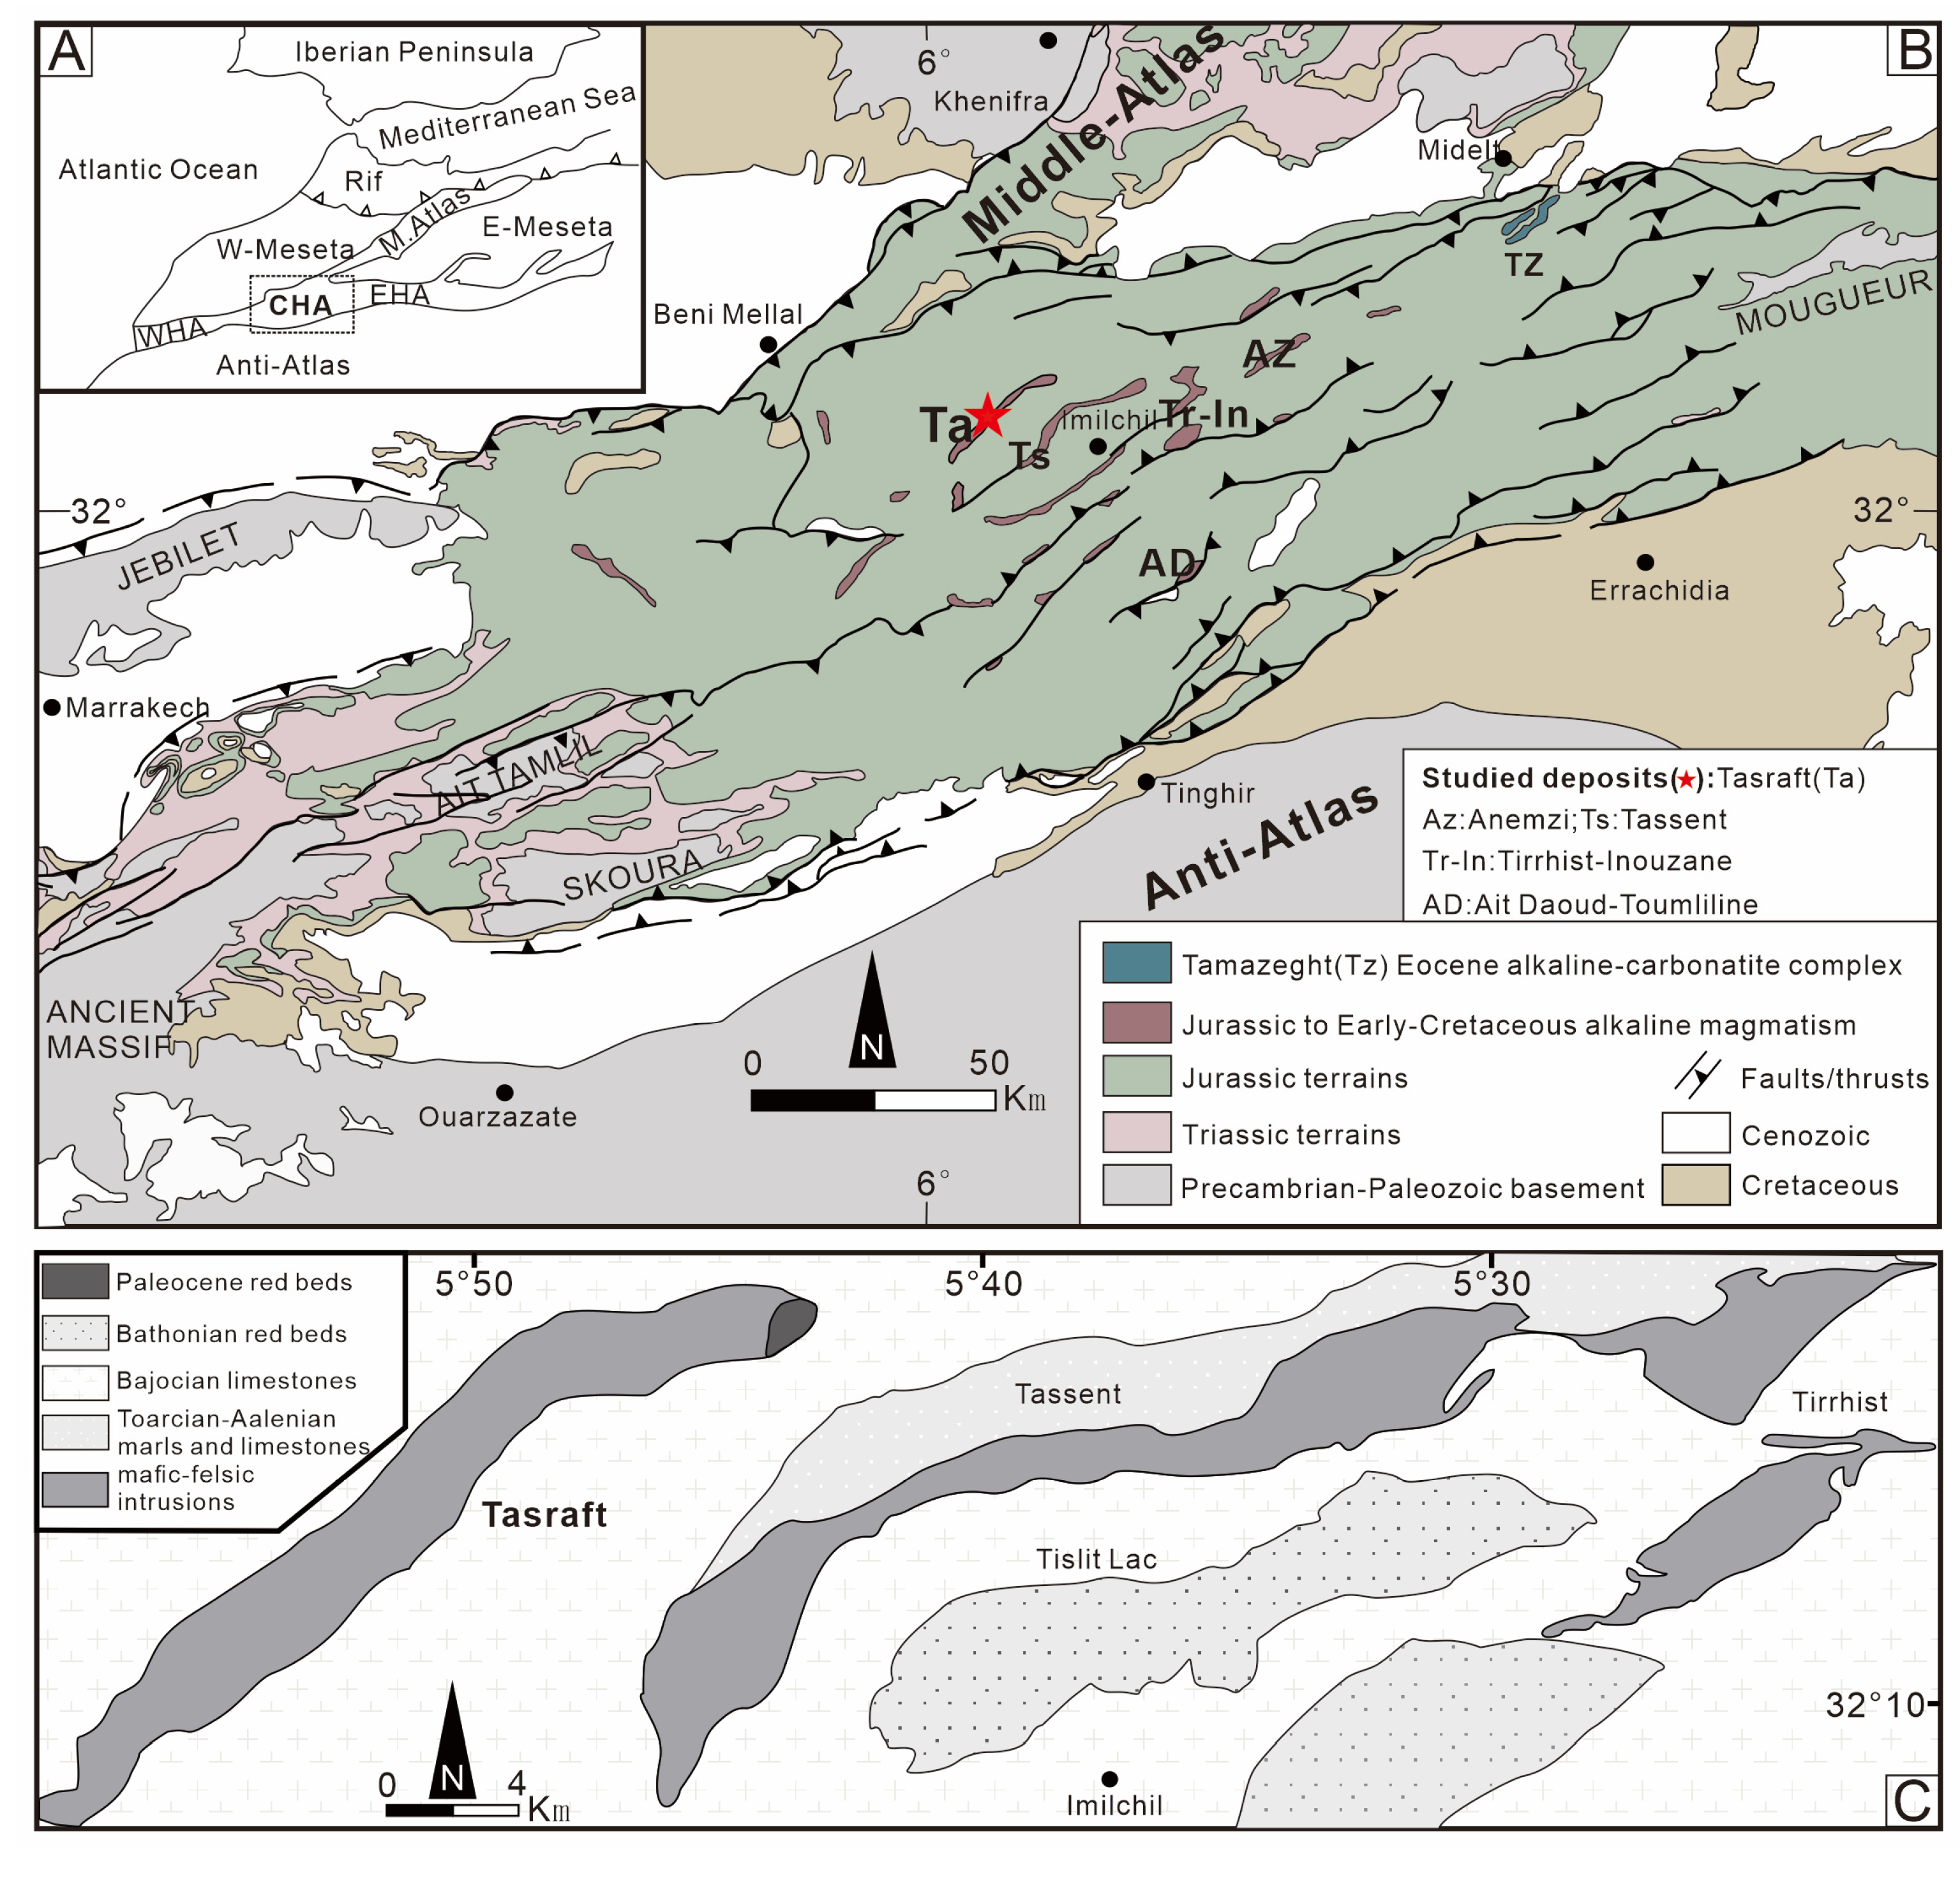
2. Geological Setting
3. Materials and Methods
3.1. Sample Description
3.2. Gemological Observation and Spectroscopy Analysis
3.3. SEM Analysis
3.4. Chemical Analysis
3.4.1. Major Elements
3.4.2. Trace Elements and U-Pb Dating
4. Results
4.1. Visual Appearance and Gemological Properties
4.2. Spectral Characteristics
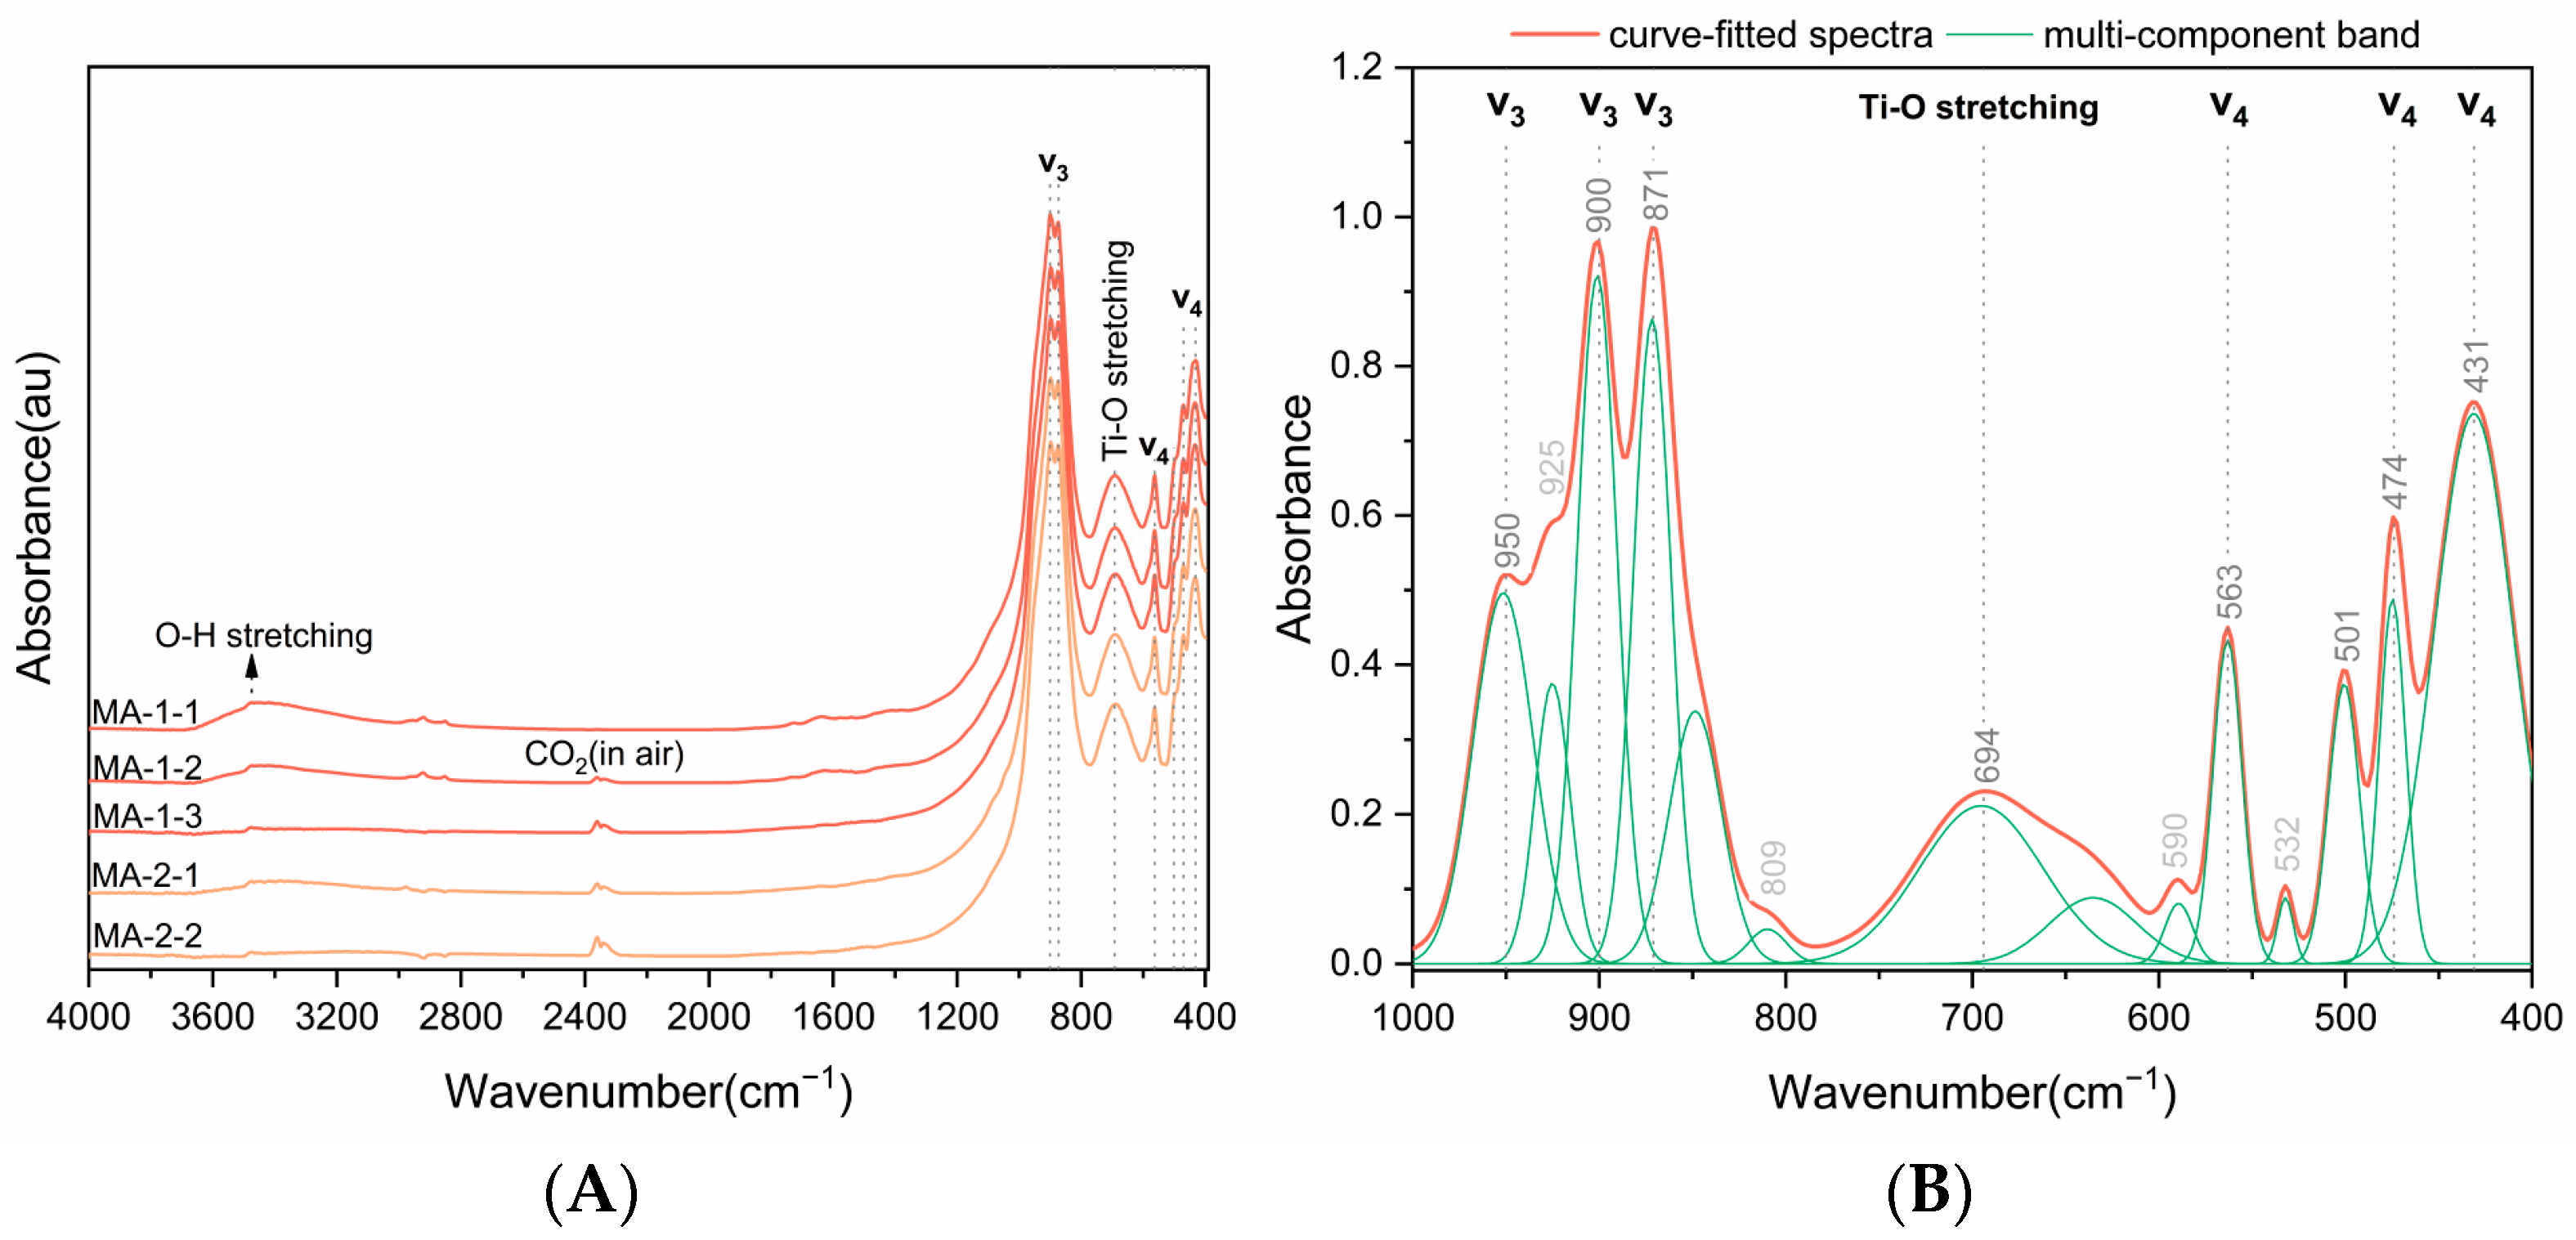
4.2.1. Fourier Transform Infrared Spectrum

| Infrared Bands (cm−1) | Assignment [37,39,40,41] | |
|---|---|---|
| Original | Deconvolution | |
| 431 | 431 | ν4 anti-symmetric, bending Si-O |
| 470 | 474 | ν4 anti-symmetric, bending Si-O |
| 501 | 501 | Si-O bending |
| 532 | Si-O bending | |
| 563 | 563 | ν4 anti-symmetric, bending Si-O |
| 590 | Si-O bending | |
| 634 | Ti-O stretching | |
| 692 | 694 | Ti-O stretching |
| 809 | Si-O stretching | |
| 848 | Si-O stretching | |
| 873 | 871 | ν3 anti-symmetric, stretching Si-O |
| 900 | 900 | ν3 anti-symmetric, stretching Si-O |
| 925 | Si-O stretching | |
| 950 | ν3 anti-symmetric, stretching Si-O | |
| 3475 | OH stretching | |
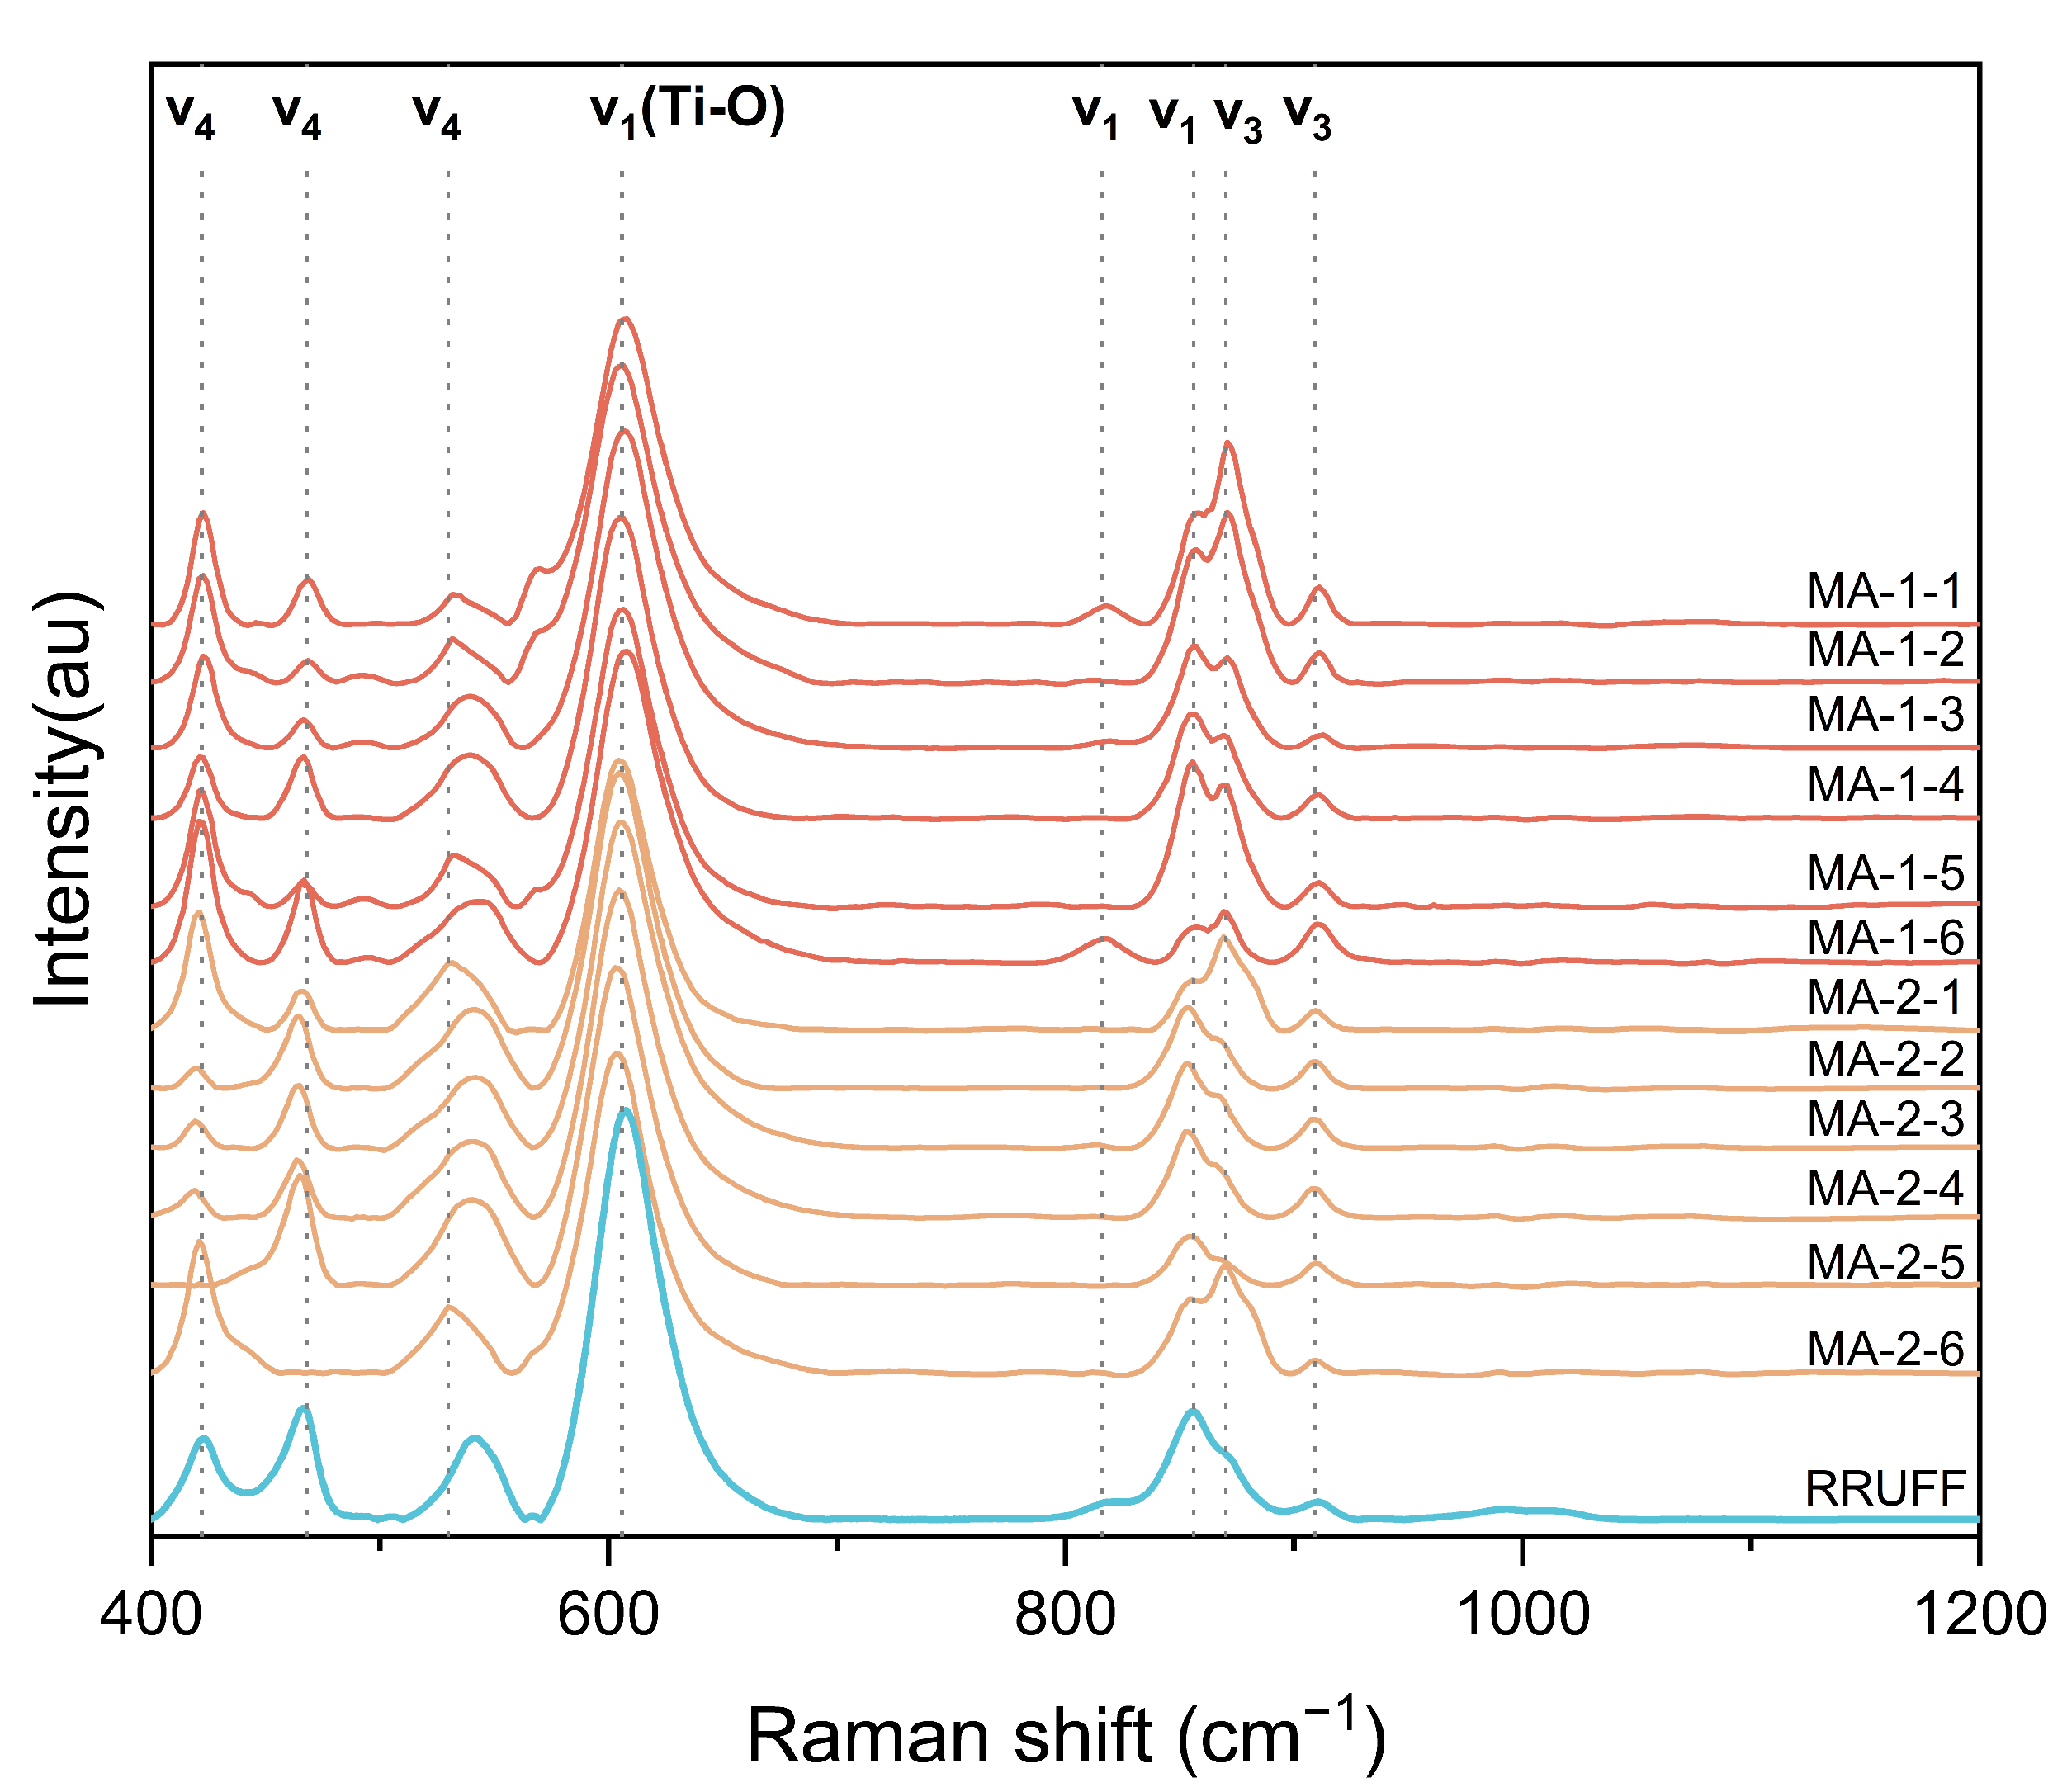
4.2.2. Raman Spectrum
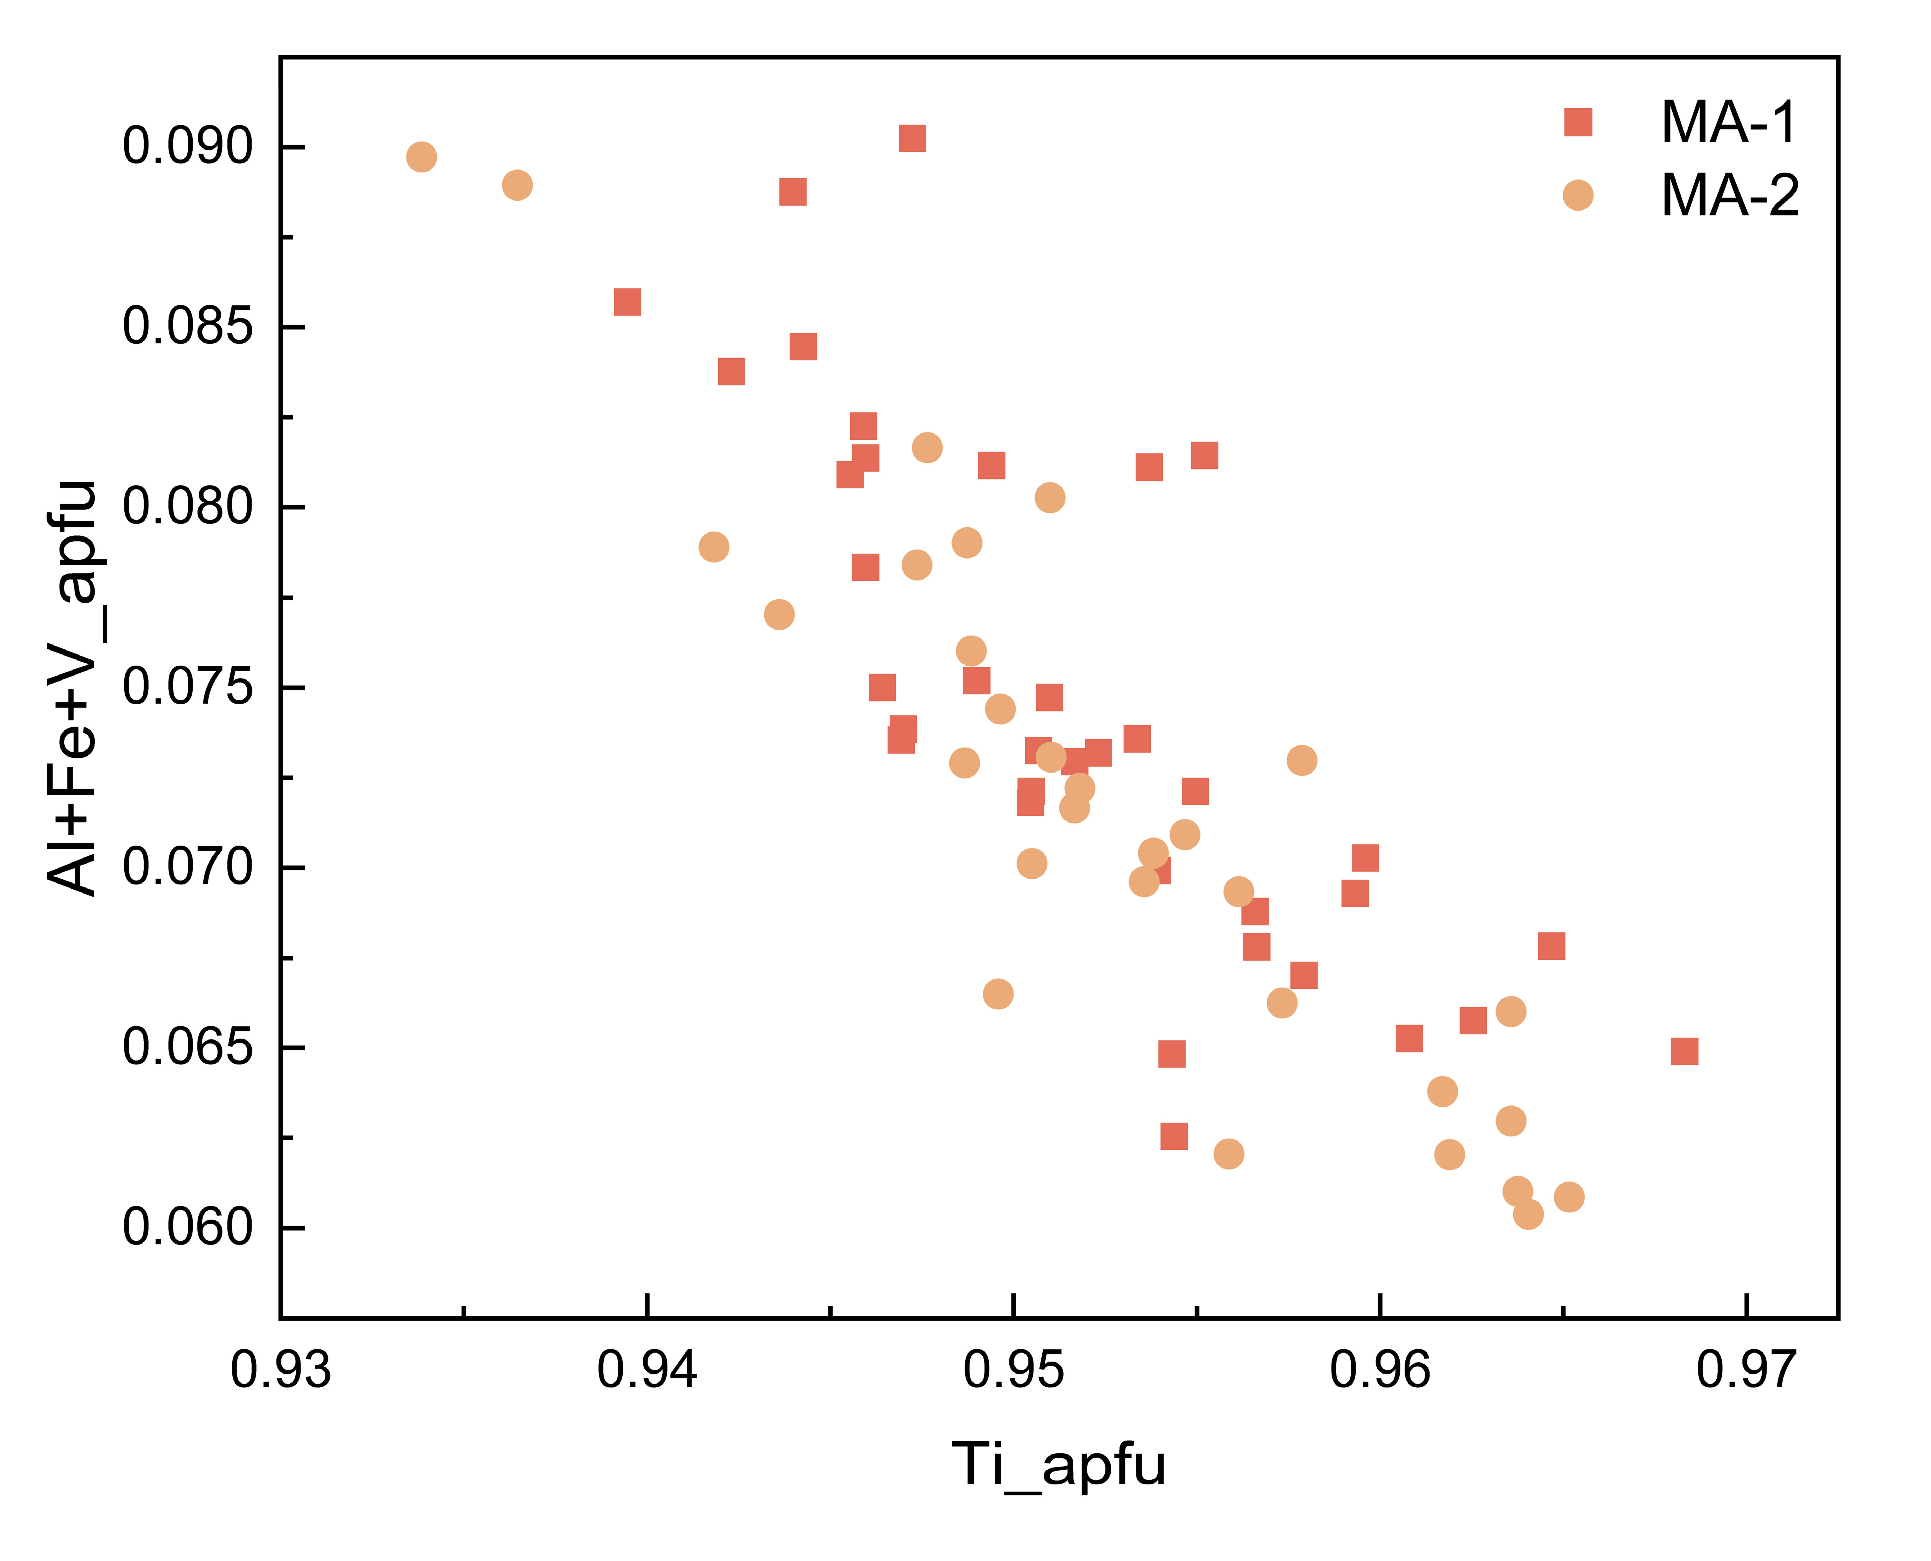
4.3. Major Elements
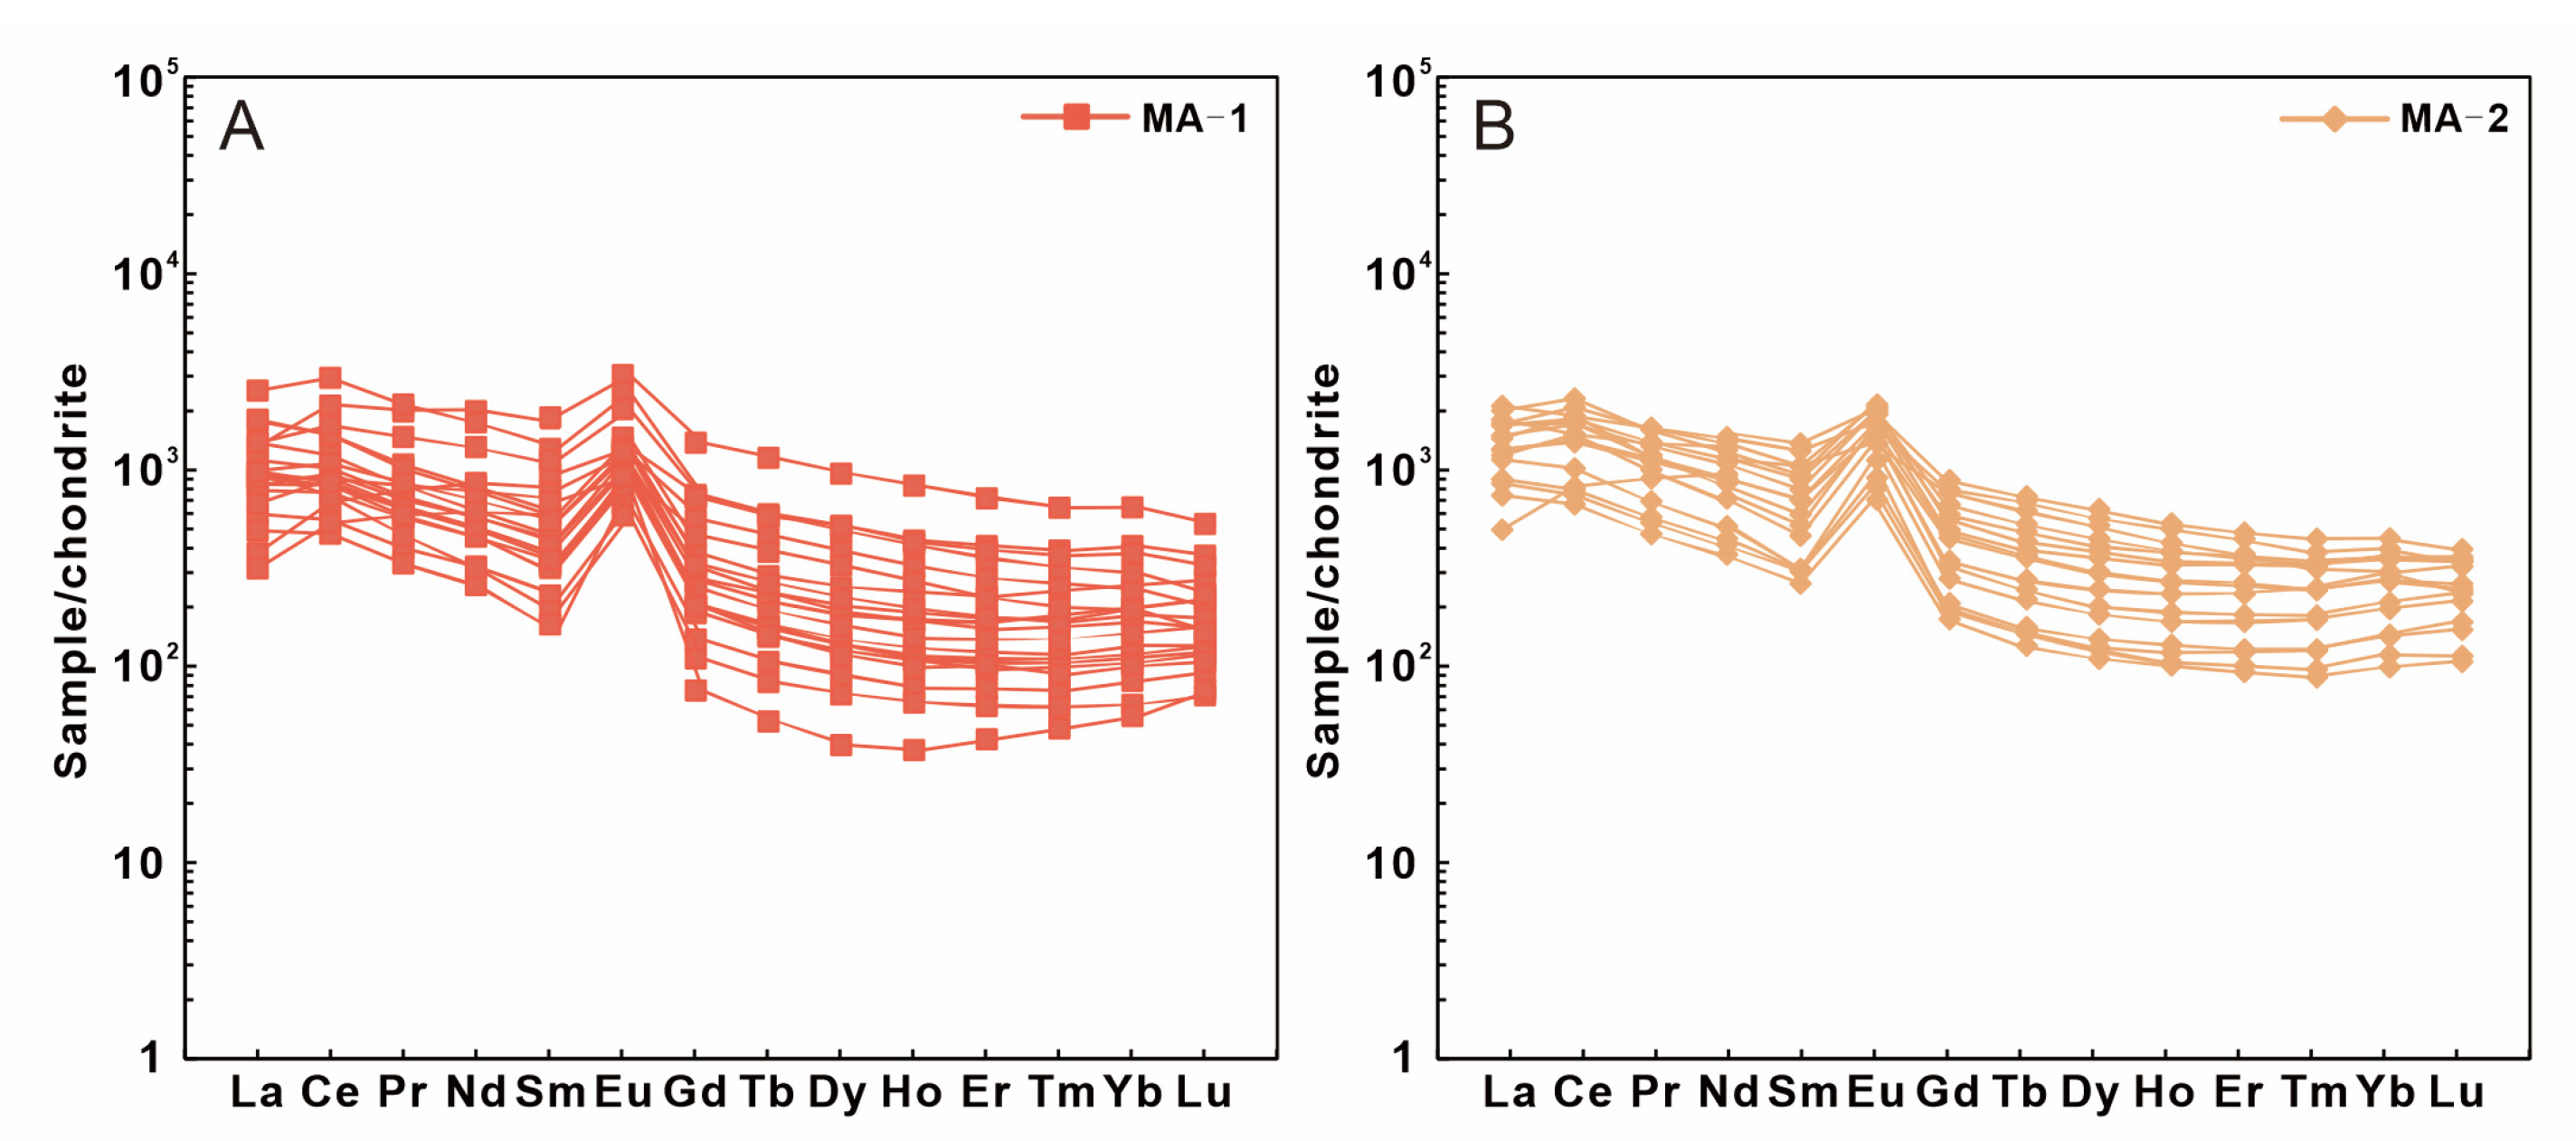
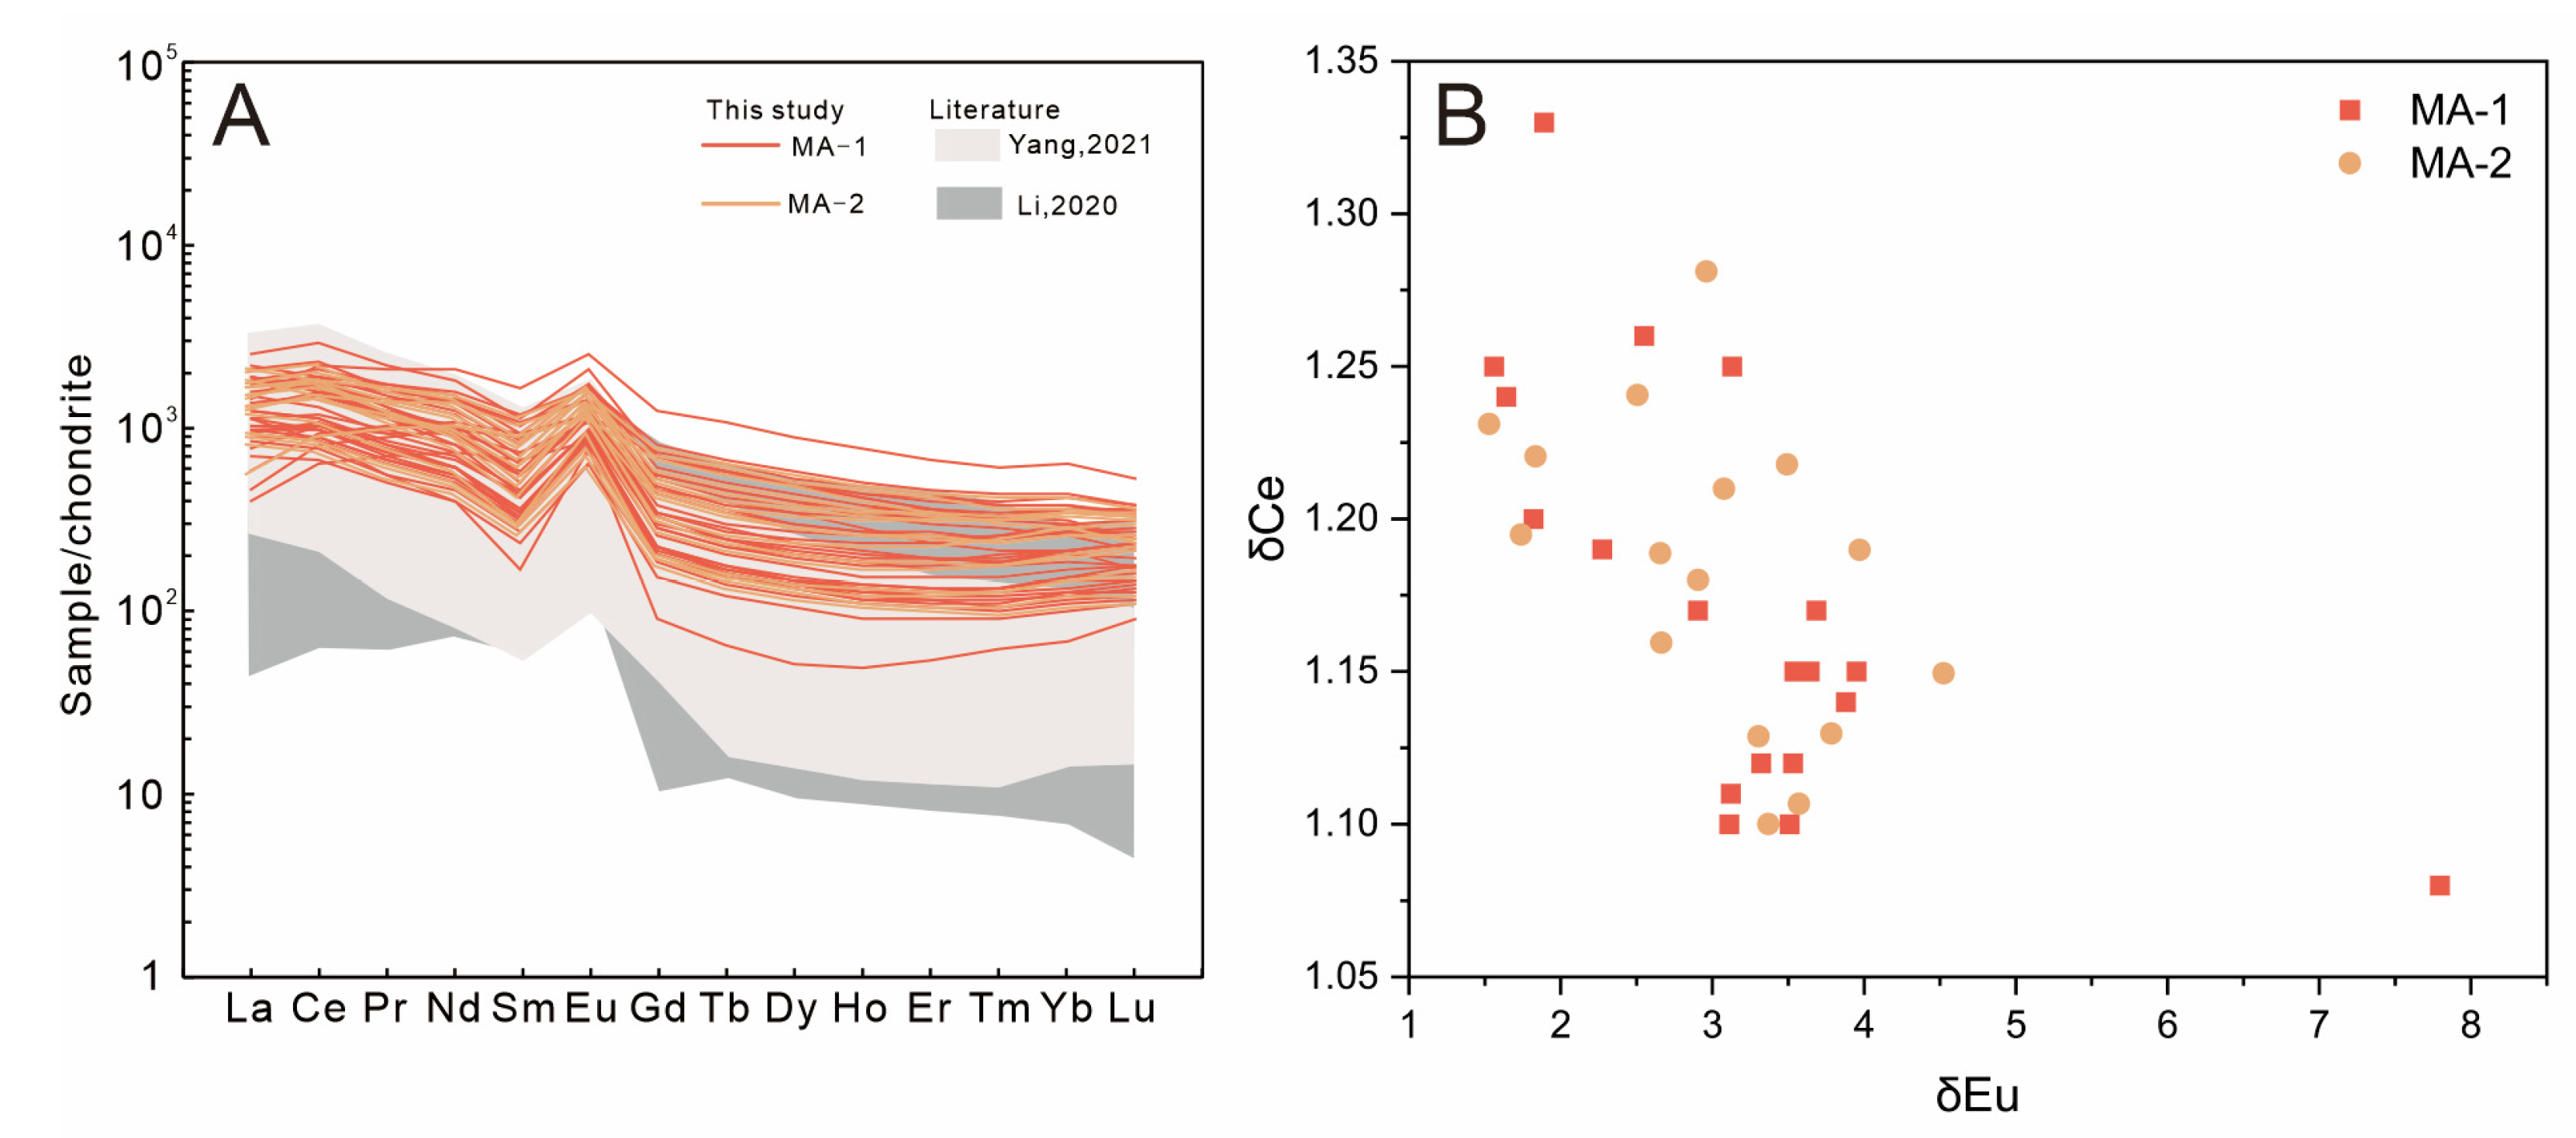
4.4. Trace Elements
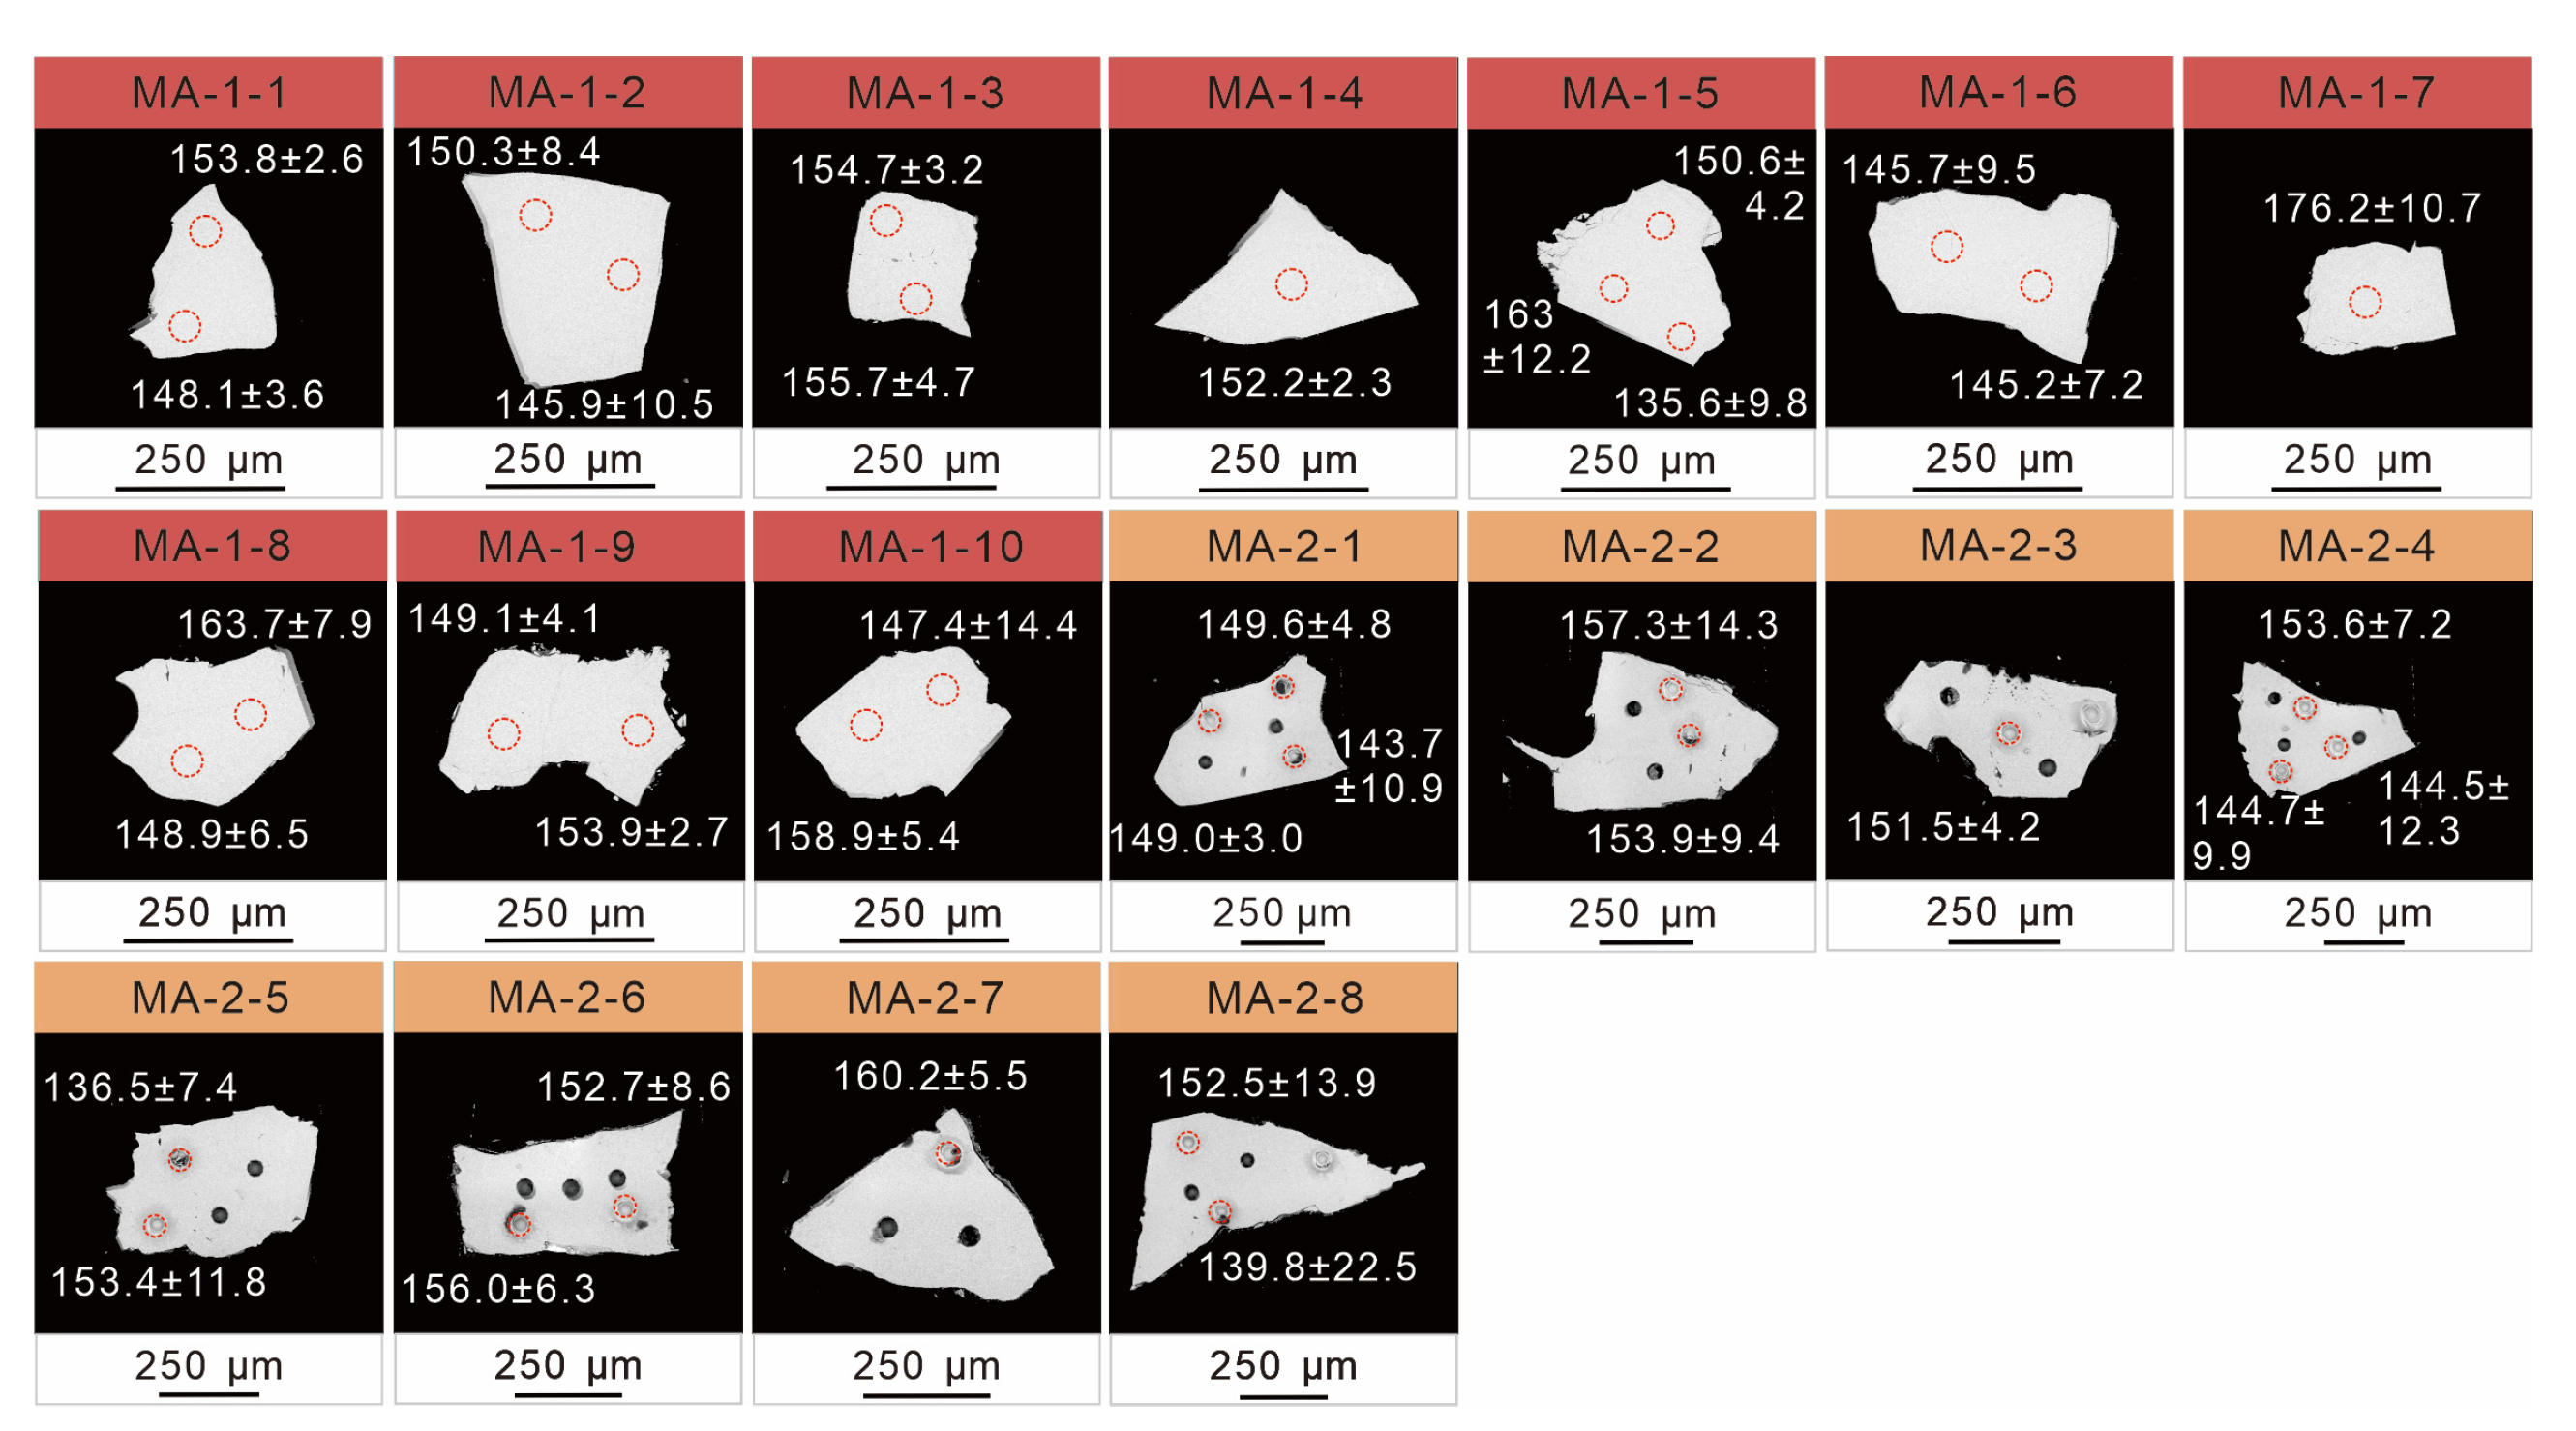
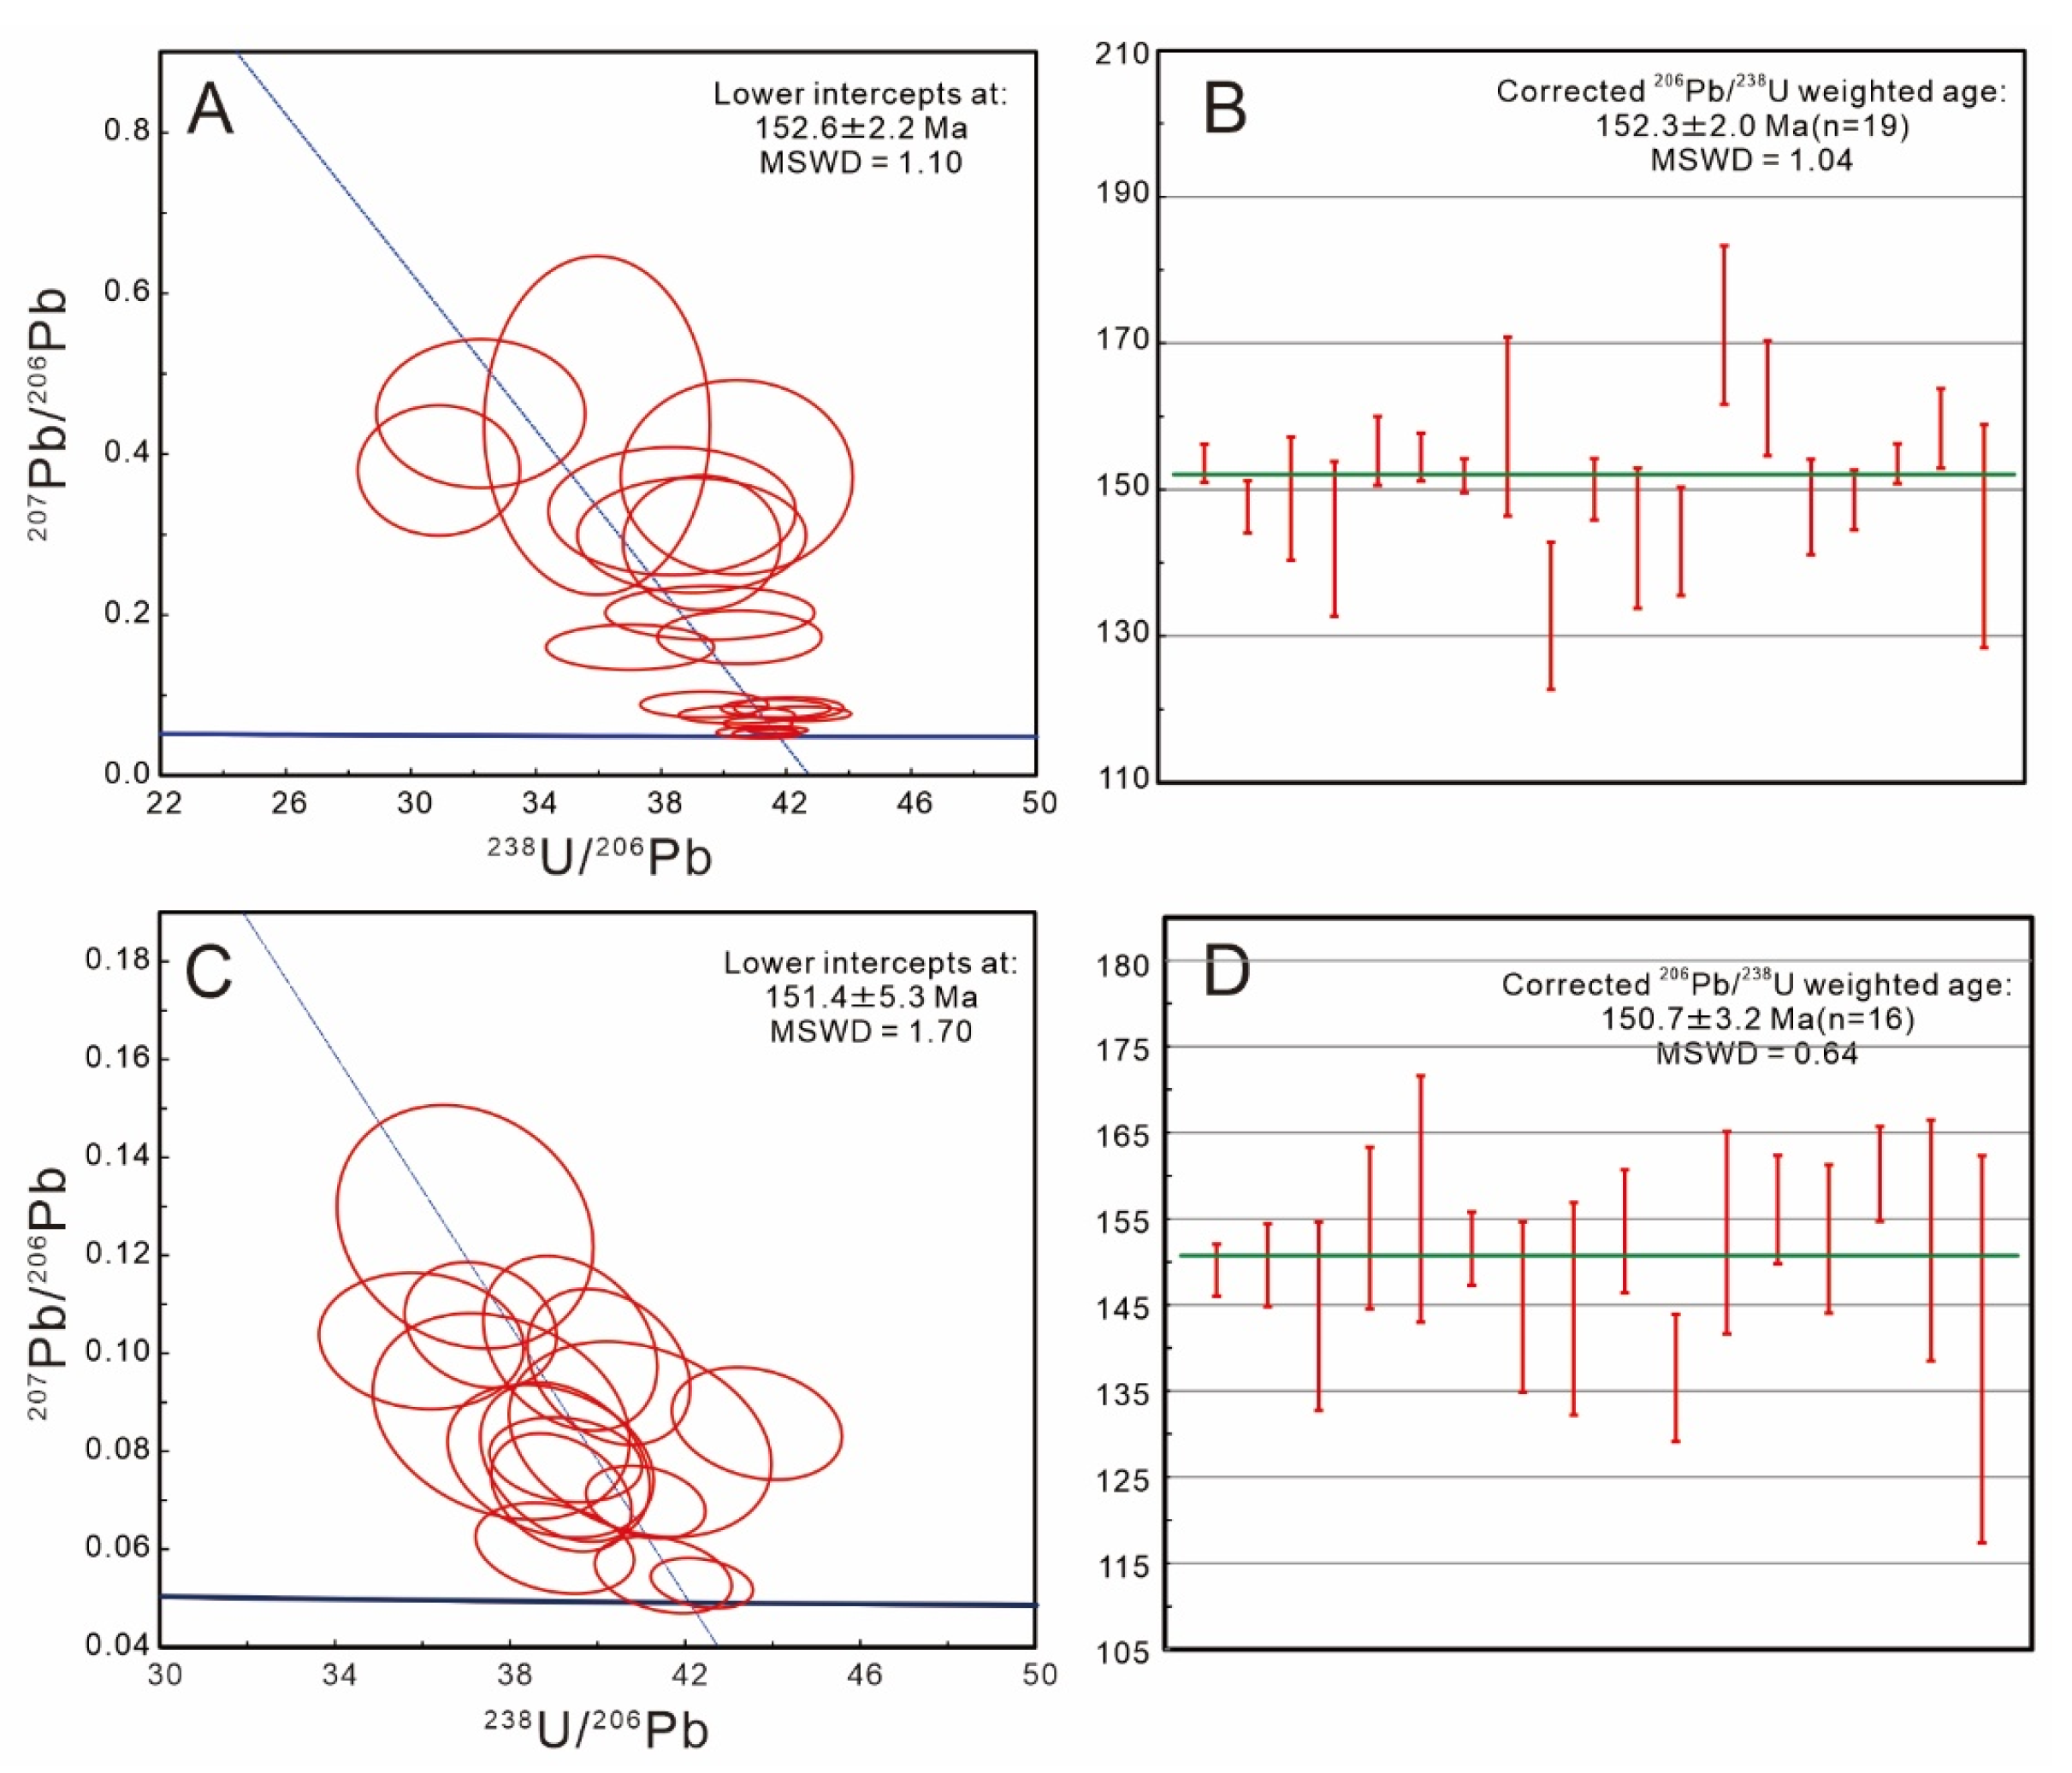
4.5. Titanite U–Pb Ages
5. Discussion
5.1. Structural State and Radiation Damage
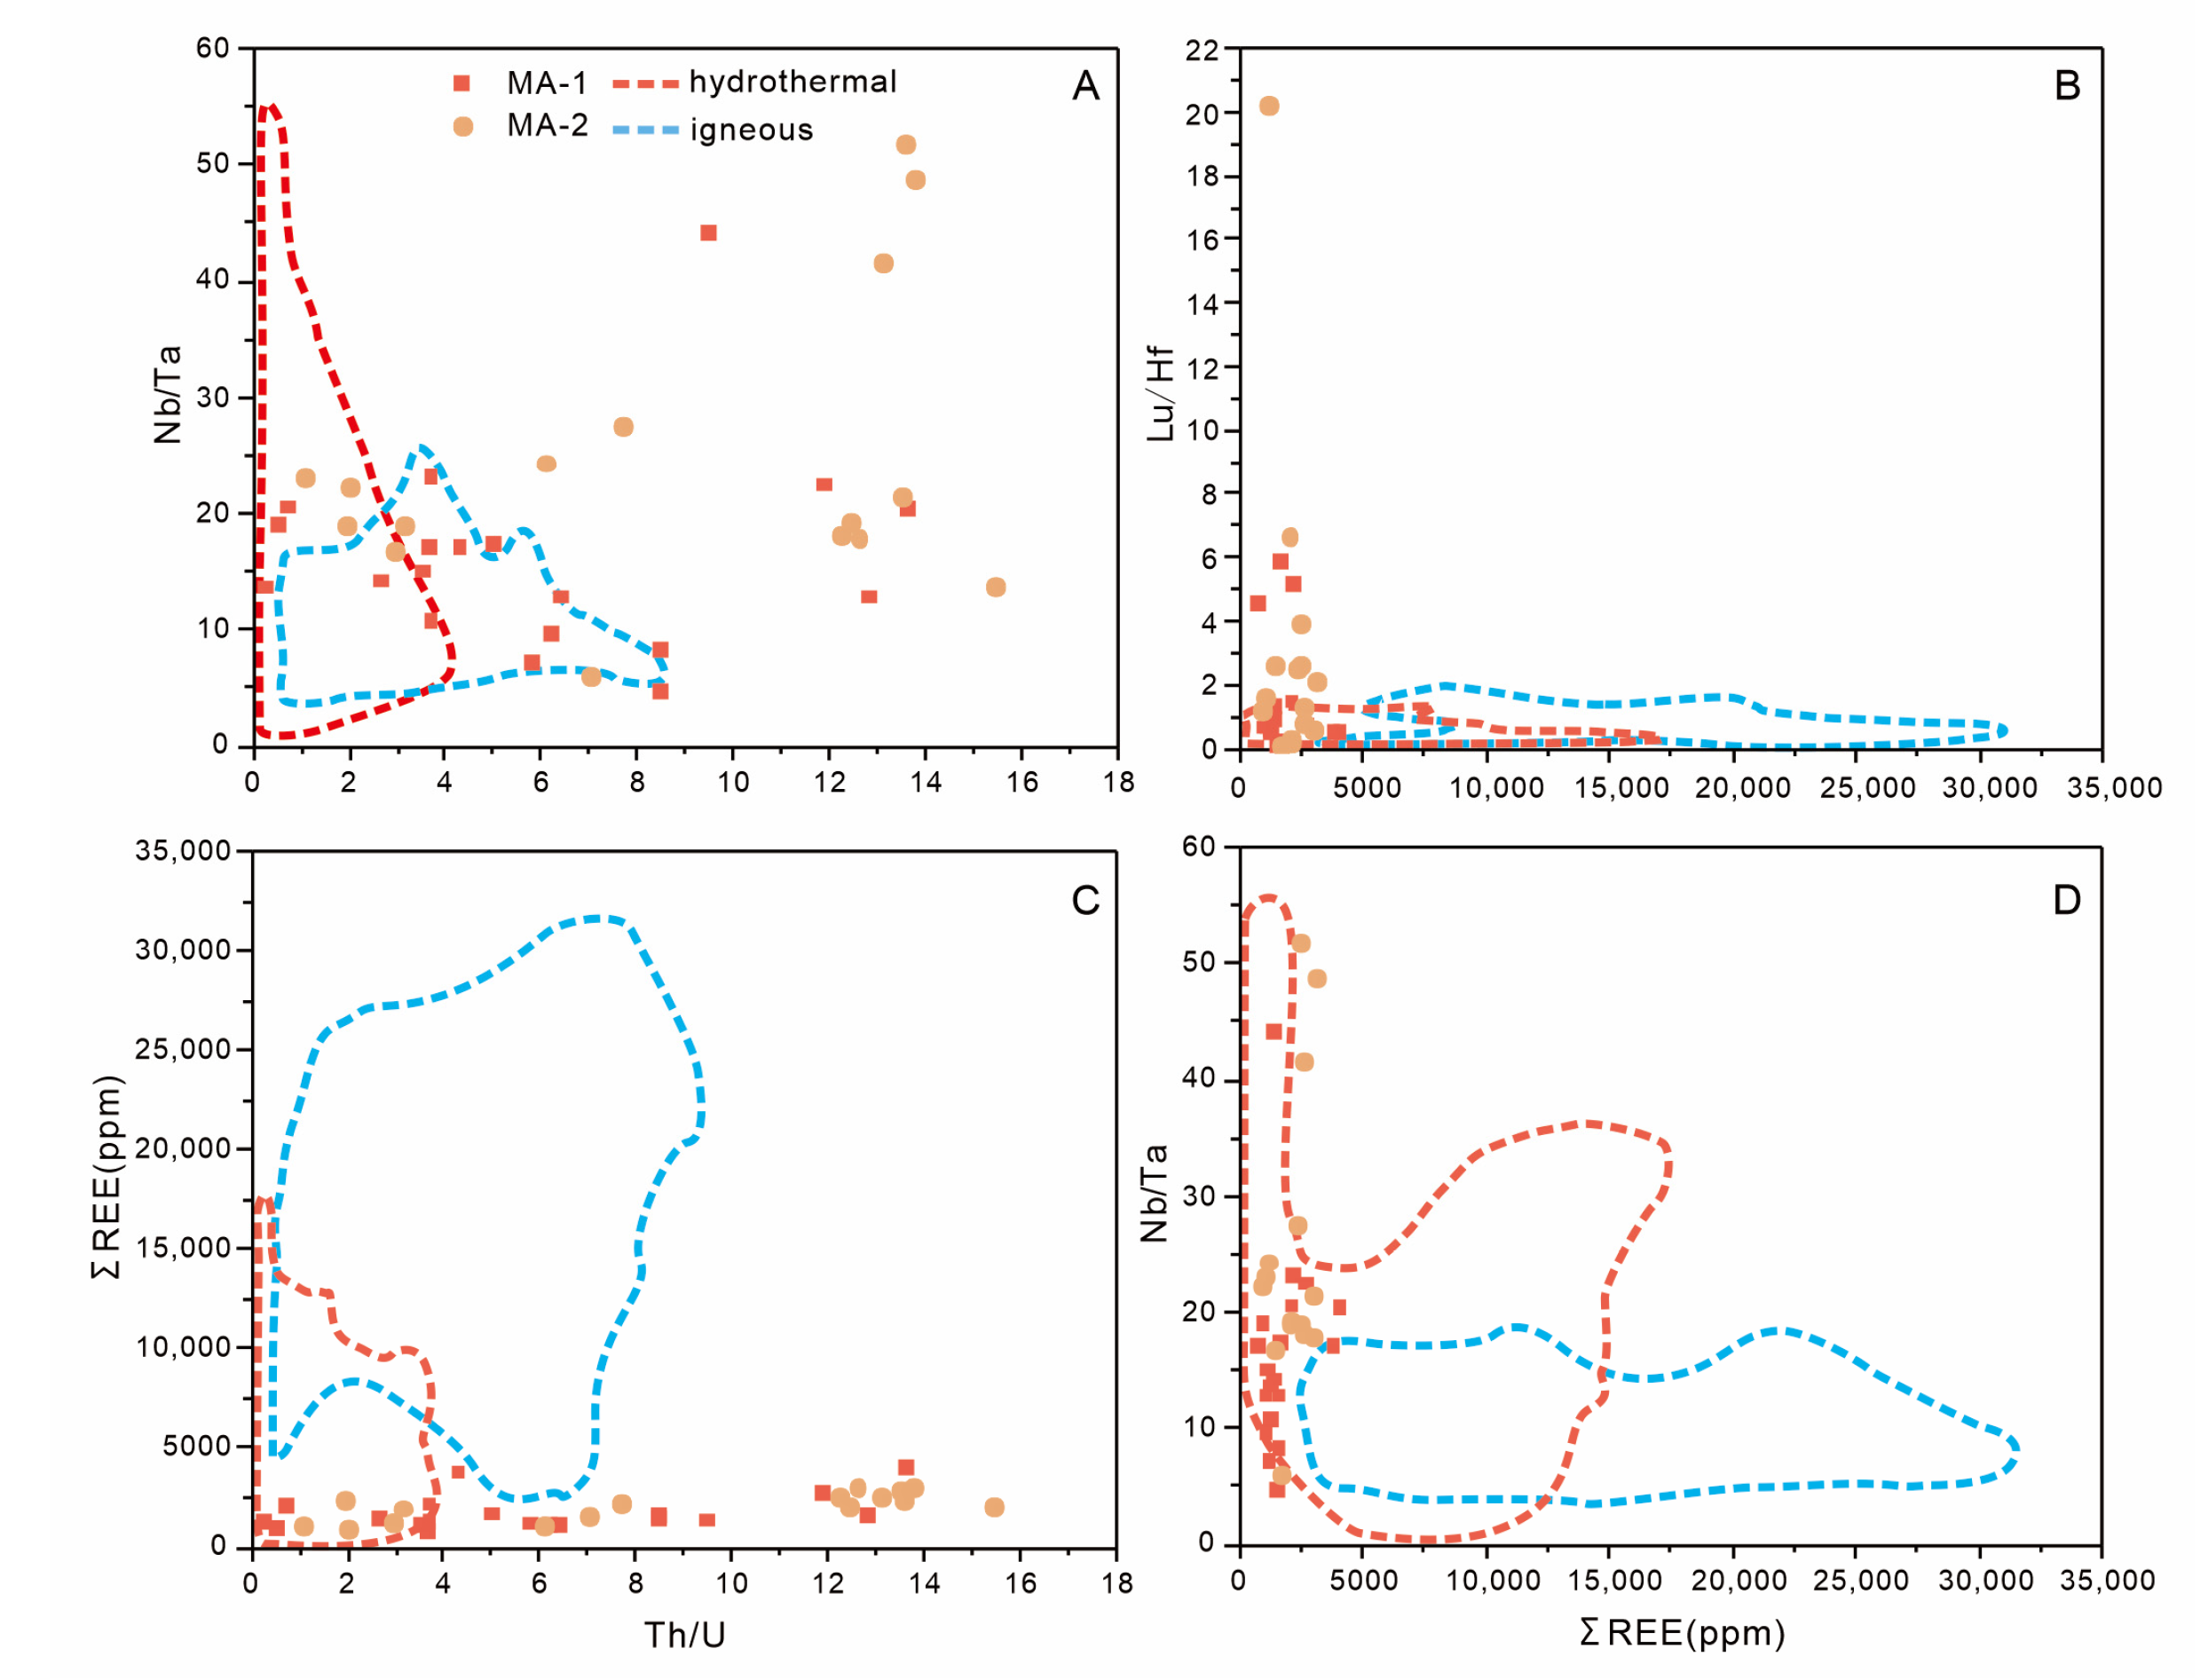
5.2. Formation Conditions and Origin of the Titanite from Morocco
5.3. Moroccan Titanite U–Pb Geochronology
6. Conclusions
Author Contributions
Funding
Data Availability Statement
Acknowledgments
Conflicts of Interest
Appendix A
| Sample | M1-1 | M1-2 | M1-3 | M1-4 | M1-5 | M1-6 | M1-7 | M1-8 | M1-9 | M1-10 | M1-11 |
|---|---|---|---|---|---|---|---|---|---|---|---|
| Major (wt%) | |||||||||||
| Na2O | 0.007 | 0.010 | 0.027 | 0.003 | 0.017 | 0.010 | 0.003 | 0.003 | 0.017 | 0.010 | 0.010 |
| 2SD | 0.009 | 0.028 | 0.050 | 0.009 | 0.047 | 0.016 | 0.009 | 0.009 | 0.047 | 0.028 | 0.028 |
| MgO | 0.010 | 0.007 | 0.013 | 0.003 | 0.013 | 0.010 | b.d.l | 0.020 | 0.010 | b.d.l | b.d.l |
| 2SD | 0.016 | 0.019 | 0.025 | 0.009 | 0.038 | 0.016 | - | 0.016 | 0.028 | - | - |
| Al2O3 | 1.080 | 0.977 | 0.973 | 1.127 | 0.943 | 1.093 | 0.987 | 1.020 | 1.160 | 1.273 | 1.120 |
| 2SD | 0.312 | 0.019 | 0.057 | 0.041 | 0.111 | 0.125 | 0.094 | 0.016 | 0.156 | 0.084 | 0.043 |
| SiO2 | 30.46 | 30.55 | 30.60 | 30.48 | 30.71 | 30.79 | 30.66 | 30.74 | 30.58 | 30.61 | 30.62 |
| 2SD | 0.509 | 0.447 | 0.057 | 0.313 | 0.368 | 0.275 | 0.646 | 0.134 | 0.428 | 0.259 | 0.180 |
| K2O | 0.007 | 0.017 | 0.007 | 0.017 | 0.017 | 0.027 | 0.003 | 0.017 | 0.010 | 0.010 | 0.010 |
| 2SD | 0.019 | 0.019 | 0.009 | 0.009 | 0.009 | 0.009 | 0.009 | 0.009 | 0.016 | 0.016 | 0 |
| CaO | 28.07 | 28.00 | 28.04 | 28.15 | 28.03 | 27.95 | 28.07 | 28.01 | 28.02 | 28.08 | 28.16 |
| 2SD | 0.188 | 0.229 | 0.074 | 0.025 | 0.249 | 0.082 | 0.203 | 0.019 | 0.136 | 0.093 | 0.109 |
| TiO2 | 38.92 | 38.90 | 38.86 | 38.65 | 38.99 | 38.73 | 38.78 | 38.72 | 38.57 | 38.38 | 38.40 |
| 2SD | 0.596 | 0.290 | 0.147 | 0.296 | 0.203 | 0.164 | 0.538 | 0.034 | 0.164 | 0.034 | 0.214 |
| V2O3 | 0.460 | 0.497 | 0.477 | 0.517 | 0.473 | 0.487 | 0.473 | 0.490 | 0.487 | 0.507 | 0.560 |
| 2SD | 0.107 | 0.068 | 0.093 | 0.025 | 0.057 | 0.111 | 0.047 | 0.028 | 0.052 | 0.084 | 0.028 |
| MnO | 0.017 | 0.030 | 0.020 | 0.023 | 0.010 | 0.003 | 0.043 | 0.033 | 0.030 | 0.033 | 0.020 |
| 2SD | 0.025 | 0.016 | 0.016 | 0.009 | 0.028 | 0.009 | 0.009 | 0.009 | 0.033 | 0.050 | 0.016 |
| Fe2O3 | 0.817 | 0.807 | 0.877 | 0.987 | 0.673 | 0.730 | 0.870 | 0.843 | 0.963 | 0.950 | 1.030 |
| 2SD | 0.050 | 0.052 | 0.066 | 0.066 | 0.068 | 0.130 | 0.118 | 0.041 | 0.288 | 0.016 | 0.082 |
| ZrO2 | b.d.l | 0.073 | b.d.l | b.d.l | 0.037 | 0.027 | 0.020 | b.d.l | 0.027 | b.d.l | b.d.l |
| 2SD | - | 0.052 | - | - | 0.041 | 0.062 | 0.057 | - | 0.075 | - | - |
| Total | 99.85 | 99.87 | 99.90 | 99.96 | 99.91 | 99.85 | 99.90 | 99.91 | 99.88 | 99.84 | 99.93 |
| Unit formula (apfu) | |||||||||||
| Na | 0.001 | 0.001 | 0.002 | 0.000 | 0.001 | 0.001 | 0.000 | 0.000 | 0.001 | 0.001 | 0.001 |
| Mg | 0.000 | 0.000 | 0.000 | 0.000 | 0.001 | 0.000 | - | 0.001 | 0.000 | - | - |
| Al | 0.041 | 0.037 | 0.037 | 0.043 | 0.036 | 0.042 | 0.038 | 0.039 | 0.045 | 0.049 | 0.043 |
| Si | 0.996 | 0.998 | 1.000 | 0.996 | 1.002 | 1.005 | 1.001 | 1.003 | 0.999 | 1.000 | 1.000 |
| K | 0.000 | 0.000 | 0.000 | 0.001 | 0.001 | 0.001 | 0.000 | 0.001 | 0.000 | 0.000 | 0.000 |
| Ca | 0.983 | 0.981 | 0.981 | 0.985 | 0.980 | 0.977 | 0.982 | 0.980 | 0.981 | 0.983 | 0.986 |
| Ti | 0.957 | 0.956 | 0.955 | 0.950 | 0.957 | 0.951 | 0.953 | 0.951 | 0.948 | 0.943 | 0.944 |
| V | 0.012 | 0.013 | 0.012 | 0.014 | 0.012 | 0.013 | 0.013 | 0.013 | 0.013 | 0.013 | 0.015 |
| Mn | 0.001 | 0.001 | 0.001 | 0.001 | 0.000 | 0.000 | 0.001 | 0.001 | 0.001 | 0.001 | 0.001 |
| Fe | 0.020 | 0.020 | 0.022 | 0.024 | 0.017 | 0.018 | 0.021 | 0.021 | 0.024 | 0.023 | 0.025 |
| Zr | - | 0.001 | - | - | 0.001 | 0.000 | 0.000 | - | 0.000 | - | - |
| SUM | 3.011 | 3.009 | 3.011 | 3.014 | 3.008 | 3.008 | 3.010 | 3.010 | 3.013 | 3.014 | 3.015 |
| Major (wt%) | |||||||||||
| Na2O | 0.003 | 0.003 | 0.023 | 0.010 | 0.013 | 0.010 | 0.010 | 0.017 | 0.007 | 0.010 | 0.007 |
| 2SD | 0.009 | 0.009 | 0.034 | 0.016 | 0.019 | 0.016 | 0.016 | 0.034 | 0.019 | 0.016 | 0.019 |
| MgO | b.d.l | 0.013 | 0.007 | 0.013 | 0.003 | b.d.l | 0.017 | b.d.l | 0.007 | 0.020 | 0.013 |
| 2SD | - | 0.019 | 0.009 | 0.025 | 0.009 | - | 0.009 | - | 0.009 | 0 | 0.009 |
| Al2O3 | 0.947 | 1.067 | 0.990 | 1.073 | 0.970 | 0.953 | 0.830 | 1.097 | 0.997 | 1.303 | 0.923 |
| 2SD | 0.062 | 0.081 | 0.412 | 0.052 | 0.086 | 0.068 | 0.085 | 0.096 | 0.111 | 0.105 | 0.038 |
| SiO2 | 30.73 | 30.85 | 30.48 | 30.71 | 30.79 | 30.88 | 30.66 | 30.61 | 30.89 | 30.80 | 30.64 |
| 2SD | 0.286 | 0.152 | 0.143 | 0.090 | 0.189 | 0.276 | 0.278 | 0.315 | 0.232 | 0.279 | 0.329 |
| K2O | 0.013 | 0.007 | 0.017 | 0.013 | 0.007 | 0.003 | 0.013 | 0.013 | 0.013 | 0.013 | 0.010 |
| 2SD | 0.025 | 0.019 | 0.009 | 0.025 | 0.009 | 0.009 | 0.019 | 0.025 | 0.019 | 0.025 | 0.016 |
| CaO | 27.99 | 28.04 | 28.19 | 28.06 | 27.87 | 27.93 | 27.93 | 28.05 | 28.00 | 28.03 | 28.01 |
| 2SD | 0.128 | 0.093 | 0.136 | 0.093 | 0.025 | 0.137 | 0.173 | 0.075 | 0.114 | 0.065 | 0.057 |
| TiO2 | 39.04 | 38.56 | 39.00 | 38.66 | 39.02 | 38.98 | 39.27 | 38.74 | 38.73 | 38.28 | 38.92 |
| 2SD | 0.270 | 0.395 | 0.425 | 0.154 | 0.365 | 0.170 | 0.081 | 0.270 | 0.077 | 0.435 | 0.395 |
| V2O3 | 0.463 | 0.447 | 0.480 | 0.473 | 0.497 | 0.423 | 0.463 | 0.490 | 0.463 | 0.473 | 0.497 |
| 2SD | 0.019 | 0.137 | 0.028 | 0.009 | 0.090 | 0.133 | 0.109 | 0.016 | 0.062 | 0.093 | 0.118 |
| MnO | 0.013 | 0.023 | 0.030 | 0.013 | 0.020 | 0.023 | 0.027 | 0.013 | 0.020 | 0.040 | 0.023 |
| 2SD | 0.019 | 0.034 | 0.016 | 0.038 | 0.043 | 0.009 | 0.075 | 0.019 | 0.016 | 0.033 | 0.025 |
| Fe2O3 | 0.707 | 0.917 | 0.733 | 0.880 | 0.730 | 0.757 | 0.680 | 0.853 | 0.813 | 0.990 | 0.833 |
| 2SD | 0.038 | 0.066 | 0.050 | 0.091 | 0.134 | 0.068 | 0.049 | 0.111 | 0.106 | 0.049 | 0.082 |
| ZrO2 | b.d.l | 0.003 | 0.043 | b.d.l | 0.027 | b.d.l | 0.007 | 0.010 | 0.040 | b.d.l | 0.037 |
| 2SD | - | 0.009 | 0.074 | - | 0.075 | - | 0.019 | 0.028 | 0.059 | - | 0.090 |
| Total | 99.91 | 99.94 | 99.98 | 99.91 | 99.94 | 99.97 | 99.90 | 99.89 | 99.98 | 99.95 | 99.92 |
| Unit formula (apfu) | |||||||||||
| Na | 0.000 | 0.000 | 0.002 | 0.001 | 0.001 | 0.001 | 0.001 | 0.001 | 0.000 | 0.001 | 0.000 |
| Mg | - | 0.001 | 0.000 | 0.000 | 0.000 | - | 0.001 | - | 0.000 | 0.001 | 0.000 |
| Al | 0.036 | 0.041 | 0.038 | 0.041 | 0.038 | 0.036 | 0.032 | 0.042 | 0.038 | 0.050 | 0.036 |
| Si | 1.003 | 1.006 | 0.995 | 1.003 | 1.004 | 1.006 | 1.001 | 1.000 | 1.007 | 1.005 | 1.001 |
| K | 0.000 | 0.000 | 0.001 | 0.000 | 0.000 | 0.000 | 0.001 | 0.000 | 0.001 | 0.000 | 0.000 |
| Ca | 0.979 | 0.980 | 0.986 | 0.982 | 0.974 | 0.975 | 0.977 | 0.982 | 0.978 | 0.980 | 0.980 |
| Ti | 0.958 | 0.947 | 0.958 | 0.949 | 0.957 | 0.956 | 0.964 | 0.952 | 0.950 | 0.939 | 0.956 |
| V | 0.012 | 0.012 | 0.012 | 0.012 | 0.013 | 0.011 | 0.012 | 0.013 | 0.012 | 0.013 | 0.013 |
| Mn | 0.001 | 0.001 | 0.001 | 0.000 | 0.000 | 0.001 | 0.001 | 0.001 | 0.001 | 0.001 | 0.001 |
| Fe | 0.018 | 0.023 | 0.018 | 0.021 | 0.018 | 0.018 | 0.017 | 0.021 | 0.020 | 0.024 | 0.021 |
| Zr | - | 0.000 | 0.001 | - | 0.000 | - | 0.000 | 0.000 | 0.001 | - | 0.001 |
| SUM | 3.007 | 3.010 | 3.012 | 3.011 | 3.005 | 3.005 | 3.005 | 3.011 | 3.008 | 3.013 | 3.009 |
| MA-1 | |||||||||||||||||||||
|---|---|---|---|---|---|---|---|---|---|---|---|---|---|---|---|---|---|---|---|---|---|
| 1 | 2 | 3 | 4 | 5 | 6 | 7 | 8 | 9 | 10 | 11 | 12 | 13 | 14 | 15 | 16 | 17 | 18 | 19 | Avg. | ||
| Nb | ppm | 2063 | 942 | 187 | 63.9 | 248 | 348 | 549 | 193 | 186 | 380 | 298 | 441 | 263 | 262 | 324 | 295 | 374 | 518 | 280 | 432.43 |
| 1s | 36.46 | 12.42 | 2.68 | 1.06 | 3.56 | 6.39 | 9.09 | 3.05 | 2.50 | 5.55 | 9.69 | 6.74 | 3.82 | 4.24 | 5.35 | 3.04 | 6.52 | 7.87 | 3.92 | 7.05 | |
| Ta | ppm | 120 | 46.2 | 4.24 | 3.74 | 14.3 | 15.0 | 26.7 | 20.0 | 25.9 | 26.7 | 35.8 | 94.0 | 20.5 | 24.4 | 21.5 | 15.5 | 27.4 | 23.0 | 21.7 | 30.87 |
| 1s | 1.70 | 0.58 | 0.09 | 0.08 | 0.22 | 0.27 | 0.46 | 0.26 | 0.38 | 0.32 | 1.58 | 1.09 | 0.33 | 0.42 | 0.32 | 0.22 | 0.43 | 0.33 | 0.32 | 0.49 | |
| Hf | ppm | 20.2 | 15.6 | 2.39 | 0.42 | 0.77 | 1.09 | 3.07 | 2.97 | 4.90 | 3.53 | 15.7 | 49.7 | 18.0 | 3.93 | 3.09 | 2.35 | 3.39 | 8.60 | 4.11 | 8.63 |
| 1s | 0.47 | 0.37 | 0.15 | 0.06 | 0.08 | 0.08 | 0.13 | 0.13 | 0.19 | 0.14 | 1.09 | 0.79 | 0.35 | 0.18 | 0.16 | 0.12 | 0.16 | 0.25 | 0.18 | 0.27 | |
| Y | ppm | 879 | 444 | 177 | 83.9 | 181 | 245 | 184 | 116 | 129 | 152 | 339 | 449 | 199 | 124 | 112 | 40.0 | 98.8 | 442 | 273 | 245.76 |
| 1s | 11.69 | 5.35 | 1.99 | 1.06 | 1.83 | 3.67 | 2.20 | 1.33 | 1.53 | 1.71 | 10.96 | 4.14 | 2.76 | 1.54 | 1.15 | 0.52 | 1.10 | 6.02 | 3.53 | 3.37 | |
| La | ppm | 306 | 600 | 197 | 141 | 326 | 421 | 428 | 187 | 201 | 266 | 160 | 89.6 | 235 | 219 | 217 | 236 | 233 | 325 | 74.7 | 255.85 |
| 1s | 3.68 | 7.06 | 2.14 | 1.88 | 3.26 | 4.98 | 5.38 | 2.29 | 2.73 | 3.54 | 2.14 | 1.21 | 2.73 | 2.91 | 2.59 | 3.32 | 2.85 | 3.72 | 1.33 | 3.14 | |
| Ce | ppm | 1302 | 1799 | 584 | 342 | 728 | 927 | 923 | 470 | 513 | 624 | 550 | 419 | 661 | 556 | 513 | 450 | 530 | 1034 | 327 | 697.46 |
| 1s | 24.92 | 29.76 | 9.13 | 4.75 | 10.59 | 12.83 | 15.90 | 7.23 | 5.50 | 11.04 | 6.00 | 5.42 | 9.09 | 10.93 | 7.21 | 6.22 | 6.60 | 15.32 | 5.92 | 10.76 | |
| Pr | ppm | 188 | 205 | 67.1 | 38.1 | 78.5 | 101 | 96.5 | 53.7 | 59.6 | 69.6 | 79.4 | 75.1 | 81.5 | 61.8 | 55.5 | 43.9 | 60.1 | 140 | 56.0 | 84.73 |
| 1s | 2.93 | 3.15 | 0.93 | 0.61 | 1.16 | 1.83 | 1.38 | 0.86 | 0.84 | 1.08 | 1.42 | 1.02 | 1.07 | 1.15 | 0.78 | 0.97 | 0.86 | 2.35 | 0.95 | 1.33 | |
| Nd | ppm | 931 | 815 | 269 | 150 | 289 | 383 | 365 | 213 | 234 | 271 | 379 | 401 | 331 | 242 | 215 | 148 | 240 | 610 | 288 | 356.62 |
| 1s | 11.61 | 11.83 | 4.01 | 2.22 | 4.11 | 5.15 | 5.63 | 3.45 | 3.32 | 3.93 | 9.03 | 4.94 | 5.09 | 4.30 | 3.46 | 2.92 | 3.01 | 8.60 | 4.64 | 5.33 | |
| Sm | ppm | 233 | 158 | 54.3 | 27.0 | 55.1 | 73.1 | 68.5 | 41.1 | 40.5 | 50.8 | 98.2 | 118 | 67.9 | 42.9 | 39.1 | 18.6 | 43.3 | 138 | 85.7 | 76.49 |
| 1s | 3.18 | 2.60 | 1.07 | 0.67 | 0.95 | 1.60 | 1.36 | 0.86 | 0.90 | 1.30 | 3.26 | 2.21 | 1.20 | 0.96 | 0.87 | 0.63 | 0.88 | 2.58 | 1.44 | 1.50 | |
| Eu | ppm | 143 | 117 | 51.2 | 31.4 | 57.4 | 68.3 | 61.1 | 42.9 | 47.8 | 49.5 | 56.7 | 60.7 | 57.7 | 45.6 | 41.4 | 38.7 | 43.8 | 95.5 | 43.3 | 60.65 |
| 1s | 2.08 | 1.64 | 0.70 | 0.65 | 1.00 | 1.24 | 0.92 | 0.79 | 0.79 | 0.87 | 1.07 | 0.93 | 0.81 | 0.76 | 0.61 | 0.67 | 0.72 | 1.40 | 0.79 | 0.97 | |
| Gd | ppm | 228 | 124 | 46.1 | 22.6 | 44.7 | 61.9 | 52.2 | 33.4 | 33.8 | 41.0 | 92.4 | 119 | 54.4 | 33.4 | 30.9 | 12.4 | 33.6 | 119 | 76.4 | 66.29 |
| 1s | 2.87 | 2.02 | 0.88 | 0.55 | 0.80 | 1.02 | 0.96 | 0.79 | 0.68 | 0.94 | 3.26 | 1.78 | 1.01 | 0.70 | 0.72 | 0.42 | 0.83 | 2.13 | 1.27 | 1.24 | |
| Tb | ppm | 34.9 | 18.0 | 7.04 | 3.17 | 6.39 | 8.69 | 7.09 | 4.65 | 4.85 | 5.67 | 13.9 | 17.7 | 7.95 | 4.76 | 4.26 | 1.58 | 4.31 | 17.4 | 11.5 | 9.67 |
| 1s | 0.48 | 0.30 | 0.12 | 0.08 | 0.13 | 0.15 | 0.13 | 0.11 | 0.11 | 0.11 | 0.50 | 0.24 | 0.15 | 0.12 | 0.09 | 0.06 | 0.11 | 0.31 | 0.20 | 0.18 | |
| Dy | ppm | 196 | 106 | 38.5 | 18.4 | 37.2 | 51.6 | 41.4 | 25.8 | 27.5 | 32.5 | 78.6 | 99.0 | 45.3 | 26.2 | 24.3 | 8.1 | 23.2 | 106 | 66.6 | 55.39 |
| 1s | 2.91 | 1.67 | 0.71 | 0.38 | 0.59 | 0.81 | 0.82 | 0.49 | 0.57 | 0.59 | 2.63 | 1.39 | 0.86 | 0.55 | 0.48 | 0.25 | 0.44 | 1.72 | 0.97 | 0.99 | |
| Ho | ppm | 37.9 | 20.0 | 7.77 | 3.53 | 7.83 | 10.9 | 8.51 | 4.97 | 5.61 | 6.34 | 14.6 | 18.7 | 8.90 | 5.14 | 4.87 | 1.71 | 4.51 | 19.5 | 12.2 | 10.71 |
| 1s | 0.53 | 0.30 | 0.15 | 0.08 | 0.14 | 0.18 | 0.15 | 0.10 | 0.13 | 0.12 | 0.50 | 0.26 | 0.18 | 0.10 | 0.11 | 0.05 | 0.10 | 0.39 | 0.17 | 0.20 | |
| Er | ppm | 95.5 | 54.9 | 20.5 | 10.2 | 22.4 | 30.2 | 23.3 | 14.0 | 15.6 | 18.2 | 37.2 | 46.9 | 23.5 | 14.6 | 12.8 | 5.68 | 13.5 | 51.8 | 29.4 | 28.44 |
| 1s | 1.17 | 0.92 | 0.46 | 0.24 | 0.46 | 0.48 | 0.48 | 0.34 | 0.32 | 0.39 | 1.26 | 0.57 | 0.51 | 0.37 | 0.30 | 0.19 | 0.31 | 0.87 | 0.53 | 0.54 | |
| Tm | ppm | 13.2 | 8.00 | 3.27 | 1.55 | 3.78 | 5.02 | 3.54 | 2.14 | 2.36 | 2.78 | 5.40 | 6.49 | 3.46 | 2.24 | 2.04 | 0.99 | 1.86 | 7.53 | 4.10 | 4.20 |
| 1s | 0.21 | 0.14 | 0.08 | 0.06 | 0.09 | 0.11 | 0.11 | 0.06 | 0.07 | 0.07 | 0.18 | 0.11 | 0.10 | 0.09 | 0.05 | 0.04 | 0.07 | 0.16 | 0.11 | 0.10 | |
| Yb | ppm | 88.5 | 56.2 | 23.2 | 11.5 | 27.5 | 35.8 | 27.3 | 15.2 | 17.5 | 20.3 | 33.8 | 41.0 | 25.1 | 15.8 | 14.2 | 7.65 | 13.8 | 51.7 | 26.5 | 29.08 |
| 1s | 1.46 | 0.91 | 0.55 | 0.34 | 0.50 | 0.63 | 0.49 | 0.42 | 0.40 | 0.37 | 1.23 | 0.74 | 0.55 | 0.44 | 0.34 | 0.30 | 0.37 | 0.82 | 0.54 | 0.60 | |
| Lu | ppm | 10.88 | 7.50 | 3.20 | 1.92 | 4.53 | 5.65 | 4.52 | 2.43 | 2.61 | 3.28 | 4.06 | 4.77 | 3.60 | 2.63 | 2.38 | 1.56 | 2.16 | 6.62 | 3.06 | 4.07 |
| 1s | 0.17 | 0.16 | 0.09 | 0.07 | 0.10 | 0.13 | 0.10 | 0.07 | 0.08 | 0.08 | 0.11 | 0.12 | 0.10 | 0.07 | 0.07 | 0.07 | 0.06 | 0.15 | 0.09 | 0.10 | |
| ΣREE | 3808 | 4088 | 1373 | 802 | 1688 | 2182 | 2110 | 1110 | 1205 | 1461 | 1603 | 1517 | 1607 | 1272 | 1177 | 975 | 1248 | 2722 | 1104 | 1739.64 | |
| LREE/HREE | 4.41 | 9.36 | 8.18 | 9.99 | 9.94 | 9.41 | 11.57 | 9.83 | 9.97 | 10.22 | 4.73 | 3.28 | 8.33 | 11.14 | 11.28 | 23.52 | 11.88 | 6.17 | 3.80 | 9.32 | |
| δEu | 1.89 | 2.55 | 3.13 | 3.88 | 3.53 | 3.11 | 3.12 | 3.54 | 3.95 | 3.32 | 1.82 | 1.56 | 2.90 | 3.68 | 3.64 | 7.79 | 3.51 | 2.27 | 1.64 | 3.20 | |
| δCe | 1.33 | 1.26 | 1.25 | 1.14 | 1.12 | 1.10 | 1.11 | 1.15 | 1.15 | 1.12 | 1.20 | 1.25 | 1.17 | 1.17 | 1.15 | 1.08 | 1.10 | 1.19 | 1.24 | 1.17 | |
| MA-2 | ||||||||||||||||||
|---|---|---|---|---|---|---|---|---|---|---|---|---|---|---|---|---|---|---|
| 1 | 2 | 3 | 4 | 5 | 6 | 7 | 8 | 9 | 10 | 11 | 12 | 13 | 14 | 15 | 16 | Avg. | ||
| Nb | ppm | 399 | 272 | 636 | 305 | 144 | 360 | 489 | 679 | 585 | 651 | 672 | 631 | 504 | 289 | 577 | 393 | 474.19 |
| 1sigma | 6.90 | 5.42 | 13.59 | 5.13 | 1.45 | 6.02 | 8.53 | 9.40 | 8.51 | 10.67 | 9.20 | 8.94 | 9.84 | 5.23 | 9.66 | 4.35 | 7.68 | |
| Ta | ppm | 21.0 | 14.2 | 32.9 | 13.7 | 5.91 | 15.6 | 26.8 | 38.0 | 21.3 | 13.3 | 16.1 | 29.2 | 9.73 | 17.2 | 94.8 | 28.3 | 24.87 |
| 1sigma | 0.39 | 0.28 | 0.46 | 0.28 | 0.10 | 0.27 | 0.69 | 0.52 | 0.45 | 0.26 | 0.30 | 0.50 | 0.17 | 0.35 | 1.41 | 0.47 | 0.43 | |
| Hf | ppm | 1.16 | 0.62 | 30.8 | 1.62 | 0.15 | 1.34 | 8.63 | 12.9 | 2.49 | 3.26 | 5.25 | 10.7 | 2.53 | 1.24 | 43.9 | 17.3 | 8.99 |
| 1sigma | 0.08 | 0.07 | 0.56 | 0.12 | 0.04 | 0.10 | 0.30 | 0.31 | 0.14 | 0.19 | 0.21 | 0.35 | 0.15 | 0.08 | 1.21 | 0.42 | 0.27 | |
| Y | ppm | 189 | 170 | 279 | 98.6 | 128 | 109 | 473 | 506 | 253 | 350 | 373 | 377 | 328 | 115 | 430 | 276 | 278.43 |
| 1sigma | 2.79 | 2.79 | 3.50 | 1.61 | 1.67 | 1.47 | 9.09 | 7.91 | 4.63 | 3.94 | 4.08 | 4.31 | 3.95 | 1.43 | 4.88 | 3.41 | 3.84 | |
| La | ppm | 493 | 418 | 296 | 172 | 208 | 197 | 276 | 336 | 395 | 467 | 392 | 398 | 347 | 262 | 115 | 292 | 316.39 |
| 1sigma | 7.48 | 5.95 | 5.18 | 2.58 | 2.51 | 2.77 | 4.34 | 3.88 | 6.22 | 5.83 | 6.37 | 5.12 | 5.23 | 3.98 | 1.91 | 4.24 | 4.60 | |
| Ce | ppm | 1132 | 909 | 828 | 400 | 475 | 446 | 909 | 1127 | 1038 | 1382 | 1091 | 1245 | 1021 | 609 | 493 | 852 | 872.37 |
| 1sigma | 22.73 | 15.27 | 10.36 | 7.43 | 5.36 | 7.73 | 17.18 | 18.86 | 25.55 | 22.94 | 21.49 | 24.06 | 14.64 | 10.57 | 6.30 | 10.40 | 15.05 | |
| Pr | ppm | 110 | 93.3 | 104 | 43.8 | 53.3 | 50.1 | 126 | 152 | 111 | 150 | 129 | 152 | 123 | 64.5 | 84.0 | 107 | 103.40 |
| 1sigma | 1.99 | 1.53 | 1.77 | 0.62 | 0.62 | 0.94 | 2.06 | 1.78 | 1.80 | 1.94 | 1.62 | 2.17 | 1.77 | 1.18 | 1.16 | 1.82 | 1.55 | |
| Nd | ppm | 389 | 326 | 414 | 170 | 203 | 190 | 603 | 671 | 410 | 578 | 527 | 637 | 495 | 236 | 435 | 433 | 419.84 |
| 1sigma | 5.31 | 5.88 | 6.38 | 2.96 | 2.83 | 2.71 | 11.26 | 8.73 | 7.19 | 8.63 | 8.04 | 9.04 | 7.58 | 3.85 | 4.63 | 6.45 | 6.34 | |
| Sm | ppm | 61.2 | 54.3 | 82.8 | 30.8 | 36.4 | 35.7 | 147 | 160 | 69.5 | 110 | 105 | 122 | 93.2 | 36.5 | 123 | 83.1 | 84.49 |
| 1sigma | 1.32 | 0.96 | 1.82 | 0.70 | 0.74 | 0.92 | 2.95 | 3.31 | 1.44 | 2.19 | 1.88 | 2.03 | 1.44 | 1.01 | 2.18 | 1.47 | 1.65 | |
| Eu | ppm | 72.7 | 60.4 | 66.6 | 31.4 | 40.5 | 36.2 | 77.2 | 89.8 | 70.1 | 96.0 | 86.2 | 92.9 | 85.8 | 49.9 | 61.1 | 74.8 | 68.22 |
| 1sigma | 1.49 | 0.99 | 1.23 | 0.66 | 0.47 | 0.79 | 1.47 | 1.53 | 1.21 | 1.69 | 1.50 | 1.23 | 1.42 | 0.96 | 1.05 | 1.28 | 1.19 | |
| Gd | ppm | 51.3 | 43.9 | 70.7 | 27.4 | 33.0 | 30.3 | 126 | 140 | 54.2 | 89.0 | 93.5 | 105 | 78.0 | 31.2 | 121 | 74.6 | 73.05 |
| 1sigma | 1.27 | 0.92 | 1.31 | 0.82 | 0.78 | 0.81 | 2.68 | 2.72 | 1.04 | 1.50 | 1.73 | 1.60 | 1.45 | 0.84 | 1.51 | 1.40 | 1.40 | |
| Tb | ppm | 7.05 | 6.25 | 10.3 | 3.63 | 4.51 | 4.18 | 19.9 | 21.0 | 7.90 | 12.4 | 13.9 | 15.2 | 11.3 | 4.32 | 17.8 | 10.6 | 10.64 |
| 1sigma | 0.16 | 0.14 | 0.21 | 0.10 | 0.11 | 0.10 | 0.50 | 0.37 | 0.15 | 0.22 | 0.27 | 0.25 | 0.22 | 0.12 | 0.23 | 0.19 | 0.21 | |
| Dy | ppm | 39.2 | 35.6 | 57.9 | 21.1 | 26.7 | 23.7 | 110 | 123 | 47.9 | 74.9 | 80.1 | 87.3 | 69.4 | 24.3 | 102 | 59.0 | 61.37 |
| 1sigma | 0.85 | 0.68 | 0.81 | 0.47 | 0.56 | 0.54 | 2.25 | 2.24 | 0.93 | 1.18 | 1.39 | 1.38 | 1.16 | 0.61 | 1.53 | 1.13 | 1.11 | |
| Ho | ppm | 8.13 | 7.30 | 11.5 | 4.37 | 5.55 | 4.52 | 21.8 | 23.1 | 10.1 | 14.9 | 16.4 | 16.8 | 14.2 | 5.08 | 18.5 | 11.8 | 12.13 |
| 1sigma | 0.17 | 0.15 | 0.23 | 0.12 | 0.12 | 0.11 | 0.44 | 0.43 | 0.24 | 0.26 | 0.28 | 0.23 | 0.24 | 0.13 | 0.21 | 0.23 | 0.22 | |
| Er | ppm | 23.1 | 21.3 | 32.6 | 11.8 | 15.4 | 12.7 | 56.5 | 60.7 | 29.6 | 42.2 | 46.5 | 44.7 | 41.6 | 14.9 | 47.4 | 34.1 | 33.44 |
| 1sigma | 0.43 | 0.41 | 0.55 | 0.31 | 0.31 | 0.35 | 1.36 | 1.10 | 0.50 | 0.69 | 0.82 | 0.82 | 0.67 | 0.34 | 0.78 | 0.62 | 0.63 | |
| Tm | ppm | 3.53 | 3.36 | 4.77 | 1.71 | 2.37 | 1.87 | 7.44 | 8.71 | 4.87 | 6.40 | 6.68 | 6.46 | 6.34 | 2.34 | 6.11 | 4.79 | 4.86 |
| 1sigma | 0.11 | 0.09 | 0.11 | 0.07 | 0.08 | 0.07 | 0.18 | 0.19 | 0.12 | 0.15 | 0.14 | 0.16 | 0.12 | 0.08 | 0.14 | 0.12 | 0.12 | |
| Yb | ppm | 27.5 | 25.5 | 35.7 | 12.8 | 18.3 | 14.8 | 51.5 | 58.2 | 38.4 | 47.1 | 47.0 | 45.5 | 47.1 | 18.8 | 39.5 | 35.2 | 35.19 |
| 1sigma | 0.66 | 0.64 | 0.63 | 0.35 | 0.45 | 0.44 | 1.01 | 1.27 | 0.82 | 0.88 | 0.91 | 0.90 | 0.81 | 0.52 | 0.67 | 0.67 | 0.73 | |
| Lu | ppm | 4.56 | 4.16 | 5.11 | 2.04 | 2.98 | 2.19 | 6.64 | 7.66 | 6.24 | 6.79 | 7.00 | 6.63 | 6.67 | 3.26 | 4.70 | 4.85 | 5.09 |
| 1sigma | 0.12 | 0.10 | 0.12 | 0.08 | 0.10 | 0.07 | 0.17 | 0.19 | 0.13 | 0.14 | 0.14 | 0.11 | 0.14 | 0.10 | 0.12 | 0.11 | 0.12 | |
| ΣREE | 2422 | 2008 | 2020 | 933 | 1125 | 1050 | 2538 | 2978 | 2292 | 3077 | 2641 | 2975 | 2439 | 1362 | 1668 | 2078 | 2100.47 | |
| LREE/HREE | 13.74 | 12.62 | 7.84 | 9.99 | 9.34 | 10.14 | 5.35 | 5.74 | 10.51 | 9.47 | 7.49 | 8.08 | 7.88 | 12.07 | 3.67 | 7.84 | 8.86 | |
| δEu | 3.97 | 3.78 | 2.66 | 3.30 | 3.57 | 3.37 | 1.74 | 1.83 | 3.49 | 2.96 | 2.66 | 2.50 | 3.08 | 4.52 | 1.53 | 2.90 | 2.99 | |
| δCe | 1.19 | 1.13 | 1.16 | 1.13 | 1.11 | 1.10 | 1.19 | 1.22 | 1.22 | 1.28 | 1.19 | 1.24 | 1.21 | 1.15 | 1.23 | 1.18 | 1.18 | |
| Sample No. | Pb | Th | U | Measured Isotopic Ratios | 207Pb-Corrected Ages (Ma) | Dα (α/g) | ||||||
|---|---|---|---|---|---|---|---|---|---|---|---|---|
| ppm | ppm | ppm | 207Pb/206Pb | 1sigma | 207Pb/235U | 1sigma | 206Pb/238U | 1sigma | 206Pb/238U | 1sigma | 1016 | |
| MA-1-01 | 3.39 | 279 | 64.98 | 0.0523 | 0.0037 | 0.1715 | 0.0131 | 0.0242 | 0.0004 | 153.82 | 2.60 | 6.57 |
| MA-1-02 | 3.41 | 422 | 31.00 | 0.0770 | 0.0058 | 0.2475 | 0.0195 | 0.0235 | 0.0006 | 148.08 | 3.59 | 6.56 |
| MA-1-03 | 0.52 | 54.6 | 5.75 | 0.2028 | 0.0220 | 0.5808 | 0.0735 | 0.0253 | 0.0014 | 150.26 | 8.44 | 0.94 |
| MA-1-04 | 0.19 | 14.6 | 4.00 | 0.3291 | 0.0525 | 0.7778 | 0.0975 | 0.0261 | 0.0018 | 145.93 | 10.54 | 0.37 |
| MA-1-05 | 1.32 | 114 | 22.90 | 0.0758 | 0.0070 | 0.2547 | 0.0241 | 0.0247 | 0.0007 | 155.73 | 4.69 | 2.50 |
| MA-1-06 | 1.83 | 143 | 38.76 | 0.0539 | 0.0049 | 0.1770 | 0.0175 | 0.0243 | 0.0005 | 154.72 | 3.25 | 3.65 |
| MA-1-07 | 2.90 | 78.5 | 109 | 0.0567 | 0.0029 | 0.1864 | 0.0110 | 0.0240 | 0.0004 | 152.19 | 2.31 | 6.41 |
| MA-1-08 | 0.43 | 27.7 | 4.46 | 0.4505 | 0.0610 | 1.5010 | 0.1690 | 0.0310 | 0.0021 | 162.96 | 12.16 | 0.55 |
| MA-1-09 | 0.30 | 28.4 | 4.90 | 0.3713 | 0.0798 | 0.8531 | 0.1348 | 0.0247 | 0.0015 | 135.64 | 9.79 | 0.58 |
| MA-1-10 | 0.94 | 62.6 | 23.46 | 0.0837 | 0.0074 | 0.2607 | 0.0231 | 0.0240 | 0.0007 | 150.57 | 4.18 | 1.92 |
| MA-1-11 | 0.46 | 46.4 | 5.46 | 0.2991 | 0.0471 | 0.9016 | 0.0863 | 0.0257 | 0.0016 | 145.71 | 9.53 | 0.83 |
| MA-1-12 | 0.43 | 46.0 | 5.44 | 0.2900 | 0.0553 | 0.7831 | 0.1058 | 0.0254 | 0.0011 | 145.18 | 7.21 | 0.82 |
| MA-1-13 | 0.72 | 69.4 | 5.41 | 0.3799 | 0.0534 | 1.3836 | 0.1793 | 0.0324 | 0.0018 | 176.21 | 10.74 | 1.10 |
| MA-1-14 | 0.40 | 29.6 | 7.99 | 0.1598 | 0.0185 | 0.5415 | 0.0525 | 0.0270 | 0.0013 | 163.69 | 7.88 | 0.75 |
| MA-1-15 | 0.46 | 35.4 | 9.96 | 0.1723 | 0.0218 | 0.4986 | 0.0498 | 0.0247 | 0.0011 | 148.87 | 6.49 | 0.92 |
| MA-1-16 | 0.60 | 12.2 | 23.57 | 0.0841 | 0.0089 | 0.2597 | 0.0268 | 0.0238 | 0.0007 | 149.09 | 4.10 | 1.33 |
| MA-1-17 | 1.09 | 12.4 | 44.33 | 0.0652 | 0.0052 | 0.2149 | 0.0181 | 0.0243 | 0.0004 | 153.89 | 2.71 | 2.37 |
| MA-1-18 | 1.39 | 162 | 13.59 | 0.0885 | 0.0106 | 0.2857 | 0.0316 | 0.0254 | 0.0009 | 158.92 | 5.44 | 2.60 |
| MA-1-19 | 0.30 | 25.6 | 3.99 | 0.4358 | 0.1391 | 0.9514 | 0.1316 | 0.0278 | 0.0018 | 147.42 | 14.38 | 0.50 |
| MA-2-01 | 2.30 | 130 | 66.67 | 0.0545 | 0.0039 | 0.1728 | 0.0123 | 0.0236 | 0.0004 | 149.03 | 2.99 | 4.86 |
| MA-2-02 | 1.46 | 107 | 34.16 | 0.0698 | 0.0051 | 0.2337 | 0.0184 | 0.0244 | 0.0005 | 149.62 | 4.83 | 2.96 |
| MA-2-03 | 1.24 | 152 | 12.20 | 0.0938 | 0.0169 | 0.2777 | 0.0495 | 0.0244 | 0.0012 | 143.67 | 10.93 | 2.39 |
| MA-2-04 | 0.55 | 29.4 | 14.51 | 0.0841 | 0.0142 | 0.2764 | 0.0408 | 0.0257 | 0.0010 | 153.93 | 9.37 | 1.07 |
| MA-2-05 | 0.69 | 60.9 | 10.02 | 0.1144 | 0.0142 | 0.3933 | 0.0404 | 0.0278 | 0.0012 | 157.29 | 14.31 | 1.22 |
| MA-2-06 | 0.94 | 34.3 | 33.01 | 0.0571 | 0.0058 | 0.1822 | 0.0190 | 0.0241 | 0.0006 | 151.54 | 4.24 | 2.05 |
| MA-2-07 | 1.22 | 140 | 11.44 | 0.0993 | 0.0124 | 0.3333 | 0.0400 | 0.0249 | 0.0008 | 144.74 | 9.88 | 2.22 |
| MA-2-08 | 1.70 | 199 | 15.81 | 0.1118 | 0.0161 | 0.3576 | 0.0459 | 0.0254 | 0.0008 | 144.52 | 12.34 | 3.13 |
| MA-2-09 | 2.40 | 248 | 32.40 | 0.0805 | 0.0069 | 0.2750 | 0.0228 | 0.0255 | 0.0007 | 153.57 | 7.14 | 4.53 |
| MA-2-10 | 2.74 | 337 | 24.44 | 0.0876 | 0.0085 | 0.2709 | 0.0269 | 0.0229 | 0.0007 | 136.50 | 7.39 | 5.18 |
| MA-2-11 | 2.34 | 260 | 19.86 | 0.1084 | 0.0097 | 0.3911 | 0.0355 | 0.0268 | 0.0008 | 153.38 | 11.76 | 4.05 |
| MA-2-12 | 2.10 | 251 | 18.64 | 0.0730 | 0.0089 | 0.2522 | 0.0308 | 0.0256 | 0.0007 | 156.05 | 6.29 | 3.88 |
| MA-2-13 | 2.03 | 250 | 18.44 | 0.0840 | 0.0143 | 0.2735 | 0.0413 | 0.0255 | 0.0008 | 152.66 | 8.61 | 3.86 |
| MA-2-14 | 0.88 | 62.2 | 21.13 | 0.0602 | 0.0066 | 0.2129 | 0.0241 | 0.0256 | 0.0008 | 160.21 | 5.52 | 1.78 |
| MA-2-15 | 0.49 | 49.0 | 6.96 | 0.1050 | 0.0223 | 0.3180 | 0.0569 | 0.0265 | 0.0014 | 152.47 | 13.98 | 0.92 |
| MA-2-16 | 0.96 | 114 | 7.43 | 0.1593 | 0.0281 | 0.4696 | 0.0697 | 0.0271 | 0.0014 | 139.82 | 22.48 | 1.72 |
References
- Cao, M.J.; Qin, K.Z.; Li, G.M.; Evans, N.J.; Jin, L.Y. LA-(MC)-ICP-MS trace element and Nd isotopic compositions and genesis of polygenetic titanite from the Baogutu reduced porphyry Cu deposit, Western Junggar, NW China. Ore Geol. Rev. 2015, 65, 940–954. [Google Scholar] [CrossRef]
- Frost, B.R.; Chamberlain, K.R.; Schumacher, J.C. Sphene (titanite): Phase relations and role as a geochronometer. Chem. Geol. 2001, 172, 131–148. [Google Scholar] [CrossRef]
- Li, J.W.; Deng, X.D.; Zhou, M.F.; Lin, Y.S.; Zhao, X.F.; Guo, J.L. Laser ablation ICP-MS titanite U-Th-Pb dating of hydrothermal ore deposits: A case study of the Tonglushan Cu-Fe-Au skarn deposit, SE Hubei Province, China. Chem. Geol. 2010, 270, 56–67. [Google Scholar] [CrossRef]
- Xiao, X.; Zhou, T.F.; White, N.C.; Zhang, L.J.; Fan, Y.; Chen, X.F. Multiple generations of titanites and their geochemical characteristics record the magmatic-hydrothermal processes and timing of the Dongguashan porphyry-skarn Cu-Au system, Tongling district, Eastern China. Miner. Depos. 2021, 56, 363–380. [Google Scholar] [CrossRef]
- Laurs, B.M. Sphene from northern Pakistan. Gems Gemol. 2010, 46, 152–153. [Google Scholar]
- Quinn, E.P. Sphene from Afghanistan. Gems Gemol. 2006, 42, 180–182. [Google Scholar]
- Renfro, N. Vanadium-bearing color-change sphene from Pakistan/Afghanistan. Gems Gemol. 2011, 47, 327. [Google Scholar]
- Zhang, M.; Salje, E.K.H.; Bismayer, U.; Unruh, H.G.; Wruck, B.; Schmidt, C. Phase Transition(S) in Titanite Catisio5—An Infrared Spectroscopic, Dielectric Response and heat-capacity study. Phys. Chem. Miner. 1995, 22, 41–49. [Google Scholar] [CrossRef]
- Lodzinski, M.; Wrzalik, R.; Sitarz, M. Micro-Raman spectroscopy studies of some accessory minerals from pegmatites of the Sowie Mts and Strzegom-Sobotka massif, Lower Silesia, Poland. J. Mol. Struct. 2005, 744, 1017–1026. [Google Scholar] [CrossRef]
- Deng, X.D.; Li, J.W.; Zhou, M.F.; Zhao, X.F.; Yan, D.R. In-situ LA-ICPMS trace elements and U-Pb analysis of titanite from the Mesozoic Ruanjiawan W-Cu-Mo skarn deposit, Daye district, China. Ore Geol. Rev. 2015, 65, 990–1004. [Google Scholar] [CrossRef]
- Gao, X.Y.; Zheng, Y.F.; Chen, Y.X.; Guo, J.L. Geochemical and U-Pb age constraints on the occurrence of polygenetic titanites in UHP metagranite in the Dabie orogen. Lithos 2012, 136, 93–108. [Google Scholar] [CrossRef]
- Tiepolo, M.; Oberti, R.; Vannucci, R. Trace-element incorporation in titanite: Constraints from experimentally determined solid/liquid partition coefficients. Chem. Geol. 2002, 191, 105–119. [Google Scholar] [CrossRef]
- Fu, Y.; Sun, X.M.; Hollings, P.; Li, D.F.; Yang, T.J. Geochronology and trace element geochemistry of titanite in the Machangqing Cu-Mo-dominated polymetallic deposit, Yunnan Province, southwest China. J. Asian Earth Sci. 2018, 158, 398–414. [Google Scholar] [CrossRef]
- Kohn, M.J. Titanite Petrochronology. Rev. Miner. Geochem. 2017, 83, 419–441. [Google Scholar] [CrossRef]
- Jiang, P.; Yang, K.F.; Fan, H.R.; Liu, X.; Cai, Y.C.; Yang, Y.H. Titanite-scale insights into multi-stage magma mixing in Early Cretaceous of NW Jiaodong terrane, North China Craton. Lithos 2016, 258, 197–214. [Google Scholar] [CrossRef]
- Chew, D.M.; Petrus, J.A.; Kamber, B.S. U-Pb LA-ICPMS dating using accessory mineral standards with variable common Pb. Chem. Geol. 2014, 363, 185–199. [Google Scholar] [CrossRef]
- Luo, T.; Hu, Z.C.; Zhang, W.; Liu, Y.S.; Zong, K.Q.; Zhou, L.; Zhang, J.F.; Hu, S.H. Water Vapor-Assisted “Universal” Nonmatrix-Matched Analytical Method for the in Situ U-Pb Dating of Zircon, Monazite, Titanite, and Xenotime by Laser Ablation-Inductively Coupled Plasma Mass Spectrometry. Anal. Chem. 2018, 90, 9016–9024. [Google Scholar] [CrossRef] [PubMed]
- Sylvester, P.J. Trends in analytical developments and earth science applications in LA-ICP-MS and LA-MC-ICP-MS for 2004 and 2005. Geostand. Geoanal. Res. 2006, 30, 197–207. [Google Scholar] [CrossRef]
- Domènech, M.; Teixell, A.; Babault, J.; Arboleya, M.L. The inverted Triassic rift of the Marrakech High Atlas: A reappraisal of basin geometries and faulting histories. Tectonophysics 2015, 663, 177–191. [Google Scholar] [CrossRef]
- Laville, E.; Pique, A.; Amrhar, M.; Charroud, M. A restatement of the Mesozoic Atlasic Rifting (Morocco). J. Afr. Earth Sci. 2004, 38, 145–153. [Google Scholar] [CrossRef]
- Stampfli, G.M.; Borel, G.D. A plate tectonic model for the Paleozoic and Mesozoic constrained by dynamic plate boundaries and restored synthetic oceanic isochrons. Earth Planet. Sc. Lett. 2002, 196, 17–33. [Google Scholar] [CrossRef]
- Teixell, A.; Arboleya, M.L.; Julivert, M.; Charroud, M. Tectonic shortening and topography in the central High Atlas (Morocco). Tectonics 2003, 22, 1051. [Google Scholar] [CrossRef]
- Gouiza, M.; Bertotti, G.; Hafid, M.; Cloetingh, S. Kinematic and thermal evolution of the Moroccan rifted continental margin: Doukkala-High Atlas transect. Tectonics 2010, 29, 1–22. [Google Scholar] [CrossRef]
- Ouabid, M.; Raji, O.; Dautria, J.M.; Bodinier, J.L.; Parat, F.; El Messbahi, H.; Garrido, C.J.; Ahechach, Y. Petrological and geochemical constraints on the origin of apatite ores from Mesozoic alkaline intrusive complexes, Central High-Atlas, Morocco. Ore Geol. Rev. 2021, 136, 104250. [Google Scholar] [CrossRef]
- Bensalah, M.K.; Youbi, N.; Mata, J.; Madeira, J.; Martins, L.; Font, E.; Medina, F.; Marzoli, A.; El Hachimi, H.; Bertrand, H.; et al. Reply to Comment on “The Jurassic-Cretaceous basaltic magmatism of the Oued El-Abid syncline (High Atlas, Morocco): Physical volcanology, geochemistry and geodynamic implications” by Andre Michard et al. (2013) [J. Afr. Earth Sci. 88 (December) (2013) 101–105]. J. Afr. Earth Sci. 2016, 118, 320–323. [Google Scholar] [CrossRef]
- de Lamotte, D.F.; Saint Bezar, B.A.; Bracène, R.; Mercier, E. The two main steps of the Atlas building and geodynamics of the western Mediterranean. Tectonics 2000, 19, 740–761. [Google Scholar] [CrossRef]
- Tesón, E.; Teixell, A. Sequence of thrusting and syntectonic sedimentation in the eastern Sub-Atlas thrust belt (Dades and Mgoun valleys, Morocco). Int. J. Earth Sci. 2008, 97, 103–113. [Google Scholar] [CrossRef]
- Michard, A.; Ibouh, H.; Charrière, A. Syncline-topped anticlinal ridges from the High Atlas: A Moroccan conundrum, and inspiring structures from the Syrian Arc, Israel. Terra Nova 2011, 23, 314–323. [Google Scholar] [CrossRef]
- Bensalah, M.K.; Youbi, N.; Mata, J.; Madeira, J.; Martins, L.; El Hachimi, H.; Bertrand, H.; Marzoli, A.; Bellieni, G.; Doblas, M.; et al. The Jurassic-Cretaceous basaltic magmatism of the Oued El-Abid syncline (High Atlas, Morocco): Physical volcanology, geochemistry and geodynamic implications. J. Afr. Earth Sci. 2013, 81, 60–81. [Google Scholar] [CrossRef]
- Rahimi, A.; Saidi, A.; Bouabdelli, M.; Beraaouz, E.H.; Rocci, G. Crystallization and fractionation of the post-liassic intrusive series of Tasraft (central High Atlas, Morocco). Cr Acad. Sci. Ii A 1997, 324, 197–203. [Google Scholar]
- Essaifi, A.; Zayane, R. Petrogenesis and origin of the Upper Jurassic-Lower Cretaceous magmatism in Central High Atlas (Morocco): Major, trace element and isotopic (Sr-Nd) constraints. J. Afr. Earth Sci. 2018, 137, 229–245. [Google Scholar] [CrossRef]
- Saura, E.; Vergés, J.; Martín-Martín, J.D.; Mesager, G.; Moragas, M.; Razin, P.; Grélaud, C.; Joussiaume, R.; Malaval, M.; Homke, S.; et al. Syn- to post-rift diapirism and minibasins of the Central High Atlas (Morocco): The changing face of a mountain belt. J. Geol. Soc. Lond. 2014, 171, 97–105. [Google Scholar] [CrossRef]
- Salje, E.; Schmidt, C.; Bismayer, U. Structural Phase-Transition in Titanite, Catisio5—A Raman-Spectroscopic Study. Phys. Chem. Miner. 1993, 19, 502–506. [Google Scholar] [CrossRef]
- Zhang, M.; Salje, E.K.H.; Redfern, S.A.T.; Bismayer, U.; Groat, L.A. Intermediate structures in radiation damaged titanite (CaTiSiO5): A Raman spectroscopic study. J. Phys-Condens. Mat. 2013, 25, 115402. [Google Scholar] [CrossRef]
- Bismayer, U.; Paulmann, C.; Groat, L.; Zhang, M. Local Phenomena in metamict Titanite. Acta Phys. Pol. A 2010, 117, 74–77. [Google Scholar] [CrossRef]
- Mazur, L.; Koszelow, D.; Zajusz, M.; Lapinski, M.; Bik, M.; Zajac, P.; Adamczyk, A.; Rutkowski, P.; Molin, S.; Brylewski, T. Comparison of Cu1.3Mn1.7O4 spinels doped with Ni or Fe and synthesized via wet chemistry and solid-state reaction methods, designed as potential coating materials for metallic interconnects. J. Eur. Ceram. Soc. 2023, 43, 5557–5574. [Google Scholar] [CrossRef]
- Hawthorne, F.C.; Groat, L.A.; Raudsepp, M.; Ball, N.A.; Kimata, M.; Spike, F.D.; Gaba, R.; Halden, N.M.; Lumpkin, G.R.; Ewing, R.C.; et al. Alpha-Decay Damage in Titanite. Am. Miner. 1991, 76, 370–396. [Google Scholar]
- Meyer, H.W.; Zhang, M.; Bismayer, U.; Salje, E.K.H.; Schmidt, C.; Kek, S.; Morgenroth, W.; Bleser, T. Phase transformation of natural titanite: An infrared, Raman spectroscopic, optical birefringence and X-ray diffraction study. Phase Transit. 1996, 59, 39–60. [Google Scholar] [CrossRef]
- Zhang, M.; Salje, E.; Bismayer, U. Structural phase transition near 825 K in titanite: Evidence from infrared spectroscopic observations. Am. Miner. 1997, 82, 30–35. [Google Scholar] [CrossRef]
- Makreski, P.; Jovanovski, G.; Stojanceska, S. Minerals from Macedonia XIII: Vibrational spectra of some commonly appearing nesosilicate minerals. J. Mol. Struct. 2005, 744, 79–92. [Google Scholar] [CrossRef]
- Zhang, M.; Salje, E.K.H.; Bismayer, U.; Groat, L.A.; Malcherek, T. Metamictization and recrystallization of titanite: An infrared spectroscopic study. Am. Miner. 2002, 87, 882–890. [Google Scholar] [CrossRef]
- Hammer, V.M.F.; Beran, A.; Endisch, D.; Rauch, F. OH concentrations in natural titanites determined by FTIR spectroscopy and nuclear reaction analysis. Eur. J. Mineral. 1996, 8, 281–288. [Google Scholar] [CrossRef]
- Zhang, M.; Salje, E.K.H.; Malcherek, T.; Bismayer, U.; Groat, L.A. Dehydration of metamict titanite: An infrared spectroscopic study. Can. Miner. 2000, 38, 119–130. [Google Scholar] [CrossRef]
- Salje, E.K.H.; Zhang, M.; Groat, L.A. Dehydration and recrystallization of radiation-damaged titanite under thermal annealing. Phase Transit. 2000, 71, 173–187. [Google Scholar] [CrossRef]
- Heyns, A.M.; Harden, P.M.; Prinsloo, L.C. Resonance Raman study of the high-pressure phase transition in chromium-doped titanite, CaTiOSiO4. J. Raman Spectrosc. 2000, 31, 837–841. [Google Scholar] [CrossRef]
- Heyns, A.M.; Harden, P.M. The temperature dependence of the Raman spectra of chromium-doped titanite (CaTiOSiO4). J. Raman Spectrosc. 2013, 44, 1615–1624. [Google Scholar] [CrossRef]
- Dumanska-Slowik, M.; Pieczka, A.; Natkaniec-Nowak, L.; Kunecki, P.; Gawel, A.; Heflik, W.; Smolinski, W.; Kozub-Budzyn, G. Mg-enriched erythrite from Bou Azzer, Anti-Atlas Mountains, Morocco: Geochemical and spectroscopic characteristics. Miner. Petrol. 2018, 112, 381–392. [Google Scholar] [CrossRef]
- Beirau, T.; Bismayer, U.; Mihailova, B.; Paulmann, C.; Groat, L. Structural phenomena of metamict titanite: A synchrotron, X-ray diffraction and vibrational spectroscopic study. Phase Transit. 2010, 83, 694–702. [Google Scholar] [CrossRef]
- Sun, S.-S.; McDonough, W.F. Chemical and isotopic systematics of oceanic basalts: Implications for mantle composition and processes. Geol. Soc. Lond. Spec. Publ. 1989, 42, 313–345. [Google Scholar] [CrossRef]
- Beirau, T.; Mihailova, B.; Matveeva, G.; Kolb, U.; Malcherek, T.; Groat, L.A.; Bismayer, U. Structural anisotropy and annealing-induced nanoscale atomic rearrangements in metamict titanite. Am. Miner. 2012, 97, 1354–1365. [Google Scholar] [CrossRef]
- Zhang, M.; Salje, E.K.H.; Farnan, I.; Graeme-Barber, A.; Daniel, P.; Ewing, R.C.; Clark, A.M.; Leroux, H. Metamictization of zircon: Raman spectroscopic study. J. Phys-Condens. Mat. 2000, 12, 1915–1925. [Google Scholar] [CrossRef]
- Murakami, T.; Chakoumakos, B.C.; Ewing, R.C.; Lumpkin, G.R.; Weber, W.J. Alpha-Decay Event Damage in Zircon. Am. Miner. 1991, 76, 1510–1532. [Google Scholar]
- Salje, E.K.H.; Taylor, R.D.; Safarik, D.J.; Lashley, J.C.; Groat, L.A.; Bismayer, U.; Evans, R.J.; Friedman, R. Evidence for direct impact damage in metamict titanite CaTiSiO5. J. Phys-Condens. Mat. 2012, 24, 052202. [Google Scholar] [CrossRef] [PubMed]
- Ríos, S.; Salje, E.K.H.; Zhang, M.; Ewing, R.C. Amorphization in zircon: Evidence for direct impact damage. J. Phys-Condens. Mat. 2000, 12, 2401–2412. [Google Scholar] [CrossRef]
- Duan, Z.; Li, J.W. Zircon and titanite U-Pb dating of the Zhangjiawa iron skarn deposit, Luxi district, North China Craton: Implications for a craton-wide iron skarn mineralization. Ore Geol. Rev. 2017, 89, 309–323. [Google Scholar] [CrossRef]
- Fu, Y.; Sun, X.M.; Zhou, H.Y.; Lin, H.; Yang, T.J. In-situ LA-ICP-MS U-Pb geochronology and trace elements analysis of polygenetic titanite from the giant Beiya gold-polymetallic deposit in Yunnan Province, Southwest China. Ore Geol. Rev. 2016, 77, 43–56. [Google Scholar] [CrossRef]
- Hou, Z.Q.; Xu, B.; Zhang, H.; Zheng, Y.C.; Wang, R.; Liu, Y.; Miao, Z.; Gao, L.; Zhao, Z.; Griffin, W.L.; et al. Refertilized continental root controls the formation of the Mianning-Dechang carbonatite-associated rare-earth-element ore system. Commun. Earth Environ. 2023, 4, 293. [Google Scholar] [CrossRef]
- Hu, H.; Li, J.W.; McFarlane, C.R.M. Hydrothermal titanite from the Chengchao iron skarn deposit: Temporal constraints on iron mineralization, and its potential as a reference material for titanite U-Pb dating. Miner. Petrol. 2017, 111, 593–608. [Google Scholar] [CrossRef]
- Li, J.; Xu, L.L.; Bi, X.W.; Tang, Y.Y.; Sheng, X.Y.; Yu, H.J.; Liu, G.; Ma, R. New titanite U-Pb and molybdenite Re-Os ages for a hydrothermal vein-type Cu deposit in the Lanping Basin, Yunnan, SW China: Constraints on regional metallogeny and implications for exploration. Miner. Depos. 2021, 56, 441–456. [Google Scholar] [CrossRef]
- Pan, L.C.; Hu, R.Z.; Bi, X.W.; Li, C.; Wang, X.S.; Zhu, J.J. Titanite major and trace element compositions as petrogenetic and metallogenic indicators of Mo ore deposits: Examples from four granite plutons in the southern Yidun arc, SW China. Am. Miner. 2018, 103, 1417–1434. [Google Scholar] [CrossRef]
- Song, S.W.; Mao, J.W.; Xie, G.Q.; Chen, L.; Santosh, M.; Chen, G.H.; Rao, J.F.; Ouyang, Y.P. In situ LA-ICP-MS U-Pb geochronology and trace element analysis of hydrothermal titanite from the giant Zhuxi W (Cu) skarn deposit, South China. Miner. Depos. 2019, 54, 569–590. [Google Scholar] [CrossRef]
- Xu, B.; Griffin, W.L.; Xiong, Q.; Hou, Z.Q.; O’Reilly, S.Y.; Guo, Z.; Pearson, N.J.; Gréau, Y.; Yang, Z.M.; Zheng, Y.C. Ultrapotassic rocks and xenoliths from South Tibet: Contrasting styles of interaction between lithospheric mantle and asthenosphere during continental collision. Geology 2017, 45, 51–54. [Google Scholar] [CrossRef]
- Xu, B.; Hou, Z.Q.; Griffin, W.L.; Zheng, Y.C.A.; Wang, T.; Guo, Z.; Hou, J.; Santosh, M.; O’Reilly, S.Y. Cenozoic lithospheric architecture and metallogenesis in Southeastern Tibet. Earth-Sci Rev. 2021, 214, 103472. [Google Scholar] [CrossRef]
- Li, M. Magmatic-Hydrothermal Process of the Pulang Porphyry Copper Deposit, Western Yunnan: Metallogenic Indicator from the Titanite. Master’s Thesis, China University of Geosciences, Beijing, China, 2020. [Google Scholar]
- Yang, J.-S. Diagenesis and Metallogenesis of the Erdaohe Pb-Zn-Ag Deposit, Inner Mongolia. Ph.D. Thesis, China University of Geosciences, Wuhan, China, 2021. [Google Scholar]
- Keppler, H.; Wyllie, P.J. Role of Fluids in Transport and Fractionation of Uranium and Thorium in Magmatic Processes. Nature 1990, 348, 531–533. [Google Scholar] [CrossRef]
- Xu, B.; Hou, Z.Q.; Griffin, W.L.; Yu, J.X.; Long, T.; Zhao, Y.; Wang, T.; Fu, B.; Belousova, E.; O’Reilly, S.Y. Apatite halogens and Sr-O and zircon Hf-O isotopes: Recycled volatiles in Jurassic porphyry ore systems in southern Tibet. Chem. Geol. 2022, 605, 120924. [Google Scholar] [CrossRef]
- Xu, B.; Hou, Z.Q.; Griffin, W.L.; Lu, Y.J.; Belousova, E.; Xu, J.F.; O’Reilly, S.Y. Recycled volatiles determine fertility of porphyry deposits in collisional settings. Am. Miner. 2021, 106, 656–661. [Google Scholar] [CrossRef]
- Yuan, P.; Xu, B.; Wang, Z.; Liu, D. A Study on Apatite from Mesozoic Alkaline Intrusive Complexes, Central High Atlas, Morocco. Crystals 2022, 12, 461. [Google Scholar] [CrossRef]
- Sverjensky, D.A. Europium Redox Equilibria in Aqueous-Solution. Earth Planet. Sc. Lett. 1984, 67, 70–78. [Google Scholar] [CrossRef]
- Xu, L.L.; Bi, X.W.; Hu, R.Z.; Tang, Y.Y.; Wang, X.S.; Xu, Y. LA-ICP-MS mineral chemistry of titanite and the geological implications for exploration of porphyry Cu deposits in the Jinshajiang—Red River alkaline igneous belt, SW China. Miner. Petrol. 2015, 109, 181–200. [Google Scholar] [CrossRef]
- Storey, C.D.; Smith, M.P.; Jeffries, T.E. In situ LA-ICP-MS U-Pb dating of metavolcanics of Norrbotten, Sweden: Records of extended geological histories in complex titanite grains. Chem. Geol. 2007, 240, 163–181. [Google Scholar] [CrossRef]
- Horie, K.; Hidaka, H.; Gauthier-Lafaye, F. Elemental distribution in apatite, titanite and zircon during hydrothermal alteration: Durability of immobilization mineral phases for actinides. Phys. Chem. Earth 2008, 33, 962–968. [Google Scholar] [CrossRef]
- Che, X.D.; Linnen, R.L.; Wang, R.C.; Groat, L.A.; Brand, A.A. Distribution of Trace and Rare Earth Elements in Titanite from Tungsten and Molybdenum Deposits in Yukon and British Columbia, Canada. Can. Miner. 2013, 51, 415–438. [Google Scholar] [CrossRef]
- Marzoli, A.; Bertrand, H.; Knight, K.B.; Cirilli, S.; Buratti, N.; Vérati, C.; Nomade, S.; Renne, P.R.; Youbi, N.; Martini, R.; et al. Synchrony of the Central Atlantic magmatic province and the Triassic-Jurassic boundary climatic and biotic crisis. Geology 2004, 32, 973–976. [Google Scholar] [CrossRef]
- Knight, K.B.; Nomade, S.; Renne, P.R.; Marzoli, A.; Bertrand, H.; Youbi, N. The central Atlantic magmatic province at the Triassic-Jurassic boundary: Paleomagnetic and 40Ar/39Ar evidence from Morocco for brief, episodic volcanism. Earth Planet. Sci. Lett. 2004, 228, 143–160. [Google Scholar] [CrossRef]
- Nomade, S.; Knight, K.B.; Beutel, E.; Renne, P.R.; Verati, C.; Féraud, G.; Marzoli, A.; Youbi, N.; Bertrand, H. Chronology of the Central Atlantic Magmatic Province: Implications for the Central Atlantic rifting processes and the Triassic-Jurassic biotic crisis. Palaeogeogr. Palaeocl. 2007, 244, 326–344. [Google Scholar] [CrossRef]
- Verati, C.; Rapaille, C.; Féraud, G.; Marzoli, A.; Bertrand, H.; Youbi, N. 40Ar/39Ar ages and duration of the Central Atlantic Magmatic Province volcanism in Morocco and Portugal and its relation to the Triassic-Jurassic boundary. Palaeogeogr. Palaeocl. 2007, 244, 308–325. [Google Scholar] [CrossRef]
- Moratti, G.; Benvenuti, M.; Santo, A.P.; Laurenzi, M.A.; Braschi, E.; Tommasini, S. New40Ar-Ar dating of Lower Cretaceous basalts at the southern front of the Central High Atlas, Morocco: Insights on late Mesozoic tectonics, sedimentation and magmatism. Int. J. Earth Sci. 2018, 107, 2491–2515. [Google Scholar] [CrossRef]
- Bouabdellah, M.; Hoernle, K.; Kchit, A.; Duggen, S.; Hauff, F.; Klügel, A.; Lowry, D.; Beaudoin, G. Petrogenesis of the Eocene Tamazert Continental Carbonatites (Central High Atlas, Morocco): Implications for a Common Source for the Tamazert and Canary and Cape Verde Island Carbonatites. J. Petrol. 2010, 51, 1655–1686. [Google Scholar] [CrossRef]
- Marks, M.A.W.; Schilling, J.; Coulson, I.M.; Wenzel, T.; Markl, G. The alkaline-peralkaline Tamazeght complex, High Atlas Mountains, Morocco: Mineral chemistry and petrological constraints for derivation from a compositionally heterogeneous mantle source. J. Petrol. 2008, 49, 1097–1131. [Google Scholar] [CrossRef]
- Salvi, S.; Fontan, F.; Monchoux, P.; Williams-Jones, A.E.; Moine, B. Hydrothermal mobilization of high field strength elements in alkaline igneous systems: Evidence from the Tamazeght complex (Morocco). Econ. Geol. Bull. Soc. 2000, 95, 559–575. [Google Scholar] [CrossRef]
- Haddoumi, H.; Charrière, A.; Mojon, P.O. Stratigraphy and sedimentology of the Jurassic-Cretaceous continental “Redbeds” of the central High Atlas (Morocco): Paleogeographical and geodynamical implications. Geobios-Lyon. 2010, 43, 433–451. [Google Scholar] [CrossRef]
- Allouban, M.; Karaoui, B.; Mahmoudi, A.; Baïdder, L.; Hafid, A.; Goodenough, K.; Eddebbi, A. Petrographic and geochemical study of Jurassic-Cretaceous intrusive massifs (Gabbros-syenites) of the Eastern High Atlas, Morocco (Rich-Talsint axis). J. Afr. Earth Sci. 2021, 184, 104280. [Google Scholar] [CrossRef]
- Schaltegger, U.; Ovtcharova, M.; Gaynor, S.P.; Schoene, B.; Wotzlaw, J.F.; Davies, J.F.H.L.; Farina, F.; Greber, N.D.; Szymanowski, D.; Chelle-Michou, C. Long-term repeatability and interlaboratory reproducibility of high-precision ID-TIMS U-Pb geochronology. J. Anal. At. Spectrom. 2021, 36, 1466–1477. [Google Scholar] [CrossRef]


| Properties | Data | |
|---|---|---|
| MA-1 | MA-2 | |
| Color | Yellow | Yellow |
| Diaphaneity | Transparent | Translucent |
| Luster | Greasy | Weak greasy |
| RI | >1.78 | >1.78 |
| SG | 3.52 | 3.54 |
| Fluorescence reaction | Inert | Inert |
| Chelsea color filter | Unchanged | Unchanged |
| Raman Bands(cm−1) | Assignment [9,40,45] | |
|---|---|---|
| MA-1 | MA-2 | |
| 422 | 420 | ν4 anti-symmetric, bending, deformation Si-O-Si |
| 466 | 465 | ν4 anti-symmetric, bending, deformation Si-O-Si |
| 531 | 529 | ν4 anti-symmetric, bending, deformation Si-O-Si |
| 540 | 540 | ν4 anti-symmetric, bending, deformation Si-O-Si |
| 606 | 606 | Stretching Ti-O in [SiO6]8− octahedron |
| 816 | ν1 symmetric, stretching Si-O | |
| 855 | 853 | ν1 symmetric, stretching Si-O |
| 870 | 870 | ν3 anti-symmetric, stretching Si-O |
| 911 | 909 | ν3 anti-symmetric, stretching Si-O |
Disclaimer/Publisher’s Note: The statements, opinions and data contained in all publications are solely those of the individual author(s) and contributor(s) and not of MDPI and/or the editor(s). MDPI and/or the editor(s) disclaim responsibility for any injury to people or property resulting from any ideas, methods, instructions or products referred to in the content. |
© 2024 by the authors. Licensee MDPI, Basel, Switzerland. This article is an open access article distributed under the terms and conditions of the Creative Commons Attribution (CC BY) license (https://creativecommons.org/licenses/by/4.0/).
Share and Cite
Yuan, Y.; Miao, Z.; Zhao, Y.; Xu, B.; Gu, J.; Yuan, P. Gemological and Chemical Characterization of Gem-Quality Titanite from Morocco. Crystals 2024, 14, 80. https://doi.org/10.3390/cryst14010080
Yuan Y, Miao Z, Zhao Y, Xu B, Gu J, Yuan P. Gemological and Chemical Characterization of Gem-Quality Titanite from Morocco. Crystals. 2024; 14(1):80. https://doi.org/10.3390/cryst14010080
Chicago/Turabian StyleYuan, Yu, Zhuang Miao, Yi Zhao, Bo Xu, Jialu Gu, and Pengyu Yuan. 2024. "Gemological and Chemical Characterization of Gem-Quality Titanite from Morocco" Crystals 14, no. 1: 80. https://doi.org/10.3390/cryst14010080
APA StyleYuan, Y., Miao, Z., Zhao, Y., Xu, B., Gu, J., & Yuan, P. (2024). Gemological and Chemical Characterization of Gem-Quality Titanite from Morocco. Crystals, 14(1), 80. https://doi.org/10.3390/cryst14010080