Article

Research on the Melt Pool Shape Formation Mechanism of the Laser Surface Remelting of Nickel-Based Single-Crystal Superalloy

1
School of Physical Science and Technology, Northwestern Polytechnical University, Xi’an 710072, China
2
Guiyang AECC Power Investment Casting Co., Ltd., Guiyang 550014, China
3
Capital Aerospace Machinery Co., Ltd., Beijing 100076, China
*
Author to whom correspondence should be addressed.
These authors contributed equally to this work.
Crystals 2023, 13(8), 1162; https://doi.org/10.3390/cryst13081162
Submission received: 8 June 2023 / Revised: 1 July 2023 / Accepted: 19 July 2023 / Published: 26 July 2023
(This article belongs to the Special Issue Ni (Co)-Based Superalloys)

Abstract

:
By numerical simulation and experimental analysis, the melt pool shapes for the laser surface remelting of nickel-based single-crystal superalloy under different processing parameters are investigated. The results show that heat conduction and heat convection work together to determine the formation of the melt pool during the laser surface remelting, and the melt pool shape can be controlled by adjusting the laser power and laser scanning speed. For processing with large laser power and low scanning speed, the alloy vaporizes in the melt pool, which makes the melt pool shape unstable. For laser surface remelting with smaller laser power or higher scanning speed, one can have a stable “ω” shape melt pool, which is because the Peclet number is large, and the heat convection plays the dominant role. For the condition with further smaller laser power or higher scanning speed, the Peclet number in the melt pool is much lower, and the heat convection is the weakest, which produces the semi-elliptical melt pool shape that has no essential difference from that of the pure heat conduction model. The present study offers theoretical support to our previous research and the future parameters selection of processing parameters for the laser repairing of nickel-based single-crystal superalloys.

1. Introduction

Nickel-based single-crystal (SX) superalloy has been used in the aeronautic industry due to its superior mechanical properties [1]. However, there will be casting defects (e.g., surface secondary grains) that appear during the production of the SX components. To fix these defects, the laser surface remelting (LSR) process has been proven a suitable repair technique [2,3]. This desirable repairing aims to make the defect fixed, and the SX structure maintained [4]. It is found that the dendrite structure and stray grain formation in the laser-remelted SX superalloy are affected by the melt pool shape [5]. The melt pool shape can be controlled by adjusting the processing parameters [6]. Therefore, it is of great significance to figure out the processing parameter effects on the melt pool shape and the underlying mechanism for engineering application.
To depict the melt pool shape of the LSR process, Lei et al. [7] built a one-domain numerical model to figure out the heat transfer in laser remelted 304 stainless steel. Liu et al. [3,5] applied a set of 3D melt pool shape equations to investigate the microstructure distribution in laser-remelted SX alloy. Vitek [8] used the 3D Rosenthal model to simulate the melt pool shape, by which the processing parameter effect on the stray grain formation mechanism was analyzed. A steady-state 3D heat/fluid flow model was applied to simulate the solidification conditions at the solidification front with varied processing parameters for the laser welding of SX alloys [9,10]. Wang et al. [11] analyzed the microstructure in the laser-remelted nickel-based SX superalloy by using a steady-state melt pool shape model without considering the melt pool effect.
The above models are built based on the high simplification of the LSR process. In fact, during the laser remelting processing, the factors, including Marangoni convection, vaporization pressure, buoyancy, etc., work together to affect the fluid flow in the remelt region and finally determine the shape of the melt pool [12,13,14]. Koo et al. [15] found that for conditions with high laser power, the recoil pressure and Marangoni convection are always the first two factors that determine the melt pool shape. When the laser power is large enough, the alloy melts and then vaporizes, and the recoil pressure makes the laser penetrate deeper into the substrate to form the keyhole melt pool, which plays the dominant role in determining the melt pool shape [16,17,18,19]. Lu et al. [20] investigated the melt pool formation mechanism with consideration of the Peclet number and Marangoni number model under varied processing parameters, and their results show that the Marangoni convection plays an important role in determining the melt pool shape. But, the vaporization effect was ignored, and the fluid flow mechanism research is more of a quantitative analysis in their work. By applying the Peclet number model, Chen et al. [21] numerically analyzed the effect of the magnetic field on the heat transfer mechanism in the laser-remelted alloy. Asghar et al. [6] analyzed the effect of the processing parameters on the melt pool shape; however, their results do not provide a deep explanation of the underlying mechanism of the variation in melt pool shapes for the different processing parameters. Many works have been conducted to analyze the melt pool formation mechanism for the deep-penetration laser welding process. However, the works on the LSR process focus mostly on the microstructure distribution in the melt pool. The variation in the melt pool shape and heat transfer characteristic with the changing of the processing parameters are not depicted enough for the LSR process.
The present paper aims to figure out the melt pool shape transformation mechanism with the changing of the processing parameters for the LSR process. A 3D multiphase transient model is combined with the experimental analysis. Major physical factors, including recoil pressure, surface tension, Marangoni convection, etc., are included in the model. The experimental analysis is offered for comparison to show the effect of the processing parameter on the melt pool shape. The Peclet number model was applied to explain the fundamental mechanism for the variation in the melt pool shape.

2. Materials and Methods

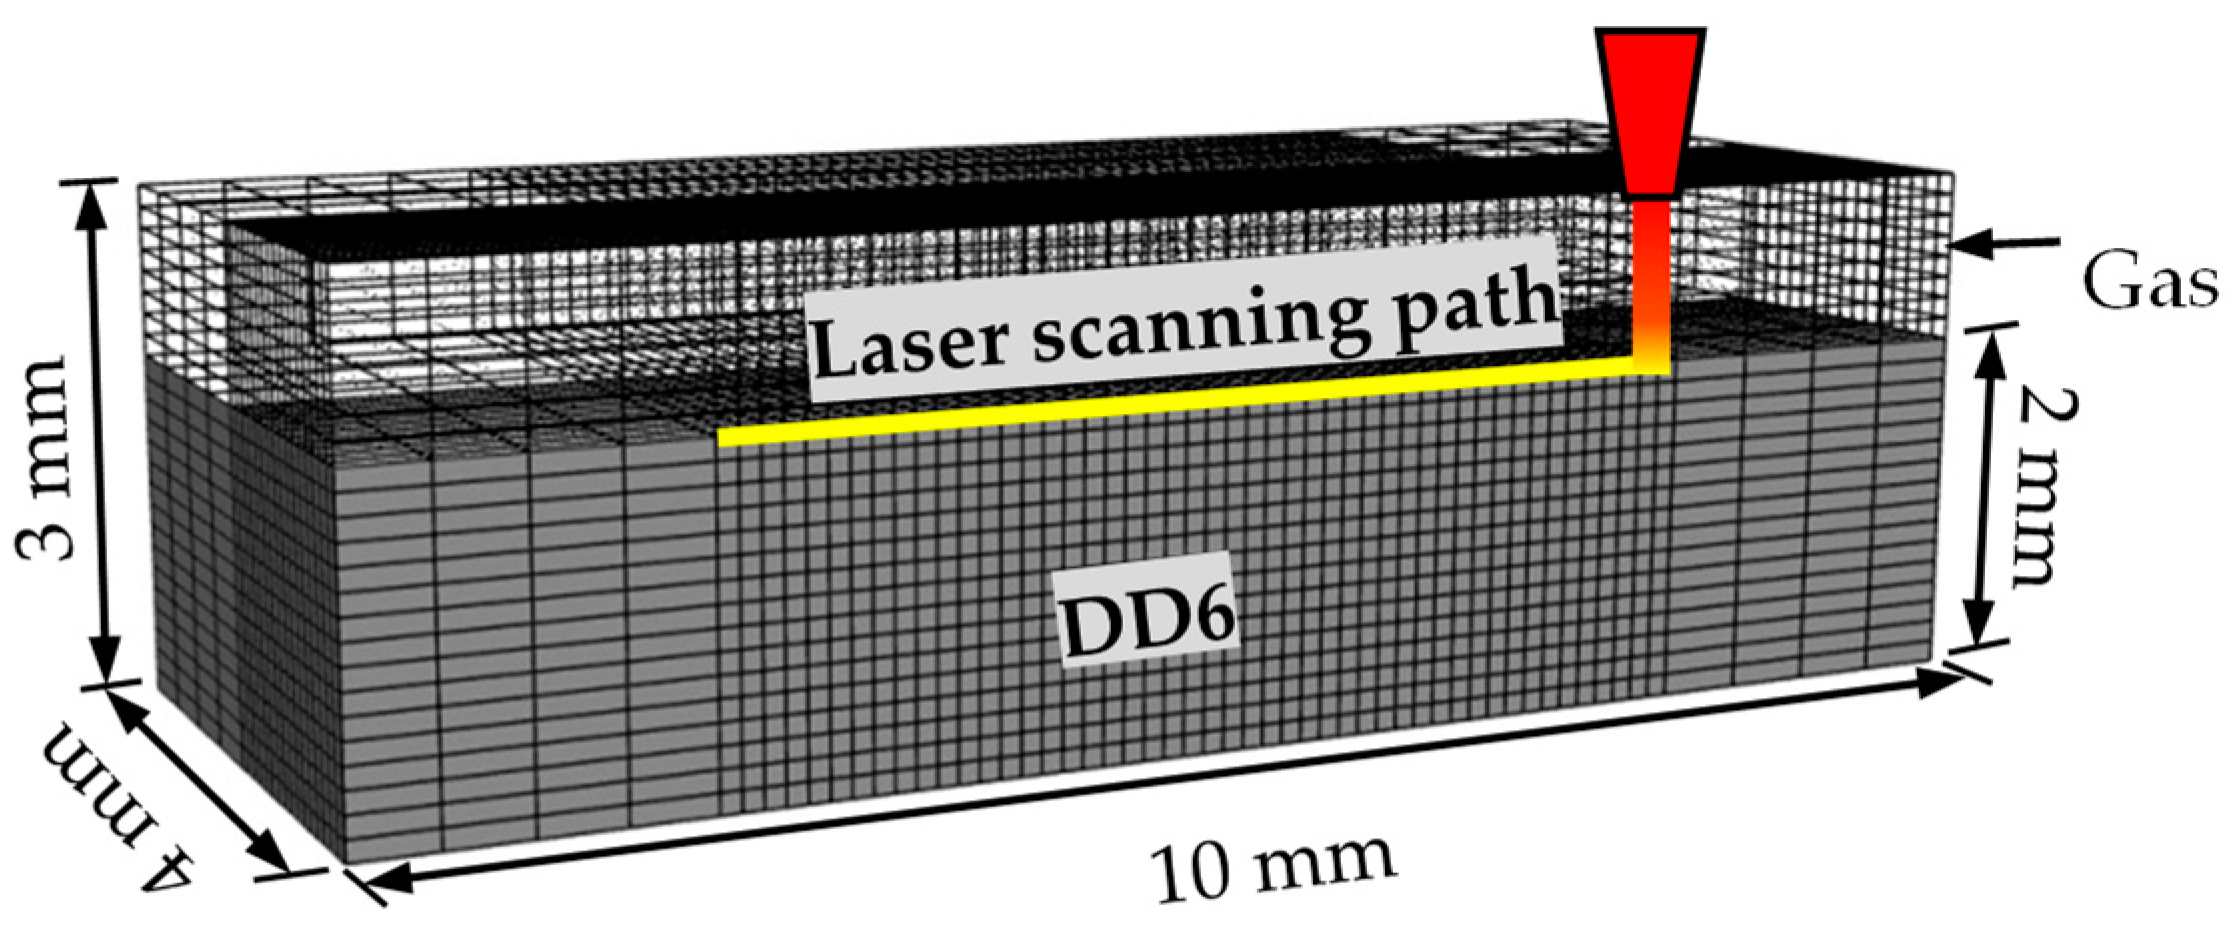
2.1. Numerical Modeling

The Schematic diagram of the LSR process is shown in Figure 1. There are not only the melting/solidifying processes but also the Marangoni convection and vaporization during the remelting. Therefore, it is essential to make some approximate for the simulation model of the LSR process. The molten metal in the melt pool is assumed to be incompressible Newtonian fluid; the fluid flow is assumed to be laminar; the parameters of the material are temperature-dependent and isotropic homogeneous; the laser beam energy is in the form of the volumetric heat source; and the temperature field, fluid velocity, and melt pool shape are assumed to be symmetrical about the longitude section of the melt pool. In addition, there are solid, liquid, and gas phases during the LSR process; therefore, in addition to simulating the heat transfer and fluid velocity, the liquid/gas interface should also be tracked. Based on these, the model is built as follows:
Figure 1. Schematic diagram of the LSR process.
Crystals 13 01162 g001

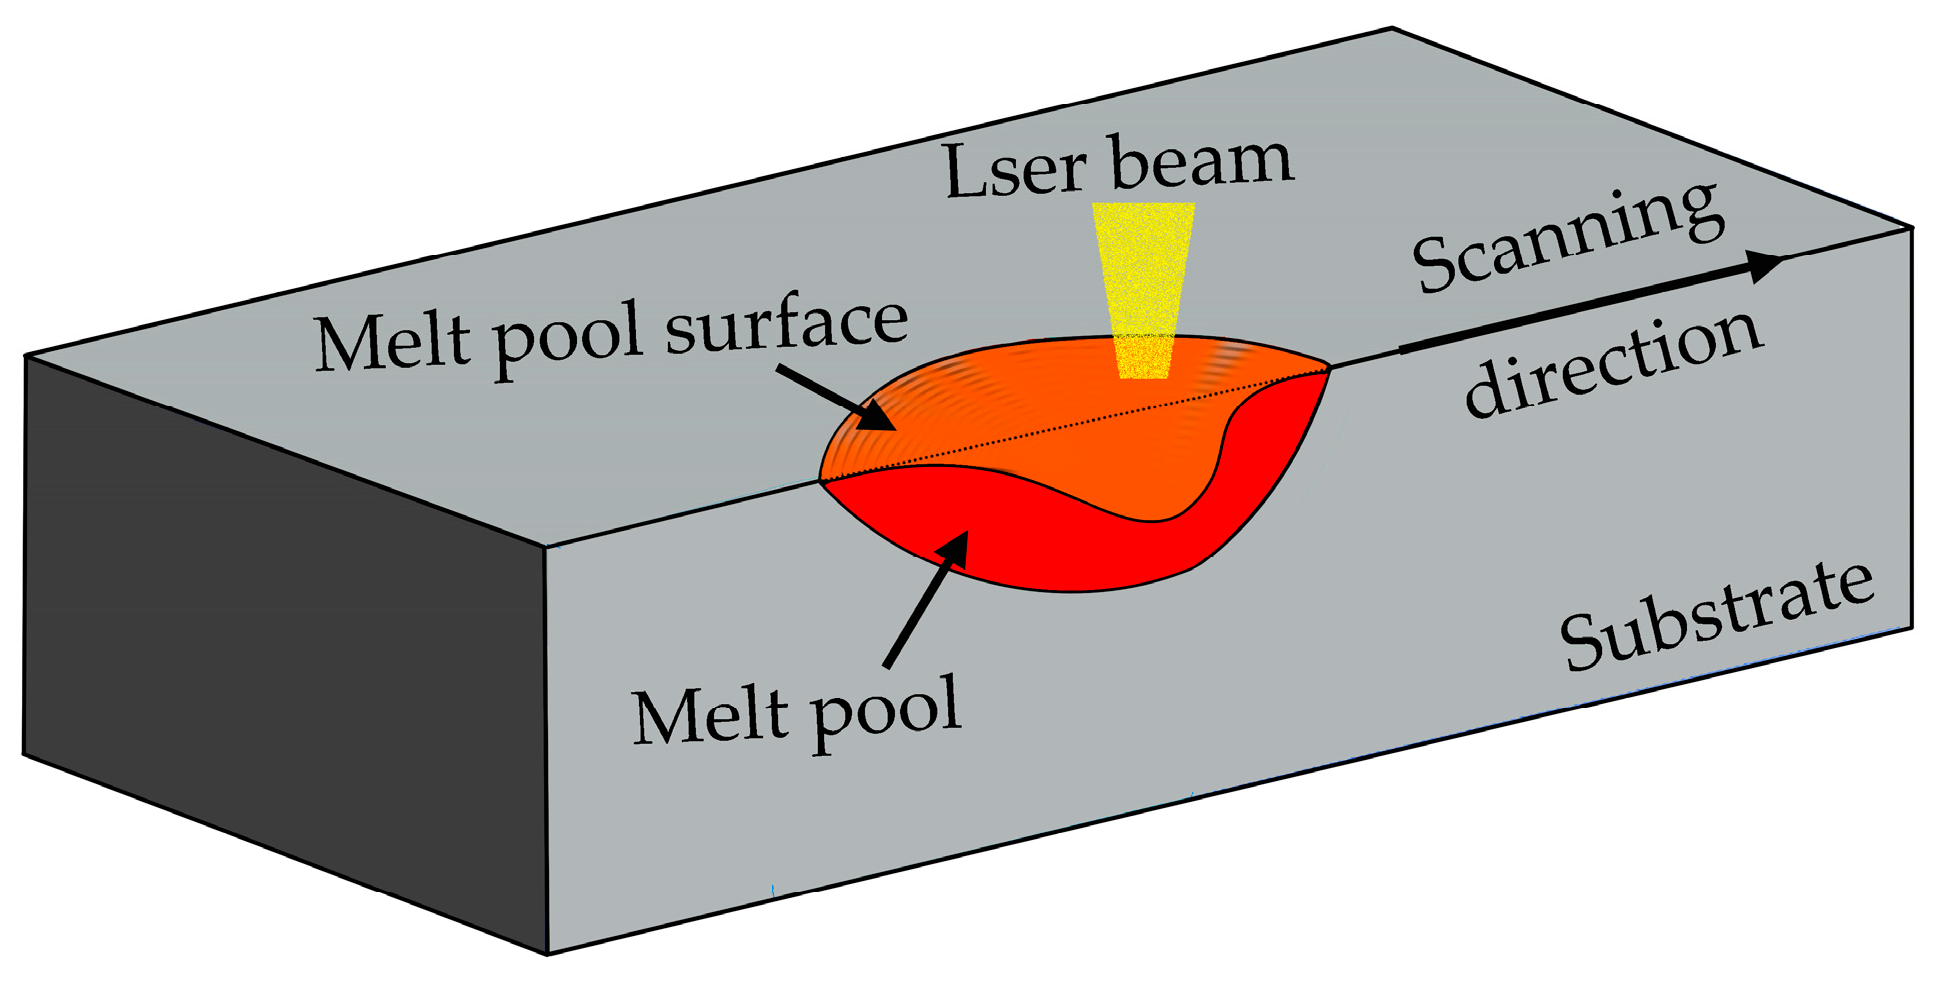
2.1.1. Governing Equations

The three-dimensional transient simulation is carried out for the LSR process, where the mass conservation, momentum conservation, and energy conservation are satisfied. Correspondingly, the continuity equation, momentum equation (Navier–Stokes equation), energy equation, and the volume of fluid (VOF) equation are used as governing equations for the analysis [11,17,22,23]:
Continuity equation:
ρ x + · ρ U = 0
Momentum equation:
ρ U t + · ρ U U = P + · μ U μ K U ρ β g T T 0
Energy equation:
ρ h x + · ρ U h = · k T + S h
where ρ is the density, U the velocity vector, P the pressure, T the temperature, T0 the reference temperature, μ the viscosity, K the Carman–Kozeny coefficient, β the liquid coefficient of thermal expansion, g the gravitational vector, k the heat conductivity, and Sh the source term of the energy equation.
To track the liquid/gas interface, the volume of fluid model is applied with the volume fraction factor ϕ :
ϕ t + · U ϕ = 0
where ϕ = 1 for the liquid phase, ϕ = 0 for the air, and 0 ϕ 1 at the liquid/gas interface.

2.1.2. Boundary Conditions

The thermal boundary condition is [24]:
k T n = q l ε σ T 4 T 0 4 h c T T 0
where n is the vector normal to the surface, ε the radiation coefficient, σ the Stefan–Boltzmann coefficient, h c the convection coefficient, and q l the heat resource at the top surface of the substrate, which can be expressed as follows:
q l = 3 P π H ( 1 e 3 ) e x p 3 r 2 r 0 2 l n H z
where P is the laser power, H the heat resource height, and r 0 the laser radius. It should be noted that the first term on the right-hand side of Equation (5) is only used for the top surface boundary, where the free interface between the liquid metal and the gas is identified by the calculation of Equation (4). Only the third term can be used for the bottom boundary, and the convection coefficient should be changed to the contact coefficient.
Since the vaporization is considered in the present model, the evaporation pressure item P t and surface tension pressure item P r are introduced to calculate the liquid/gas boundary pressure [25]:
P t = 0.54 P 0 e x p H * T T b R T T b
P r = γ k + d γ d T T T 0 · n n
where γ k is the surface tension near the melting temperature, d γ / d T the surface tension coefficient, P 0 the ambient pressure, T b the boiling temperature, H * latent heat of evaporation, R the gas constant, and n the unit vector normal to the interface.

2.1.3. Numerical Implementations

DD6, a Chinese second-generation nickel-based SX superalloy with the nominal composition listed in Table 1, is taken as the research object in the present work. Figure 2 shows a schematic diagram of the meshing method. To save the simulation cost, the model is built with a symmetrical boundary, and the laser moves along the symmetrical line at the top of the substrate. The simulation domain is cubic in the size of 10 × 4 × 3 mm3, where the substrate is in the thickness of 2 mm, and the upper region is the air. The simulation domain is discretized as the hexahedral cells, and the region close to the laser scanning path is discretized with a smaller size, where the smallest size is 0.1 mm.
To ensure the calculation accuracy, the main thermophysical parameters for the DD6 SX superalloy used in the calculation are obtained by the software JmatPro 7.0, and the values of the parameters are shown in Figure 3. All the parameters are imported into the Fluent 2023 R1 software with the piecewise linear approximation. After building the model and importing the parameters, the SIMPLE calculation method is applied for calculation.
To execute the above modeling, the numerical calculation is conducted by the Fluent software. The heat resource, buoyancy, and surface tension term are achieved by the user-defined functions (UDF) programmed in C language. The numerical model is solved by the finite volume method (FVM).

2.2. Experimental

The substrate material used in the experiment is the second-generation DD6 nickel-based SX superalloy with composition presented in Table 1. The specimens with a thickness of 2 mm are cut from the casted DD6 superalloy ingot with a diameter of 15 mm, which has been processed with heat treatment before the remelting to obtain a smooth melt pool boundary for the following analysis. The surfaces of the substrates are polished with 2000 grit SiC paper and then cleaned with alcohol to ensure that the surfaces are smooth for the LSR experiment.
For the LSR process, the 3D motion processing platform is used, which has the NCLT CW 1000 continuous-wave Nd: YAG laser with the maximal output power of 1000 W. The wavelength of the laser is 1.06 μm, and the beam radius is 0.75 mm. The substrate is located at the specimen platform, and the distance between the laser nozzle tip and substrate surface is set to be about 3 mm. After setting the laser scanning velocity and the laser power, two sets of experiments are performed with the laser power of 200 W and 350 W at the fixed scanning speed of 2.5 mm/s for comparison. To protect the specimens from oxidation during the LSR process, the specimens are located in a box that is filled with Ar2 gas throughout the process.
After the remelting process, the samples are cut along the direction perpendicular to the laser scanning direction to obtain the transverse section of the melt pool. Then, the transverse section is polished with the SiC papers from 600 grit to 2000 grit and the polishing cloth. The polished transverse sections are cleaned and then etched with the solution of diluent royal water (5 mL H2O, 10 mL HCL, and HNO3) for 20 s and then cleaned with water. Finally, the melt pool shapes of the samples are obtained by using the ZEISS Axio Scope A1 optical microscopy.

3. Results

In this part, the processing conditions for the laser power of 200 W, 350 W, and 500 W at a fixed scanning speed of 2.5 mm/s, and those at the scanning speed of 2.5 mm/s, 5.0 mm/s, and 7.5 mm/s with a constant laser power of 500 W, are calculated first. Then, the conditions with the laser power of 200 W and 350 W at the scanning speed of 2.5 mm/s laser with and without considering the Marangoni convection are computed to show the Marangoni effect. Finally, the experiments with the laser power of 200 W and 350 W at a fixed scanning speed of 2.5 mm/s are performed for comparison.

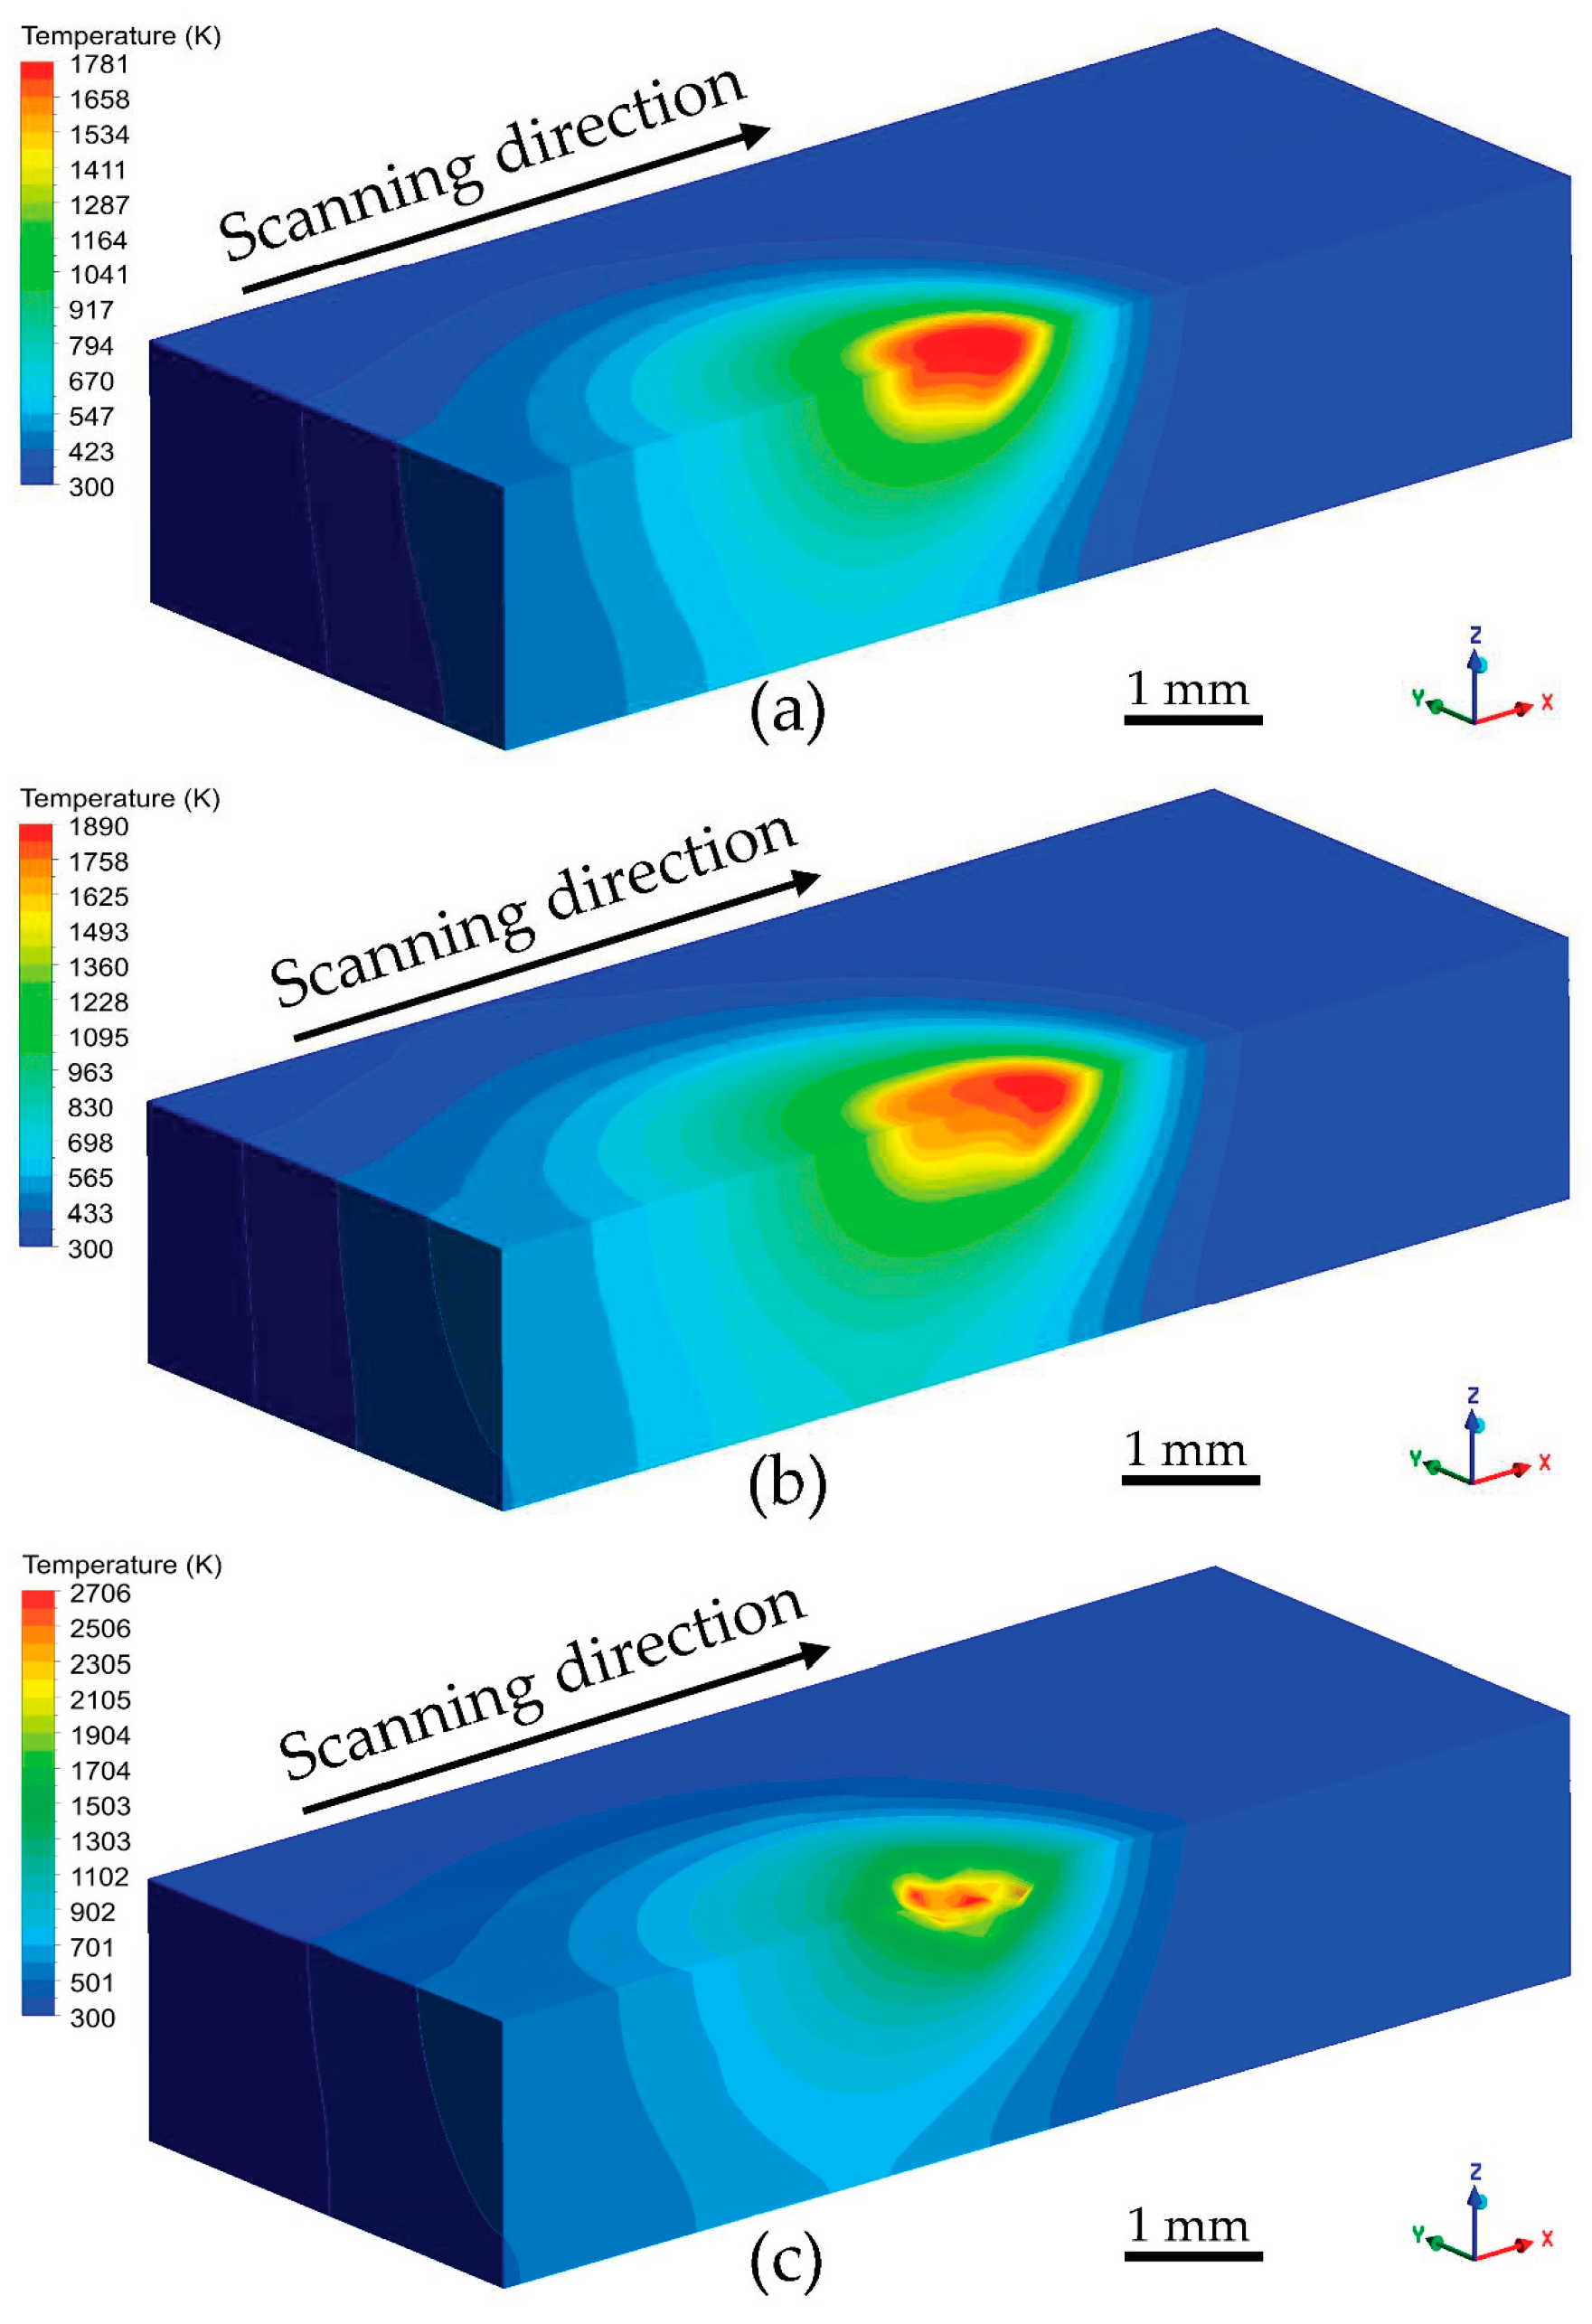
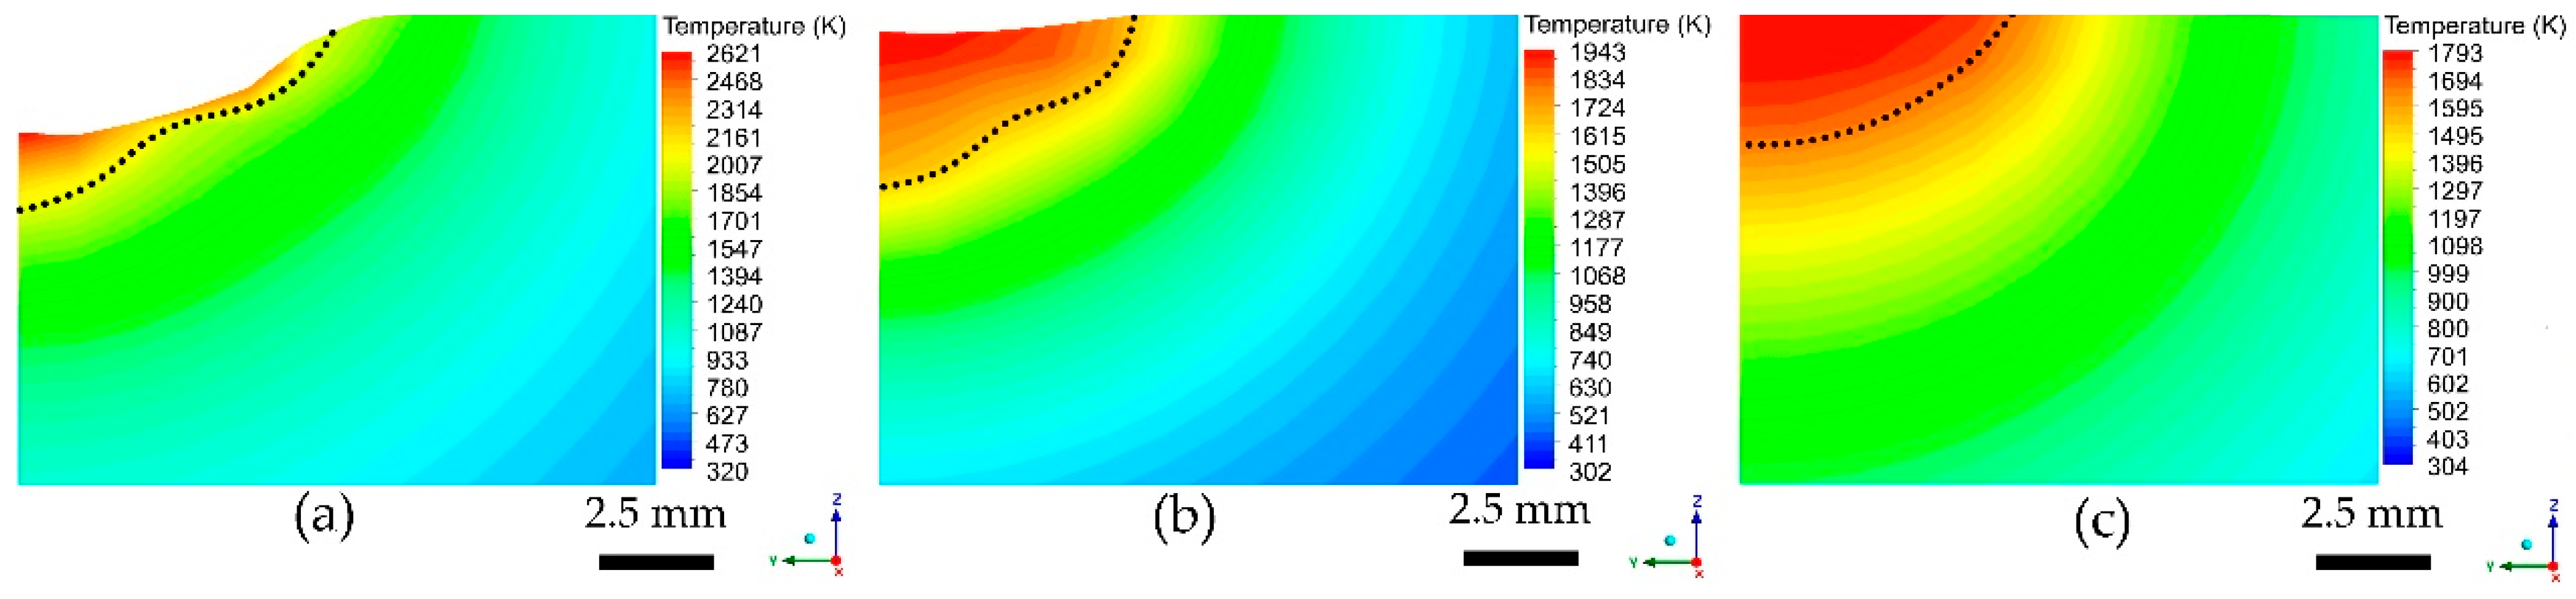
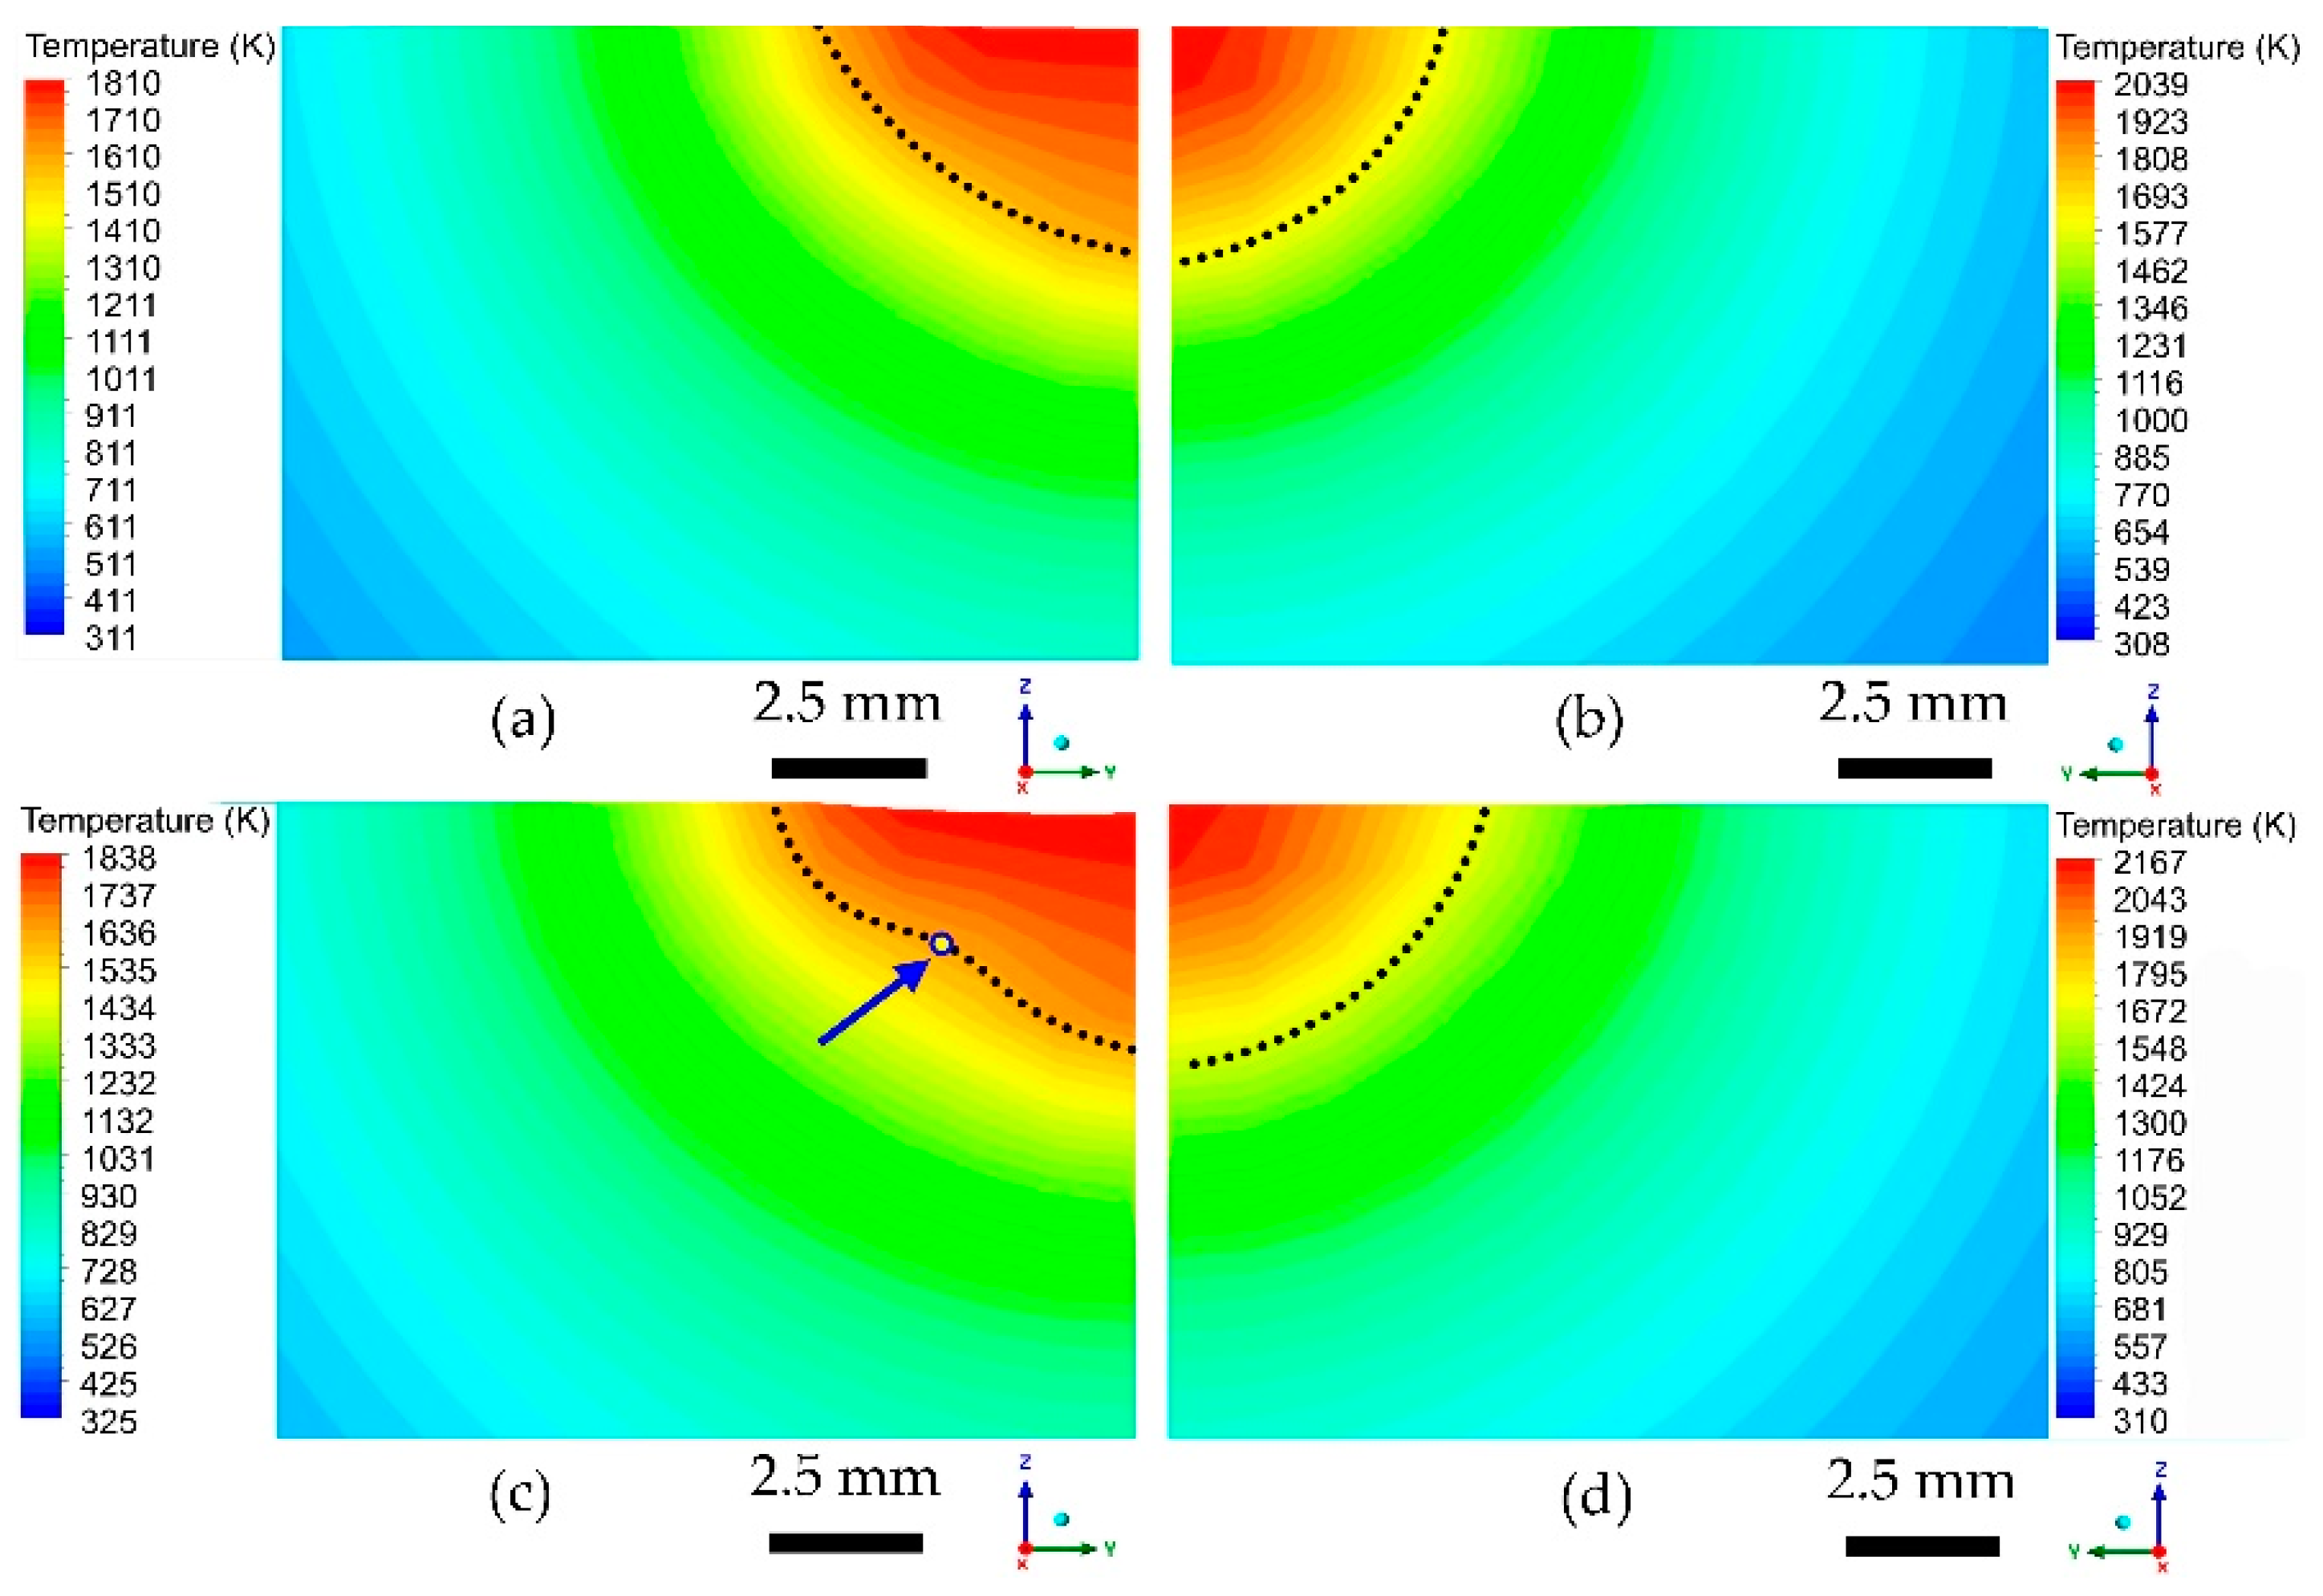
3.1. Temperature Distributions

Figure 4 shows the variation in the temperature distributions for the laser power of 200 W, 350 W, and 500 W at the fixed scanning speed of 2.5 mm/s. One can see that the maximal temperature in the melt pool increases with the laser power. Due to the moving of the laser beam, the “dragging” temperature distribution appears in the substrate, and the “dragging” extent is weak for 200 W. When the laser power is 500 W, the alloy is vaporized at a pit that appears at the surface of the melt pool, and the instability of the vapor makes the melt pool shape unstable.

3.2. Processing Parameters Effect

Figure 5 shows the transient melt pool shape for the laser power of 200 W, 350 W, and 500 W at the same laser scanning speed of 2.5 mm/s, in which the melt pool boundary is determined by the liquidus temperature of the alloy [8], and the location at the deepest point in the longitudinal section of the melt pool is selected to obtain the melt pool shape in the cross-section marked by the black dotted line. With the increase of the laser power, maximal temperature in the melt pool increases with the laser power, and three kinds of melt pool shapes are produced. As shown in Figure 5a, when the laser power is 200 W, the melt pool shape is semi-elliptical. Figure 5b shows that when the laser power is 500 W, a “ω” melt pool shape is produced, and an obvious and stable inflection point appears at the melt pool boundary. Compared with the semi-elliptical melt pool, the “ω” melt pool boundary is no longer smooth semi-elliptical curve due to the fluctuation, the location with the maximal curvature at the boundary is called inflection point, just like the point marked by the blue arrow in Figure 5b. For the laser power of 500 W, Figure 5c, the top surface of the melt pool sinks, and the melt pool boundary is not regular, which is different from the other two conditions.
Figure 6 shows the melt pool shape at the scanning speed of 2.5 mm/s, 5 mm/s, and 7.5 mm/s with a fixed power of 500 W, where the melt pool boundaries are marked by black dotted lines. One can see that with the increase of the scanning speed, the maximal temperature decreases, and the melt pool shape varies with the processing parameters. As shown in Figure 6a, the melt pool shape is irregular at a velocity of 2.5 mm/s. When the scanning speed increases to 5.0 mm/s (Figure 6b), the melt pool boundary is in the shape of “ω,” and the obvious and stable inflection point is presented, which is similar to that shown in Figure 5b. At the scanning speed of 7.5 mm/s (Figure 6c), the semi-elliptical melt pool is presented, which is similar to that of the condition with the laser power of 200 W and scanning speed of 2.5 mm/s (Figure 5a), except that the melt pool is smaller. Combining Figure 5 and Figure 6, one can see that the melt pool shape can be controlled by adjusting the processing parameters.

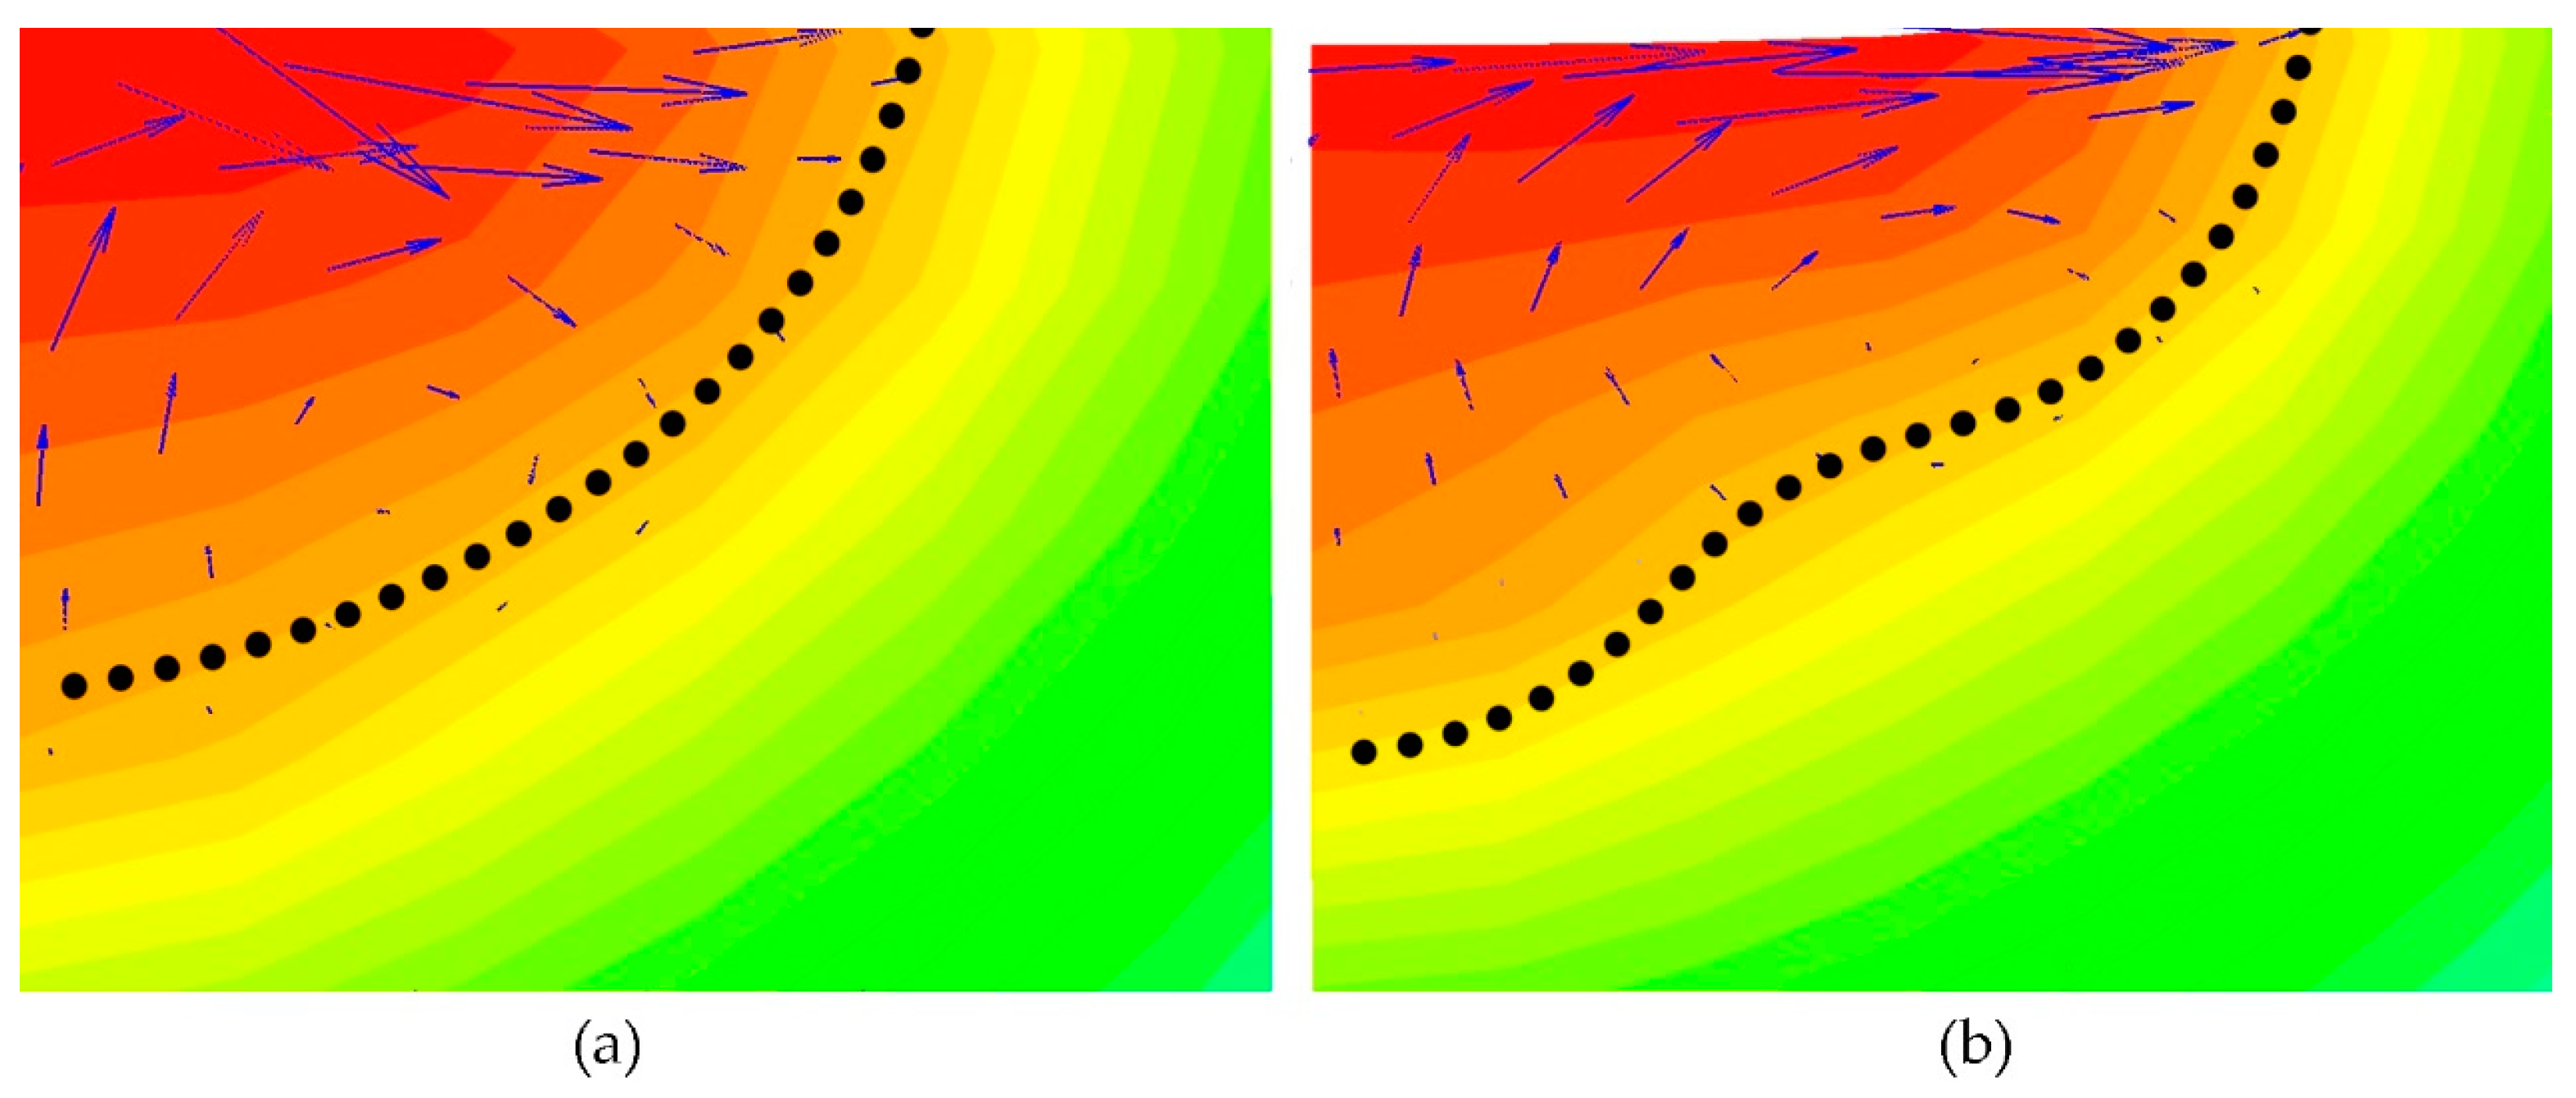
3.3. The Effect of Fluid Flow

The computations with and without the Marangoni convection for the laser power of 200 W and 350 W at the fixed laser power of 2.5 mm/s are conducted to analyze the melt pool shape formation mechanism, and the results are given in Figure 7. One can see that for the laser power of 200 W with consideration of the Marangoni convection (Figure 7a), the melt pool is in a shape of a semi-ellipse, and the half-width/depth ratio equals 1.7. When the Marangoni convection is ignored, the melt pool shape is similar (Figure 7b), except that the half-width/depth ratio decreases to 1.2. For the laser power of 350 W, when the Marangoni convection is considered, the melt pool is in the shape of “ω” (Figure 7c); however, when the Marangoni convection is not considered, the melt pool shape translates to semi-ellipse (Figure 7d).

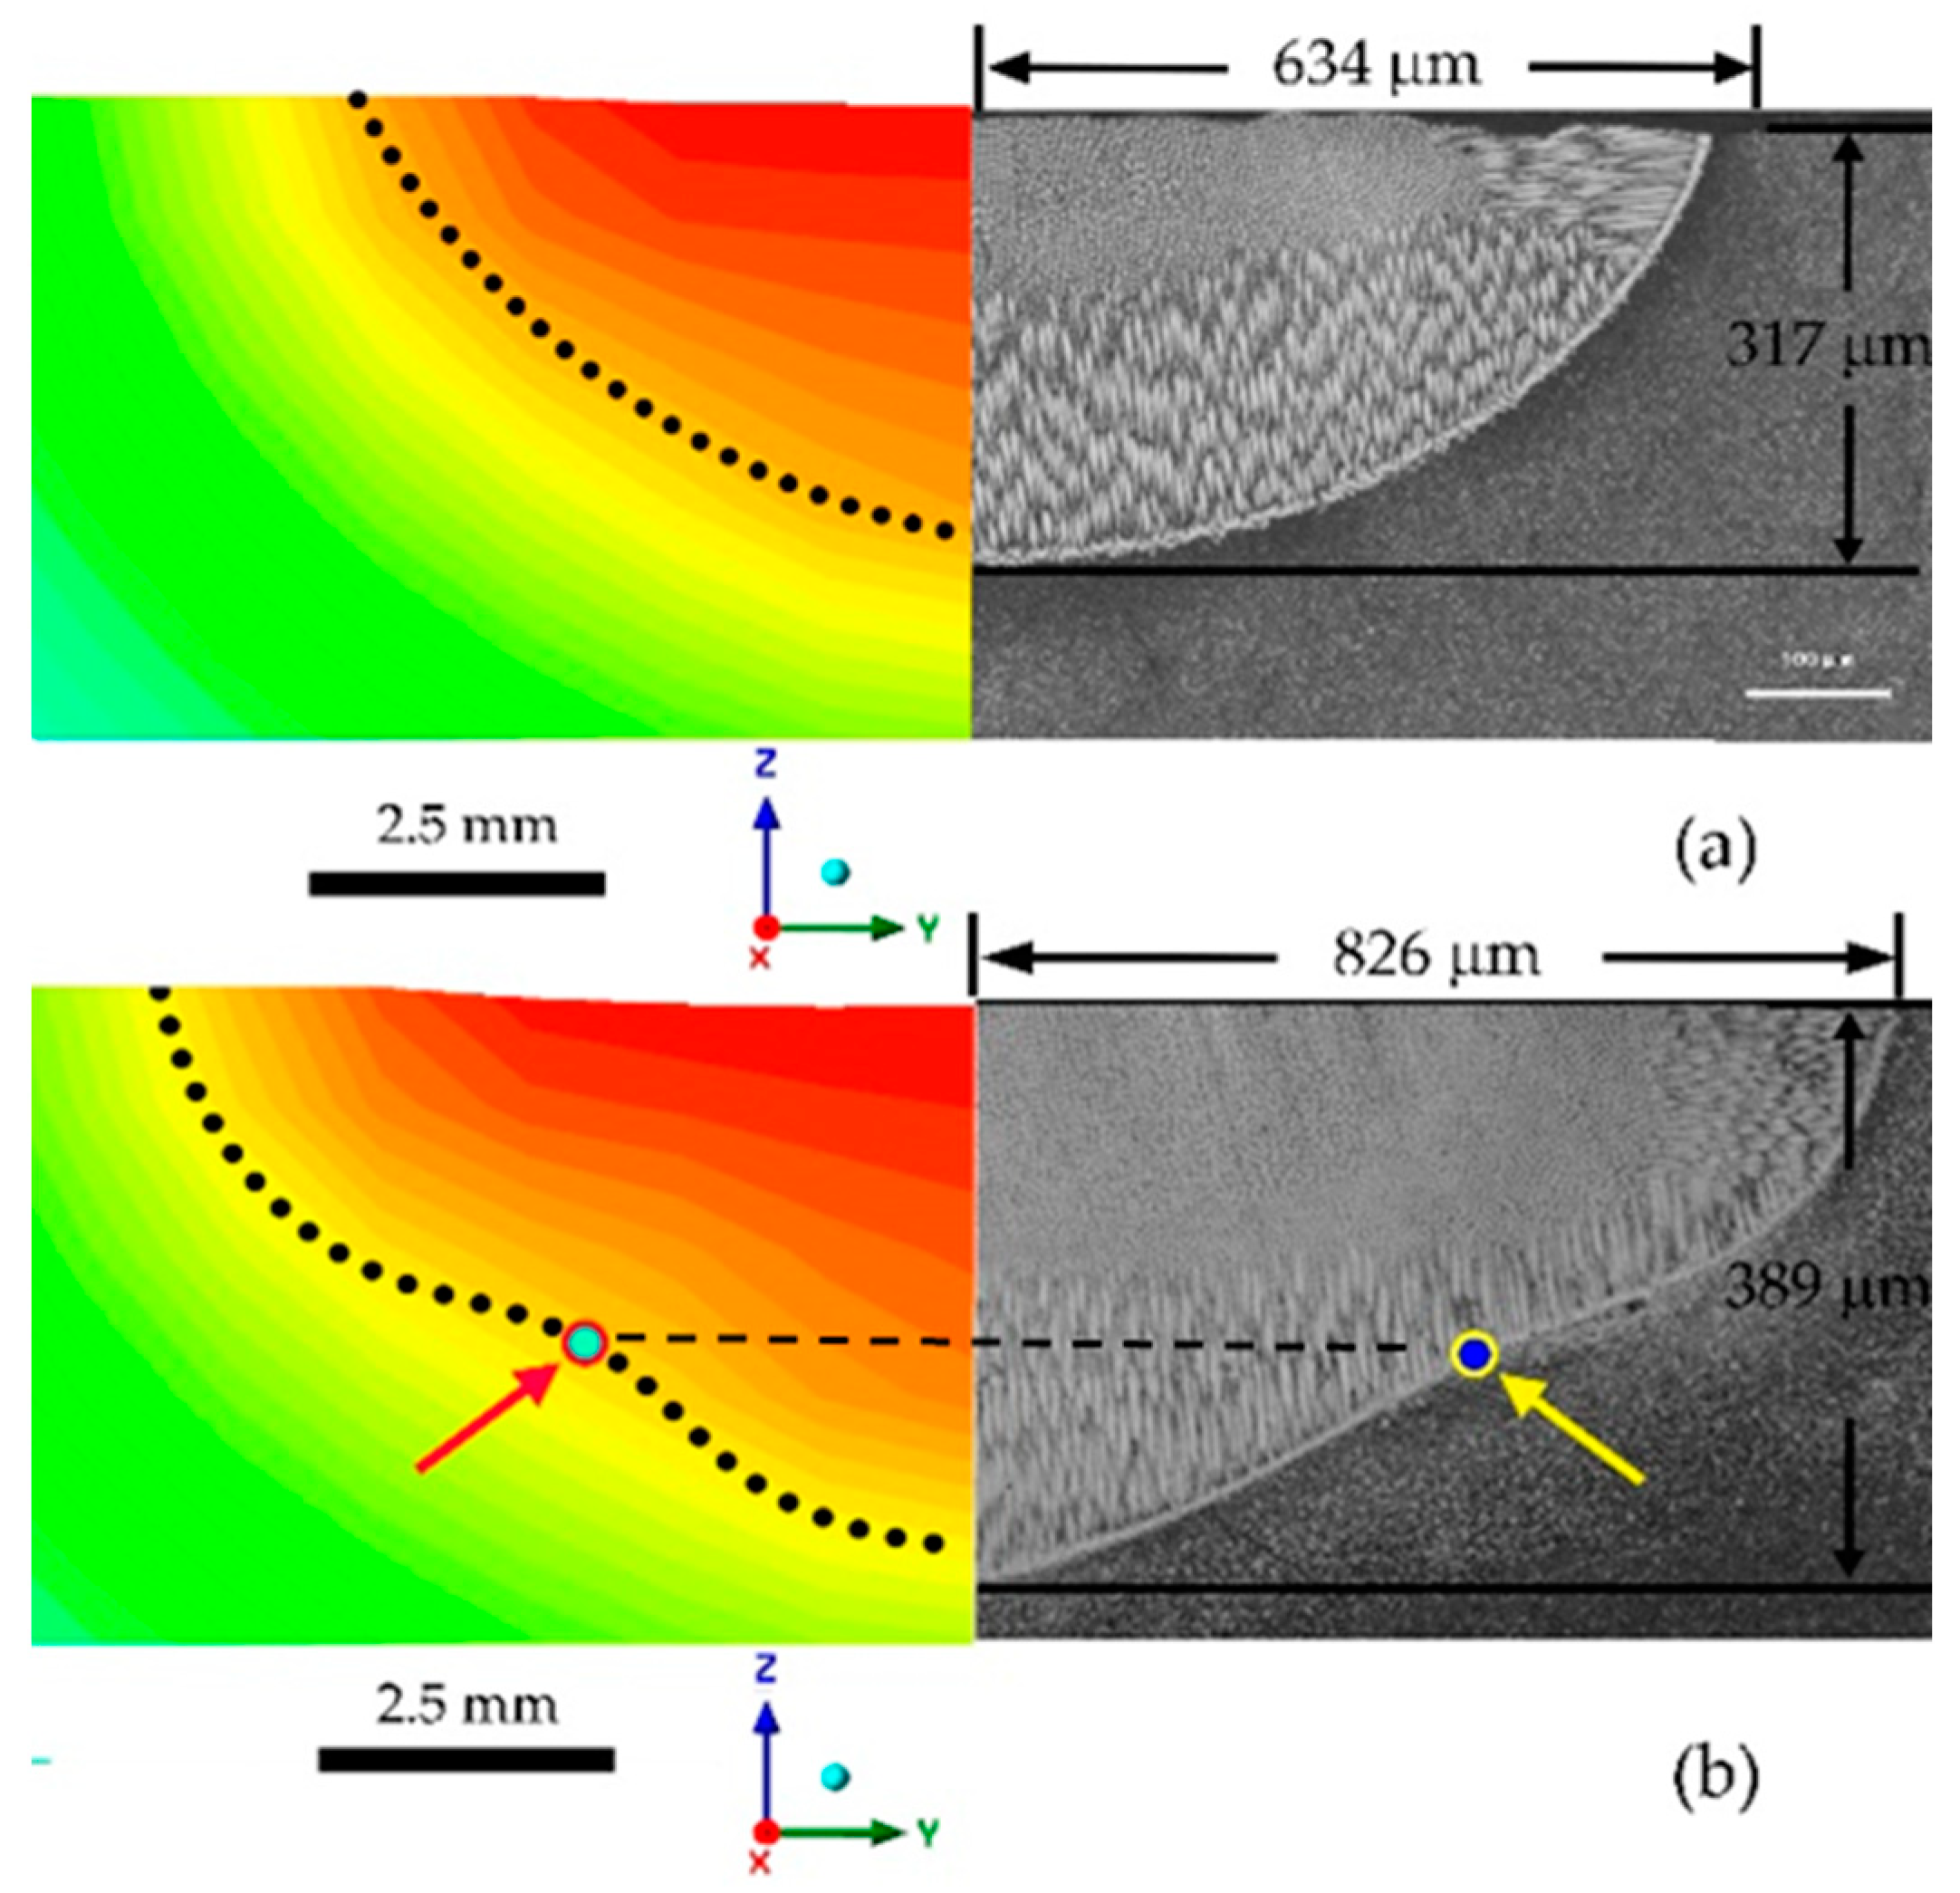
3.4. Experimental Results

As shown in Figure 8, the experimental melt pool shapes for the laser power of 200 W and 350 W at the fixed scanning speed of 2.5 mm/s are presented to be compared with the simulated results. It shows that when laser power is 200 W, the experimental melt pool is in the shape of a semi-ellipse. When the laser power is 350 W, the experimental melt pool is a “ω” shape with an inflection point. The experimental melt pool shape is in good agreement with the simulated ones except for the ignorable size differences. One can see that when the laser power is 350 W, the obvious inflection point can be seen at the experimental “ω” shape melt pool boundary in Figure 8b, where the point is marked by the yellow arrow. The result is the same as that of the calculated one in Figure 8a. The formation of the “ω” shape melt pool and inflection point is caused by the fluid flow, and the mechanism will be discussed in the following section.

4. Discussion

According to the above results, one can see that when the Marangoni convection is considered, the melt pool shape varies from semi-elliptical to “ω” shape with the variation in the processing parameters, and it is always the semi-elliptical shape when the convection is ignored. This indicates that the melt pool shape is determined by the interaction between the Marangoni convection-induced thermal convection and thermal conduction, and the interaction varies when the processing parameters are changed. The relative intensity of thermal convection and thermal conduction can be evaluated by the value of the Peclet number. When the Peclet number is larger than 1, the thermal convection dominates heat transfer in the melt pool, and the larger the Peclet number, the stronger the thermal convection. The Peclet number is defined as [21,26]:
P e = R e · P r = V · L α
where Re is the Reynold number, Pr the Prandtl number, V the characteristic velocity which is selected as the maximal velocity in the cross-section of the melt pool here, α the thermal diffusion coefficient, and L the characteristic length. Here, we take α = 4.56 × 10⁻⁶ m2/s [27] for the DD6 nickel-based SX superalloy. The characteristic length L can be calculated by:
L = W · H W + H
where W and H are the melt pool width and depth at the cross-section of the melt pool.
The values of W and H in Figure 7a,c for the laser power of 200 W and 350 W at the fixed scanning speed of 2.5 mm/s are measured. Then, by applying Equation (10), the characteristic lengths are calculated to be 0.29 × 10⁻³ m and 0.38 × 10⁻³ m, respectively. The characteristic velocities are 0.072 m/s and 0.122 m/s for the laser power of 200 W and 350 W, respectively. By using Equations (9) and (10), the Peclet numbers are calculated to be 4.6 for the laser power of 200 W and 10.1 for the laser power of 350 W; the higher the laser power, the larger the Peclet number.
Figure 9 shows the calculated fluid flow directions in the melt pool for the laser power of 200 W and 350 W. One can see that the flow is in the clockwise direction in the melt pool, since the surface tension coefficient is negative, as given in Figure 3a. The average velocity is higher for the laser power of 350 W, and the velocity decreases drastically when the fluid crush the melt pool edge [12]. Consequently, when the laser power is 350 W, the thermal convection is strong, and the heat transfers with fluid convection toward the top right side of the melt pool, which combines with the heat conduction to produce the “ω” shape melt pool that has a stable inflection point. In comparison, when the laser power is 200 W, the Peclet number is much smaller, which indicates that the thermal convection is weak, and the heat transferred by convection is less. Therefore, the melt pool is in the shape of a semi-ellipse. The heat convection, in this case, also makes the half-width/depth ratio larger than that of the pure heat conduction model.
In addition, considering that the substrate material is the SX superalloy, the microstructure in the melt pool is affected by the melt pool shape. When the melt pool is “ω” shape, the microstructure inside the melt pool is more complicated than that in the semi-elliptical melt pool, which makes it more complicated to control the microstructure by rotating the substrate crystal orientation as presented in Rappaz’s results [28]. Therefore, the processing parameters that can produce a “ω” melt pool are not suitable for our previous research. On the other hand, our previous works simulated the melt pool with the steady-state heat transfer model, which ignored the fluid flow effect [29,30]. These simulations are performed with the processing parameters close to that of Figure 8a (200 W and 2.5 mm/s) in the present work, under which the convection heat transfer is weak, and the melt pool shapes with and without the Marangoni convection does not show a significant difference. Therefore, it is acceptable for our previous works to ignore the Marangoni convection for simplification under suitable processing parameters.
It should be noted that the present research aims to figure out the variation in the melt pool shape with the variation in the processing parameters for the LSR process; the laser power is relatively smaller compared to the deep-penetration welding. This work offers a basic processing map to control the melt pool shape for the LSR process.

5. Conclusions

The formation mechanism of melt pool shape during the LSR process for different processing parameters is analyzed by numerical simulation and experimental investigation. The specific conclusions can be summarized as follows:
  • The melt pool shapes are different for varied processing parameters during the LSR process. When the laser power is 500 W at the scanning speed of 2.5 mm/s, the melt pool shape is irregular and unstable due to the evaporation of the alloy. When the power is 350 W, the dominant Marangoni convection produces a “ω” shape melt pool. When the laser power is 200 W, the Marangoni convection and evaporation effect are relatively weak, and a semi-elliptical melt pool is made. The conditions for the laser power of 500 W with scanning speeds of 2.5 mm/s, 5.0 mm/s, and 7.5 mm/s also show the same variation trend of the melt pool shape;
  • For a fixed laser scanning speed of 2.5 mm/s, when the laser power is 350 W, the Peclet number is large, which means the thermal convection is strong; therefore, a “ω” shape is produced. When the laser power is 200 W, the Peclet number is smaller, indicating weaker thermal convection, which produces a semi-elliptical melt pool;
  • The good agreement between the experimental and simulated results demonstrates the reliability of the numerical model.

Author Contributions

Conceptualization, R.Y. and N.W.; methodology, R.Y., and N.W.; software, W.C.; validation, R.Y., and L.T.; formal analysis, Q.Z., and J.M.; investigation, X.L., and W.Y.; resources, N.W.; data curation, R.Y., and W.C.; writing—original draft preparation, R.Y.; writing—review and editing, R.Y. and N.W.; visualization, W.C.; supervision, N.W.; project administration, N.W.; funding acquisition, N.W. All authors have read and agreed to the published version of the manuscript.

Funding

This work was supported by the National Natural Science Foundation of China (Grant No. 52071264).

Data Availability Statement

The data presented in this study are available on request from the corresponding author.

Conflicts of Interest

The authors declare no conflict of interest.

References

  1. Xia, W.; Zhao, X.; Yue, L.; Zhang, Z. A review of composition evolution in Ni-based single crystal superalloys. J. Mater. Sci. Technol. 2020, 44, 76–95. [Google Scholar]
  2. Yang, S.; Huang, W.D.; Liu, W.J.; Zhong, M.L.; Zhou, Y.H. Development of microstructures in laser surface remelting of DD2 single crystal. Acta Mater. 2002, 50, 315–325. [Google Scholar]
  3. Liu, W.P.; DuPont, J.N. Effects of substrate crystallographic orientations on crystal growth and microstructure development in laser surface-melted superalloy single crystals. Mathematical modeling of single-crystal growth in a melt pool (Part II). Acta Mater. 2005, 53, 1545–1558. [Google Scholar]
  4. Wang, L.; Wang, N. Effect of substrate orientation on the formation of equiaxed stray grains in laser surface remelted single crystal superalloys: Experimental investigation. Acta Mater. 2016, 104, 250–258. [Google Scholar]
  5. Liu, W.P.; DuPont, J.N. Effects of melt-pool geometry on crystal growth and microstructure development in laser surface-melted superalloy single crystals. Mathematical modeling of single-crystal growth in a melt pool (part I). Acta Mater. 2004, 52, 4833–4847. [Google Scholar]
  6. Hozoorbakhsh, A.; Ismail, M.I.S.; Aziz, N.B.A. A computational analysis of heat transfer and fluid flow in high-speed scanning of laser micro-welding. Int. Commun. Heat Mass 2015, 68, 178–187. [Google Scholar]
  7. Lei, Y.P.; Murakawa, H.; Shi, Y.W.; Li, X.Y. Numerical analysis of the competitive influence of Marangoni flow and evaporation on heat surface temperature and molten pool shape in laser surface remelting. Comp. Mater. Sci. 2001, 21, 276–290. [Google Scholar]
  8. Vitek, J.M. The effect of welding conditions on stray grain formation in single crystal welds—Theoretical analysis. Acta Mater. 2005, 53, 53–67. [Google Scholar]
  9. Anderson, T.D.; DuPont, J.N.; DebRoy, T. Origin of stray grain formation in single-crystal superalloy weld pools from heat transfer and fluid flow modeling. Acta Mater. 2010, 58, 1441–1454. [Google Scholar]
  10. Anderson, T.D.; DuPont, J.N.; DebRoy, T. Stray Grain Formation in Welds of Single-Crystal Ni-Base Superalloy CMSX-4. Metall. Mater. Trans. A 2009, 41, 181–193. [Google Scholar]
  11. Pang, S.; Chen, X.; Zhou, J.; Shao, X.; Wang, C. 3D transient multiphase model for keyhole, vapor plume, and weld pool dynamics in laser welding including the ambient pressure effect. Opt. Lasers Eng. 2015, 74, 47–58. [Google Scholar] [CrossRef]
  12. Kidess, A.; Tong, M.; Duggan, G.; Browne, D.J.; Kenjereš, S.; Richardson, I.; Kleijn, C.R. An integrated model for the post-solidification shape and grain morphology of fusion welds. Int. J. Heat Mass Tran. 2015, 85, 667–678. [Google Scholar]
  13. Pan, J.; Hu, S.; Yang, L.; Wang, D. Investigation of molten pool behavior and weld bead formation in VP-GTAW by numerical modelling. Mater. Des. 2016, 111, 600–607. [Google Scholar]
  14. Halim, S.B.; Bannour, S.; Abderrazak, K.; Kriaa, W.; Autric, M. Numerical analysis of intermetallic compounds formed during laser welding of Aluminum-Magnesium dissimilar couple. Therm. Sci. Eng. Prog. 2021, 22, 100838. [Google Scholar]
  15. Koo, B.S.; Thasanaraphan, P.; Nied, H.F. Numerical simulation of the formation of hourglass welds during laser welding. J. Mater. Process. Technol. 2019, 263, 176–185. [Google Scholar]
  16. Muhammad, S.; Han, S.-W.; Na, S.-J.; Gumenyuk, A.; Rethmeier, M. Study on the role of recondensation flux in high power laser welding by computational fluid dynamics simulations. J. Laser Appl. 2018, 30, 012013. [Google Scholar]
  17. Ai, Y.; Jiang, P.; Wang, C.; Mi, G.; Geng, S. Experimental and numerical analysis of molten pool and keyhole profile during high-power deep-penetration laser welding. Int. J. Heat Mass Tran. 2018, 126, 779–789. [Google Scholar]
  18. Han, S.W.; Cho, W.I.; Na, S.J.; Kim, C.H. Influence of driving forces on weld pool dynamics in GTA and laser welding. Weld World 2013, 57, 257–264. [Google Scholar]
  19. Sohail, M.; Han, S.-W.; Na, S.-J.; Gumenyuk, A.; Rethmeier, M. Characteristics of weld pool behavior in laser welding with various power inputs. Weld World 2014, 58, 269–277. [Google Scholar]
  20. Lu, N.; Lei, Z.; Yu, X.; Bi, J.; Chen, Y. Effects of melt convection on stray grain formation in single crystal superalloys during directed energy deposition. Addit. Manuf. 2021, 48, 102429. [Google Scholar]
  21. Chen, J.; Chen, X.; Chang, Y.; Liu, X.; Wei, Y. Melt flow and thermal transfer of welding pool during static magnetic field supported deep-penetration laser beam welding of 5056 aluminum alloy. Trans. Chin. Weld. Inst. 2021, 42, 63–69. [Google Scholar]
  22. Geng, S.; Jiang, P.; Shao, X.; Guo, L.; Gao, X. Heat transfer and fluid flow and their effects on the solidification microstructure in full-penetration laser welding of aluminum sheet. J. Mater. Sci. Technol. 2020, 46, 50–63. [Google Scholar]
  23. Ai, Y.; Jiang, P.; Shao, X.; Li, P.; Wang, C.; Mi, G.; Geng, S.; Liu, Y.; Liu, W. The prediction of the whole weld in fiber laser keyhole welding based on numerical simulation. Appl. Therm. Eng. 2017, 113, 980–993. [Google Scholar]
  24. Pariona, M.M.; Taques, A.F.; Woiciechowski, L.A. The Marangoni effect on microstructure properties and morphology of laser-treated Al-Fe alloy with single track by FEM: Varying the laser beam velocity. Int. J. Heat Mass Tran. 2018, 119, 10–19. [Google Scholar]
  25. Zhou, J.; Tsai, H.L. Modeling of transport phenomena in hybrid laser-MIG keyhole welding. Int. J. Heat Mass Tran. 2008, 51, 4353–4366. [Google Scholar]
  26. Shah, A.; Kumar, A.; Ramkumar, J. Analysis of transient thermo-fluidic behavior of melt pool during spot laser welding of 304 stainless-steel. J. Mater. Process. Technol. 2018, 256, 109–120. [Google Scholar] [CrossRef]
  27. Chen, W.J.; Han, S.X.; Guo, J.C.; Yang, R.N.; Lei, X.W.; Yao, W.J.; Wang, N. Laser deposited superalloys with rotated substrate orientations: Microstructures and single-crystal formation. Acta Mater. 2023, 244, 118566. [Google Scholar] [CrossRef]
  28. Rappaz, M.; David, S.A.; Vitek, J.M.; Boatner, L.A. Development of microstructures in Fe-15Ni-15Cr single-crystal electron-beam welds. Metall. Trans. A 1989, 20, 1125–1138. [Google Scholar]
  29. Guo, J.C.; Rong, P.; Wang, L.; Chen, W.J.; Han, S.X.; Yang, R.N.; Lei, X.W.; Yao, W.J.; Wang, N. A comparable study on stray grain susceptibilities on different crystallographic planes in single crystal superalloys. Acta Mater. 2021, 205, 116558. [Google Scholar]
  30. Wang, L.; Wang, N.; Yao, W.J.; Zheng, Y.P. Effect of substrate orientation on the columnar-to-equiaxed transition in laser surface remelted single crystal superalloys. Acta Mater. 2015, 88, 283–292. [Google Scholar]
Figure 2. Schematic diagram of the modeling and meshing method.
Crystals 13 01162 g002
Figure 3. The thermophysical parameters for the simulation: (a) surface tension, (b) specific heat, (c) thermal conductivity, and (d) density.
Crystals 13 01162 g003
Figure 4. The temperature distribution for three different laser powers (a) 200 W, (b) 350 W, and (c) 500 W at a fixed scanning speed of 2.5 mm/s.
Crystals 13 01162 g004
Figure 5. The melt pool shape for different laser powers: (a) 200 W, (b) 350 W, and (c) 500 W with the same scanning speed of 2.5 mm/s.
Crystals 13 01162 g005
Figure 6. The melt pool shape at different scanning velocities: (a) 2.5 mm/s, (b) 5.0 mm/s, and (c) 7.5 mm/s with a fixed laser power of 500 W.
Crystals 13 01162 g006
Figure 7. The melt pool shapes for the laser power of 200 W and 350 W at the scanning speed of 2.5 mm/s with and without considering the Marangoni convection. (a) 200 W, convection. (b) 200 W, no convection. (c) 350 W, convection. (d) 350 W, no convection.
Crystals 13 01162 g007
Figure 8. The comparisons between the calculated and experimental melt pool for laser power (a) 200 W, and (b) 350 W at the scanning speed of 2.5 mm/s.
Crystals 13 01162 g008
Figure 9. The fluid direction in the melt pool for the laser power of (a) 200 W, and (b) 350 W at the scanning speed of 2.5 mm/s.
Crystals 13 01162 g009
Table 1. The nominal composition of nickel-based SX superalloy DD6 (wt. %).
CompositionCrCoMoWTaReNbAlHfNi
DD64.39.02.08.07.52.00.55.60.1Bal.
Disclaimer/Publisher’s Note: The statements, opinions and data contained in all publications are solely those of the individual author(s) and contributor(s) and not of MDPI and/or the editor(s). MDPI and/or the editor(s) disclaim responsibility for any injury to people or property resulting from any ideas, methods, instructions or products referred to in the content.

