Article

Analysis and Characterization of Three Charge Thicknesses in TA1/Al1060/Al7075 Explosive Welding Composite Process

School of Field Engineering, PLA Army Engineering University, Nanjing 210007, China
*
Authors to whom correspondence should be addressed.
Crystals 2023, 13(7), 1079; https://doi.org/10.3390/cryst13071079
Submission received: 24 June 2023 / Revised: 5 July 2023 / Accepted: 5 July 2023 / Published: 10 July 2023
(This article belongs to the Section Crystalline Metals and Alloys)

Abstract

:
The titanium/aluminum composite materials overcome the limitations of single metal materials and achieve lightweight, high-strength, and corrosion-resistant properties. However, there have been no reports on explosion-welded composites of titanium alloys and seven-series aluminum alloys. Therefore, TA1/Al1060/Al7075 explosion-welded plates with three different explosive thicknesses were successfully prepared using Al1060 as the transition layer. The SPH-FEM coupled algorithm was employed to analyze the detonation process in detail and predict the interface under different explosive thicknesses. The results showed that during the explosion welding process, the high temperature, pressure, and high-speed impact resulted in significant plastic deformation and jetting phenomena at the bonding interface, which were in good agreement with the experimental observations. With the increase in explosive thickness, the TA1/Al1060 bonding interface exhibited a flat shape, while the Al1060/Al7075 interface transitioned from a flat to a wavy morphology. Moreover, the crack, vortex, and TiAl3 were observed at the interface. Mechanical testing results revealed that the composite plate with a 35 mm explosive thickness exhibited the best tensile, shear, and bending performance, indicating the optimal process parameter. This study provides significant support and reference for the application of explosion welding technology in titanium alloys and seven-series aluminum alloy composite materials.

1. Introduction

Layered metal composite materials have gained extensive applications in diverse fields such as pressure vessels [1,2,3], aerospace [4], and protective armor [5], as they address the inherent limitations of individual metals in terms of performance. Explosion welding, a widely used manufacturing technique, utilizes the energy generated by explosives to induce bending and high-speed collision between laminates, leading to solid-state bonding [6]. This method offers the advantage of achieving a high-strength bond at the interface, combined with operational simplicity, making it a preferred approach for fabricating layered metal composites.
In recent years, the demand for high strength, fracture toughness, rigidity, and weight reduction in modern industries has led to the rapid development of new alloys such as aluminum and titanium. These alloys hold the potential to replace alloy steel as the preferred structural material for next-generation military equipment [7]. Aluminum offers advantages such as low weight, moderate strength, and favorable machinability, although it is susceptible to corrosion in marine environments. On the other hand, titanium exhibits high strength, low density, superior specific strength compared to traditional metal materials, and excellent corrosion resistance in marine environments. However, its relatively high cost limits its applicability. Consequently, titanium/aluminum composite plates have emerged as a crucial avenue in advancing metal composite plates, offering lightweight properties, high strength, abrasion resistance, and corrosion resistance [8].
While there have been investigations on explosive bonding of layered composites involving pure aluminum [9], 2A12 [10], Al5083 [11], and Al6061 [12] in combination with titanium alloys, the field of explosive welding between titanium alloys and 7xxx series aluminum alloys remains insufficiently explored. To date, the explosion bonding of Al7075 with magnesium alloy AZ31B has been the only reported case [13]. This limited exploration can be attributed to several factors. Firstly, Al7075 is a high-strength aluminum alloy extensively used in the manufacturing of critical aerospace components. However, its elevated hardness makes it susceptible to crack initiation under substantial deformation conditions. Secondly, the dissimilarity in mechanical and physical properties between TA2 and Al7075 poses challenges to achieving successful explosion bonding. In response to these challenges, the interlayer technique has been introduced in explosive composite processes to address the difficulties associated with bonding dissimilar metals. Previous studies have demonstrated the effectiveness of interlayer applications. For instance, Wachowski et al. [14] achieved successful bonding between AZ31 and Al2519 using an Al1050 interlayer. Similarly, Paul et al. [15] produced explosive composites of tantalum/copper/304 stainless steel, while Aceves et al. [16] investigated the influence of copper, titanium, and tantalum interlayers on the bonding quality of Al6061/304L stainless steel composites. Notably, the results indicated that titanium exhibited the highest joint strength, whereas tantalum contributed to the most ductile joint formation. Interlayer techniques offer two primary advantages: firstly, they provide a transition bridge for dissimilar metals with poor chemical compatibility, enabling enhanced bonding; secondly, they serve as an energy buffer, mitigating the collision forces between the base and flyer plates and minimizing crack formation in metals with limited plasticity. Motivated by these insights, this study aims to employ a pure aluminum Al1060 interlayer to facilitate the explosion bonding between TA2 and Al7075. Through the introduction of an interlayer, it is anticipated that the disparities between TA2 and Al7075 can be overcome, facilitating a robust and effective bond between the two materials.
Furthermore, the quality of explosion bonding is closely linked to the selection of process parameters, making the determination of optimal parameters a critical aspect [17]. Alterations in process parameters induce changes in pressure, velocity, temperature, and other relevant factors during the collision between the base and flyer plates, which subsequently manifest as interface waveform and interface melting defects. Process parameters play a vital role in connecting the chosen process parameters to the resulting bonding quality [18]. Due to the elevated temperature, pressure, and velocity inherent in the explosion welding process, conventional sensing techniques prove inadequate for effectively capturing its process parameters [19]. Consequently, numerical simulation has emerged as a valuable tool for investigating explosion bonding composite processes and optimizing their corresponding procedures. Particularly, recent advancements in meshless Smoothed Particle Hydrodynamics (SPH) techniques have enabled the accurate replication of interface waviness [18,20,21]. However, Yang et al. [22] have highlighted the accuracy limitations of SPH when simulating explosive detonation compared to traditional finite element methods. Consequently, a novel avenue for numerical simulation in explosion bonding has emerged, known as the coupling of SPH with the Finite Element Method (FEM), commonly referred to as SPH-FEM coupling. This innovative approach ensures the precise calculation of explosive detonation while accurately capturing the waviness interface characteristics during the bonding process.
This study compared the outcomes of numerical simulation and experimental findings of the explosive welding process for the TA1/Al1060/Al7075 composite, so as to optimize the explosion bonding process for the above composite materials. To achieve this, a numerical simulation approach based on the SPH-FEM coupling algorithm was employed to simulate the explosion welding process. Through this simulation, the detonation process was analyzed, and the morphology of the bonding interface was predicted. Additionally, comparative experiments involving explosion welding with varying explosive charges were designed to examine the microstructural characteristics of the bonding interface and evaluate the mechanical properties of the resulting composite plates. The fundamental aim of this research was to provide theoretical guidance, practical insights, and contribute to ongoing efforts in lightweighting equipment through the development of lightweight, high-strength composite materials.

2. Materials and Method

2.1. Simulation

2.1.1. Material Setup

All simulations in this study were conducted using ANSYS/AUTODYN-2D. The explosive material was modeled using the JWL equation [23], which is expressed by Equation (1), with the corresponding parameters listed in Table 1.
P = A ( 1 ω R 1 V ) e R 1 V + B ( 1 ω R 2 V ) e R 2 V + ω E 0 V
The constitutive equation for the plates employed the SHOCK equation of state [21], which offers improved accuracy in simulating shock phenomena compared to conventional linear equations. The expression for the SHOCK equation is as follows:
ρ = ρ H + Γ ρ ( e e H )
ρ = Γ 0 ρ 0 = c o n s tan t
ρ H = ρ 0 c 0 u ( 1 + u ) [ 1 ( g 1 ) u ] 2
e H = 1 2 ρ H ρ 0 ( u 1 + u )
where Γ0 is the Gruneisen coefficient, u is defined as (ρ/ρ0) − 1, ρ represents the current density, ρ0 is the initial density, and c0 is the bulk sound velocity.
The constitutive model for the base plate employed the Johnson–Cook equation [24] for TA1 and Al7075, and the Steinberg–Guinan (SG) equation [25] for Al1060. The Johnson–Cook (JC) equation (Equation (6)) combines the effects of strain hardening, strain rate hardening, and temperature, with each effect decoupled from the others. The Steinberg–Guinan equation (Equations (7) and (8)) provides higher accuracy in simulating near-fluid behavior at strain rates greater than 105 s−1, although parameter acquisition for this equation is more challenging. The corresponding material parameters for the base plate are provided in Table 2.
Y = [ A + B ε n ] [ 1 + C ln ε ˙ ε ˙ 0 ] [ 1 T H m ]
where Y represents the yield stress, A denotes the initial yield stress, B represents the hardening exponent, n represents the hardening exponent, C represents the strain rate coefficient, m represents the temperature coefficient, and TH is defined as (T − Tm)/(T − Tr), where Tm is the material’s melting point and Tr is the reference temperature. ε represents the equivalent plastic strain, and ε ˙ and ε ˙ 0 represent the current and reference strain rates, respectively.
G = G 0 { 1 + ( G P G 0 ) P η 1 / 3 + ( G t G 0 ) ( T - 300 ) }
Y = Y 0 { 1 + ( Y P Y 0 ) P η 1 / 3 + ( G t G 0 ) ( T 300 ) } ( 1 + β ε ) n
where G represents the shear modulus, Y denotes the yield stress, ε represents the equivalent plastic strain, P stands for pressure, T represents temperature, η represents the volumetric compressibility, β represents the hardening exponent, and n represents the hardening coefficient. G0 and Y0 denote the initial shear modulus and yield stress, respectively. GP and Gt represent the first derivatives of the shear modulus with respect to pressure and temperature, respectively, while YP represents the first derivative of the yield stress with respect to pressure.

2.1.2. Welding Setup

The explosion welding model utilized a two-dimensional plane symmetric configuration, where the initiation point was located at the upper-left boundary of the model. A linear ignition source of 10 mm was used for initiating the detonation, resulting in an instantaneous explosion. The geometric dimensions of the study included three different models with varying quantities of explosives, referred to as 28 mm, 35 mm, and 40 mm, representing different explosive loads. Detailed dimensions for the base plate, clad plate, and transition plate are provided in Table 3. For accurate measurements, a total of 12 strategically positioned points were considered. Gauge1 to Gauge6 were placed at the central regions of the clad plate with intervals of 20 mm, while Gauge7 to Gauge12 were positioned at equivalent intervals within the central areas of the transition plate. The overall detonation duration was set at 0.08 ms, and data were recorded at regular intervals of 0.002 ms.
Regarding meshing, an Eulerian meshing technique was employed to discretize the air and explosive domains. Outflow boundary conditions were applied to the air domain. A hybrid meshing approach was used for the flyer plate, combining 1/2 Lagrangian mesh and 1/2 Smoothed Particle Hydrodynamics (SPH) particles. To ensure proper integration of SPH and Lagrangian meshes, the Join functionality was utilized, which established shared nodes and facilitated their coupling. This step was crucial to maintain consistency and avoid treating the two mesh types as separate entities. The transition plate and base plate were discretized solely using SPH particles. The foundation employed a Lagrangian grid with fixed constraints imposed to restrict its velocity in the X and Y directions. The Eulerian mesh had dimensions of 0.2 mm × 0.2 mm, while the Lagrangian mesh had dimensions of 0.25 mm × 0.25 mm. The SPH particles were assigned a size characterized by a diameter of 0.125 mm. For instance, in the case of the 40 mm explosive model, the SPH particle count was 66,483, the number of Lagrangian mesh elements was 2400, and the Eulerian mesh consisted of 177,000 elements. The SPH-FEM coupling model was shown in Figure 1.

2.2. Experiments

2.2.1. Explosive Welding

The experiments on explosive welding were conducted at Jiangsu Runbang New Materials Group. A powdered emulsion explosive composed of 60% quartz sand was used as the explosive material. The components of the emulsion matrix are listed in Table 4. The base plate, transition plate, and flyer plate were made of Al7075, Al1060, and TA1, respectively, with their chemical compositions provided in Table 5 for reference. Detailed dimensions of the materials can be found in Table 3. Before commencing the experiments, thorough surface preparation procedures were performed, including polishing and buffing, to remove any oxide layers and restore surface smoothness. The surfaces were then meticulously cleaned using alcohol wipes to ensure a clean bonding surface.
Figure 2 shows the scene picture of the explosive welding experiment. The explosive welding procedure followed the traditional parallel configuration, where the base plate, transition plate, and flyer plate were vertically aligned and supported on a sand foundation. To ensure accurate alignment, a 3 mm pure copper spacer was placed between the plates. A cardboard box was ingeniously created to serve as the container for the explosive material, positioned above the flyer plate. The explosive material was carefully injected into the box, ensuring uniform thickness, which was confirmed through multiple measurements. Finally, an electronic detonator was securely positioned at the center of the composite material, and the explosion initiation was conducted with strict adherence to safety protocols.

2.2.2. Property Characterization

After the completion of the explosive bonding process, identical samples were obtained from corresponding positions on the three plates using wire cutting. These samples were then utilized for microstructural characterization and mechanical property testing. The samples for microstructural analysis had dimensions of 10 mm × 10 mm. Prior to analysis, the bonding interfaces underwent a sequential process of grinding, polishing, and etching using a solution consisting of 5% HNO3, 10% HF, and 85% H2O. Microstructural analysis was performed using optical microscopy (OM) with an Axiophot2 microscope (ZESS, Shanghai, China) featuring a resolution of <300 nm. Additionally, scanning electron microscopy (SEM) was carried out using a JSM-6360lv instrument (JEOL, Tokyo, Japan), and energy-dispersive X-ray spectroscopy (EDS) was conducted using a Nova NanosEM230 instrument (EDAX Inc, Draper, UT, USA) with a resolution of <130 ev.
The mechanical testing included assessments of tensile, shear, and bending performance, all of which were conducted using a Shenzhen Sansi UTM5105 universal testing machine. The corresponding reference standards employed were GB/T 228.1-2021, GB/T 6396-2008, and YB/T 5349-2014. Tensile tests were conducted at a rate of 4.8 mm/min, shear tests at 3.84 mm/min, and bending tests at 5 mm/min with a span of 100 mm. Each explosive charge quantity was tested twice, and the experimental results were recorded. The average values obtained from the two tests were considered the mechanical performance indicators for the respective charge quantity. Figure 3 displays the mechanical properties test drawings.

3. Results and Discussion

3.1. Detonation Process Analysis

After the initiation of the explosive welding process, the detonation wave propagated in a fan-shaped pattern from the initiation point. Figure 4a presents the pressure contour plot for a 35 mm explosive charge, showing a peak pressure of 92.3 MPa at the detonation wave front. As the detonation progressed, the detonation products dispersed, while the target plate remained stationary until the detonation pressure was reached. At 46μs, Figure 4b displays the material contour plot, illustrating the contact between the base plate, transition plate, and flyer plate. The majority of the region between the flyer plate and the transition layer exhibited a planar bonding interface, with localized areas showing a rippled morphology. The bonding between the transition layer and the base plate exhibited a wavy pattern. Moreover, the collision interface between the transition plate and the base plate exhibited jetting phenomena, which are known to play a crucial role in the formation of interfacial ripples [21,26,27].
To further understand the factors contributing to jetting formation, Figure 5a–d provides velocity, strain, temperature, and stress contour plots at this specific moment. The velocity contour plot in Figure 5a reveals that the jetting particles reach a maximum velocity of 4271 m/s. This high-speed jetting action facilitates a self-cleaning effect on the collision surface between the base plate and the flyer plate, promoting their bonding [18]. Plastic deformation is observed between the flyer plate and the transition layer, as well as between the transition layer and the base plate. The former exhibits a relatively small deformation magnitude of approximately 0.2332, while the latter experiences a more pronounced deformation magnitude of approximately 6.995. The temperature contour plot indicates minimal temperature rise between the base plate and the transition layer, whereas the temperature between the transition layer and the base plate reaches approximately 2000 K, accompanied by localized regions of elevated temperature. The strain and temperature contour plots collectively suggest a more intense collision process during the interaction between the transition layer and the base plate. This implies that the target plate maintains an accelerated velocity due to the continued detonation of the explosive charge following the collision between the flyer plate and the transition layer. Conversely, if the energy absorption by the transition layer weakened the subsequent collision effect, a reduction in the target plate’s velocity would be expected. Finally, the stress contour plot verifies that the transition layer experiences certain stress during the initial collision, with a magnitude of approximately 400 MPa, which is significantly lower than the maximum pressure from the second collision (0.8 GPa).

3.2. Effect of Explosive Thickness on Interface

3.2.1. Global Interface Waveform

Figure 6 illustrates the morphological evolution of simulated ripple interfaces at varying thicknesses of the explosive charge. The TA1/Al1060 interface shows minimal changes as the charge thickness increases, while the ripple characteristics of the Al1060/Al7075 interface become more pronounced. To assess the accuracy and effectiveness of the numerical simulations conducted in this study, Figure 7 provides a comparative analysis between the simulated predicted interfaces and the corresponding experimental metallographic images. Remarkably, the simulated interfaces closely match the experimental features, demonstrating the reliability of the numerical modeling approach. Furthermore, Figure 8 showcases metallographic images obtained from the three experimental sets. The comprehensive examination of both simulation and experimental results reveals two significant characteristics of the explosive welding interface waveforms: firstly, an increase in charge thickness leads to a transition from small ripples to larger ones, consistent with observations reported by previous researchers [28,29,30]; secondly, for a given charge quantity, the interface gradually shifts from a planar configuration to a rippled profile along the detonation direction, indicating the presence of interface non-uniformity [31].

3.2.2. Process Parameter

To further investigate the non-uniformity of the interface, the 35 mm thickness model is taken as an example. Figure 9 illustrates the pressure and velocity profiles of Gauges 1–12. Gauges 1–5 exhibit a bimodal pattern in their velocity and pressure curves, with the first peak corresponding to the collision between the cladding plate and the transition layer, and the second peak corresponding to the collision between the transition layer and the base plate. After the collision between the cladding plate and the transition layer, there is an initial decrease followed by an increase in both velocity and pressure before the second collision. This confirms the accelerating effect of the explosive charge throughout the welding process. Notably, Gauge 1, located at the initiation end of the cladding plate, shows significantly lower peak velocity and pressure compared to other measurement points, which can be attributed to the “boundary effect” [32]. The rapid propagation of detonation products in the vicinity and the occurrence of unstable detonation phenomena contribute to this disparity. The lower process parameters at Gauge 1 can result in incomplete bonding and phenomena such as spalling in the surrounding areas during practical production. Gauges 7–10, positioned in the middle region of the transition layer, exhibit monomodal variations in velocity and pressure due to undergoing a single collision event. Gauge 7, located at the initiation end, also displays lower process parameters, indicating the influence of the boundary effect on the transition layer.
Furthermore, compared to the cladding plate, the transition plate demonstrates higher overall process parameters. The maximum collision velocity on the cladding plate reaches approximately 550 m/s, accompanied by a corresponding maximum collision pressure of 2 GPa. In contrast, the transition plate experiences a higher maximum collision velocity of 776 m/s, coupled with a maximum collision pressure of 3.3 GPa. These heightened velocities and pressures on the transition plate result in more pronounced deformations and increase the likelihood of jetting and wave formation phenomena. These findings provide insights into the observed characteristics in both the simulation and experimental outcomes, where the TA1/Al1060 interface predominantly exhibits a linear bond, while the Al1060/Al7075 interface displays a wavy bonding pattern.
Figure 10 illustrates the variations in maximum pressure and velocity recorded at different positions on the cladding plate and transition plate for varying explosive thicknesses. With increasing explosive thickness, both the maximum velocity and pressure experienced by the cladding plate and transition plate gradually increase. The average velocities on the cladding plate are determined to be 482.95 m/s, 502.14 m/s, and 525.43 m/s for thicknesses of 28 mm, 35 mm, and 40 mm, respectively, accompanied by average pressures of 1.20 GPa, 1.30 GPa, and 1.58 GPa. Similarly, the average velocities on the transition plate exhibit values of 527.87 m/s, 615.22 m/s, and 649.58 m/s, respectively, accompanied by average pressures of 1.58 GPa, 1.90 GPa, and 2.13 GPa. The progressive increase in explosive thickness leads to a heightened energy release, resulting in greater velocities and pressures during the collision between the cladding plate and the transition plate. As a result, the materials adjacent to the bonding interface undergo more substantial plastic deformation, leading to an increased ejection of particles and exacerbating the waviness of the interface.

3.3. Local Interface Feature

3.3.1. Interface Defect

In general, a larger waveform in the bonding interface indicates a larger contact area, which has the potential to improve bonding quality. However, it is important to note that waviness in the interface can also introduce certain defects. Figure 11 provides scanning electron microscope (SEM) images and localized magnifications of the bonding interfaces under two different explosive charge conditions: 28 mm and 40 mm. In Figure 11a, the bonding interfaces under a 28 mm charge appear to be flat, and upon closer inspection of the magnified regions, no significant interface defects are observed near the TA1/Al1060 and Al1060/Al7075 interfaces. On the other hand, under a 40 mm charge, these interfaces exhibit a combination of flat and wavy regions, as shown in Figure 11d, which aligns with the earlier findings. Upon further magnification, cracks are observed in the TA1/Al1060 interface. These cracks are typically associated with the formation of brittle intermetallic compounds at the bonding interface, posing a significant threat to the bonding quality. On the Al1060/Al7075 side, vortex regions are observed, likely influenced by the entrainment of jet particles by the base cladding plate. The high velocity and temperature of the jet particles in the vortex region increase the likelihood of interface melting defects, as seen in Figure 8. These findings suggest that for lower explosive charges, the waviness of the bonding interface is reduced, indicating fewer interface defects. However, for higher explosive charges, although the waviness of the interface becomes more pronounced, it also increases the possibility of crack formation and the emergence of vortex structures.

3.3.2. Element Diffusion

To investigate the elemental distribution in the interface region, energy-dispersive X-ray spectroscopy (EDS) analysis was conducted on the samples. The results are presented in Figure 12, which shows EDS surface scans for the 28 mm (Figure 12a–c) and 40 mm charge thicknesses (Figure 12d–f). A distinct layering phenomenon is observed in the elemental distribution. Furthermore, the transition plate exhibits a higher aluminum (Al) content compared to other regions, consistent with the properties of Al1060 industrial pure aluminum. The TA1 side shows the highest titanium (Ti) content, despite the presence of trace amounts of Ti in both Al1060 and Al7075. These findings provide further evidence of element diffusion at the bonding interface, a common phenomenon in explosive bonding processes [33,34,35,36].
Additionally, line scans were performed on the TA1/Al1060 interface under three different charge thicknesses, referred to as L1-L3 (Figure 13). The line scans confirm an X-shaped distribution of Al and Ti elements at the bonding interface, corroborating the occurrence of element diffusion. Notably, for the 28 mm charge thickness, the measured diffusion layer widths are 1.283 μm for Al and 0.642 μm for Ti. This indicates a more pronounced diffusion of Al compared to Ti.
As the charge thickness increases, the width of the element diffusion layer at the interface gradually expands. Specifically, the diffusion widths for the 28 mm, 35 mm, and 40 mm charge thicknesses are 1.283 μm, 1.999 μm, and 3.114 μm, respectively. This increase in diffusion width can be attributed to the localized temperature rise at the bonding interface caused by the explosive charge. Furthermore, the widening of the diffusion layer is primarily observed in the Al species, while the variation in Ti diffusion layer width with increasing charge thickness is less prominent.
Moreover, the line scans L2–L3 reveal not only an X-shaped distribution but also a localized decrease in peak intensity on the Al1060 side. This decrease corresponds to a reduction in aluminum content and an increase in titanium content, indicating the possible formation of Ti–Al compounds. To further validate this observation, a localized region of the L3 line scan was subjected to a subsequent surface scan (Figure 12g–i). In the Al1060 region, a distinct area with reduced aluminum content is observed, accompanied by a significantly higher titanium content. Point analysis results in Table 6 confirm varying degrees of Al and Ti diffusion at points 1–3, with relatively lower concentrations. Point 4 analysis indicates the presence of the TiAl3 compound. It should be noted that Ti–Al interfaces may contain compounds such as TiAl, TiAl2, and TiAl3 [37], but only TiAl3 was identified in this study. Importantly, intermetallic compounds generally possess brittle characteristics, posing a significant risk to bonding quality in composite material applications, as illustrated in Figure 11e.

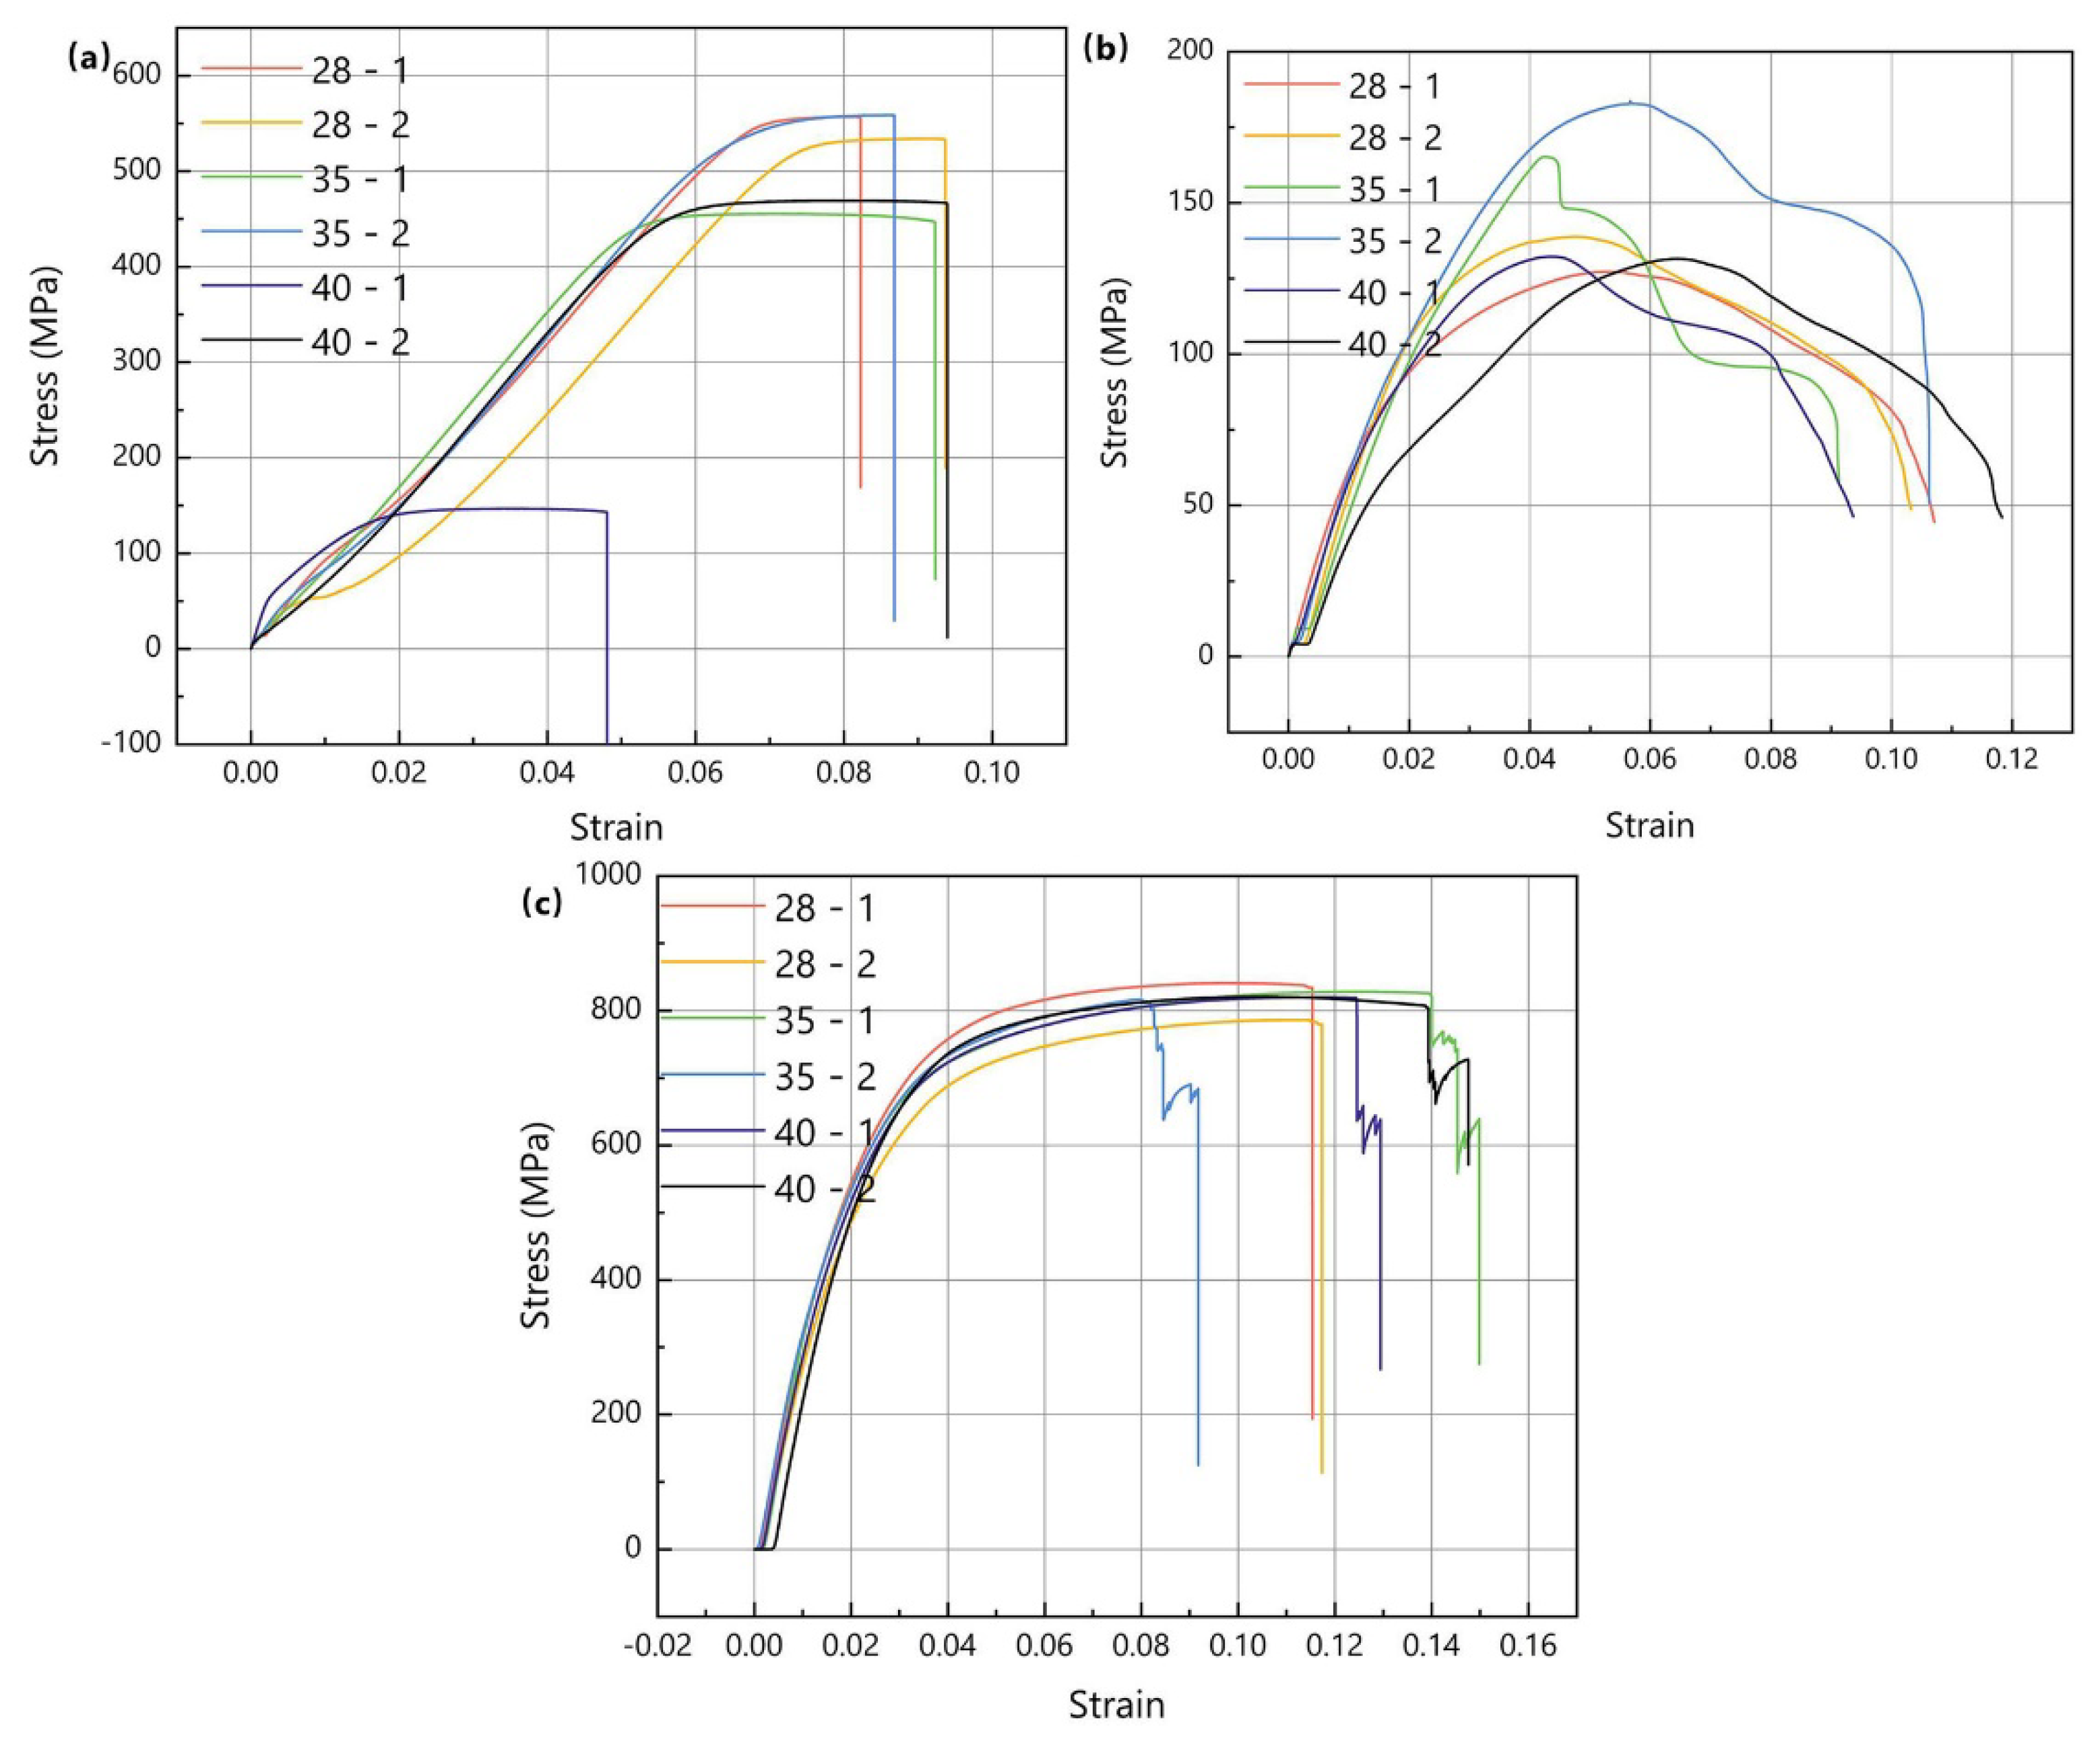
3.4. Mechanical Property

Figure 14 illustrates the mechanical performance curves of the composite panels under different explosive charge thicknesses. In the tensile tests, samples 28-1 and 35-2 exhibited the highest tensile strength, reaching 550 MPa, with 35-2 displaying superior ductility. In the shear tests, sample 35-2 demonstrated the highest shear strength and shear displacement, followed by sample 35-1, which exhibited the maximum shear strength. In terms of bending tests, the variation in bending strength among the composite panels with different charge thicknesses was negligible. However, samples 35-1 and 40-2 displayed the most significant bending displacement. To facilitate a comprehensive comparison, the mechanical performance metrics under different charge thicknesses were averaged, and the results are summarized in Table 7. Notably, the composite panel with a charge thickness of 35 mm demonstrated superior performance in terms of tensile strength, shear strength, and bending strength, surpassing the other two charge thicknesses.
Based on the aforementioned findings, it can be concluded that the optimal process parameters for the 2 mm TA2 + 1 mm Al1060 + 6 mm Al7075 composite panel align with a configuration involving a 35 mm charge thickness, 3 mm gap 1, and 3 mm gap 2. This selection is attributed to the composite material’s ability, at a charge thickness of 35 mm, to retain the waviness characteristics of the interface while minimizing the occurrence of interface defects and intermetallic compounds. These factors can be attributed to an excessive amount of explosive energy. It is worth noting that previous studies by Shi et al. [38] have emphasized that a microwavy interface represents the most desirable form of bonding interface due to its ability to avoid melting defects. Additionally, Manikandan et al. [39] have highlighted that a smaller waviness interface diminishes the likelihood of intermetallic compound formation at the interface. Consequently, the experimental results obtained in this study align with and substantiate the viewpoints expressed in the aforementioned studies.

4. Conclusions

TA1/Al1060/Al7075 explosive welding composite material was successfully fabricated using Al1060 as a transition layer. The SPH-FEM coupling algorithm was employed to predict and analyze the composite process and bonding interface, while the microstructural morphology of the bonding interface and the mechanical properties of the composite panel were characterized and tested. The main conclusions are as follows:
(1) The SPH-FEM algorithm was applied for the first time to analyze the complete process of explosive welding, successfully reproducing the phenomena of jet formation and wave generation at the interface. The simulation results exhibited good agreement with experimental results. With an increase in the charge thickness, the simulated Al1060/Al7075 interface gradually transitioned from a small waviness interface to a large waviness interface.
(2) As the charge thickness increased, the variation in the TA1/Al1060 bonding interface was not significant, while the Al1060/Al7075 bonding interface transformed from a flat interface to a wavy interface, and the width of the diffusion layer increased with the charge thickness. Cracks and vortex regions were observed in the composite panel with a 40 mm charge thickness, and the presence of the TiAl3 compound was detected at the TA1/Al1060 bonding interface.
(3) The composite panel prepared with a charge thickness of 35 mm retained the wavy interface and reduced the possibility of metal intermetallic compounds. It exhibited superior tensile strength, shear strength, and bending strength compared to samples with charge thicknesses of 28 mm and 40 mm. Therefore, the optimal process parameters were determined as 35 mm charge thickness, 3 mm gap 1, and 3 mm gap 2, suitable for fabricating a composite panel consisting of a 2 mm TA2 + 1 mm Al1060 layer + 6 mm Al7075.

Author Contributions

Writing—reviewing and editing, Z.X.; conceptualization, C.S.; methodology, C.S.; software, C.S.; data curation, Z.S.; writing—original draft preparation, Z.S.; visualization, Z.S.; investigation, H.W.; supervision, Q.W.; software, X.L; validation, X.L. All authors have read and agreed to the published version of the manuscript.

Funding

This work was financially supported by the National and Jiangsu Province Natural Science Foundation of China (No. 51541112 and BK20211232).

Data Availability Statement

The data presented in this study are available upon request from the corresponding author. The data are not publicly available due to restrictions regarding ongoing funded research.

Conflicts of Interest

The authors declare no conflict of interest. The funders had no role in the design of the study; in the collection, analyses, or interpretation of data; in the writing of the manuscript, or in the decision to publish the results.

References

  1. Zhao, H. The Microstructure and Property of a Titanium-Carbon Steel Clad Plate Prepared Using Explosive Welding. Metals 2022, 12, 129. [Google Scholar] [CrossRef]
  2. Wang, R.; He, Y.; Tan, T.; Guo, X.; Song, J.; Ren, J.; Zhang, S.; Zhang, X. Niobium-316L Stainless Steel Transition Joints for Superconducting Radiofrequency Cavities by Explosive Welding. Rare Met. Mater. Eng. 2019, 48, 3876–3882. [Google Scholar]
  3. Zheng, J.; Li, Z.; He, D.; Shen, T.; Jiang, Z.; Lin, Y.C. Investigation of the Annealing Effects on Mechanical Properties and Interfacial Characteristic of TA1/Al5083 Bimetal Composite. J. Mater. Eng. Perform. 2023. [CrossRef]
  4. Lazurenko, D.V.; Bataev, I.A.; Mali, V.I.; Bataev, A.A.; Maliutina, I.N.; Lozhkin, V.S.; Esikov, M.A.; Jorge, A.M.J. Explosively welded multilayer Ti-Al composites: Structure and transformation during heat treatment. Mater. Des. 2016, 102, 122–130. [Google Scholar] [CrossRef]
  5. Zhou, N.; Wang, J.X.; Yang, R.; Dong, G. Damage mechanism and anti-penetration performance of multi-layered explosively welded plates impacted by spherical projectile. Theor. Appl. Fract. Mech. 2012, 60, 23–30. [Google Scholar] [CrossRef]
  6. Findik, F. Recent developments in explosive welding. Mater. Des. 2011, 32, 1081–1093. [Google Scholar] [CrossRef]
  7. Wu, X.; Shi, C.; Gao, L.; Li, W.; Feng, K. Study on Parameters and Wave Growth Mechanism of Explosive Welding Based on SPH-FEM. Rare Met. Mater. Eng. 2023, 52, 1272–1282. [Google Scholar]
  8. Demir, B.; Ali, K.B.; Gurun, H.; Acarer, M. An investigation of the shearing performance and sheared surface characterisation of ultra-strength DP steel-Al explosive welded plate composite. Int. J. Adv. Manuf. Technol. 2023, 126, 1845–1861. [Google Scholar] [CrossRef]
  9. Fan, M.; Guo, X.; Cui, S.; Wu, Q.; Qin, L.; Tao, J. One-Step Explosive Bonding Preparation of Titanium/Aluminum/Titanium Laminates with Three Layers. Rare Met. Mater. Eng. 2017, 46, 770–776. [Google Scholar]
  10. Ma, Z.; Li, D.; Hu, J.; Li, Y. Process of Explosive Welding-Rolling for Preparation of Titanium/Aluminum Composite Plate. Chin. J. Rare Met. 2004, 28, 797–799. [Google Scholar]
  11. Wu, X.; Shi, C.; Fang, Z.; Lin, S.; Sun, Z. Comparative study on welding energy and Interface characteristics of titanium—Aluminum explosive composites with and without interlayer. Mater. Des. 2021, 197, 109279. [Google Scholar] [CrossRef]
  12. Sun, J.; Cao, R.; Chen, J. Analysis of welding-brazing joints of Ti/Al dissimilar metals obtained by cold metal transfer method. Trans. China Weld. Inst. 2015, 36, 051–054. [Google Scholar]
  13. Yan, Y.B.; Wang, J.H.; Shen, X.P.; Zhang, L.K. Microstructure evolution of interface of aluminum alloy/magnesium alloy explosive composite plates after low temperature annealing. Chin. J. Nonferrous Met. 2010, 20, 674–680. [Google Scholar]
  14. Wachowski, M.; Kosturek, R.; Sniezek, L.; Mroz, S.; Gloc, M.; Krawczynska, A.; Malek, M. Analysis of the Microstructure of an AZ31/AA1050/AA2519 Laminate Produced Using the Explosive-Welding Method. Mater. Tehnol. 2019, 53, 239–243. [Google Scholar] [CrossRef]
  15. Paul, H.; Chulist, R.; Mania, I. Structural Properties of Interfacial Layers in Tantalum to Stainless Steel Clad with Copper Interlayer Produced by Explosive Welding. Metals 2020, 10, 969. [Google Scholar] [CrossRef]
  16. Aceves, S.M.; Espinosa-Loza, F.; Elmer, J.W.; Huber, R. Comparison of Cu, Ti and Ta interlayer explosively fabricated aluminum to stainless steel transition joints for cryogenic pressurized hydrogen storage. Int. J. Hydrog. Energy 2015, 40, 1490–1503. [Google Scholar] [CrossRef] [Green Version]
  17. Sun, Z.; Shi, C.; Wu, X.; Shi, H. Comprehensive investigation of effect of the charge thickness and stand-off gap on interface characteristics of explosively welded TA2 and Q235B. Compos. Interfaces 2020, 27, 977–993. [Google Scholar] [CrossRef]
  18. Sun, Z.R.; Shi, C.G.; Xu, F.; Feng, K.; Zhou, C.H.; Wu, X.M. Detonation process analysis and interface morphology distribution of double vertical explosive welding by SPH 2D/3D numerical simulation and experiment. Mater. Des. 2020, 191, 108630. [Google Scholar] [CrossRef]
  19. Zhang, Z.L.; Liu, M.B. Numerical studies on explosive welding with ANFO by using a density adaptive SPH method. J. Manuf. Process. 2019, 41, 208–220. [Google Scholar] [CrossRef]
  20. Wang, X.; Zheng, Y.; Liu, H.; Shen, Z.; Hu, Y.; Li, W.; Gao, Y.; Guo, C. Numerical study of the mechanism of explosive/impact welding using Smoothed Particle Hydrodynamics method. Mater. Des. 2012, 35, 210–219. [Google Scholar] [CrossRef]
  21. Yuan, X.; Wang, W.; Cao, X.; Zhang, T.; Xie, R.; Liu, R. Numerical study on the interfacial behavior of Mg/Al plate in explosive/impact welding. Sci. Eng. Compos. Mater. 2017, 24, 581–590. [Google Scholar] [CrossRef]
  22. Yang, M.; Xu, J.; Ma, H.; Lei, M.; Ni, X.; Shen, Z.; Zhang, B.; Tian, J. Microstructure development during explosive welding of metal foil: Morphologies, mechanical behaviors and mechanisms. Compos. Part B Eng. 2021, 212, 108685. [Google Scholar] [CrossRef]
  23. Zhou, H.-Q.; Yu, M.; Sun, H.-Q.; Dong, H.-F.; Zhang, F.-G. A continuum constitutive model and computational method of explosive detonation. Acta Phys. Sin. 2014, 63, 224702. [Google Scholar] [CrossRef]
  24. Johnson, G.R.; Cook, W.H. Fracture characteristics of three metals subjected to various strains, strain rates, temperatures and pressures. Eng. Fract. Mech. 1985, 21, 31–48. [Google Scholar] [CrossRef]
  25. Steinberg, D.; Cochran, S.; Guinan, M. A constitutive model for metals applicable at high-strain rate. J. Appl. Phys. 1980, 51, 1498–1504. [Google Scholar] [CrossRef] [Green Version]
  26. Mousavi, A.A.A.; Al-Hassani, S.T.S. Numerical and experimental studies of the mechanism of the wavy interface formations in explosive/impact welding. J. Mech. Phys. Solids 2005, 53, 2501–2528. [Google Scholar] [CrossRef]
  27. Li, Y.; Wu, Z. Microstructural Characteristics and Mechanical Properties of 2205/AZ31B Laminates Fabricated by Explosive Welding. Metals 2017, 7, 125. [Google Scholar] [CrossRef] [Green Version]
  28. Mousavi, S.A.A.A.; Sartangi, P.F. Experimental investigation of explosive welding of cp-titanium/AISI 304 stainless steel. Mater. Des. 2009, 30, 459–468. [Google Scholar] [CrossRef]
  29. Kahraman, N.; Gulenc, B.; Findik, F. Joining of titanium/stainless steel by explosive welding and effect on interface. J. Mater. Process. Technol. 2005, 169, 127–133. [Google Scholar] [CrossRef]
  30. Durgutlu, A.; Gulenc, B.; Findik, F. Examination of copper/stainless steel joints formed by explosive welding. Mater. Des. 2005, 26, 497–507. [Google Scholar] [CrossRef]
  31. Borchers, C.; Lenz, M.; Deutges, M.; Klein, H.; Gaertner, F.; Hammerschmidt, M.; Kreye, H. Microstructure and mechanical properties of medium-carbon steel bonded on low-carbon steel by explosive welding. Mater. Des. 2016, 89, 369–376. [Google Scholar] [CrossRef]
  32. Mastanaiah, P.; Reddy, G.M.; Prasad, K.S.; Murthy, C.V.S. An investigation on microstructures and mechanical properties of explosive cladded C103 niobium alloy over C263 nimonic alloy. J. Mater. Process. Technol. 2014, 214, 2316–2324. [Google Scholar] [CrossRef]
  33. Liang, H.; Luo, N.; Chen, Y.; Wang, G.; Wang, J. Interface microstructure and phase constitution of AA1060/TA2/SS30408 trimetallic composites fabricated by explosive welding. J. Mater. Res. Technol. JMRT 2022, 18, 564–576. [Google Scholar] [CrossRef]
  34. Mihara-Narita, M.; Asai, K.; Sato, H.; Watanabe, Y.; Mori, H.; Saito, N.; Chino, Y. Interfacial Microstructure and Mechanical Properties of Explosively Welded Mg/Al Alloy Plates. J. Mater. Eng. Perform. 2022, 31, 7039–7048. [Google Scholar] [CrossRef]
  35. Feng, R.; Zhao, W.; Gan, K.; Feng, M.; Li, Z.; Pan, Y.; Sun, Z.; Li, J. Investigation of interface microstructure and properties of copper/304 stainless steel fabricated by explosive welding. J. Mater. Res. Technol. JMRT 2022, 18, 2343–2353. [Google Scholar] [CrossRef]
  36. Yang, M.; Xu, J.; Chen, D.; Ma, H.; Shen, Z.; Zhang, B.; Tian, J. Understanding interface evolution during explosive welding of silver foil and Q235 substrate through experimental observation coupled with simulation. Appl. Surf. Sci. 2021, 566, 150703. [Google Scholar] [CrossRef]
  37. Chen, Z.; Chen, Q.; Huang, G.; Liu, X. Research on Roll Bonding Technology and Microstructure of Al/Ti/Al Three-layer Clad Sheet Fabricated by Hot Rolling. Mater. Rev. 2012, 26, 106–109. [Google Scholar]
  38. Shi, C.; Yang, X.; Ge, Y.; You, J.; Hou, H. Lower limit law of welding windows for explosive welding of dissimilar metals. J. Iron Steel Res. Int. 2017, 24, 852–857. [Google Scholar] [CrossRef]
  39. Manikandan, P.; Hokamoto, K.; Fujita, M.; Rahukandan, K.; Tomoshige, R. Control of energetic conditions by employing interlayer of different thickness for explosive welding of titanium/304 stainless steel. J. Mater. Process. Technol. 2008, 195, 232–240. [Google Scholar] [CrossRef]
Figure 1. SPH-FEM coupling model.
Crystals 13 01079 g001
Figure 2. The explosive welding experiments: (a) plates; (b) explosive; (c,d) composite plates.
Crystals 13 01079 g002
Figure 3. Mechanical properties test drawings.
Crystals 13 01079 g003
Figure 4. The detonation process: (a) detonation wave; (b) jet.
Crystals 13 01079 g004
Figure 5. The contours during explosive welding: (a) velocity; (b) strain; (c) temp; (d) Mises stress.
Crystals 13 01079 g005
Figure 6. The predicted interface by simulation: (a) 28 mm; (b) 35 mm; (c) 40 mm.
Crystals 13 01079 g006
Figure 7. Interface comparison between simulated prediction and experimental observation: (a) 28 mm; (b) 35 mm; (c) 40 mm.
Crystals 13 01079 g007
Figure 8. The bonding interface under different explosive thickness: (a1a4) 28 mm; (b1b4) 35 mm; (c1c4) 40 mm.
Crystals 13 01079 g008
Figure 9. The process parameters curves: (a) velocity curves of flyer plate; (b) pressure curve of flyer plate; (c) velocity curves of transition plate; (d) pressure curves of transition plate.
Crystals 13 01079 g009
Figure 10. The columnar statistical chart of process parameters under different explosive thicknesses: (a) velocity of flyer plate; (b) pressure of flyer plate; (c) velocity of transition plate; (d) pressure of transition plate.
Crystals 13 01079 g010
Figure 11. SEM images of the interface under 28 mm and 40 mm thickness: (ac) 28 mm; (df) 40 mm.
Crystals 13 01079 g011
Figure 12. Distribution of elements under 28 mm and 40 mm thicknesses: (ac) scanning results of interface surface combined with 28 mm thickness; (df) scanning results of interface surface combined with 40 mm thickness; (g) TA1/Al1060 combined with node scanning and line scanning positions at a thickness of 40 mm; (h,i) scanning results of TA1/Al1060 binding surface at 40 mm thickness.
Crystals 13 01079 g012
Figure 13. Distribution curves of Ti and Al elements under different drug thicknesses.
Crystals 13 01079 g013
Figure 14. Mechanical properties curve of the composite plate under different explosive thicknesses: (a) tensile properties; (b) shear properties; (c) bending properties.
Crystals 13 01079 g014
Table 1. The corresponding parameters of the JWL equation for emulsion explosive.
Explosiveρ0 (g/cm3)D (m/s)γ (-)A1 (GPa)B1 (GPa)R1 (-)R2 (-)ω (-)
value0.821001.812.460.9224.411.1170.22
Table 2. The corresponding parameters of state and constitutive equation for TA1, Al1060, and Al7075.
MaterialEquationParameter
TA1ShockΓ0 (-)C0 (-)S1 (-)S2 (-)
1.0952200.7670
JCA (MPa)B (MPa)n (-)C (-)m (-)Tr (°C)
182.55441.120.53430.3431.39420
Al1060ShockΓ0 (-)C0 (-)S1 (-)S2 (-)
1.9753861.3390
SGYmax (MPa)κ (-)n (-)G′P (-)G′T(KPa/K)Y′P (-)
4804000.271.767−1.669 × 1042.07 × 10−3
Al7075ShockΓ0 (-)C0 (-)S1 (-)S2 (-)
1.9752401.40
JCA (MPa)B (MPa)n (-)C (-)m (-)Tr (°C)
5204770.520.00251.6120
Table 3. The geometric parameters of explosive welding.
MaterialsSimulations (Length × Thickness) (mm)Experiments (Length × Width × Height) (mm)
Base plate Al7075100 × 8200 × 300 × 8
Stand-off gap 133
Transition plate Al1060100 × 1200 × 300 × 1
Stand-off gap 233
Flyer plate TA1100 × 2200 × 300 × 2
Explosive emulsion100 × 28/35/40200 × 300 × 28/35/40
Table 4. The components of the emulsion matrix.
ComponentNH4NO3NaNO3H2OC18H38C24H44O6C12H26
Mass fraction (%)75108421
Table 5. The chemical composition of TA1, Al1060, and Al7075 (wt%).
MaterialsChemical Composition (at%)
TA1TiFeOCNHRest
90.0–94.00.2–0.30.18–0.250.1–0.20.03–0.050.015–0.020.3–0.5
Al1060AlSiCuMgZnMnTiVFe
99.60.250.050.030.050.030.030.050.35
Al7075CuSiFeMnMgZnCrTiAl
1.2–2.00.40.50.32.1–2.95.1–6.10.40.06rest
Table 6. Ti and Al contents in nodes 1–4.
NodesTi (wt.%)Al (wt.%)Analysis
187.3212.68Ti+ a little Al
295.454.55Ti+ a little Al
37.5492.46Al+ a little Ti
424.7375.27TiAl3
Table 7. Mechanical properties of composites under different explosive thicknesses.
Explosive Thickness (mm)28 mm35 mm40 mm
Tension strength (MPa)534.14 558.74 469.25
Tension elasticity modulus (MPa)8677.339227.499135.58
Tension elongation (%)8.296.389.56
Shear strength (MPa)132.84172.41131.91
Bend strength (MPa)813.79822.52820.45
Bending modulus (MPa)30,949.7835,674.4232,039.05
Disclaimer/Publisher’s Note: The statements, opinions and data contained in all publications are solely those of the individual author(s) and contributor(s) and not of MDPI and/or the editor(s). MDPI and/or the editor(s) disclaim responsibility for any injury to people or property resulting from any ideas, methods, instructions or products referred to in the content.

