Article

Phase-Field Simulation of the Microstructure Evolution in the Eutectic Alloy NiAl-31Cr-3Mo

1
Institute of Applied Materials, Karlsruhe Institute of Technology, Straße am Forum 7, 76131 Karlsruhe, Germany
2
Institute of Digital Materials, Karlsruhe University of Applied Science, Moltkestr. 30, 76133 Karlsruhe, Germany
3
Institute of Nanotechnology, Karlsruhe University of Applied Science, Moltkestr. 30, 76133 Karlsruhe, Germany
*
Author to whom correspondence should be addressed.
Crystals 2023, 13(7), 1046; https://doi.org/10.3390/cryst13071046
Submission received: 12 June 2023 / Revised: 23 June 2023 / Accepted: 24 June 2023 / Published: 1 July 2023
(This article belongs to the Special Issue Recently Research on Eutectic Alloy Materials)

Abstract

:
The directionally solidified eutectic alloy NiAl-(Cr,Mo) is a promising candidate for structural applications at high temperatures, due to its increased creep resistance compared to its single phase B2ordered NiAl counterpart. This system yields an eutectic trough connecting the invariant reactions of the ternary alloys NiAl-Cr and NiAl-Mo. During directional solidification (DS) along this trough the evolved microstructures of the two-phase eutectic is changing from fibrous to lamellar and back to fibrous morphology while increasing and decreasing the amounts of Mo and Cr, respectively. To investigate these effects in the morphology, the phase-field method has proven to be predestined in the last decades. However, as the modeling of quaternary systems is challenging for the simulation with a grand potential based phase-field model, the focus of this work is on the generation of a material model for one defined compound namely NiAl-31Cr-3Mo. The modeling is validated by investigating the microstructure evolution in two- and three-dimensional simulations of the DS process for two different growth velocities and by investigating their undercooling spacing relationships. The evolving microstructures obtained from three-dimensional large-scale simulations are presented and validated with corresponding micrographs from scanning electron microscopy (SEM) of directionally solidified samples with the same growth velocities. The simulation results show the theoretically expected behaviors and are in qualitative and quantitative accordance with DS experiments. The study of NiAl-31Cr-3Mo serves as the basis for a comprehensive data-driven analysis of microstructure properties and system quantities of the entire quaternary material NiAl-(Cr,Mo). With this, an accelerated design of advanced materials is promoted.

1. Introduction

Over the last decades, simulations have established as a third essential tool in material science investigations, next to experiments and theoretical works. Especially when examining the solidification process, simulation methods have proven to be helpful tools. A big advantages of this technique is that intermediate states of the solidification can be recorded and examined just like the end state of the material. With this the evolution of the microstucture within the material can be investigated during the entire solidification process. Further, simulations enable a specific adjustment of the material and the process conditions. Through the advances in the computer technologies in the recent years [1], large-scale simulations of three-dimensional structures allow to study the evolution of microstructure formation phenomena in statistical volume elements on high performance clusters [2].
For the process of directional solidification, the phase-field method has been established as one method of choice. Within this method, partial differential equations are numerically solved to simulate the phase transfer process during solidification driven by diffusion and phase transformations [3,4,5,6]. In the last decade, the directional solidification of several binary [7,8] and ternary systems [7,8,9,10,11,12,13,14,15] have been examined in two- and three-dimensional large-scale phase-field simulations.
However, modern materials for industrial applications mainly consist of more than two or three components. Unfortunately, phase-field simulation studies of higher ordered materials are missing in literature. Therefore, this work is intended to be a further contribution to the investigation of multi-component systems using the phase field method. In a first extension to previous works, a new approach to model a quaternary system based on thermodynamic Calphad databases is introduced. To show the validity of the approach, it is executed for a eutectic composition of the real material system Ni-Al-Cr-Mo, which is a potential candidate for high temperature applications. Through the directional solidification at this composition, namely NiAl-(Cr,Mo), a two-phase eutectic pattern is evolving in the microstructure. In a first study, two-dimensional simulations of the directional solidification process are performed to investigate according to the theory of Jackson and Hunt [16] the relationship between the solidification velocity, the evolving lamellar spacings of the microstructure and the adjusting undercoolings at the solidification front. Next, three-dimensional large-scale simulations are performed to compare the adjusting microstructure patterns with respective experimental results, which have been also performed for this work. Finally, the conclusions of the simulation results and the comparison with theory and experiment are drawn. Based on these conclusions the presented modelling approach for eutectic quaternary systems is validated.

2. Materials and Methods

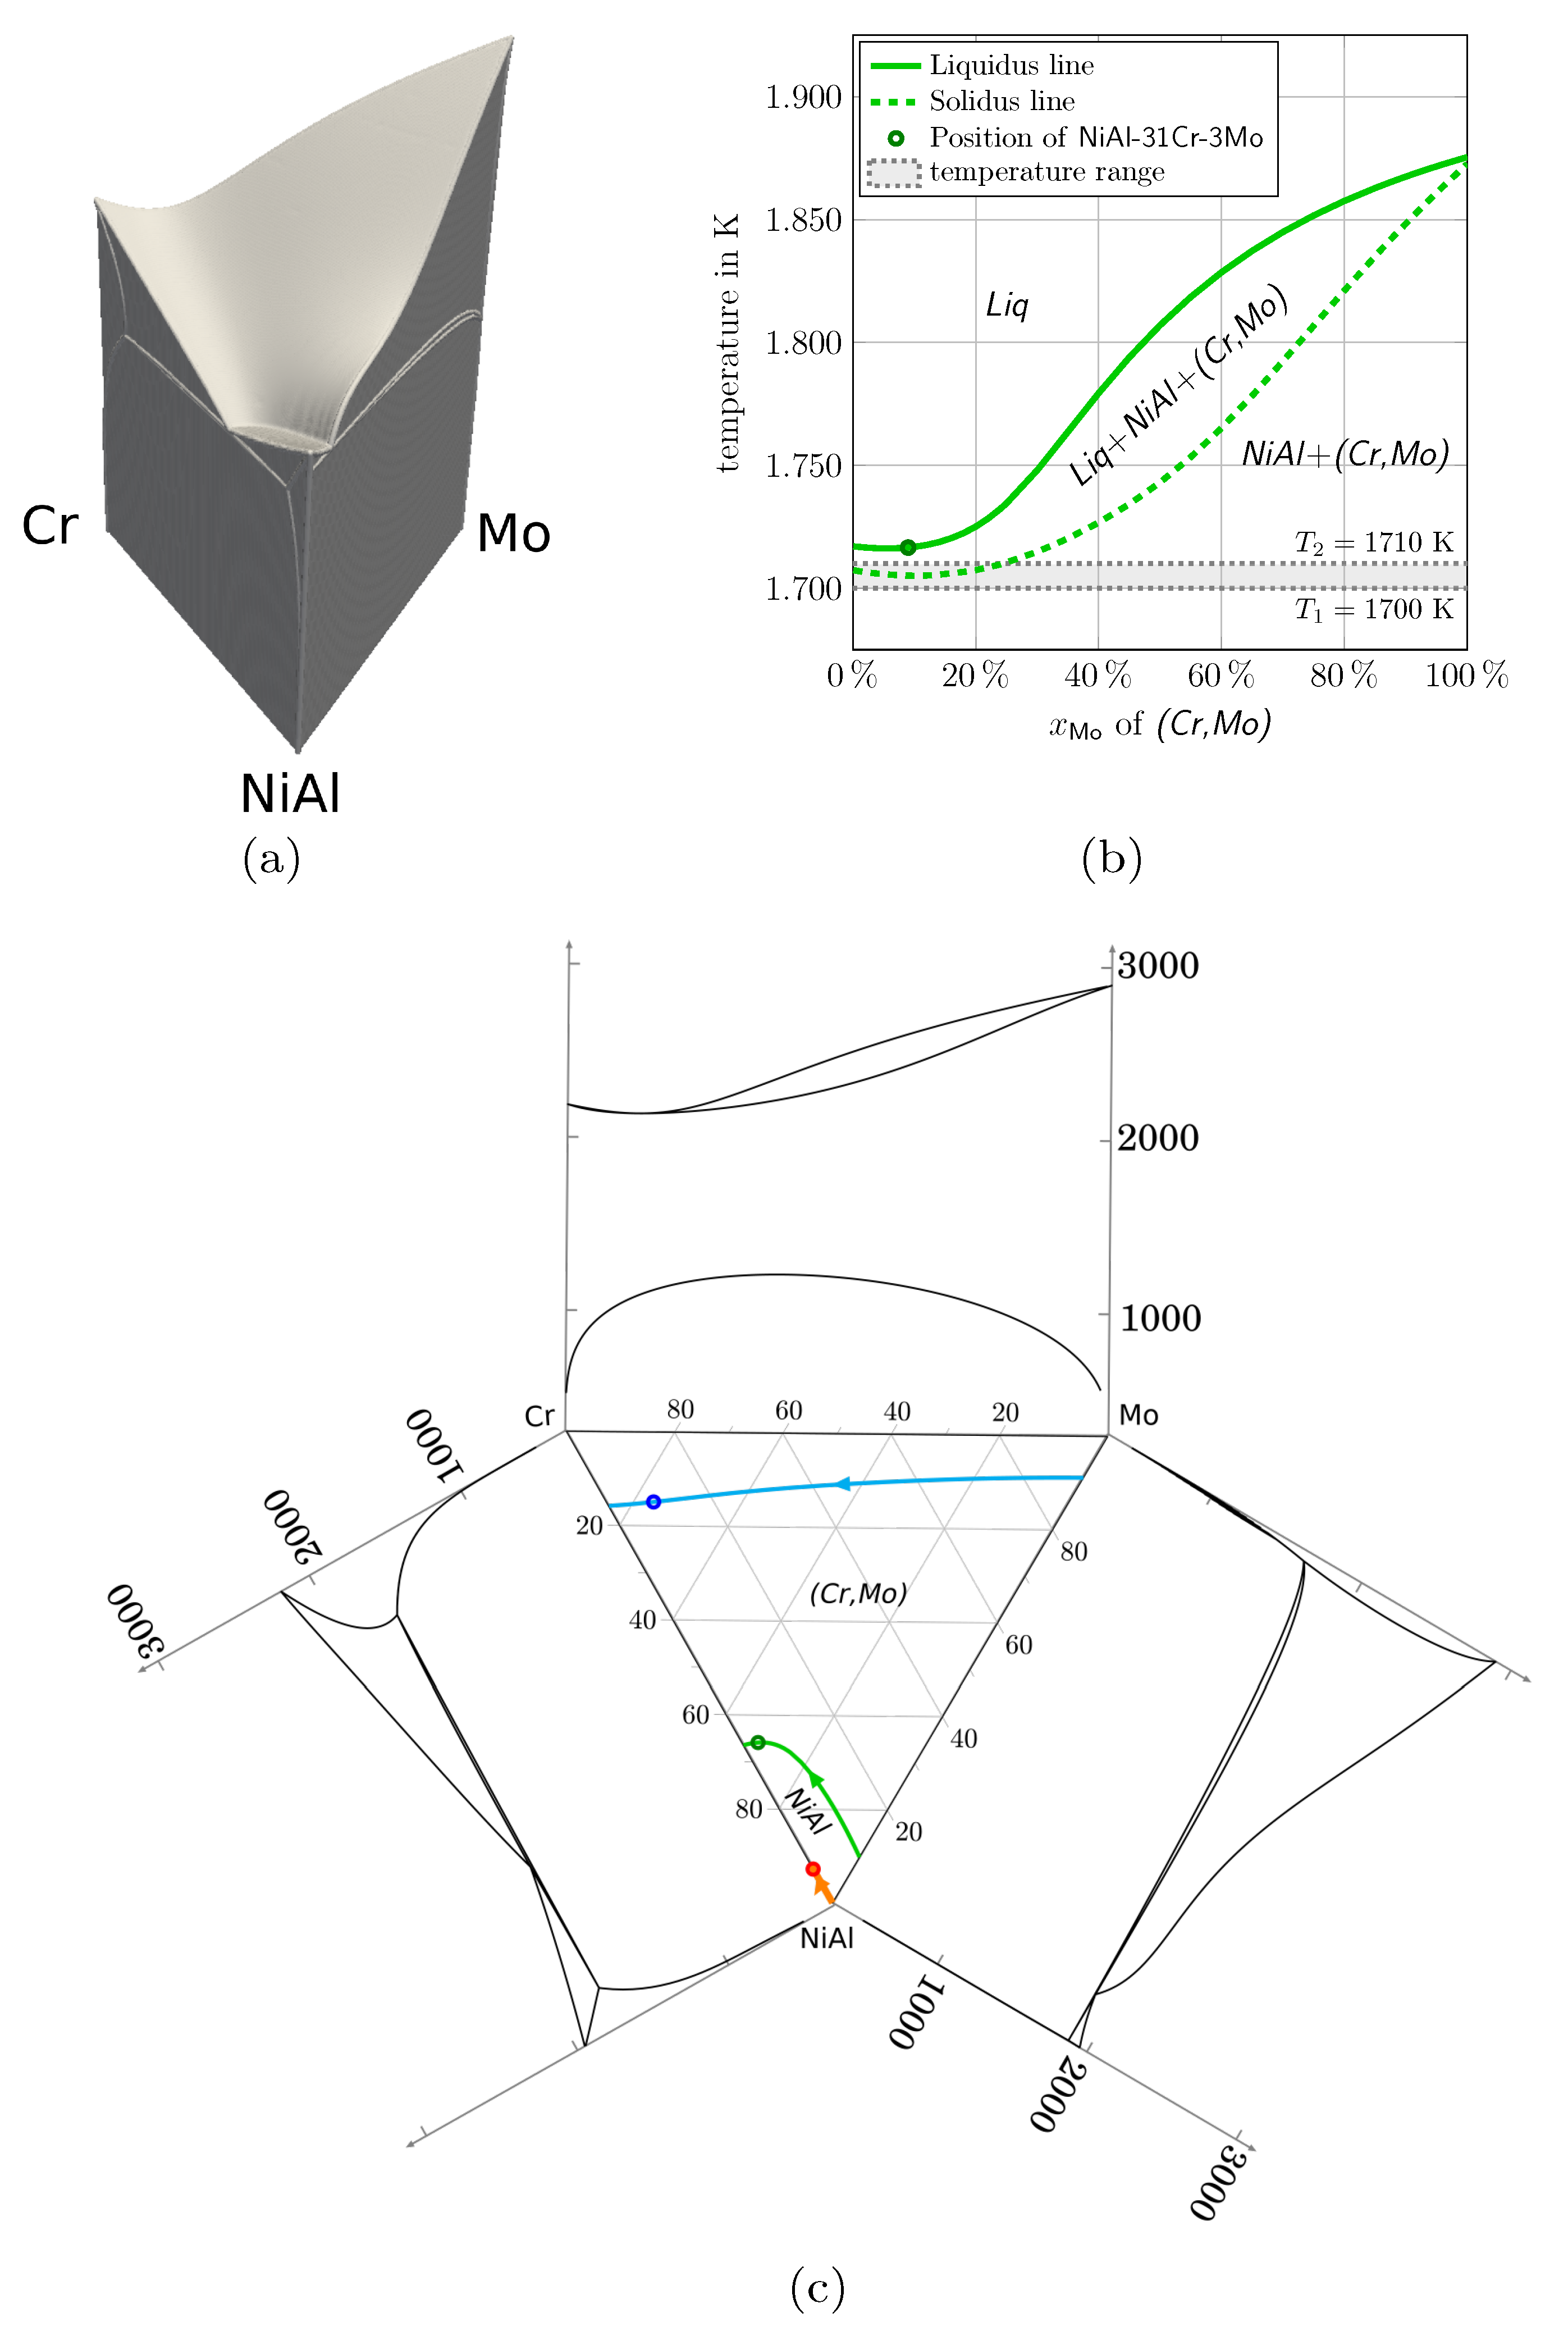
2.1. The Quaternary System NiAl-(Cr,Mo)

The intermetallic compound NiAl is of particular interest for engineering applications at elevated temperatures, such as turbine blades in jet engines or stationary gas turbines [17,18]. In addition to its high melting point ( T m = 1911 K ) and thermal conductivity ( > 70 w Km ), NiAl consists a low density (5.95 g cm 3 ) and excellent oxidation resistance. However, apart from these advantages, NiAl exhibits only low fracture toughness and ductility at room temperature as well as insufficient strength at high temperatures and poor creep resistance [19]. One possible way to overcome these disadvantages is by alloying refractory metals such as Cr, Mo, Re, V and W [20]. With this, a second reinforcing phase is introduced which leads to the formation of two-phase eutectic systems. During the directional solidification (DS) of these eutectic systems, different fibrous and lamellar structures of the reinforcing solid solution phase (disordered A2) embedded in a NiAl–matrix (ordered B2) evolve. At this point it should be mentioned, that the components, phases and systems are highlighted in the text by a serif free font. To distinguish between the compound NiAl and the phase NiAl, the phases are written in italic. The systems are indicated by a “-” between the components. The most promising high-temperature structural materials are the eutectic composites of the systems NiAl-Cr and NiAl-Mo. These systems exhibit also a greater improvement in the overall mechanical properties compared to the systems NiAl-W and NiAl-Re [21], with only small volume fractions of the reinforcing phase. Moreover, the here chosen systems reveal a better creep resistance compared to NiAl-V [22]. Due to this, several experimental studies of the directionally solidified ternary alloys NiAl-Mo [23,24,25,26,27,28] and NiAl-Cr [28,29,30,31] have been conducted in the past.
Accordingly, the two-phase alloys of the quaternary NiAl-(Cr,Mo) system are regarded as the most promising candidates for the usage in high-temperature applications since they might possess a superior mix of properties compared to the two-phase alloys of NiAl-Cr and NiAl-Mo [31,32]. Peng et al. [33] investigate the thermodynamic properties of the quaternary system and show the existence of a eutectic trough connecting the invariant reactions of the two isopleth cuts NiAl-Mo and NiAl-Cr. This trough can be seen in the three-dimensional phase-diagram of the pseudo-ternary system NiAl-Cr-Mo, see Figure 1a. The depicted phase diagram is calculated based on the Calphad database of Peng et al. [33] by treating Ni and Al as a single component NiAl. In Figure 1b, the temperature profile of the eutectic trough (solid line) is plotted over the Mo amount xMo of the reinforcing phase (Cr,Mo). Similar to the invariant reactions in the isopleth cuts NiAl-Mo and NiAl-Cr, a three-phase region Liq + NiAl + ( Cr , Mo ) exists beneath the entire eutectic trough [8,34]. The solidus line of the three-phase region is plotted in dotted lines. Figure 1c shows the eutectic trough (green line) in the liquidus projection of the pseudo-ternary system NiAl-Cr-Mo surrounded by the phase diagrams of the isopleth cuts of the systems NiAl-Cr and NiAl-Mo and of the binary system Cr-Mo. The orange and blue lines in the liquidus projection represent the equilibrium concentrations of the NiAl and the (Cr,Mo) phase calculated for concentrations along the eutectic trough and an undercooling of 2 K beneath the solidus line, respectively.
The microstructure evolution during the directional solidification reaction Lip NiAl + ( Cr , Mo ) along the eutectic trough has been experimentally investigated in [21,35]. Depending on the compositions of NiAl-xCr-yMo with x = 0 34 at.% and y = 10.3 0 at.% different arrangements of the reinforcing phase A2 (Cr,Mo) evolve embedded in the B2 NiAl–matrix. During solidification of the binary eutectic reaction of the isopleth alloy system NiAl-Cr, circular Cr–rich fibers grow in a hexagonal arrangement, embedded in a NiAl–matrix. The first transition to lamellae takes place when decreasing the Cr concentration. A lamellar structure is stable for Cr contents from 33 to 10.3 at.%. A further decrease in Cr below 10.2 at.% and a corresponding increase of Mo up to 10.3 at.% causes a morphology transition to a mixture of fibers and lamellae. A further morphology transition along the eutectic trough was found for compositions with a Cr concentration below 1.8 at.%. For these compositions Mo–rich fibers evolve embedded in the NiAl–matrix [20]. Due to the highly anisotropic interfacial energies in NiAl-10Mo, the shape of the evolved Mo–rich fibers in transverse section is rather square than circular [25]. Subsequent to DS the phases arrange with respect to growth direction and an increase in mechanical properties can be achieved [23,25]. Further experimental studies of the quaternary system NiAl-(Cr,Mo) have been conducted for example by Whittenberger et al. [36,37] and Chen et al. [38]
Additionally to these experimental investigations, numerical phase-field simulation studies for the ternary systems at their eutectic reactions NiAl-10Mo [8] and NiAl-34Cr [12,13,34,39,40] have been performed. A quantitative comparison between experimental samples and large-scale phase-field simulations of the isopleth alloy system NiAl-Cr is reported in [34] for different solidification velocities. The influence of varying solidification velocities on the adjustment process of the microstructures is investigated in [41]. For the opposing isopleth alloy system NiAl-Mo the growth of Mo–rich fibers of rectangular cross section surrounded by the NiAl–matrix phase is simulated in [8].
However, phase-field simulations of the quaternary system NiAl-(Cr,Mo) are missing in the literature. Therefore, the microstructure evolution during the directional solidification process of a defined composition at the eutectic trough will be simulated in this work. As an example composition the eutectic NiAl-31Cr-3Mo system is chosen for the conducted simulation studies. The positions of this composition and of the corresponding equilibrium concentrations of the NiAl and the (Cr,Mo) phase are additionally marked in the liquidus projection of Figure 1c by corresponding colored points. At this composition the three-phase region, depicted in Figure 1b has only a width of approximately 10 K , which is beneficial for the modeling of the material system for the subsequently planned phase-field simulations. Experimental micrographs of NiAl-31Cr-3Mo [36] show the adjustment of a lamellar microstructure, although based on [42] a fibrous microstructure is expected for the obtained reinforcing phase fraction of around 1 3 . Also first pre-studies employing phase-field simulations indicate the growth of a merely fibrous microstructure for the composition NiAl-31Cr-3Mo. Following [43,44], the growth of a lamellar microstructure could be attributed to the anisotropic properties of the surface energies. This is another point which makes the directional solidification process of NiAl-31Cr-3Mo particularly interesting for a simulation study with the phase-field method.

2.2. Phase-Field Method

For the simulations of diffusion driven phase transitions in the quaternary system Ni-Al-Cr-Mo, a thermodynamically consistent phase-field model, based on a grand potential functional and an Allen-Cahn-type variation, is used [9,45,46]. For the conditions of consideration, the system consists of three phases and four components. The N = 3 order parameters ϕ α ^ , describe the local phase fractions of the three phases participating in the eutectic reaction Liq NiAl + ( Cr , Mo ) in NiAl-31Cr-3Mo. To differentiate the phases α , β , from their indices, the indices are marked by a ^ symbol. The development of the N phase-fields ϕ α ^ are described by the time evolution equations
τ ε ϕ α ^ t = ε a ( ϕ , ϕ ) ϕ α ^ · a ( ϕ , ϕ ) ϕ α ^ 1 ε ω ( ϕ ) ϕ α ^ : = r h s 1 , α ^ ψ ( ϕ , μ , T ) ϕ α ^ : = r h s 2 , α ^ 1 N β ^ = 1 N ( r h s 1 , β ^ + r h s 2 , β ^ ) : = Λ .
To couple the different timescales of the evolution equations, the relaxation parameter τ is introduced [46] and to control the inherent width of the diffuse interface of the phase-field model, the parameter ε is used. The right hand side of Equation (1) can be divided into three parts. In the first part r h s 1 , α ^ , the shape of the diffuse interface between the phases is modeled by two superimposing interfacial energy density contributions: the gradient energy a ( ϕ , ϕ ) and the obstacle potential ω ( ϕ ) . The formulation of the gradient energy density is expressed as
a ( ϕ , ϕ ) = α ^ < β ^ γ α ^ β ^ q α ^ β ^ 2 a c ( q ˜ ) 2
where γ α ^ β ^ denotes the interfacial energy parameter and q α ^ β ^ = ϕ α ^ ϕ β ^ ϕ β ^ ϕ α ^ defines the normal vector with q ˜ = q α ^ β ^ / q α ^ β ^ as the corresponding unit vector of the interface [43]. The function a c ( q ˜ ) is describing the anisotropy in the interfacial energies between the phases. Following [43,44], an anisotropy formulation of the form:
a c ( q ˜ ) = 1 + δ α ^ β ^ q ˜ z 2 q ˜ x 2
with q ˜ i as the Cartesian component of the unit normal vector q ˜ in the direction i, is used, to model the growth of a lamellar structure within the three-dimensional microstructures. Equation (3) generates a two-fold anisotropy in the solid-solid interface normals, that are perpendicular to the growth direction y [44]. This leads to an anisotropy of strength δ α ^ β ^ in the x z plane and ± δ α ^ β ^ / 2 in the x y and y z planes [43], respectively. Using this most simple anisotropy formulation proposed in [44], the main focus of this work remains on the investigation and validation of the generated quaternary model for NiAl-31Cr-3Mo instead of an intense investigation of the anisotropic behavior in the system. For the same reason, the influence of the elastic strain energy between two phases and the influence of the growth orientations on the phase morphology will not be considered in this work.
The formulation of the obstacle potentials ω ( ϕ ) is given in [9] and includes next to the interfacial energies γ α ^ β ^ the higher order term γ α β δ . This term is introduced to reflect the correct equilibrium angle conditions at the triple junctions [9,47], by suppressing the appearance of an additional phase at the phase boundaries.
The second part of the right hand side r h s 2 , α ^ from Equation (1) is describing the driving force for the phase transitions. This force is defined by the differences of the grand potentials ψ β ^ , which are stored in the grand potential function ψ ( ϕ , μ , T ) . By using of the projection of the thermodynamic energies instead of the energies itself, the interface energies and the interface thickness are decoupled in the grand potential approach. This is an advantage compared to free energy models. To ensure the thermodynamic consistency of the modeled system, the grand potentials are derived from the Gibbs energies of the different phases [34], which are incorporated from thermodynamic Calphad databases. To optimize the computational effort, the formulations of the Gibbs energies are approximated by a parabolic approach of the form:
g α ^ ( c , T ) = i = 1 K A α ^ i ( T ) c i 2 + j = 1 K B α ^ j ( T ) c j + C α ^ ( T ) ,
with the temperature dependent coefficients A α ^ i ( T ) , B α ^ j ( T ) and C α ^ ( T ) and the bulk concentration vector c. As shown in [8], using these approximated parabolic approaches can reduce the computational effort by more than an order of magnitude compared to the original Calphad formulations.
The third part of the right hand side from Equation (1) includes the Lagrange multiplier Λ , which is introduced to fulfill the constraint α ^ = 1 N ϕ α ^ / t = 0 .
To ensure mass conservation during the simulations, the time evolution of the chemical potentials is formulated and coupled to the evolution equation of the phase fields. The chemical potential vector μ consists of a parameter μ i for each component (i = Ni, Al, Cr, Mo) and its time evolution is derived from the mass balance of the K = 4 concentrations and from Fick’s law as
μ t = α ^ = 1 N h α ^ ( ϕ ) c α ^ ( μ , T ) μ 1 ( · M ( ϕ , μ , T ) μ J a t ( ϕ , μ , T ) α ^ = 1 N c α ^ ( μ , T ) h α ^ ( ϕ ) t α ^ = 1 N h α ^ ( ϕ ) c α ^ ( μ , T ) T T t ) .
Thereby, the vectors c α ^ ( μ , T ) contain the concentrations c 1 , c 2 , , c K of the K components for the regarded phase α ^ and the mobility term M ( ϕ , μ , T ) [46] incorporates the diffusion coefficient matrix D of the involved phases. The function h α ^ is introduced in the form h α ^ =   ϕ α ^ 2 ( 3 2 ϕ α ^ ) to interpolate between the different phases and an anti-trapping current J a t [46,48,49] is applied to balance the effects of artificially enlarged interfaces from the phase-field modeling.
Due to the multiple times faster diffusion of heat compared to mass, the evolution of the temperature is described by a moving analytic approach of the form
T t = t T 0 + T ( y v T t ) = T v T .
Starting from an initially imprinted temperature field, with the base temperature T 0 , the temperature T evolves, with the gradient T and the velocity v T in the growth direction y. In 3D simulations the growth direction is changed from y to z.

2.3. Analysis Method

The subsequently performed two-dimensional simulations of the system NiAl-31Cr-3Mo are validated by investigating the relation of the undercooling Δ T , the growth velocity at the solidification front v F and the spacing λ of the evolving lamellae pairs. This relation was derived by Jackson and Hunt for binary eutectic systems in [16] and is used in several publications [50,51,52,53,54] to validate phase-field simulations. For this reason, a short summary of the foundations of this theory should be presented. A more detailed discussion of the Jackson-Hunt-relationship and its suitability for validating phase-field simulations of rod structures is given in [55].
Based on the Gibbs-Thomson equations the undercooling Δ T at the solidification front can be given as:
Δ T = Δ T con + Δ T cur + Δ T kin
with Δ T con describing the influence of the concentration, Δ T cur represents the influence of the solid-liquid interface curvatures and Δ T kin refers to kinetic effects. Following Equation (7) and the argumentation from Jackson and Hunt, the analytical relation of the undercooling Δ T , the growth front velocity v F and the lamellar spacing λ , can be formulated as:
Δ T = A λ v F + B λ + C .
The parameters A, B and C are constant but specific for each observed alloy system. The shape of Equation (8) is describing the so called Jackson-Hunt curve and the spacing related to the minimum of the curve is labeled as λ ext . This extreme position refers to the minimal undercooling at the solidification front and follows the relationship
λ ext = B A v F .
Jackson and Hunt’s theory, originally developed for binary systems, was extended by McCartney et al. [56] to three component, two-phase eutectics and by Choudhury et al. [57] to three component, three-phase eutectic growth in 2D.

2.4. Model

In this section, the modeling of the Gibbs energy formulations for the phases NiAl, (Cr,Mo) and Liq is described. The Gibbs energy formulations are derived based on the thermodynamic Calphad database of Peng et al. [33] for the full quaternary system Ni-Al-Cr-Mo and they are approximated by reproducing the workflow of the semi-automated framework from Noubary et al. [8]. Therefore, first the equilibrium concentrations of the solid phases are calculated based on the thermodynamic data [33] for temperatures of T 1 = 1700   K and T 2 = 1710   K , respectively. For the liquid, the concentration of the eutectic reaction at approximately 31 at.% Cr is used. At T 2 , the Calphad database shows a three phase domain consisting all mentioned phases beneath the eutectic reaction (see Figure 1c). As the modeling of this three-phase region would require the implementation of additional phases, it should not be depicted in the modeled system. Thus the calculations at T 2 have been made by only regarding the two solid phases. The results of the equilibrium calculations are summarized in Table 1.
The later derived Gibbs energy formulations are valid for concentrations in the vicinity of these pre-calculated equilibrium conditions. In a second step, the Gibbs energies for all three phases are calculated in a mesh in the vicinity of their equilibrium concentrations for the temperatures T 1 and T 2 . Based on these data, the formulations for the Gibbs energies are approximated for each temperature with a least squares method and second order polynomials, as introduced in Equation (4). Next, small adaptions of the parameters B α ^ j ( T ) and C α ^ ( T ) of Equation (4) are made to improve the agreement of the equilibrium concentrations. After these adjustments, the average difference between the modified formulations and the originally generated formulations is less than 0.05 %. The maximum deviation with 0.15 % is found for the phase (Cr,Mo) at a temperature of 1700 K . In a final step, the two corresponding functions are combined via a linear interpolation to generate a unique concentration and temperature dependent formulation for each phase. The resultant approximated formulations of the Gibbs energies are given in Equations (10)–(12) for the dimensionless unit J sim / cells 3 . The formulations for the quaternary alloy system NiAl-31Cr-3Mo are modeled for the full quaternary system Ni-Al-Cr-Mo and depend on the concentration vector c = ( Al C   Cr C   Mo C   Ni C ) T and the temperature T.
g ( Cr , Mo ) ( c , T ) = ( 0.619 · T + 0.837 ) · Al C 2 + ( 2.197 · T 2.345 ) · Cr C 2 + ( 2.132 · T + 5.221 ) · Mo C 2 + ( 1.984 · T + 3.429 ) · Ni C 2 + ( 1.240 · T + 0.670 ) · Al C + ( 3.954 · T + 4.561 ) · Cr C + ( 0.006 · T 0.391 ) · Mo C + ( 1.065 · T + 0.745 ) · Ni C + ( 0.461 · T 1.769 ) J sim / cells 3
g NiAl ( c , T ) = ( 2.547 · T + 4.079 ) · Al C 2 + ( 1.576 · T 1.753 ) · Cr C 2 + ( 2432.241 · T + 2645.042 ) · Mo C 2 + ( 4.176 · T + 6.216 ) · Ni C 2 + ( 2.678 · T 4.313 ) · Al C + ( 0.496 · T + 0.905 ) · Cr C + ( 0.419 · T + 0.435 ) · Mo C + ( 4.393 · T 6.518 ) · Ni C + ( 3.120 · T + 2.624 ) J sim / cells 3
g Liq ( c , T ) = ( 0.355 · T 1.400 ) · Al C 2 + ( 0.579 · T 0.728 ) · Cr C 2 + ( 2.507 · T 0.868 ) · Mo C 2 + ( 0.165 · T + 0.890 ) · Ni C 2 + ( 0.116 · T 1.069 ) · Al C + ( 0.747 · T + 1.222 ) · Cr C + ( 0.619 · T + 0.665 ) · Mo C + ( 0.151 · T 0.505 ) · Ni C + ( 1.401 · T + 0.313 ) J sim / cells 3
Within these formulations, the comparatively high values in Equation (11) for the phase NiAl are notable, which describe the quadratic dependency on Mo C . These high values are a result of the relatively small amount of Mo in the phase, which increases the complexity of the modeling. Similar to the modeling of stoichiometric phases [14,58], a strong curvature is applied to the polynomial in the direction of the Mo concentration to prevent a wide variance of Mo C . With this, the stability of the thermodynamic system is ensured.
Due to the simplifications made in the description of the thermodynamic energies, their accuracy has to be checked. Following the validation from Noubary et al. [15], the subplots in Figure 2 show the equilibrium concentrations calculated from the Calphad database (solid lines) and from the Equations (10)–(12) (symbols), respectively. For all four concentrations an excellent accordance can be found not only in the predefined temperature range between T 1 and T 2 (gray area) but also up to eutectic temperature T eut , marked with a red dotted line, and also down to 15 K below T 1 . It can be expected that also for smaller temperatures a good accordance can be achieved. However, as such low temperatures are not expected to appear within the simulations a further validation of the equilibrium concentrations is omitted. Within the investigated temperature range from 1685 K to 1716 K the average deviation between the equilibrium concentrations of the solids calculated from the derived Gibbs energy functions and the equilibria calculated from the Calphad database is ∼0.1%. The maximum deviation of ∼0.9% is found for the Mo concentration of the equilibrium concentration of NiAl at the lowest temperature of 1685 K . Despite the simplifications made in the modeling of the thermodynamic energies, this good agreement shows the suitability of the generated functions for representing the thermodynamic system and thus the applicability of the approach presented for their approximation.
For the upcoming computations within the multi-physics phase-field framework Pace3D version 2.5 [59,60], the concentration of Ni is replaced by the constraint Ni C = 1 Al C Cr C Mo C . With this, the Equations (10)–(12) can be rearranged, which leads to a reduction of the concentrations vectors c α ^ to K 1 independent entries and hence to an increase of the computational efficiency of the model. All valid system and numerical parameters are summarized in Table A1 in the Appendix A in dimensionless and physical units.

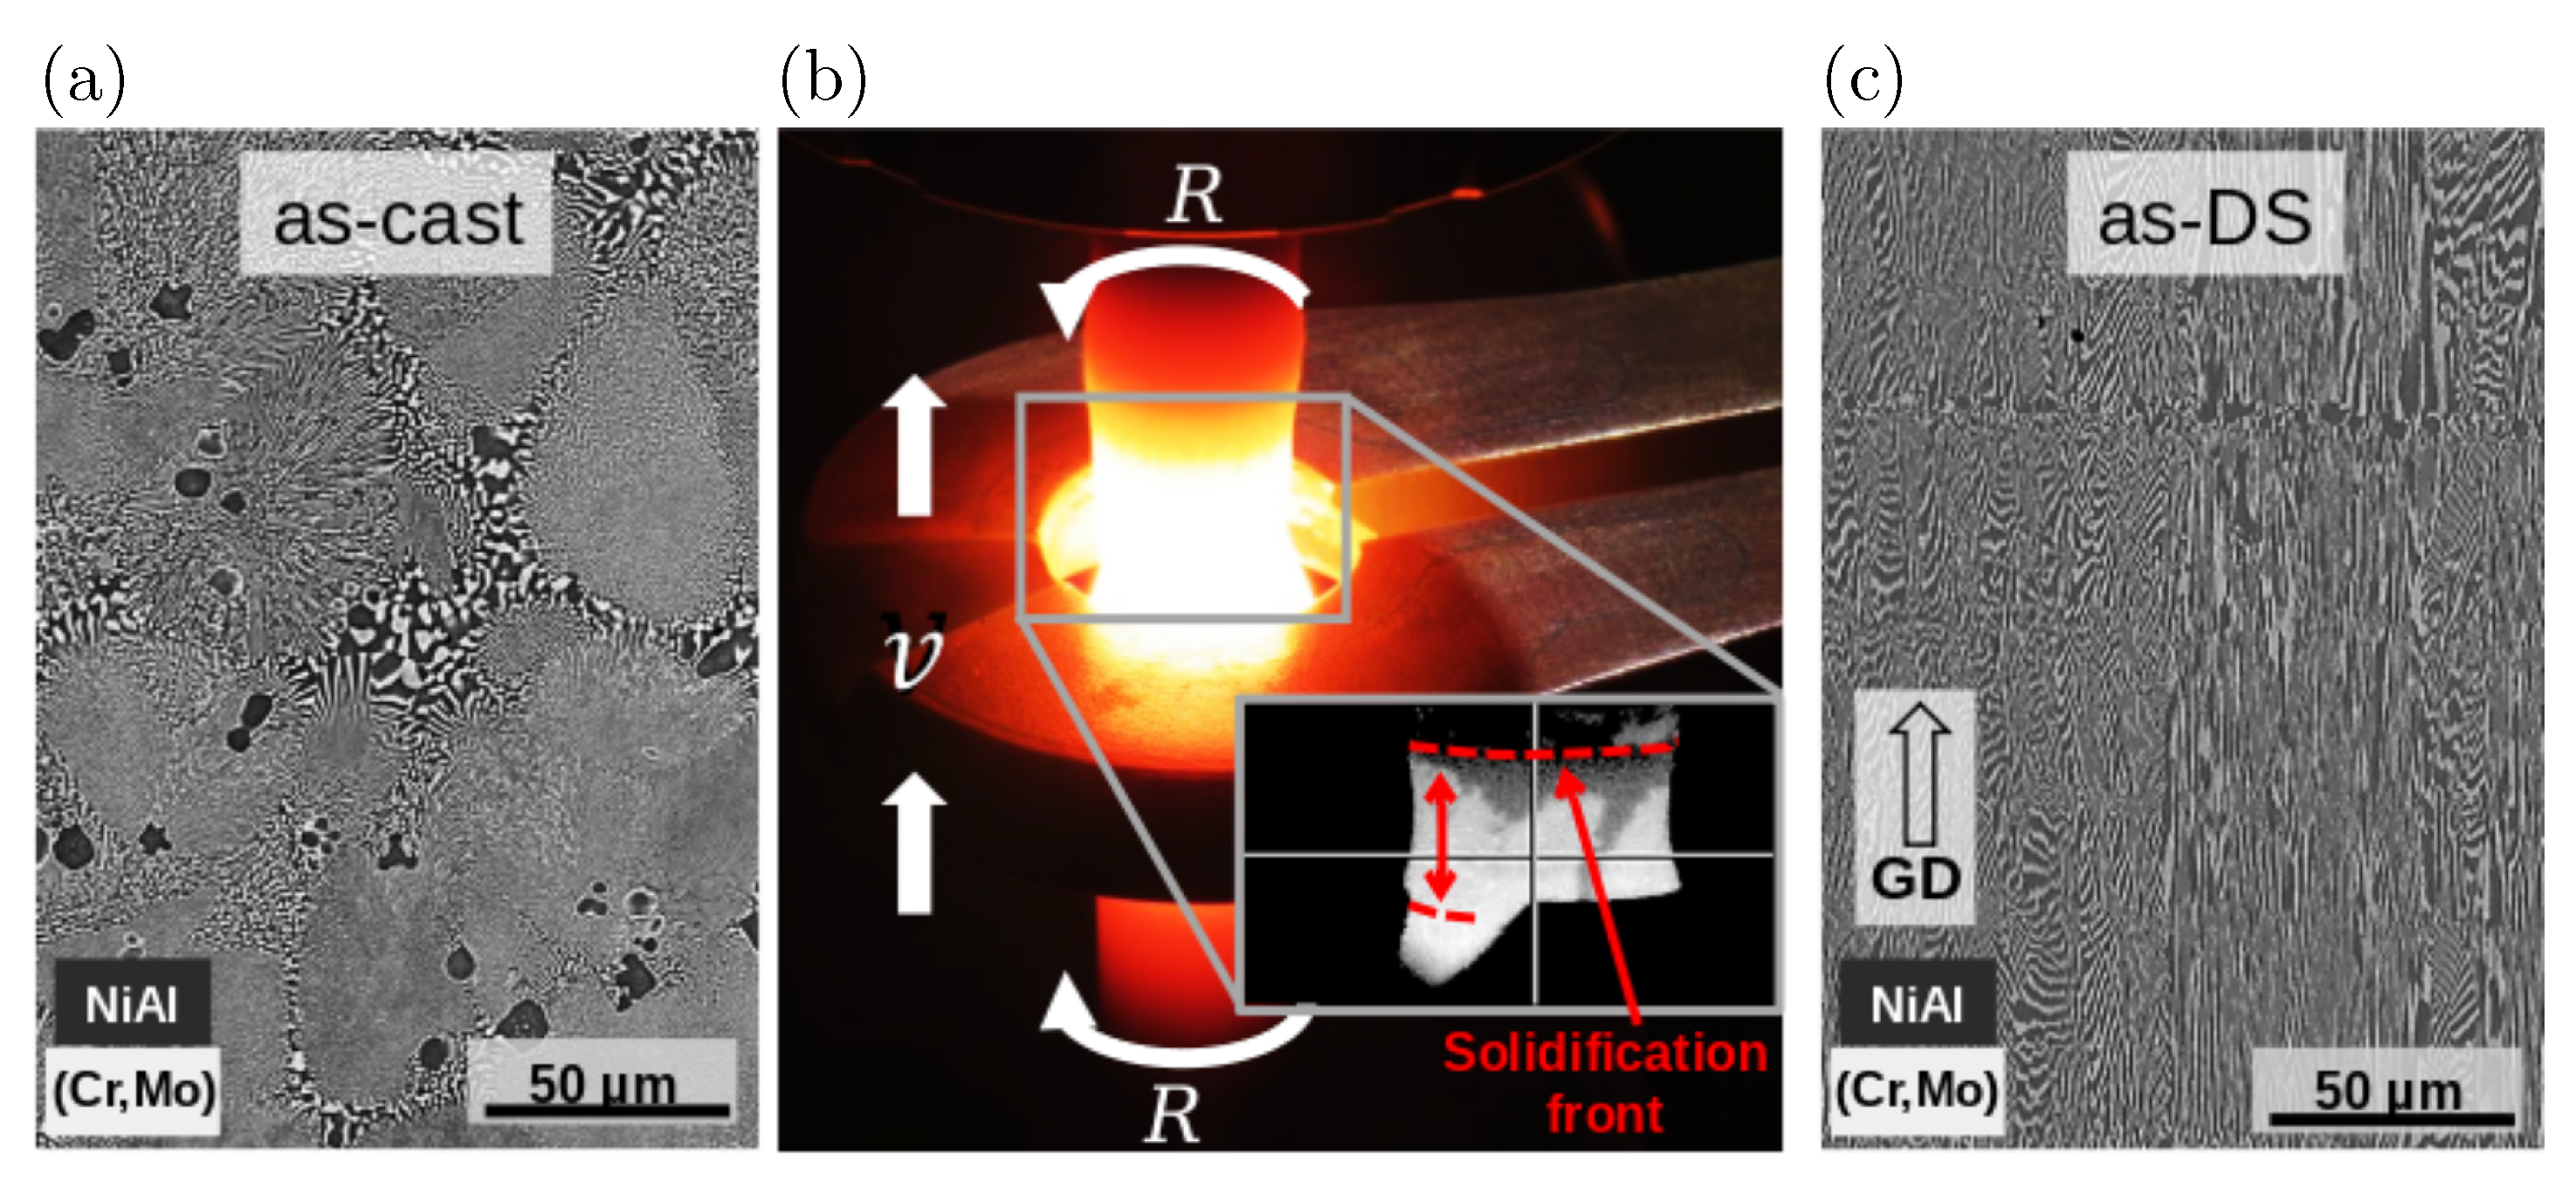
2.5. Experimental Setup

The desired eutectic composition of NiAl-31Cr-3Mo (at.%) was synthesized by using the elements Ni, Al, Cr and Mo of 99.97 , 99.9 , 99.96 and 99 % purity, respectively. The alloy was manufactured by using an arc-melting device provided by Edmund Bühler GmbH (Germany). The device chamber was evacuated multiple times and purged with Ar to ensure an oxygen-lean operation atmosphere. Furthermore, a lump of Zr metal was melted prior to the melting process, in order to remove the residual oxygen in the chamber. To achieve sufficient homogeneity, the produced buttons were flipped and re-melted at least five times. For the directional solidification the buttons were cast into a rod-shaped Cu mold. The rods were 12 mm and 170 mm in diameter and length, respectively. No specific loss of a certain element during arc-melting was noticed and an overall mass loss lower than 0.3 wt.% was measured. Therefore, the changes in alloy composition by evaporation are considered negligible. The worldwide unique crucible-free zone melting device used in this work is described elsewhere in detail [61]. The experiments were performed in an Ar atmosphere with a continuous Ar flow rate of 1.5 L min . During the DS process, the sample rotates about its axis and moves upward (lift) through the induction coil that is used to heat up and locally melt the material, as shown in Figure 3b. The rotation speed R was kept constant at 10 rpm and the process velocity v t e x t r m F varied from 42 mm h (v 42 ) to 102 mm h (v 102 ). For microstructural analysis, samples were cut by electro-discharge machining parallel and perpendicular to the growth direction (GD) and were prepared by standard metallographic procedure. Scanning electron microscopy was performed using backscattered electron imaging (SEM-BSE) on a Zeiss EVO50 microscope by Carl Zeiss AG (Germany) at 20 kV and a spot size of 500.
In order to visualize the DS process, Figure 3 shows the microstructure at room temperature before Figure 3a and subsequent to directional solidification Figure 3c. In all micrographs, dark contrast corresponds to the NiAl matrix and bright contrast to (Cr,Mo) solid solution. In the as-cast state Figure 3a, a random crystal orientation distribution of the colonies can be seen, whereas an alignment of the microstructure parallel to GD was obtained at v42 in Figure 3c. Additionally, the heating process and the formation of the liquid zone are displayed in Figure 3b.

2.6. Simulation Setup

To investigate the microstructure evolution of NiAl-31Cr-3Mo within phase-field simulations, two- and three-dimensional setups similar to [10,34,62] are used. Starting from an initial arrangement of nuclei on one side of the simulation domain, the two solid phases (Cr,Mo) and NiAl evolve, controlled by the applied temperature gradient (Equation (6)) in y-direction (z-direction in 3D) and by the imposed pulling velocity v F , into a liquid. For the realization of a constant flux of the melt into the domain a Dirichlet boundary condition is applied at this liquid end of the domain. At the opposite solid end a Neumann boundary condition is used. Finally, an infinite domain, perpendicular to the solidification front, is modeled by periodic boundary conditions.
To validate the generated thermodynamic model for NiAl-31Cr-3Mo, 2D Jackson-Hunt studies are conducted with the velocities 42 mm h (v 42 ) to 102 mm h (v 102 ). For this, an initial setup with one lamellae pair of the solid phases is set at the bottom of the domain ( y 20 voxel cells). While all 2D simulations have a height of 300 voxel cells ( 6 μ m) in y-direction, the width of the domains in x-direction is varied from 28 up to 84 voxel cells, which corresponds to a physical domain width of 840 up to 2520 nm.
For the subsequently performed 3D large-scale phase-field simulations, similar to [9,10,41], an initial random Voronoi tessellation with λ λ ext is used for the initial setup of the solid phases. To ensure a microstructure growth unaffected from the boundary conditions [2], the 3D simulations are conducted in a domain with a base size perpendicular to the growth direction z of 400 × 400 voxel cells (8 μ m × 8 μ m) and a height of also 300 voxel cells ( 6 μ m). Exemplary illustrations of the 2D and 3D simulation setups are given in [63] and [34], respectively.
The 2D simulations are running for 5 million time steps on 3 cores on a local computer in the institutes network and the large-scale 3D simulations are performed for 8.5 million time steps on 768 cores on the SuperMUC-NG system at LRZ Munich [64]. Compared to the experiments, a three times larger thermal gradient T of 60 k mm is used for all simulations. Following the theory of Jackson and Hunt [16], the evolving lamellar spacing and the undercooling at the solidification front are not affected by the thermal gradient T . However, with increasing amount of the thermal gradient the required time steps to reach a convergence of the microstructure in the simulations can be reduced [41].

3. Results and Discussion

In the first part of this section, the results of the two-dimensional phase-field simulations are discussed. Starting from an initial setting of one lamellar pair of solid phases, the phases NiAl and (Cr,Mo) evolve depending on the investigated domain width. If the considered domain width is too large, the widths of the single lamellae start to vary periodically along the growth direction. Since no nucleation mechanism [63] is used in the simulations, the microstructure is not able to refine and hence, the oscillation can lead to an overgrowth of one of the solid phases. If the domain width is too small, a similar elimination of one lamella can occur. This leads to a stable range of the domain width from 48 to 76 cells or 960 to 1520 nm for the growth velocity v42 and from 32 to 60 cells or 640 to 1200 nm for the velocity v102. In these ranges, still an oscillation of the lamellar width can occur, but with ongoing simulation time a stable growth of one lamellae pair is achieved. During these oscillations the lamellar widths adjust leading in the final microstructure to a volume fraction of the (Cr,Mo)-lamellae of 32.5 vol.% for v42 and 32.9 vol.% for v102.
To compute the undercoolings of these stable simulations, first the growth heights of the solidification front is measured by detecting the solid-liquid-interface position in y-direction after 5 million time steps for each simulation. Depending on these positions y, the temperature at the solidification front is calculated by using Equation (6) and hence the undercooling at this position is determined. The results of these calculations are shown in the plots of the undercooling-spacing relationship in Figure 4 for the growth velocities v42 and v102, respectively. In these studies, the spacing of the simulated lamellar structures is similar to the conducted domain widths of the simulations. Both plots show the expected curve of the undercooling with a minima λ ext at 1.09 μ m for and 0.8 μ m for v102, respectively.
For further studies and the correlation with experimental results, three-dimensional phase-field simulations are performed. The resulting microstructure after 8.5 million time steps for the growth velocity v102 is displayed in Figure 5a. The microstructure contains blue (Cr,Mo)–lamellae within an orange NiAl–matrix. Both phases are individually illustrated in the sub-figures Figure 5b,c, respectively. The sub-figures on the right side of Figure 5 visualize the solidification front of the evolved microstructures after 2.5 , 5.5 and 8.5 million time steps. Starting from a mixed structure of mainly fibers and short lamellae at 2.5 million time steps in Figure 5d, a lamellar structure with single isolated fibers has evolved after 5.5 million time steps in Figure 5e. In the last 3 million time steps, this lamellar structure is established by the consolidation of longer lamellae. The final microstructure in Figure 5f shows a well-aligned mainly lamellar structure. By continuing the simulation, it can be assumed, that the remaining elongated fibers in the upper left corner of the microstructures will also connect to a further lamella.
The formation of lamellae within the simulation is mainly driven by merging events of the (Cr,Mo)–phase. Only occasionally splitting events and no overgrowth or nucleation events are detected in the microstructure. These observations are in accordance to [41], where the growth of lamellae during the deceleration of a two-phase eutectic microstructure is also driven my merging events.
The microstructure after 8.5 million time steps exhibits an average lamellar spacing of ∼1018 nm for the growth velocity v102. For the growth velocity v42 an average lamellar spacing of ∼1353 nm is measured. To determine these spacings, eight cuts with a distance of fifty cells are made through the 3D simulation domains perpendicular to the aligned lamellae. Based on these cuts, the widths w of the NiAl– and (Cr,Mo)–sections are measured and their maximum, minimum and average values are stored. The sum of the widths w NiAl and w ( Cr , Mo ) being the lamellar spacing λ . The determined lamellar spacings of the 3D simulations are approximately 25% larger compared to the detected values λ ext at minimal undercooling conditions of the 2D simulations. These deviations are in accordance with three-dimensional phase-field simulations of the ternary system Ni-Al-Cr [34,63].
The subsequently calculated undercoolings at the solidification front for the 3D simulations are added to the plots of the undercooling-spacing relationship for the two-dimensional simulations in Figure 4 with a single mark at the average lamellar spacing of the corresponding simulation. Even if the plot in Figure 4a for the growth velocity v42 shows a visually large deviation between the single measured undercooling value of the 3D simulation and the undercooling curve of the 2D simulations, a qualitative comparison sheds light on the fact that the actual deviation is less than 0.09 %. For the growth velocity v102 the deviation is only ∼0.01%.
The solidification front microstructures after 8.5 million time steps for both velocities are presented in Figure 6 accompanied by their corresponding experimental micrographs. After this calculation time, the phase components of the microstructures have adjusted with a maximum change of less than 1% within the last one million time steps and the growth velocities as well as undercoolings have adjusted. A visual comparison of the simulation results and the experimental micrographs at the same magnification illustrates an overall agreement between the microstructures. In both structures the growth of (Cr,Mo)–lamellae embedded in a NiAl–matrix is observed.
However, while the evolved lamellae in the simulated microstructures are all aligned and grow parallel to each other, the experiments perform a variety in growth and in direction of the lamellae, due to anisotropy and coupled growth of interfacial orientational variants. To further validate the agreement between the simulated and experimentally achieved microstructures, significant features like the lamellar spacing λ and the widths w of both phases are measured. For the experiments, the lamellar spacing and the respective phase widths were determined using ImageJ software. The lamellar spacing here corresponds to the distance between centers of (Cr,Mo)–lamellae. The averaged results of both measurement are summarized in Table 2.
While the measured lamellar spacings for the growth velocity v102 are in good agreement with a deviation of approximately 2 % , for v42 a deviation of approximately 9 % is noticed. A reason for this deviation can be found in the limited number of the evolving lamellae in the simulation. Evaluating the average number of lamellae pairs within the simulation domain, results in 5.9 lamellae pairs for the simulation and 6.4 for a corresponding experimental domain. Hence, this lead to the conclusion that the spacings just deviate by a half lamellae pair. As discussed in [63] for the growth of two-dimensional lamellar growth, several stable settings with different numbers of lamellae pairs can occur in the same simulation domain, if the domain is larger than three times λ ext . A tendency to larger structures with fewer pairs of lamellae was additionally reported in [63], which also explains the larger spacings in 3D simulations compared to the detected values λ ext from 2D simulations. As the three-dimensional microstructures already adjust to a stable configuration, the evolution of an additional lamellae pair is not expected in the simulations until the microstructure is forced to rearrange by a disturbance, for example by a variation of the growth velocity [41]. However, a comparison of the extreme points λ ext from the two-dimensional studies of the undercooling-spacing relationship exhibits that the growth of an additional pair of lamellae in the 3D simulations still leads to a stable microstructure. Due to the periodic boundary conditions in the simulation domain, only an integer number of lamellae pairs can occur. To establish a better comparison to the experimental results, an increase of the simulation domain is necessary. For the sake of integrity, the measured lamellar spacings from the experiments are also added to the plots in Figure 4. As the exact undercooling at the solidification front is not known for the experiments, their lamellar spacings are labeled with a dotted and dashed line, respectively. For these data points also a good accordance with extreme points λ ext is documented. By considering the evolved widths w of the phases, the largest deviation of ∼14% is found for the NiAl–matrix and the velocity v102. For the velocity v42, the deviations for the matrix are only 3 % . The average measured values for the widths of the (Cr,Mo)–lamellae are in good agreement, especially by considering the measurement scattering in the experiments.
Both, experiments and simulations show a slight increase in the volume fractions of the (Cr,Mo)–lamellae with increasing velocities. The volume fractions of approximately 33 vol.% for the (Cr,Mo)–lamellae in the 3D simulations are in accordance with the results of the previously discussed 2D simulations. However, the simulated volume fractions are nine to ten percent smaller compared to the experiments. This deviation in the volume fractions can be ascribed to the used thermodynamic Calphad database [33], since remarks in [35] state that an adjustment of the solute partitioning is needed in this database. The theoretical value of the volume fraction calculated from [33] is 34.5 vol.%. As the simulations are modeled based on the thermodynamic data, smaller volume fractions compared to the experiments are expected. The deviation of the simulated volume fractions from the thermodynamic value is between four and fife percent depending on the applied growth velocity, which is in the expected range of accuracy.

4. Conclusions

In this work, an extended phase-field approach for the simulation of microstructures in quaternary material systems based on a grand potential functional formulation is introduced. The Gibbs energy functions of the example system NiAl-31Cr-3Mo are modeled on the basis of thermodynamic Calphad databases and the equilibrium conditions of the system. Subsequently, the directional solidification process for this material system is simulated in 2D and 3D with two different velocities using the multi-physics phase-field framework Pace3D. The 2D simulations are analyzed by deriving their undercooling-spacing relationships and the 3D simulations are validated by comparison of the resulting microstructures with corresponding experimental micrographs. Based in these comparisons, the following observation are made:
(i)
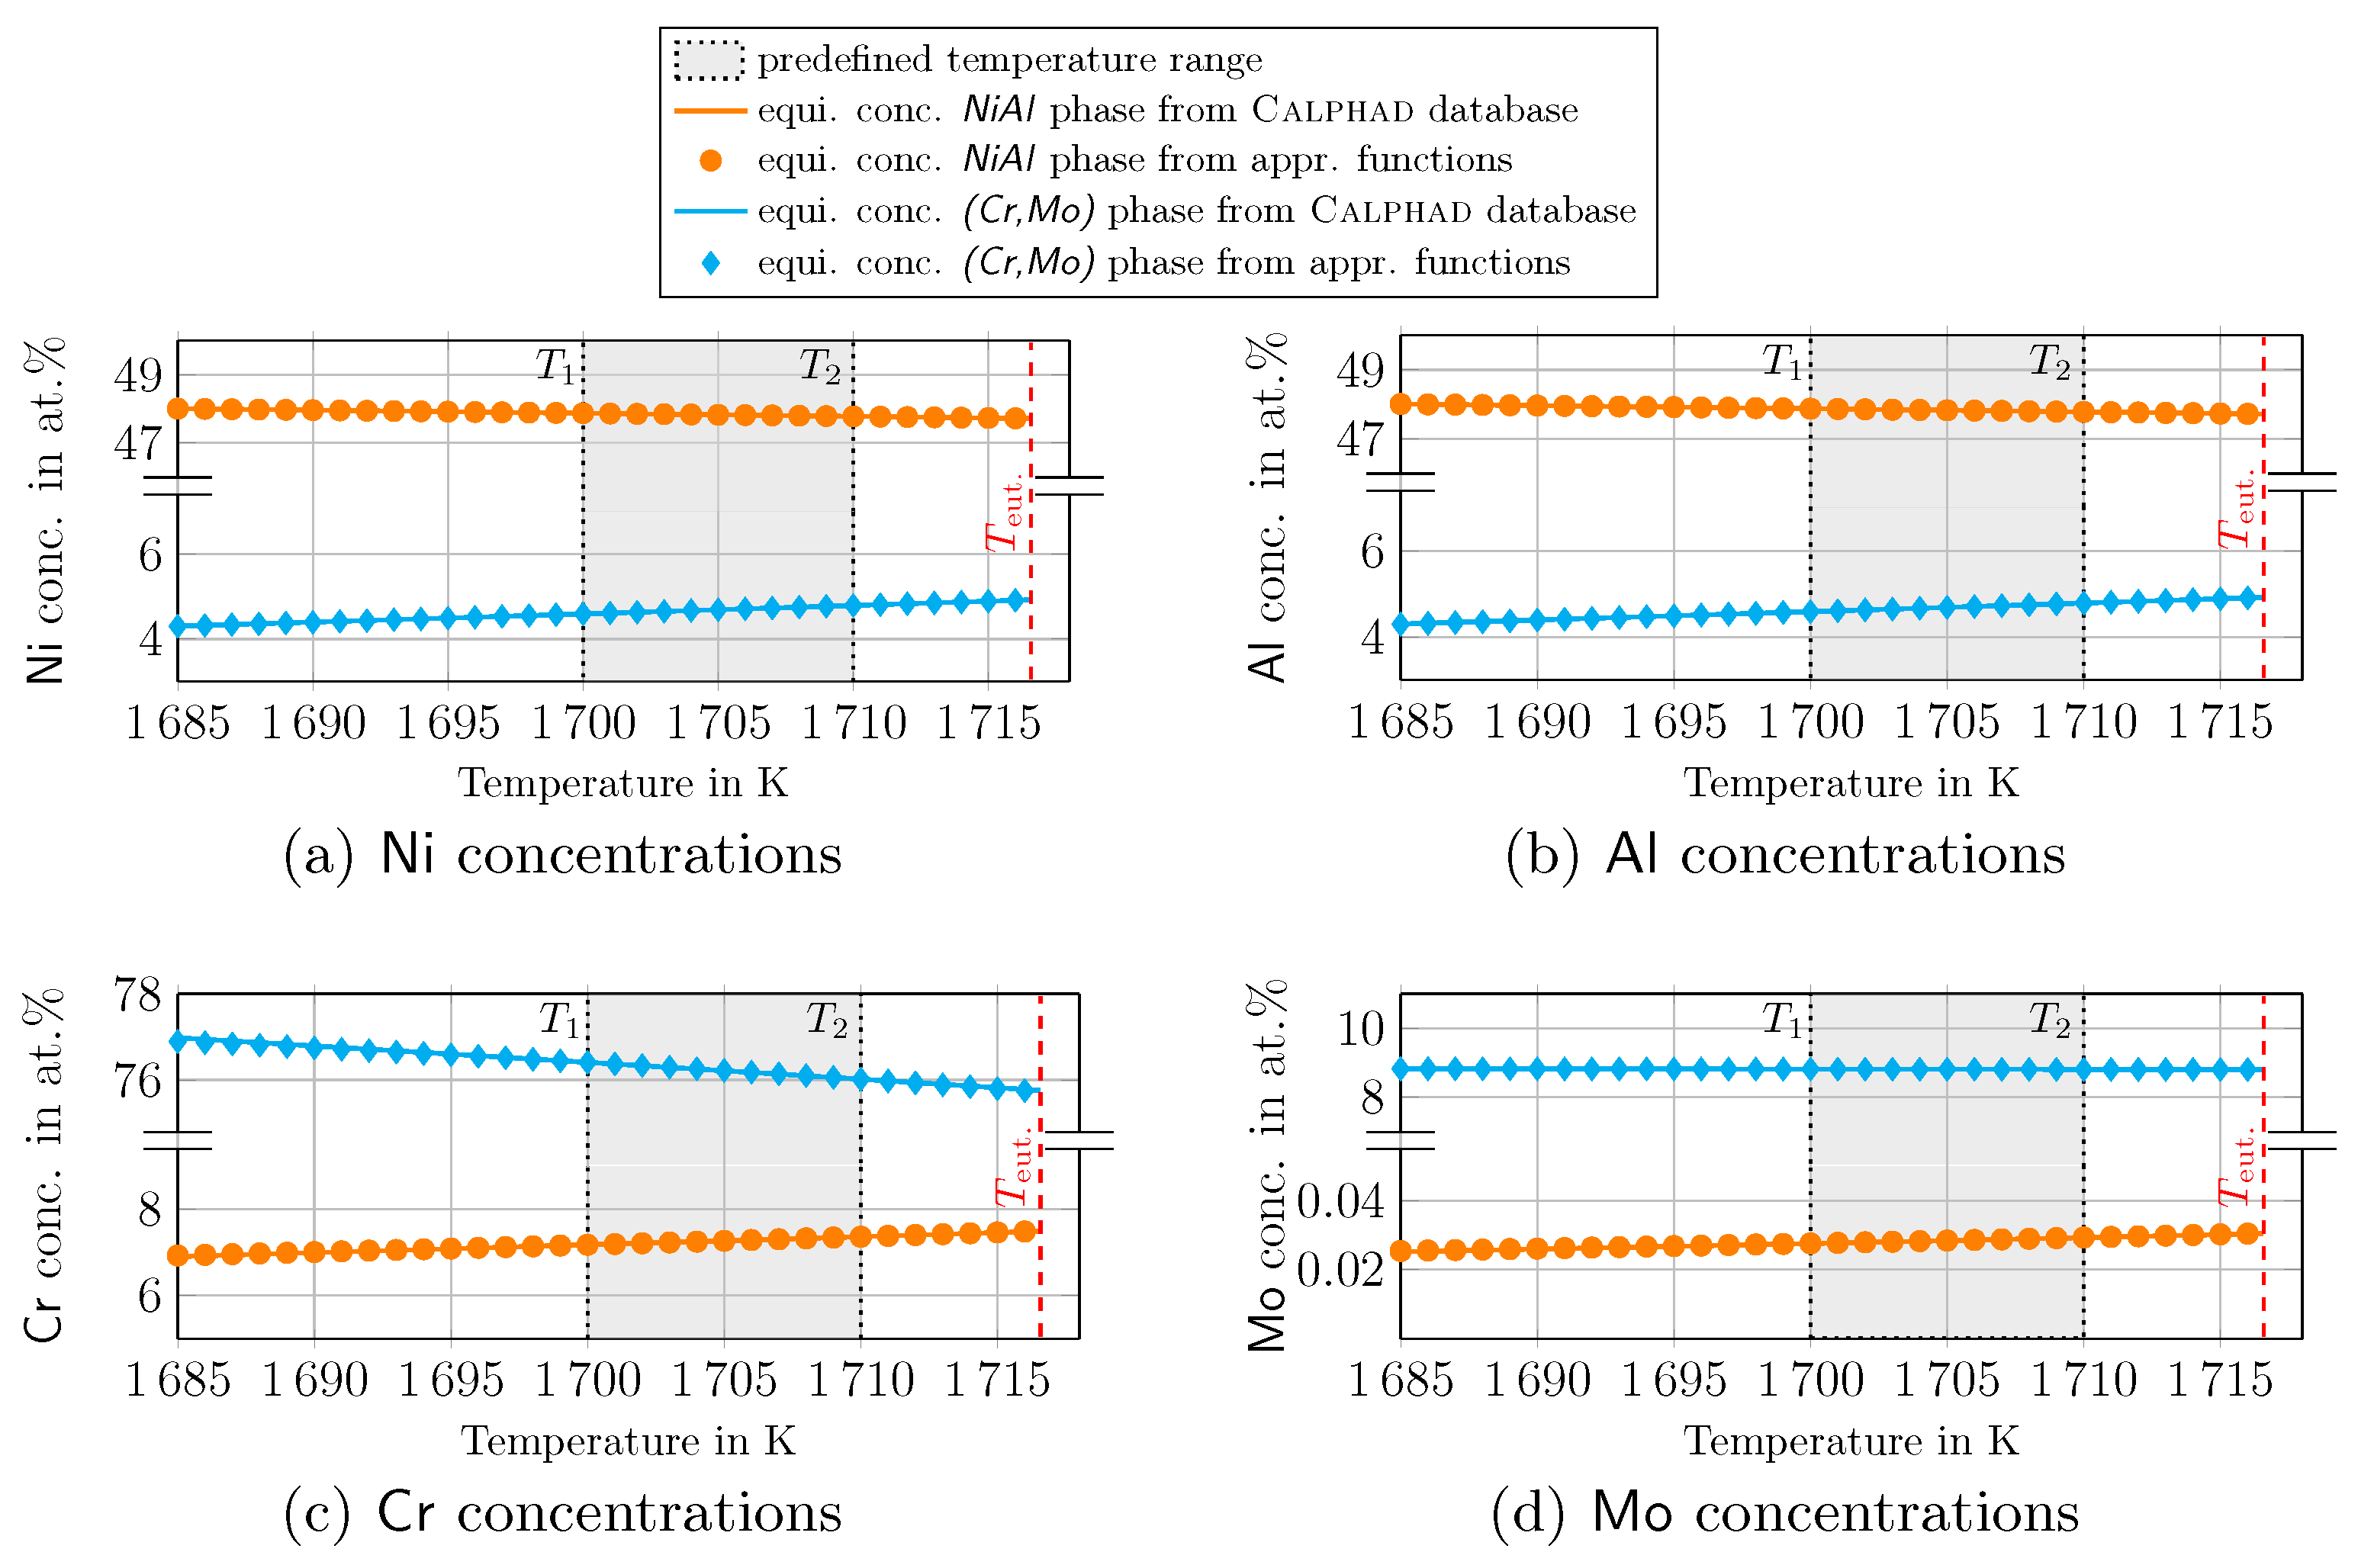
The generated Gibbs energy functions for the modeling of the quaternary system NiAl-31Cr-3Mo show an excellent behavior in reproducing the equilibrium concentrations of the solids, given in the thermodynamic Calphad database. Within the defined temperature range for the modeling, the deviation between the Calphad data and the rebuilt equilibrium concentrations is ∼0.1%. Also for temperatures up to eutectic temperature T eut . and down to 15 K below predefined temperature range a very good accordance with a maximum deviation of ∼0.9% is detected.
(ii)
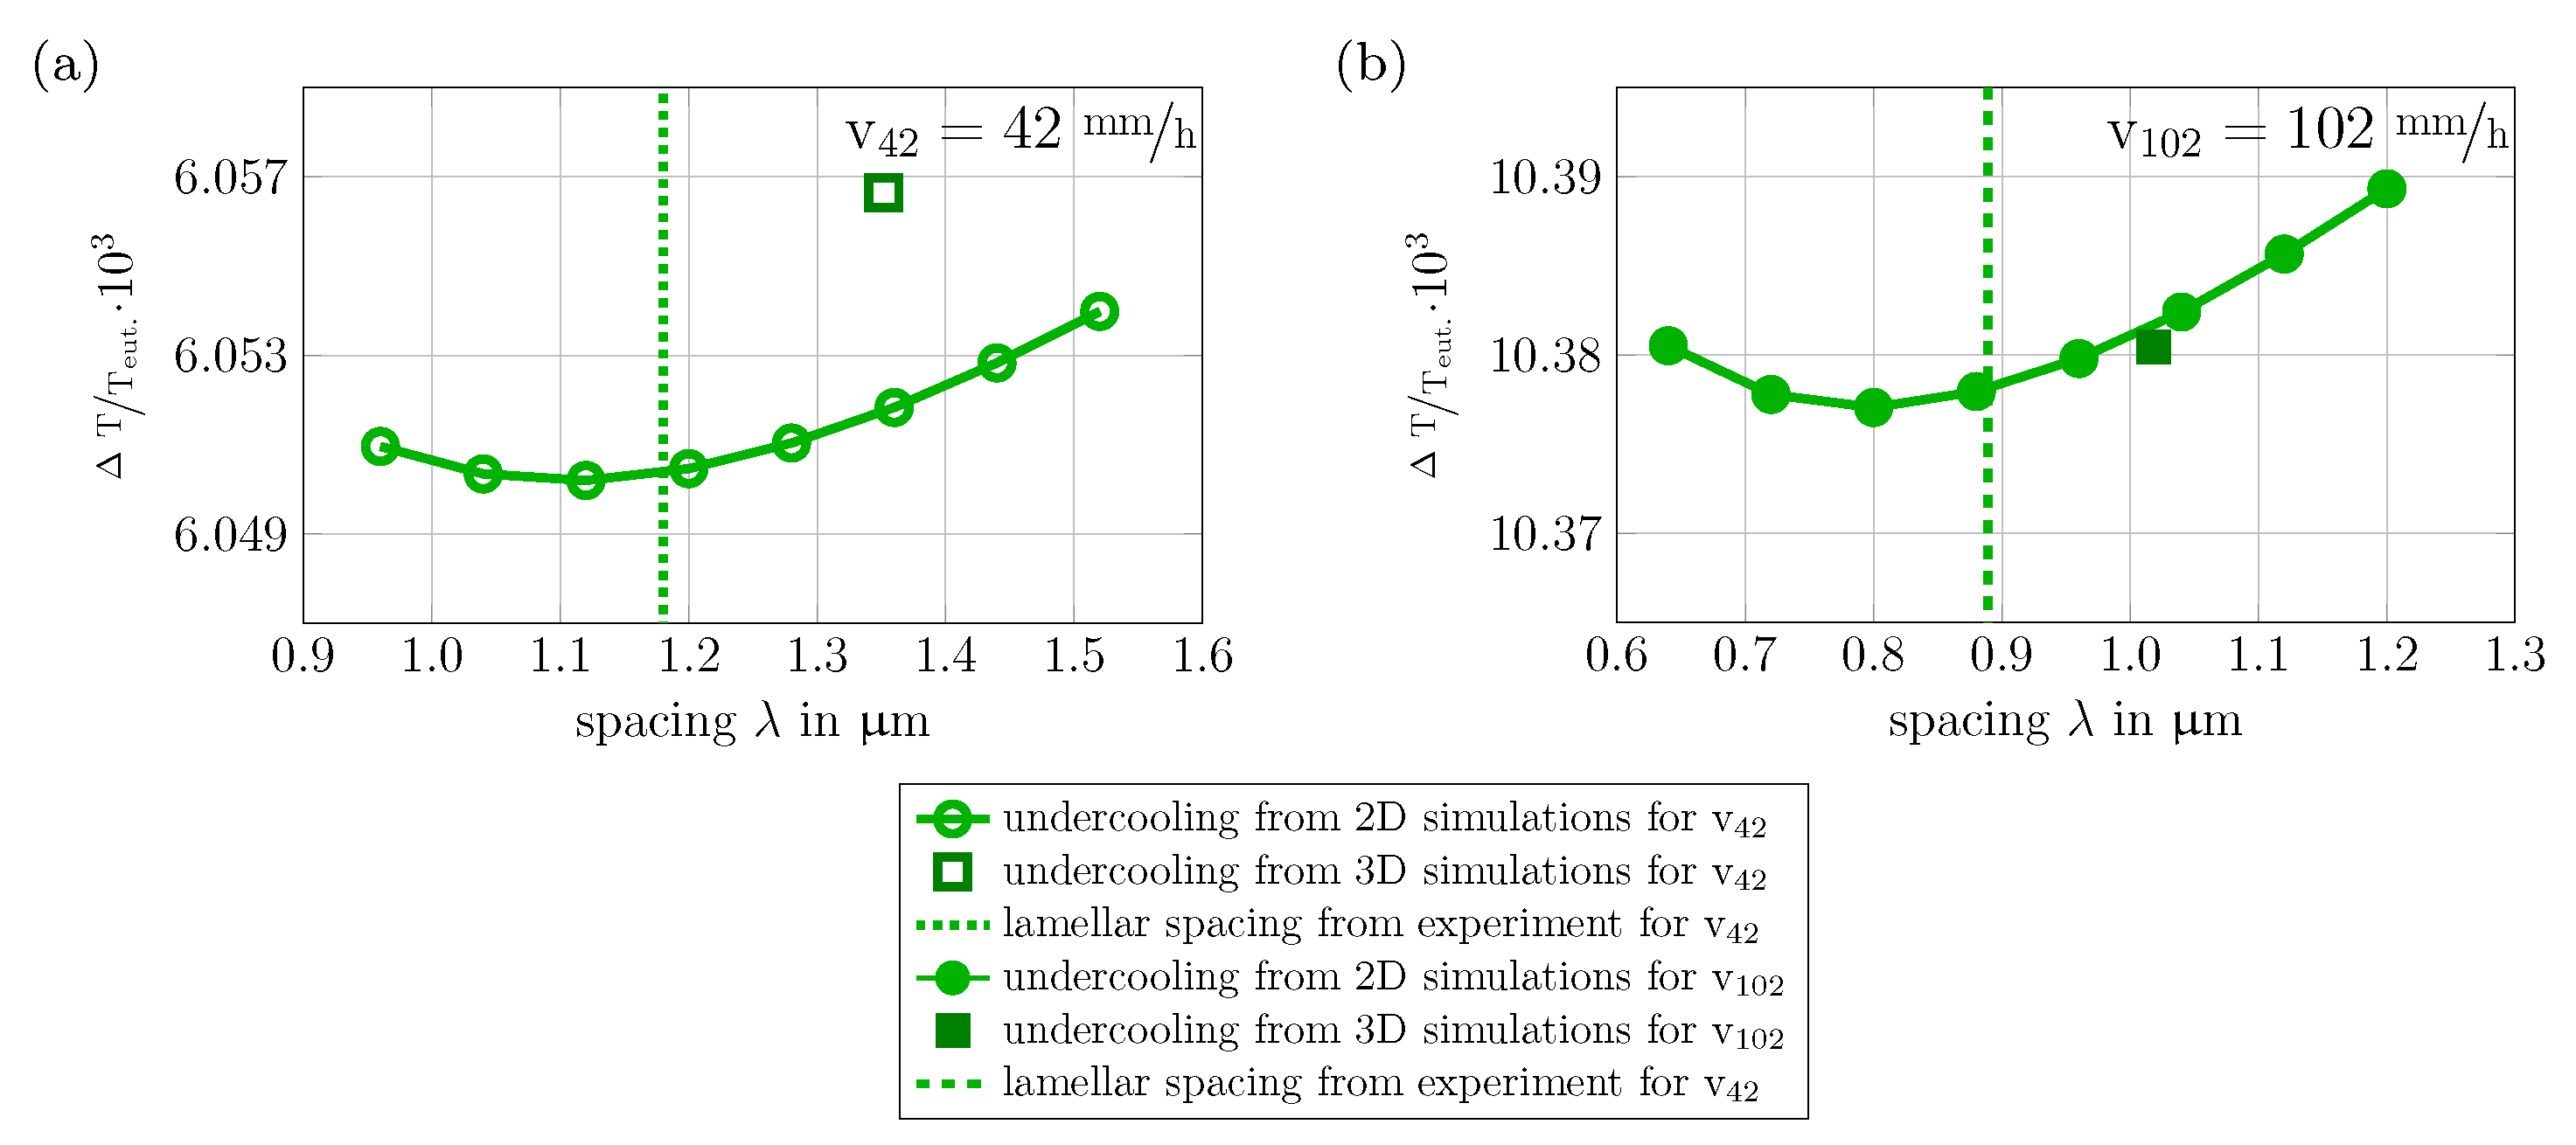
The undercooling-spacing relationships of the two-dimensional phase-field simulations follow the expected curve for temperature dependent solidification described in the theory of Jackson and Hunt. For both velocities a defined minimum λ ext is found.
(iii)
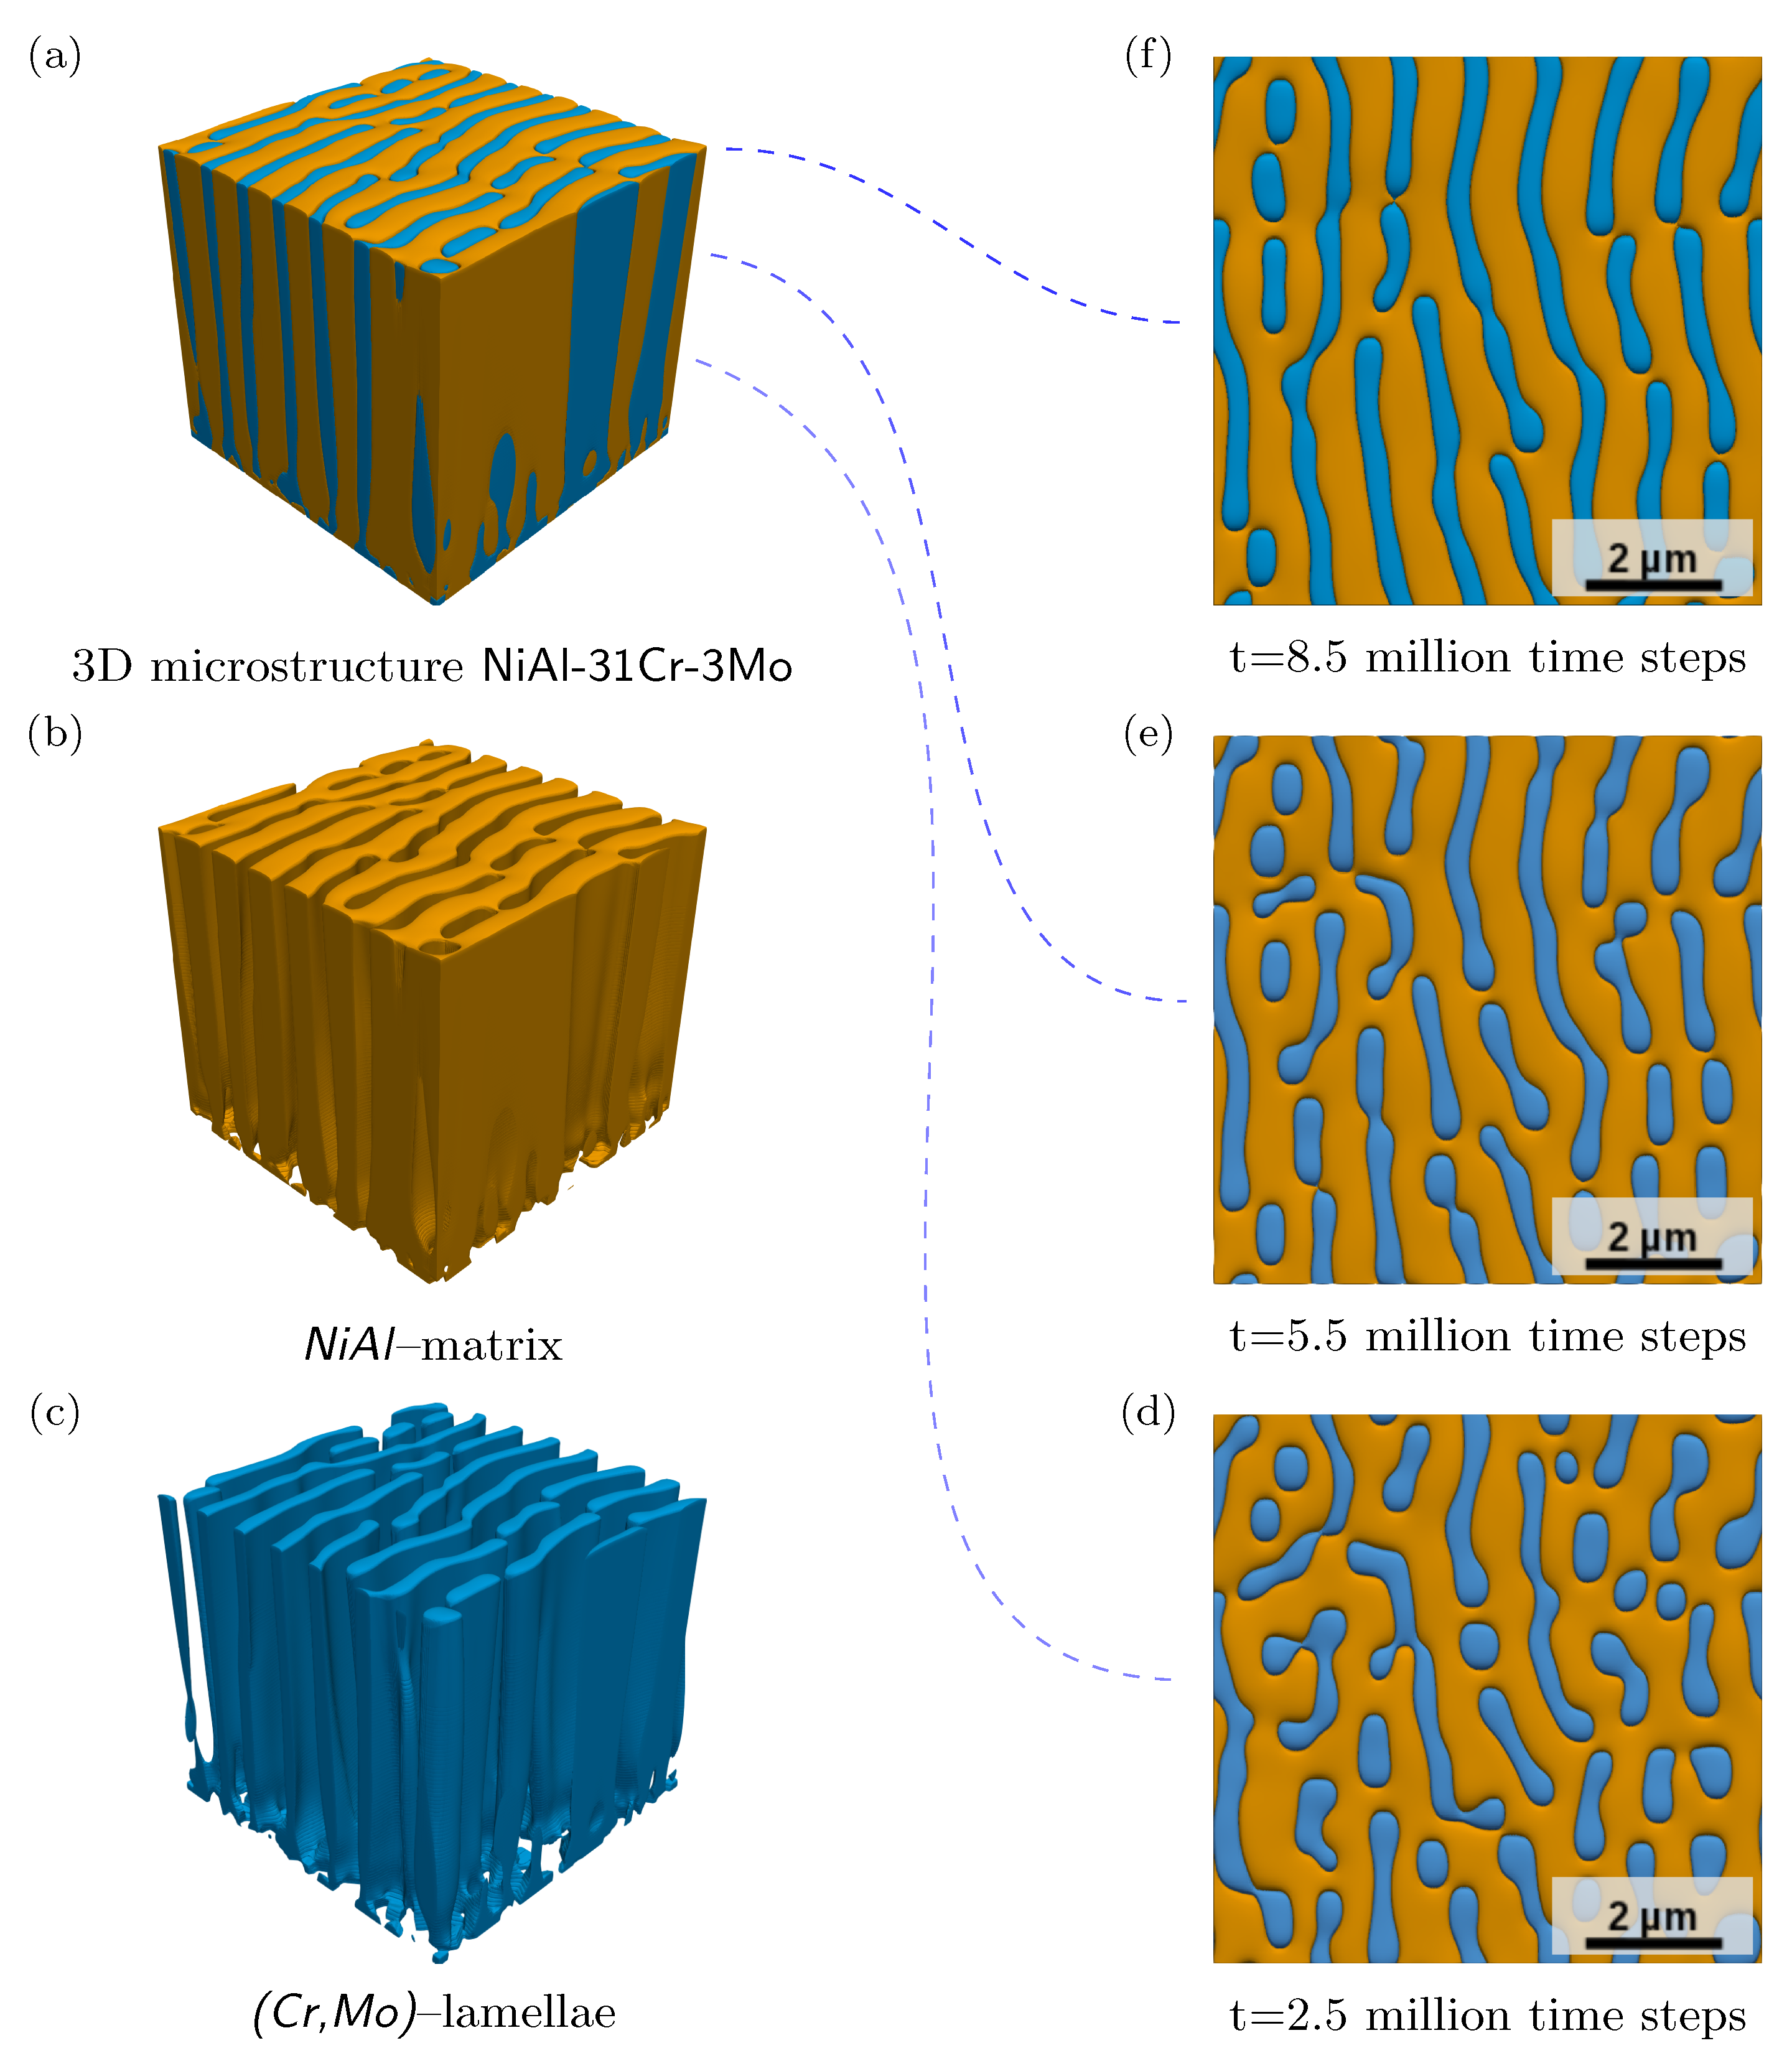
The establishment of a lamellar microstructure in 3D can be ascribed to the used two-fold anisotropy formulation, as simulations without anisotropy lead to the growth of a merely fibrous structure. Although this anisotropy formulation is not motivated based on the investigated material system, the results demonstrate the capability of the approach to validate the derived model of NiAl-31Cr-3Mo to describe the microstructure evolution during directional solidification. To increase the variety within the microstructure with the formation of eutectic two-phase cell boundaries, a more general interfacial anisotropy formulation can be used including crystallographic orientations in 3D to enable the description of eutectic colony boundaries.
(iv)
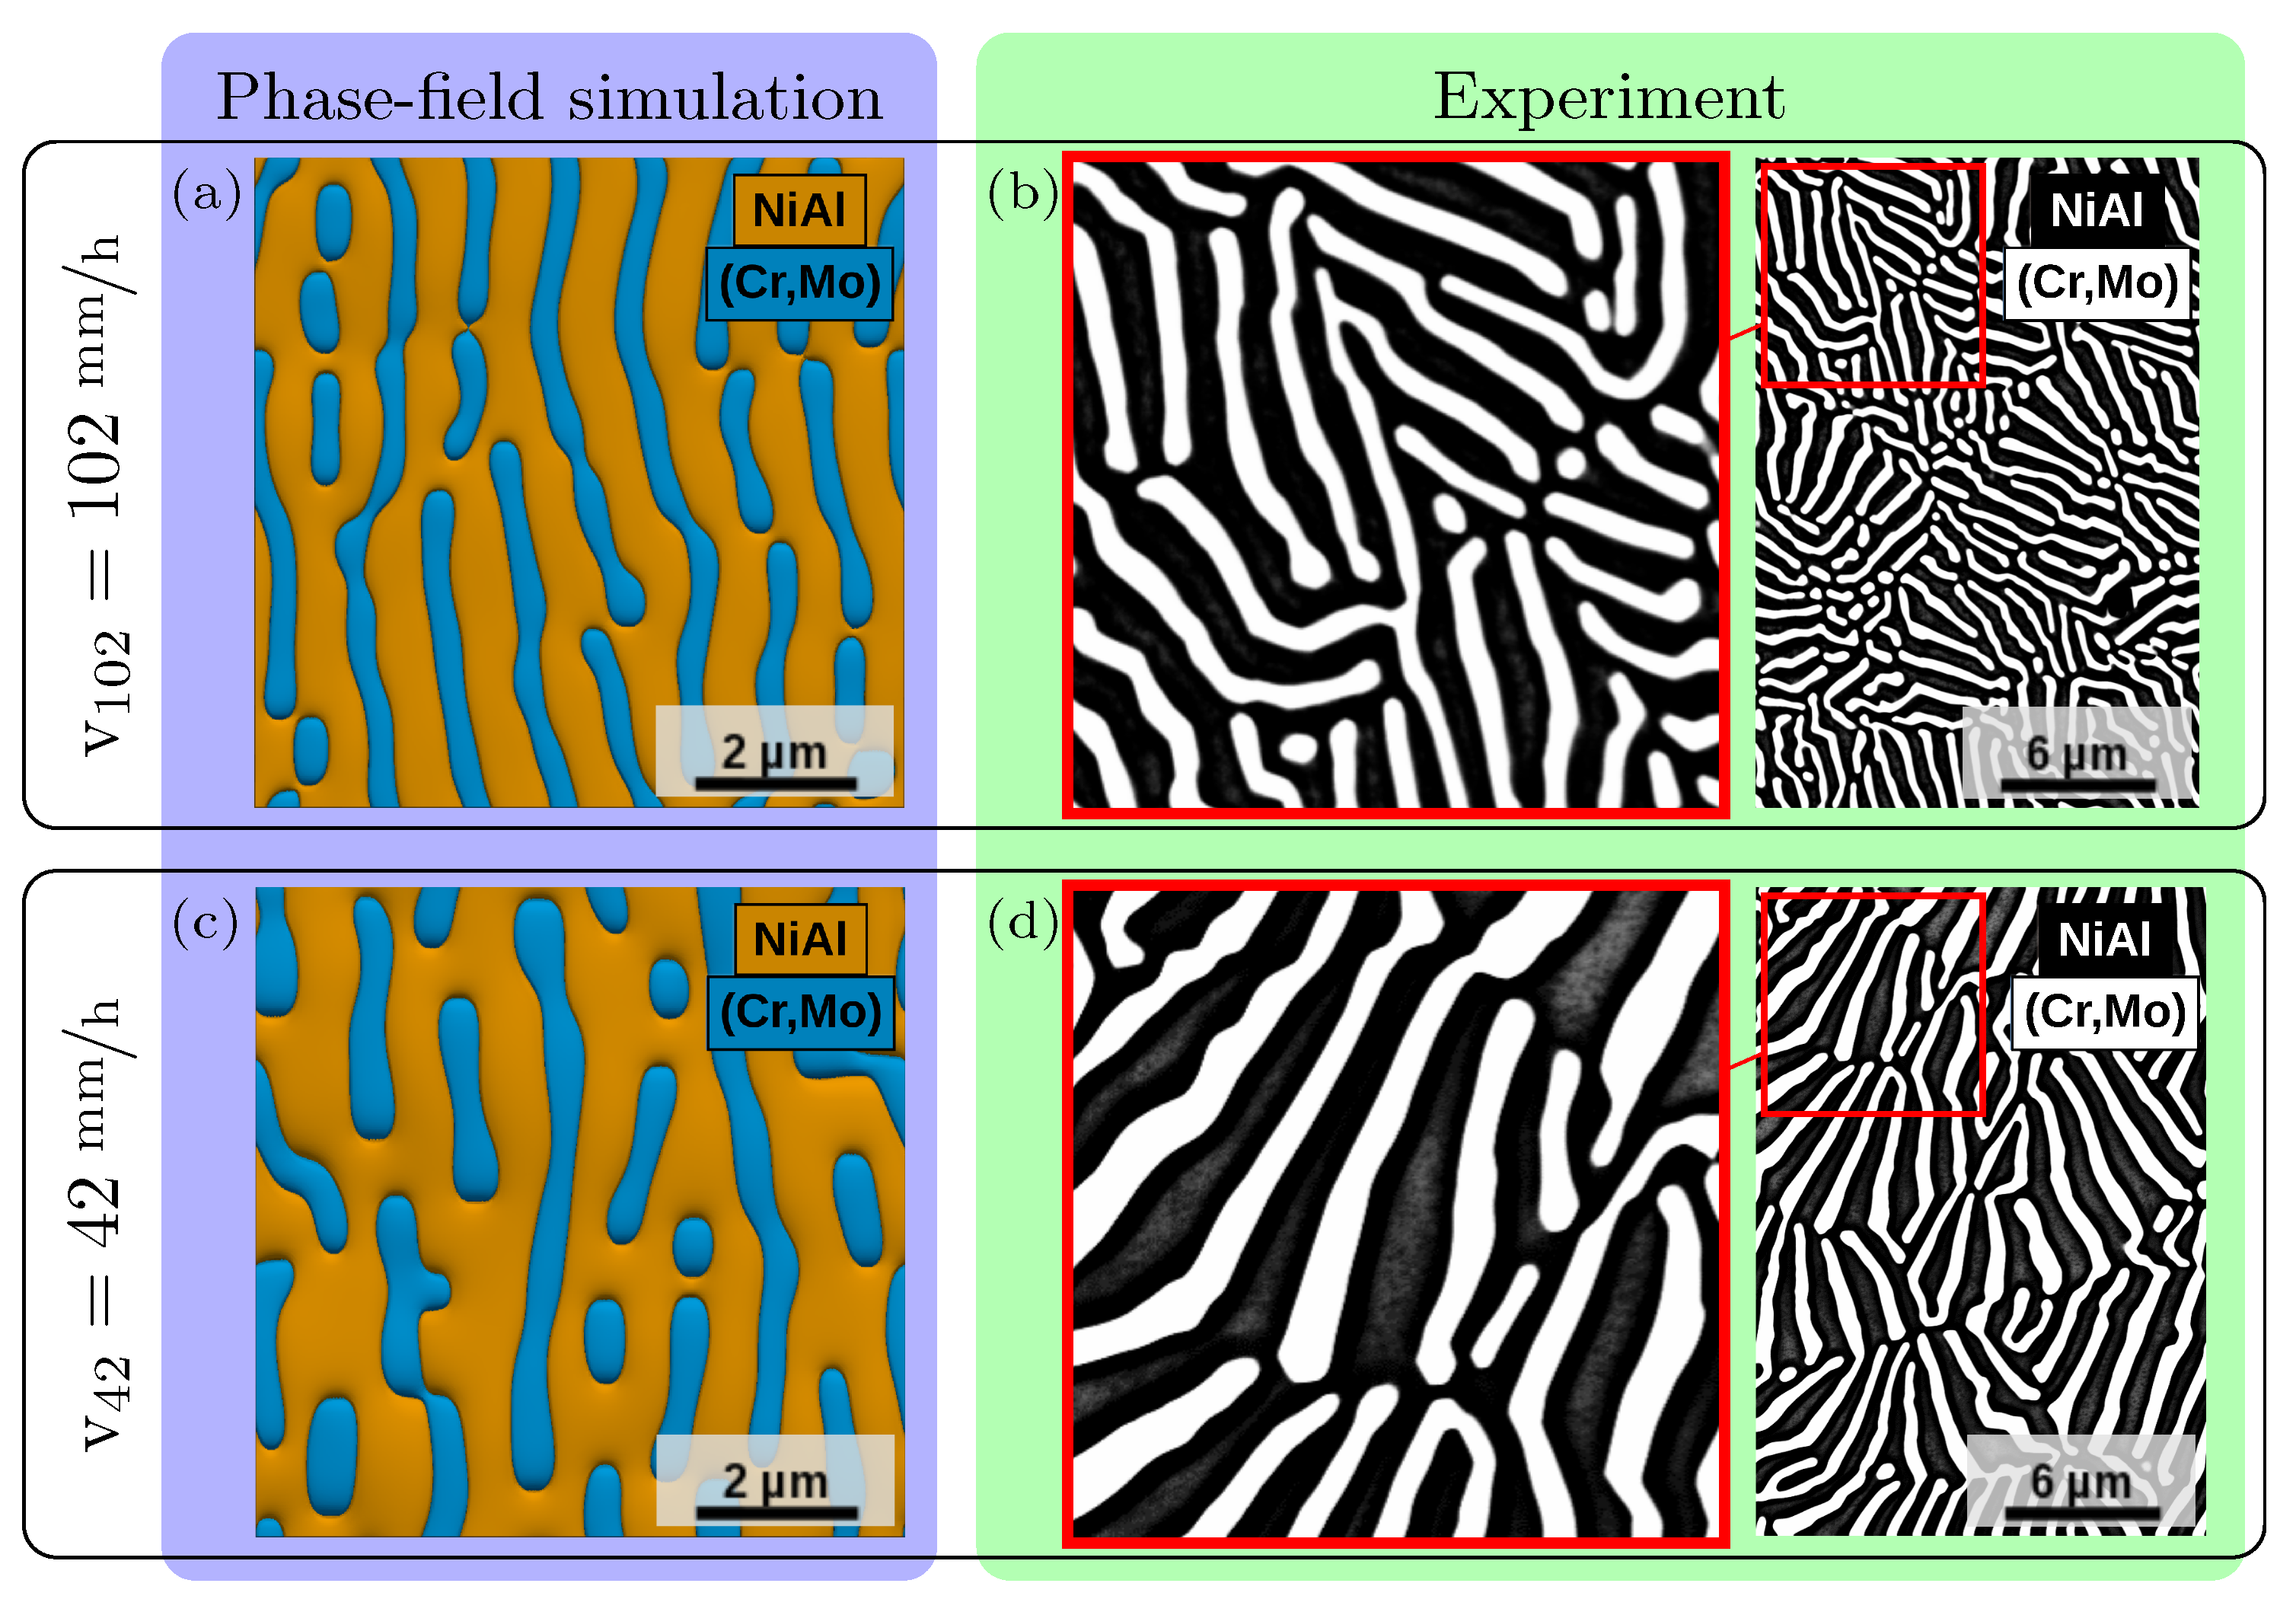
The evolved microstructures of the 3D large-scale phase-field simulations for the quaternary system NiAl-31Cr-3Mo are in qualitative and quantitative accordance with experimental micrographs. The deviations in the lamellar spacings are ∼9% for v42 and ∼2% for v102, respectively. To reduce the deviations and the impact of a single missing lamellae pair, larger simulation domains are necessary. Furthermore disturbances need to be implemented into the solidification process together with the activation of a nucleation mechanism.
Based on these findings, it can be concluded, that the presented phase-field approach is suitable to model the eutectic phase transition of quaternary systems based on thermodynamic driving forces. Further, the generated thermodynamic model for the system NiAl-31Cr-3Mo has proven to be qualified to investigate the directional solidification process of the considered quaternary system NiAl-31Cr-3Mo, based on a validation by reproducing the experimentally achieved microstructures.

Author Contributions

Conceptualization, M.K. and C.S.; methodology, M.K. and C.S.; software, M.K. and B.N.; validation, M.K., C.S. and A.K.; formal analysis, M.K., C.S. and A.K.; investigation, M.K. and C.S.; resources, A.K., M.H. and B.N.; data curation, M.K. and B.N.; writing—original draft preparation, M.K. and C.S.; writing—review and editing, M.K., C.S., A.K., M.H. and B.N.; visualization, M.K. and C.S.; supervision, A.K., M.H. and B.N.; project administration, M.K. and M.H.; funding acquisition, M.H. and B.N. All authors have read and agreed to the published version of the manuscript.

Funding

The experimental research work was financially funded by the Helmholtz Association of German Research Centers under the framework of the Helmholtz Research School on “Integrated Materials Development for Novel High Temperature Alloys” (VH-KO-610) and by the German Federal Ministry of Education and Research (BMBF) program “FlexiDS” (05K16VK5). The simulation part of the work has been supported by the Science Data Center “MoMaF”, funded through the Ministry of the State of Baden-Württemberg, by the “Future Field” project “ACDC” of the strategy of excellence of the Karlsruhe Institute of Technology (KIT) and the Helmholtz association through the programme MSE, no. 43.31.01. The authors gratefully acknowledge the Gauss Centre for Supercomputing e.V. (www.gauss-centre.eu accessed on 20 June 2023). for funding this project by providing computing time on the GCS Supercomputer SuperMUC-NG at Leibniz Supercomputing Centre (www.lrz.de accessed on 20 June 2023).

Institutional Review Board Statement

Not applicable.

Data Availability Statement

The raw and processed data could be shared by providing them through the research data framework Kadi4Mat [https://kadi.iam.kit.edu/ accessed on 20 June 2023].

Acknowledgments

A special thanks goes to Marco Seiz, for the implementation of the two-fold anisotropy and to Leon Geisen, for the helpful discussions and his support.

Conflicts of Interest

The authors declare no conflict of interest.

Appendix A. Parameter Sets for Simulations

Besides the already described parameters from the manuscript, Table A1 includes additional parameters such as d x and d t , which respectively describe the size of a simulation cell and the incremental time step width for the calculations, respectively. Due to the dimensional dependency of the maximum incremental time step width, separate time scales d t are used for the 2D and 3D simulations, which leads to different actually calculated dimensionless diffusion coefficients D and relaxation parameters τ for both types of simulation setups. As the experimental results do not show a strong tendency of the microstructure to coarsen after the solidification, solid-solid interactions are not regarded in this work. Hence the diffusion coefficients of the components in the solid phases D NiAl , ( Cr , Mo ) are set to zero, which leads to a reduction of the computational effort. To further decrease the required computational resources, a single value of 0 . 6 ¯ · 10 9 m 2 s is used for the diffusion coefficients of the components in the melt. The relaxation parameters τ are calculated following [46].
The value for the surface tension between the NiAl-matrix and the melt γ α ^ β ^ is chosen between the values from [65,66]. To simplify the calculations, similar to [34], the same value is used for the interface between the (Cr,Mo)–fibers and the liquid phase. For the interface between the two solids, a 30 % larger value is chosen.
Table A1. Summary of numerical and material parameters in dimensionless simulation parameters and in their physical units for the quaternary system NiAl-31Cr-3Mo.
General Parameter Set
ParameterSimulation ValuePhysical Value
d x 1.0 2.00 × 10 8 m
ϵ 4.0 8.00 × 10 8 m
T e u t . 1.0 1716.56 K
γ NiAl ( Cr , Mo ) , γ ( Cr , Mo ) NiAl 0.0091 1.82 J m 2
γ NiAl , γ NiAl 0.0070 1.4 J m 2
γ ( Cr , Mo ) , γ ( Cr , Mo ) 0.0070 1.4 J m 2
γ α β δ 15 · γ -
δ α ^ β ^ 0.5 -
T 6.99 × 10 7 60 K mm
For 2D Simulations
d t 1.0 4.5 × 10 8 s
v42 2.625 × 10 5 42 mm h
v102 6.375 × 10 5 102 mm h
D 0.075 0 . 6 ¯ × 10 9 m 2 s
D NiAl , ( Cr , Mo ) 0 0 m 2 s
τ NiAl ( Cr , Mo ) , τ ( Cr , Mo ) NiAl 49-
τ NiAl , τ NiAl 28-
τ ( Cr , Mo ) , τ ( Cr , Mo ) 25-
For 3D Simulations
d t 1.0 2.9 3 ¯ × 10 8 s
v42 1.711 × 10 5 42 mm h
v102 4.156 × 10 5 102 mm h
D 0.049 0 . 6 ¯ × 10 9 m 2 s
D NiAl , ( Cr , Mo ) 0 0 m 2 s
τ NiAl ( Cr , Mo ) , τ ( Cr , Mo ) NiAl 76-
τ NiAl , τ NiAl 43-
τ ( Cr , Mo ) , τ ( Cr , Mo ) 38-

References

  1. Moore, G.E. Cramming more components onto integrated circuits. IEEE Solid-State Circuits Soc. Newsl. 2006, 11, 33–35, reprinted in Electronics 1965, 38, 114. [Google Scholar] [CrossRef]
  2. Steinmetz, P.; Hötzer, J.; Kellner, M.; Dennstedt, A.; Nestler, B. Large-scale phase-field simulations of ternary eutectic microstructure evolution. Comput. Mater. Sci. 2016, 117, 205–214. [Google Scholar] [CrossRef]
  3. Lewis, D.; Warren, J.; Boettinger, W.; Pusztai, T.; Gránásy, L. Phase-field models for eutectic solidification. JOM 2004, 56, 34–39. [Google Scholar] [CrossRef]
  4. Nestler, B.; Choudhury, A. Phase-field modeling of multi-component systems. Curr. Opin. Solid State Mater. Sci. 2011, 15, 93–105. [Google Scholar] [CrossRef]
  5. Akamatsu, S.; Plapp, M. Eutectic and peritectic solidification patterns. Curr. Opin. Solid State Mater. Sci. 2016, 20, 46–54. [Google Scholar] [CrossRef] [Green Version]
  6. Hötzer, J.; Kellner, M.; Steinmetz, P.; Nestler, B. Phase-field modeling of solidification processes. J. Indian Inst. Sci. 2016, 96, 235–256. [Google Scholar]
  7. Choudhury, A.; Kellner, M.; Nestler, B. A method for coupling the phase-field model based on a grand-potential formalism to thermodynamic databases. Curr. Opin. Solid State Mater. Sci. 2015, 19, 287–300. [Google Scholar] [CrossRef]
  8. Noubary, K.; Kellner, M.; Hötzer, J.; Seiz, M.; Seifert, H.J.; Nestler, B. Data workflow to incorporate thermodynamic energies from Calphad databases into grand-potential-based phase-field models. J. Mater. Sci. 2021, 56, 11932–11952. [Google Scholar] [CrossRef]
  9. Hötzer, J.; Jainta, M.; Steinmetz, P.; Nestler, B.; Dennstedt, A.; Genau, A.; Bauer, M.; Köstler, H.; Rüde, U. Large scale phase-field simulations of directional ternary eutectic solidification. Acta Mater. 2015, 93, 194–204. [Google Scholar] [CrossRef]
  10. Steinmetz, P.; Kellner, M.; Hötzer, J.; Dennstedt, A.; Nestler, B. Phase-field study of the pattern formation in Al-Ag-Cu under the influence of the melt concentration. Comput. Mater. Sci. 2016, 121, 6–13. [Google Scholar] [CrossRef] [Green Version]
  11. Kazemi, O.; Hasemann, G.; Krüger, M.; Halle, T. Phase field simulation of a directional solidification of a ternary eutectic Mo-Si-B Alloy. In Proceedings of the IOP Conference Series: Materials Science and Engineering, 18th Chemnitz Seminar on Materials Engineering—18, Werkstofftechnisches Kolloquium, Chemnitz, Germany, 10–11 March 2016; IOP Publishing: Bristol, UK, 2016; Volume 118, p. 012028. [Google Scholar]
  12. Lu, Y.L.; Zheng, C.; Li, Y.S.; Wang, Y.X. Microscopic phase-field simulation coupled with elastic strain energy for precipitation process of Ni-Cr-Al alloys with low Al content. Trans. Nonferrous Met. Soc. China 2007, 17, 64–71. [Google Scholar] [CrossRef]
  13. Wu, K.; Zhou, N.; Pan, X.; Morral, J.; Wang, Y. Multiphase Ni–Cr–Al diffusion couples: A comparison of phase field simulations with experimental data. Acta Mater. 2008, 56, 3854–3861. [Google Scholar] [CrossRef]
  14. Kellner, M.; Enugala, S.N.; Nestler, B. Modeling of stoichiometric phases in off-eutectic compositions of directional solidifying NbSi-10Ti for phase-field simulations. Comput. Mater. Sci. 2022, 203, 111046. [Google Scholar] [CrossRef]
  15. Dargahi Noubary, K.; Kellner, M.; Nestler, B. Rotating Directional Solidification of Ternary Eutectic Microstructures in Bi-In-Sn: A Phase-Field Study. Materials 2022, 15, 1160. [Google Scholar] [CrossRef] [PubMed]
  16. Jackson, K.; Hunt, J. Lamellar and Rod Eutectic Growth. Trans. Met. Soc. AIME 1966, 236, 1129–1142. [Google Scholar] [CrossRef]
  17. Miracle, D. Overview No. 104 The physical and mechanical properties of NiAl. Acta Metall. Mater. 1993, 41, 649–684. [Google Scholar] [CrossRef]
  18. Darolia, R. Structural applications of NiAl. J. Mater. Sci. Technol. 1994, 10, 157–169. [Google Scholar]
  19. Noebe, R.D.; Bowman, R.R.; Nathal, M.V. Review of the Physical and Mechanical Properties and Potential Applications of the B2 Compound NiAl; NASA Technical Memorandum 105598, Doc ID: 19930002447; NASA: Washington, DC, USA, 1992.
  20. Frommeyer, G.; Rablbauer, R.; Schäfer, H. Elastic properties of B2-ordered NiAl and NiAl–X (Cr, Mo, W) alloys. Intermetallics 2010, 18, 299–305. [Google Scholar] [CrossRef]
  21. Schulz, C.; Kauffmann, A.; Laube, S.; Kellner, M.; Nestler, B.; Heilmaier, M. Role of orientation relationship for the formation of morphology and preferred orientation in NiAl-(Cr, Mo) during directional solidification. Acta Mater. 2022, 231, 117857. [Google Scholar] [CrossRef]
  22. Milenkovic, S.; Caram, R. Mechanical properties and fracture behavior of directionally solidified NiAl-V eutectic composites. Metall. Mater. Trans. A 2015, 46, 557–565. [Google Scholar] [CrossRef] [Green Version]
  23. Seemüller, C.; Heilmaier, M.; Haenschke, T.; Bei, H.; Dlouhy, A.; George, E. Influence of fiber alignment on creep in directionally solidified NiAl–10Mo in-situ composites. Intermetallics 2013, 35, 110–115. [Google Scholar] [CrossRef]
  24. Zhang, J.F.; Jun, S.; Shang, Z.; Lei, W.; Fu, H.Z. Directional solidification and characterization of NiAl-9Mo eutectic alloy. Trans. Nonferrous Met. Soc. China 2013, 23, 3499–3507. [Google Scholar] [CrossRef]
  25. Bei, H.; George, E. Microstructures and mechanical properties of a directionally solidified NiAl–Mo eutectic alloy. Acta Mater. 2005, 53, 69–77. [Google Scholar] [CrossRef]
  26. Albiez, J.; Sprenger, I.; Seemüller, C.; Weygand, D.; Heilmaier, M.; Böhlke, T. Physically motivated model for creep of directionally solidified eutectics evaluated for the intermetallic NiAl–9Mo. Acta Mater. 2016, 110, 377–385. [Google Scholar] [CrossRef]
  27. Cline, H.; Walter, J.; Lifshin, E.; Russell, R. Structures, faults, and the rod-plate transition in eutectics. Metall. Trans. 1971, 2, 189–194. [Google Scholar] [CrossRef]
  28. Haenschke, T.; Gali, A.; Heilmaier, M.; Krüger, M.; Bei, H.; George, E. Synthesis and characterization of lamellar and fibre-reinforced NiAl-Mo and NiAl-Cr. In Proceedings of the Journal of Physics: Conference Series, 15th International Conference on the Strength of Materials (ICSMA-15), Dresden, Germany, 16–21 August 2009; IOP Publishing: Bristol, UK, 2010; Volume 240, p. 012063. [Google Scholar]
  29. Cline, H.E.; Walter, J.L. The effect of alloy additions on the rod-plate transition in the eutectic NiAl-Cr. Metall. Trans. 1970, 1, 2907–2917. [Google Scholar] [CrossRef]
  30. Kumar, A.; Ensslen, C.; Krüger, A.; Klimenkov, M.; Kraft, O.; Schwaiger, R. Micromechanical study on the deformation behavior of directionally solidified NiAl-Cr eutectic composites. J. Mater. Res. 2017, 32, 2127–2134. [Google Scholar] [CrossRef]
  31. Johnson, D.; Chen, X.; Oliver, B.; Noebe, R.D.; Whittenberger, J. Processing and mechanical properties of in-situ composites from the NiAlCr and the NiAl (Cr, Mo) eutectic systems. Intermetallics 1995, 3, 99–113. [Google Scholar] [CrossRef]
  32. Wang, L.; Gao, L.; Shen, J.; Zhang, Y.; Wang, T.; Wang, Z.; Qu, P.; Zhang, J.; Zhang, G. Microstructure evolution of NiAl-Cr (Mo) planar eutectic lamellar structure during high temperature treatment. J. Mater. Res. 2018, 33, 3689–3699. [Google Scholar] [CrossRef]
  33. Peng, J.; Franke, P.; Seifert, H.J. Experimental Investigation and CALPHAD Assessment of the Eutectic Trough in the System NiAl-Cr-Mo. J. Phase Equilibria Diffus. 2016, 37, 592–600. [Google Scholar] [CrossRef]
  34. Kellner, M.; Sprenger, I.; Steinmetz, P.; Hötzer, J.; Nestler, B.; Heilmaier, M. Phase-field simulation of the microstructure evolution in the eutectic NiAl-34Cr system. Comput. Mater. Sci. 2017, 128, 379–387. [Google Scholar] [CrossRef]
  35. Gombola, C.; Kauffmann, A.; Geramifard, G.; Blankenburg, M.; Heilmaier, M. Microstructural investigations of novel high temperature alloys based on NiAl-(Cr, Mo). Metals 2020, 10, 961. [Google Scholar] [CrossRef]
  36. Whittenberger, J.D.; Raj, S.; Locci, I.; Salem, J. Effect of growth rate on elevated temperature plastic flow androom temperature fracture toughness of directionally solidified NiAl-31Cr-3Mo. Intermetallics 1999, 7, 1159–1168. [Google Scholar] [CrossRef]
  37. Whittenberger, J.D.; Raj, S.; Locci, I.E.; Salem, J.A. Elevated temperature strength and room-temperature toughness of directionally solidified Ni-33Al-33Cr-1Mo. Metall. Mater. Trans. A 2002, 33, 1385–1397. [Google Scholar] [CrossRef]
  38. Chen, X.; Johnson, D.; Noebe, R.; Oliver, B. Deformation and fracture of a directionally solidified NiAl-28Cr-6Mo eutectic alloy. J. Mater. Res. 1995, 10, 1159–1170. [Google Scholar] [CrossRef] [Green Version]
  39. Lu, Y.L.; Jia, D.; Hu, T.; Chen, Z.; Zhang, L. Phase-field study the effects of elastic strain energy on the occupation probability of Cr atom in Ni-Al-Cr alloy. Superlattices Microstruct. 2014, 66, 105–111. [Google Scholar] [CrossRef]
  40. Lu, Y.L.; Chen, Z.; Wang, Y.X.; Zhang, J.; Yang, K. Phase-field study the effect of elastic strain energy on the incubation period of Ni–Cr–Al alloys. Comput. Mater. Sci. 2011, 50, 1925–1931. [Google Scholar] [CrossRef]
  41. Kellner, M.; Kunz, W.; Steinmetz, P.; Hötzer, J.; Nestler, B. Phase-field study of dynamic velocity variations during directional solidification of eutectic NiAl-34Cr. Comput. Mater. Sci. 2018, 145, 291–305. [Google Scholar] [CrossRef]
  42. Parisi, A.; Plapp, M. Defects and multistability in eutectic solidification patterns. EPL (Europhys. Lett.) 2010, 90, 26010. [Google Scholar] [CrossRef] [Green Version]
  43. Ghosh, S.; Plapp, M. Influence of interphase boundary anisotropy on bulk eutectic solidification microstructures. Acta Mater. 2017, 140, 140–148. [Google Scholar] [CrossRef]
  44. Khanna, S.; Choudhury, A. Three-Phase Eutectic Microstructures: Influence of Interfacial Energy Anisotropy and Solute Diffusivities. Metall. Mater. Trans. A 2021, 52, 4246–4263. [Google Scholar] [CrossRef]
  45. Plapp, M. Unified derivation of phase-field models for alloy solidification from a grand-potential functional. Phys. Rev. E 2011, 84, 031601. [Google Scholar] [CrossRef] [PubMed] [Green Version]
  46. Choudhury, A.; Nestler, B. Grand-potential formulation for multicomponent phase transformations combined with thin-interface asymptotics of the double-obstacle potential. Phys. Rev. E 2012, 85, 021602. [Google Scholar] [CrossRef] [PubMed]
  47. Nestler, B.; Garcke, H.; Stinner, B. Multicomponent alloy solidification: Phase-field modeling and simulations. Phys. Rev. E 2005, 71, 041609. [Google Scholar] [CrossRef] [Green Version]
  48. Karma, A. Phase-field formulation for quantitative modeling of alloy solidification. Phys. Rev. Lett. 2001, 87, 115701. [Google Scholar] [CrossRef] [Green Version]
  49. Echebarria, B.; Folch, R.; Karma, A.; Plapp, M. Quantitative phase-field model of alloy solidification. Phys. Rev. E 2004, 70, 061604. [Google Scholar] [CrossRef] [Green Version]
  50. Karma, A. Phase-field model of eutectic growth. Phys. Rev. E 1994, 49, 2245. [Google Scholar] [CrossRef]
  51. Apel, M.; Boettger, B.; Diepers, H.J.; Steinbach, I. 2D and 3D phase-field simulations of lamella and fibrous eutectic growth. J. Cryst. Growth 2002, 237, 154–158. [Google Scholar] [CrossRef]
  52. Zhang, A.; Du, J.; Guo, Z.; Xiong, S. Lamellar eutectic growth under forced convection: A phase-field lattice-Boltzmann study based on a modified Jackson-Hunt theory. Phys. Rev. E 2018, 98, 043301. [Google Scholar] [CrossRef]
  53. Steinmetz, P.; Kellner, M.; Hötzer, J.; Nestler, B. Quantitative comparison of ternary eutectic phase-field simulations with analytical 3D Jackson–Hunt approaches. Metall. Mater. Trans. B 2018, 49, 213–224. [Google Scholar] [CrossRef]
  54. Steinmetz, P.; Hötzer, J.; Kellner, M.; Genau, A.; Nestler, B. Study of pattern selection in 3D phase-field simulations during the directional solidification of ternary eutectic Al-Ag-Cu. Comput. Mater. Sci. 2018, 148, 131–140. [Google Scholar] [CrossRef]
  55. Enugala, S.N.; Kellner, M.; Kobold, R.; Hötzer, J.; Kolbe, M.; Nestler, B.; Herlach, D. Theoretical and numerical investigations of rod growth of an Ni–Zr eutectic alloy. J. Mater. Sci. 2019, 54, 12605–12622. [Google Scholar] [CrossRef]
  56. McCartney, D.; Hunt, J.; Jordan, R. The structures expected in a simple ternary eutectic system: Part 1. Theory. Metall. Trans. A 1980, 11, 1243–1249. [Google Scholar] [CrossRef]
  57. Choudhury, A.; Plapp, M.; Nestler, B. Theoretical and numerical study of lamellar eutectic three-phase growth in ternary alloys. Phys. Rev. E 2011, 83, 051608. [Google Scholar] [CrossRef] [Green Version]
  58. Hu, S.; Murray, J.; Weiland, H.; Liu, Z.; Chen, L. Thermodynamic description and growth kinetics of stoichiometric precipitates in the phase-field approach. Calphad 2007, 31, 303–312. [Google Scholar] [CrossRef]
  59. Hötzer, J.; Reiter, A.; Hierl, H.; Steinmetz, P.; Selzer, M.; Nestler, B. The parallel multi-physics phase-field framework Pace3D. J. Comput. Sci. 2018, 26, 1–12. [Google Scholar] [CrossRef]
  60. IDM—Institute for Digital Materials Research. Software Package Parallel Algorithms for Crystal Evolution in 3D—Pace3D. 2022. Available online: https://www.h-ka.de/en/idm/profile/pace3d-software (accessed on 20 June 2023).
  61. Gombola, C.; Hasemann, G.; Kauffmann, A.; Sprenger, I.; Laube, S.; Schmitt, A.; Gang, F.; Bolbut, V.; Oehring, M.; Blankenburg, M.; et al. A zone melting device for the in situ observation of directional solidification using high-energy synchrotron x rays. Rev. Sci. Instrum. 2020, 91, 093901. [Google Scholar] [CrossRef]
  62. Hinrichs, F.; Kellner, M.; Hötzer, J.; Nestler, B. Calibration of a concentration-driven nucleation mechanism for phase-field simulations of eutectic and off-eutectic compositions in AlCu-5Ag. Scr. Mater. 2020, 186, 89–94. [Google Scholar] [CrossRef]
  63. Kellner, M.; Hötzer, J.; Schoof, E.; Nestler, B. Phase-field study of eutectic colony formation in NiAl-34Cr. Acta Mater. 2020, 182, 267–277. [Google Scholar] [CrossRef]
  64. LRZ—Leibniz Supercomputing Centre. SuperMUC-NG Petascale System. 2022. Available online: https://doku.lrz.de/display/PUBLIC/SuperMUC-NG (accessed on 20 June 2023).
  65. Kuznetsov, V.; Kadyrov, R.; Rudenskii, G.E. Calculation of surface energy of metals and alloys by the electron density functional method. J. Mater. Sci. Technol. 1998, 14, 320–322. [Google Scholar]
  66. Kang, M.; Lui, S.C.; Mele, E.; Plummer, E.; Zehner, D. Atomic and electronic structure of the NiAl (111) surface. Phys. Rev. B 1990, 41, 4920. [Google Scholar] [CrossRef] [PubMed]
Figure 1. Phase diagrams of NiAl-Cr-Mo [33]: (a) Three-dimensional phase diagram of the pseudo-ternary system NiAl-Cr-Mo. (b) Temperature profiles of three phase region beneath eutectic trough. (c) Liquidus projection of the pseudo-ternary system NiAl-Cr-Mo (green) showing the eutectic trough and the subsequently calculated equilibrium concentrations of the NiAl (orange) and the (Cr,Mo) (blue) phase, surrounded by the phase diagrams of the systems NiAl-Cr, Cr-Mo and NiAl-Mo. (For interpretation of the references to color in this figure legend, the reader is referred to the web version of this article.)
Crystals 13 01046 g001
Figure 2. Comparison of equilibrium concentrations calculated from the Calphad database (solid lines) and from the Equations (10)–(12) (symbols) for the phases NiAl (orange) and (Cr,Mo) (blue). (For interpretation of the references to color in this figure legend, the reader is referred to the web version of this article.)
Crystals 13 01046 g002
Figure 3. SEM-BSE micrographs of NiAl-31Cr-3Mo in (a) as-cast and (c) as-DS condition, micrographs parallel to growth direction (GD indicated by arrow) subsequent to directional solidification at v 42 = 42 mm h . (b) Photograph of the zone melting process during operation.
Crystals 13 01046 g003
Figure 4. Undercooling-spacing relationships from two-dimensional phase-field simulations of the eutectic NiAl-31Cr-3Mo system for the growth front velocities v42 (a) and v102 (b). The measured undercooling from the 3D simulations is added with a single rectangular mark, respectively.
Crystals 13 01046 g004
Figure 5. Simulated three-dimensional microstructure of NiAl-(Cr,Mo) in a domain of 400 × 400 voxel cells (8 μ m × 8 μ m) with a growth velocity v 102 = 102 mm h (a) and selected solidification fronts after 2.5 (d), 5.5 (e) and 8.5 million dimensionless time units (time steps) (f). The blue (Cr,Mo)–phase (c) is evolving embedded in the orange NiAl–matrix (b). (For interpretation of the references to color in this figure legend, the reader is referred to the web version of this article.)
Crystals 13 01046 g005
Figure 6. Solidification front from 3D phase-field simulations and from corresponding experiments with the growth front velocities v 42 = 102 mm h (a,b) and v 102 = 42 mm h (c,d).
Crystals 13 01046 g006
Table 1. Equilibrium concentrations of NiAl and (Cr,Mo) for T 1 = 1700 K and T 2 = 1710 K , respectively, and concentration of the eutectic reaction at the liquidus temperature T liq . = 1716.56 K calculated based on [33]. All entries are rounded after the second decimal place.
Temp.
in K
Alc
in at.%
Crc
in at.%
Moc
in at.%
Nic
in at.%
NiAl
170044.927.180.0347.87
171044.837.360.0347.78
(Cr,Mo)
170010.1876.418.814.59
171010.3976.018.814.79
Liq
1716.56 32.9431.073.0632.94
Table 2. Measured lamellar spacings and widths as well as phase fractions from 3D simulations and experiments.
v 42 = 42 mm h v 102 = 102 mm h
Lamellar spacing λ in nm:
Simulation 1353 ± 247 1018 ± 125
Experiment 1234 ± 215 999 ± 128
Deviation ∼9%∼2%
Widths w of NiAl–matrix in nm:
Simulation 915 ± 260 679 ± 112
Experiment 892 ± 166 585 ± 95
Deviation ∼3%∼14%
Widths w of (Cr,Mo)–lamellae in nm:
Simulation 436 ± 59 338 ± 18
Experiment 474 ± 115 361 ± 68
Deviation ∼9%∼7%
Volume fraction of (Cr,Mo)–lamellae in vol.%:
Simulation 32.8 ± 0.1 33.2 ± 0.1
Experiment 35.7 ± 1.2 36.6 ± 1.7
Deviation ∼9%∼10%
Disclaimer/Publisher’s Note: The statements, opinions and data contained in all publications are solely those of the individual author(s) and contributor(s) and not of MDPI and/or the editor(s). MDPI and/or the editor(s) disclaim responsibility for any injury to people or property resulting from any ideas, methods, instructions or products referred to in the content.

