Abstract
The Dy–Al–Si ternary system has been experimentally studied, as the effect of the dysprosium addition on the constitution and topology of the liquidus surface, focusing on the (Al) rich part. The system has been investigated in a composition range of up to about 58 at% silicon. The alloys constitution and the liquidus surface projection have been determined by means of scanning electron microscopy (SEM), energy dispersive X-ray spectroscopy (EDXS), X-ray powder diffraction (XRPD), and differential thermal analysis (DTA). This work is part of a research framework on the properties and solid–liquid phase equilibria of the R Al–Si (R: rare earth) systems. These data, along with the ternary systems isothermal section, are needed to outline the design, plan, and development of new Al–Si-based alloys. In the Dy–Al–Si system, four primary crystallization fields have been experimentally detected: (Si), DyAlxSi(2−x) (orthorhombic form), Dy2Al3Si2 (Τ2), and DyAl(3−x)Six. The following three invariant equilibria have been identified: at 566 °C the ternary eutectic L ⇆ DyAl2Si2 + (Al) + (Si), at 630 °C the U1 L+ DyAl3 ⇆ Dy2Al3Si2 + (Al), and at 562 °C the U2: L+ Dy2Al3Si2 ⇆ DyAl2Si2 +(Al) reactions. A comparison with other known R Al–Si systems has been conducted.
1. Introduction
Al–Si alloys have very extended uses in many fields of applications, including automotive parts, aerospace components, electronic industry, and in other cases when satisfactory mechanical properties are to be combined with good chemical properties, including corrosion resistance. Of course, the mechanical properties of such alloys are highly conditioned by the structural properties of the relevant phases depending on equilibria thermodynamics at different concentrations of binary components. Namely, high variability in physical properties can be observed comparing hypoeutectic and hypereutectic alloys made of the aforementioned elements, with obvious technical implications in manufacturing engineering and even in product reliability over time. For example, hypereutectic structures may have coarse Si grains, worsening ductility and making the material susceptible to brittle fracture. To circumvent these drawbacks, two main technical solutions can be adopted, namely physical restructuring and chemical additivation. In the former case, thermal treatments are perhaps the most important routes, and they have attracted much attention in recent years [1]. According to Nikanorov et al. [2] and Kayitmazbatir [3], accurate control of the solidification rate may be highly beneficial in modifying some mechanical properties of Al–Si structures, irrespective of Si concentration. Magnetic fields are attracting growing attention as an atypical and promising method capable of modulating the mechanical properties of Al–Si-based quaternary alloys, with positive effects on microhardness [4]. In terms of chemical additivation, many different elements have been alloyed to the base substrate to obtain an analogous improvement of the global mechanical performances [5]. Excluding Fe, which generally has negative effects on embrittlement, the choice spans a wide range of atomic species, including alkaline, alkaline-earth metals like Sr, and many transition elements like Ni, Mn, Cr, and Cu. The latter, despite posing some issues concerning environmental contamination [6], has been largely investigated as a metal additive entering the composition of alloys for piston engines, with a promising enhancement of overall performance in the field [7,8]. The effect of adding lanthanides to Al–Si alloys represents perhaps one of the most challenging research topics in recent studies on the theme. In fact, very low concentrations of rare earth (RE) metals added to the mother alloy may have surprising effects on the eutectic phase structure. The technological properties involved in these compositional changes have been the object of intense investigations [9,10,11,12,13,14,15,16,17,18,19,20], but the choice of a specific RE metal may be conditioned by its cost. In fact, [8] the first five light RE accounts for 98% percent of the entire mass of RE elements in the common ores, while heavy RE metals tend to get progressively scarce and expensive, though with a non-monotonic trend. Instead of using a pure RE element, a mix of zero positive lanthanides named “Mischmetal” is often added to a typical Al–Si alloy of industrial relevance, whose composition is usually close to the binary Al–Si eutectic point. The standard composition of Mischmetal includes approximately 50% Ce, 25% La and smaller amounts of Nd and Pr. In this experimental work, dysprosium has been selected as an atypical RE metal to be added to the mother alloy to investigate its effects on phase equilibria in the Al-rich corner. Differential thermal analysis (DTA) proved to be informative with regards to the kinetics of phase formation during the crystallization process, while the resulting alloys were characterized by means of scanning electron microscopy (SEM), equipped with energy dispersive X-ray spectrometer (EDXS) and X-ray powder diffraction (XRPD). As the knowledge of the liquid-solid phase equilibria in the ternary R-Al–Si systems, only the Al-rich corner of the R Al–Si systems for the three light lanthanides Pr, Nd, Sm, and Tb have been investigated [21,22]. The 500 °C isothermal section of the ternary systems Pr–Al–Si, Nd-Al–Si, Sm–Al–Si, Gd–Al–Si, Tb–Al–Si, and Dy–Al–Si have been studied by our research group [23,24] (and refs therein), while the Er–Al–Si isothermal section at 600 °C has been investigated by [25].
Binary Boundary Systems and Ternary Intermetallic Compounds
In the Al–Si system, the only transformation occurring is a simple eutectic reaction at 12.2 at% Si and 577 °C [26]. The Dy–Al phase diagram [27] consists of five intermetallic structures. The Dy–Si system has been recently assessed by [28], and seven intermetallic compounds have been found.
In the system investigated, the following ternary intermetallic phases have been confirmed [29]: Τ1-DyAl2Si2 hP5-CaAl2O2 type, Τ2-Dy2Al3Si2 mS14-Y2Al3Si2 type, Τ3-Dy2Al1+xSi2−x, 0 ≤ x ≤ 0.25, oI10-W2CoB2 type and Τ4-Dy6Al3Si, tI80-Dy6Al3Si type. Table 1 shows the stoichiometry and the crystal structure of the relevant binary and ternary compounds reported in the literature.

Table 1.
Dy–Al–Si system: crystallographic data of the binary boundaries and ternary phases.
The knowledge of the transformations that take place during the solidification pathway of the foundry aluminum-based alloys is crucial, especially in planning and developing new materials; moreover, familiarity with ternary alloys phase equilibrium is necessary to correctly interpret data for ternary and higher-order systems.
2. Materials and Methods
2.1. Materials and Sample Synthesis
All the alloys have been synthesized starting from the following pure elements: aluminum, silicon, and dysprosium, whose purity was, respectively, 99.999, 99.99, and 99.9 mass%, all supplied by NewmetKoch, Waltham Abbey, England. To synthesize the samples, an appropriate amount of the constituents was cut into small pieces (after having eliminated the possible surface oxide layer by filing) and then arc-melted on a water-cooled copper plate under a vacuum. The weight of each sample was about 1 g, and mass losses checked after each synthesis were always less than 0.5 mass %.
2.2. Samples Characterization
After synthesis, the samples were analyzed via differential thermal analysis. The measurements were performed by means of a H/LABSYSEVO-1A SETARAM apparatus in an alumina open crucible at a 5 °C min−1 rate, both on heating and on cooling, under argon flux of 30 mL min−1. The sample mass was about 50–70 mg. The thermocouple calibration was based on the melting point of different high-purity metals (with melting points in the temperature range considered). The accuracy in the temperatures measured was estimated to be within 0.5%. The temperature values for the different transformations occurring in the system were obtained by extrapolating the onset temperature from the DTA cooling curves. The sample characterization, after DTA, was carried out through scanning electron microscopy (SEM), electron probe microanalysis based on energy dispersive X-ray spectroscopy (EDXS), and X-ray diffraction analysis (XRPD). The samples for the metallographic analysis were hot incorporated in conductive resin blocks; the resin used was a PolyFast phenolic hot mounting resin with carbon filler, provided by Struers, Ballerup, Copenhagen, Denmark. Following the integration of the sample into the resin, smooth surfaces were created by SiC paper and diamond paste polishing to 1m grain size. The samples were subjected to an acceleration voltage of 20 kV for 50 s in order to be analyzed. To process the X-ray spectra for the quantitative analysis, the software packaging Inca Energy (Oxford Instruments, Analytical Ltd., Bucks, UK) was employed, and a cobalt standard was used for calibration.
XRPD analysis was carried out by the vertical diffractometer X’Pert MPD (Philips, Almelo, the Netherlands), equipped with a Cu tube (Kα1 wavelength: 1.5406 Å). The samples were prepared by grinding them in an agate mortar, and the patterns were collected in a 2θ range between 10° and 100°, with a step of 0.001° and measuring time of 50 s/step. To identify the crystal structures and calculate lattice parameters of the phases, the diffraction data were compared with the literature or calculated data (respectively, the program Powder Cell [44] and LATCON [45].
3. Results and Discussion
Table 2 reports the melting and transition temperatures for the different samples, determined by DTA investigation. Due to the slight temperature differences which a transformation may show in different alloys, the temperature attributed to each reaction is the average of the values measured in the different samples.
Table 2.
Phase equilibria and respective temperatures (°C) in the Dy–Al–Si system: results pertaining to DTA analysis on cooling.
Table 3 shows the sample characterization results for each analyzed alloy in terms of nominal chemical composition, number of phases, and their constitution and lattice parameters.
Table 3.
Nominal composition and characterization results of the samples after differential thermal analysis.
According to the thermal analysis results from Table 2, the microanalysis (SEM/EDXS), and crystallographic (XRPD) data, the liquidus projection in the aluminum-rich part of the Dy–Al–Si system has been drawn, as reported in Figure 1.
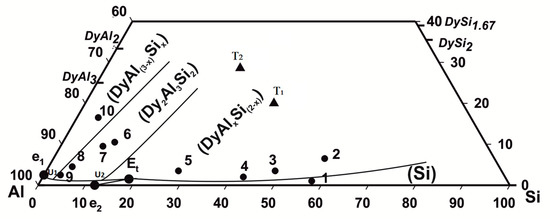
Figure 1.
Dy–Al–Si system, projection of the liquidus surface in the Al-rich part (● samples from Table 2, ▲ ternary compounds).
The diagram shows the binary and the ternary intermetallic compounds involved in the equilibria studied; the binary phases are represented by their stoichiometry, and the ternary compounds are represented by their symbols (Τ1, Τ2).
Based on the experimental results, four primary crystallization fields can be described: (Si), DyAlxSi(2−x) (in the orthorhombic form), Dy2Al3Si2 (Τ2), and DyAl(3−x)Six. As the two (Al) and DyAl2Si2 (Τ1) phases, their primary formation has not been experimentally detected; nevertheless, the (Al) primary solidification field can be presumed from the knowledge of the Dy–Al–Si isothermal section and the other known R Al–Si systems liquidus projections. In the following, the experimental results are presented and discussed, combining the alloys in two groups according to their belonging to a specific field of primary crystallization. Alloys from n.1 to n.5 (silicon richest samples) pertain to the (Si) and DyAlxSi(2−x) primary solidification region; while moving in the system toward the aluminum richest part, the alloys from n.6 to n.10 define the Dy2Al3Si2 and DyAl(3−x)Six primary solidification area.
3.1. (Si) and DyAlxSi(2−x) Primary Solidification Field—Samples n.1–n.5
Figure 2a–e shows the micrographic appearance of the DyAlSi samples (alloys n.1 to n.5 in Table 2) pertaining to the (Si) (Figure 2a) and DyAlxSi(2−x) (Figure 2b–e) primary crystallization part of the system. The corresponding thermal analysis results are reported in Figure 3. Sample 1 reveals a primary (Si) phase as the first that crystalized under cooling at 971 °C, as shown in Figure 3a. The second thermal effect at 639 °C is due to the binary peritectic reaction, leading to the Τ1 phase formation surrounding the primary silicon (grey in Figure 2a); the residual liquid on cooling first separates dark polygonal crystals of silicon at 570 °C, then undergoes a ternary eutectic reaction at 565 °C. The samples from number 2 to number 5 show the primary crystallization of the DyAlxSi(2−x) compound, at about 4.0 at.% aluminum concentration. As reported in Table 2, the DyAlxSi(2-x) formation temperature decreases (from 989 °C to 795 °C) ongoing from the silicon to the aluminum-rich side; moreover, from the DTA cooling curves from Figure 3b to Figure 3e, it can be noticed that increasing the aluminum content the intensity of the peaks decreases, revealing a decrement in the amount of primary phase from sample n.2 to sample n.5.
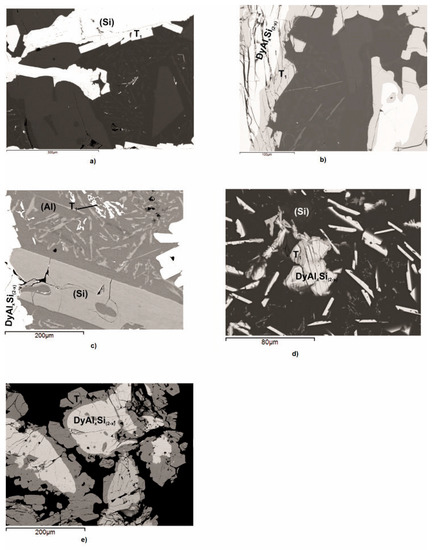
Figure 2.
Backscattered electrons (BSE) images of the Dy–Al–Si alloy samples (n.1 – 5) reported in Table 2: (a) sample n.1, primary light (Si) crystals with a small quantity of light grey peritectic DyAl2Si2 compound and the ternary eutectic decomposition (DyAl2Si2 (light smaller particles) + dark (Al) + light grey (Si)) together with the larger (Si) crystals previously formed; (b) sample n.2, primary light DyAlxSi(2−x) surrounded by light grey peritectic DyAl2Si2 compound plus the ternary eutectic decomposition (DyAl2Si2 (light smaller needles) + dark (Al) + light grey (Si)) together with the larger (Si) crystals previously formed; (c) sample n.3, primary light DyAlxSi(2−x) with a small quantity of grey peritectic DyAl2Si2 compound surrounded by the ternary eutectic decomposition (DyAl2Si2 (light smaller particles) + dark (Al) + light grey (Si)) and the (Si) phase previously crystalized; (d) sample n.4, primary light DyAlxSi(2−x) with a small quantity of grey peritectic DyAl2Si2 compound plus the ternary eutectic decomposition (DyAl2Si2 (light smaller particles) + dark (Al) + light grey (Si)) and the (Si) phase previously crystalized; and (e) sample n.5, primary light DyAlxSi(2−x) with a small quantity of grey peritectic DyAl2Si2 compound and the ternary eutectic decomposition (DyAl2Si2 (light smaller particles) + dark (Al) + light grey (Si)).
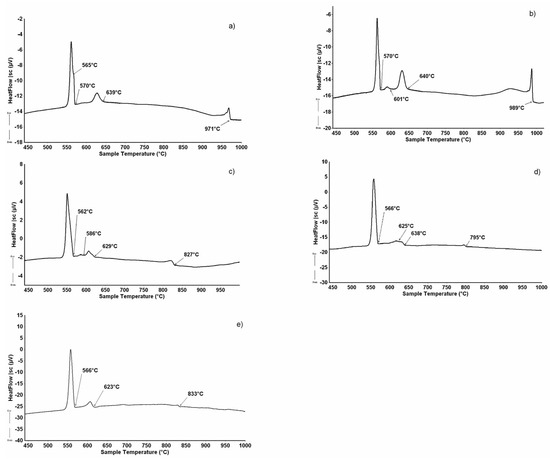
Figure 3.
DTA cooling curve (↑exo, ↓endo) of some alloys from Table 1: (a) sample n.1 (1.0 at%Dy-41.5 at.%Al); (b) sample n.2 (6.5 at.%Dy-36.0 at.%Al); (c) sample n.3 (3.5 at.%Dy-48.0 at.%Al) (d) sample n.4 (2.0 at.%Dy-55.5 at.%Al); (e) sample n.5 (3.5 at.%Dy-68.5 at.%Al).
In samples from n.2 to n.5, the primary crystallization is followed by the binary peritectic reaction L + DyAlxSi(2−x) ⇆ DyAl2Si2, occurring at a temperature of 632 °C, as is evident in Figure 2b–e, that show the primary light DyAlxSi(2−x) compound surrounded by the grey DyAl2Si2 phase peripatetically formed. In all the analyzed samples, a residual amount of the primary DyAlxSi(2−x) is noticeable, probably due to the high stability of this structure (formation enthalpy—54.9 kJ/mol [46]). This is in according with the results obtained in the study of the Dy–Al–Si system isothermal section at 500 °C [29], in which the samples were analyzed after annealing at 500 °C for thirty days, followed by quenching in water. By comparing the constitution of the samples, in the same part of the system, it is clear that during the annealing, the peritectic reaction that leads to the DyAl2Si2 formation goes on up to the complete consumption of the DyAlxSi(2−x) primary phase, while during the DTA solidification, this cannot occur. The microstructure of alloys 2, 3, and 4 (Figure 2b–d), in conjunction with their thermal analysis results (Figure 3b–d), points out that after the peritectic formation of DyAl2Si2 occurs the reaction L ⇆ L’+ (Si), leading to enrichment in aluminum of the residual liquid, silicon solidifies in large polygonal crystals in a temperature range from 586 °C to 625 °C. This reaction does not occur in sample n.5; this is attributable to the liquid composition that does not requires an enrichment in aluminum.
All samples go through a ternary eutectic reaction at 566 °C temperature L ⇆ DyAl2Si2 + (Al) + (Si); the liquid eutectic composition, determined by SEM/EDXS analysis, corresponds to Dy 0.5 at% and Al 75.0 at%.
3.2. Dy2Al3Si2 and DyAl(3−x)Six Primary Solidification Field-Samples n.6 – n.10
Figure 4a–d shows the samples’ microstructures, investigated after DTA, belonging to the Dy2Al3Si2 primary compound, and Figure 5a–d reports the DTA results for the samples. The structure of samples n.6,7,8,9 displays light Dy2Al3Si2 (T2) primary crystals that move away from the Dy2Al3Si2 stoichiometry and continue to the Al-rich corner as the formation temperature decreases. During the cooling, the residual liquid crosses the binary eutectic reaction L ⇆ DyAl2Si2 + (Al) at a temperature of 627 °C; the liquid eutectic composition, determined by SEM/EDXS analysis, is Dy 2 at% and Al 94 at%. The remaining liquid undergoes the invariant U2 reaction: L+ Dy2Al3Si2 ⇆ DyAl2Si2 + (Al) at a temperature of 562 °C.
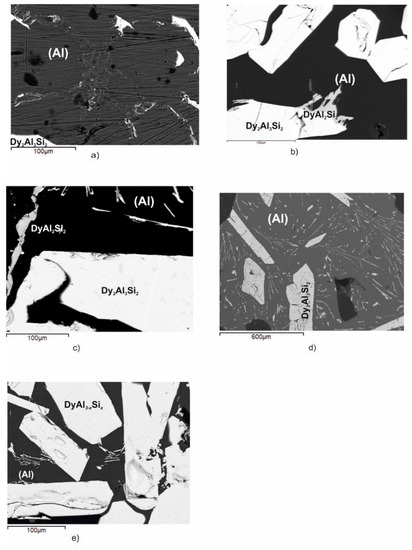
Figure 4.
Backscattered electrons (BSE) images of the Dy–Al–Si alloy samples (n.6 ÷ 10) reported in Table 2. (a) Sample n.6, primary light Dy2Al3Si2, dark polygonal crystals of (Al) and the binary eutectic ((Al) and DyAl2Si2); (b) sample n.7, primary light Dy2Al3Si2, dark polygonal crystals of (Al) and the binary eutectic ((Al) and DyAl2Si2); (c) sample n.8, primary light Dy2Al3Si2, dark polygonal crystals of (Al) and the binary eutectic ((Al) and DyAl2Si2); (d) sample n.9, primary light Dy2Al3Si2, dark polygonal crystals of (Al) and the binary eutectic ((Al) and DyAl2Si2); and (e) sample n.10, primary light larger DyAl(3−x)Six crystals surrounded by Dy2Al3Si2 (light needles) and dark (Al).
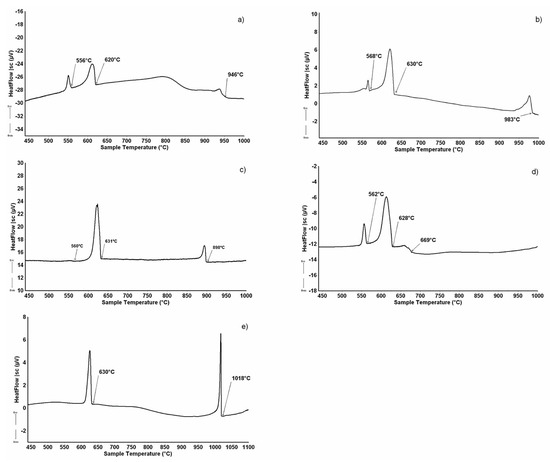
Figure 5.
DTA cooling curve (↑exo, ↓endo) of some alloys from Table 1: (a) sample n.6 (10.5 at%Dy-78.5 at.%Al); (b) sample n.7 (9.5at.%Dy-81.5 at.%Al); (c) sample n.8 (4.5 at.%Dy-90.5 at.%Al); (d) sample n.9 (2.5 at.%Dy-94.0 at.%Al); and (e) sample n.10 (16.5 at.%Dy-79.0 at.%Al).
The micrographic aspect of sample n.10 (Figure 4e), in conjunction with its DTA cooling curve reported in Figure 5e, shows that it belongs to the DyAl(3−x)Six primary crystallization part of the system. It is constituted by primary white DyAl(3−x)Six crystals, at 6 at% Si content, which forms at 1018 °C, then the liquid undergoes the invariant ternary equilibrium U1: L + DyAl(3−x)Six ⇆ (Al)+ Dy2Al3Si2 at 630 °C.
Based on the experimental results, the liquidus surface in the Al-rich corner of the Dy–Al–Si system can be drawn; it is shown in Figure 1. In the Al-rich side, the Dy–Al–Si system consists of the following primary solidification regions: DyAlxSi(2−x), Dy2Al3Si2, DyAl(3−x)Six, (Al) and (Si).
- Three invariant ternary transitions have been identified:
- Ternary eutectic: L(0.5at%Dy, 75.0at%Al) ⇄ DyAl2Si2 + (Al) + (Si) at 566 °C;
- U1: L+ DyAl3 ⇄ Dy2Al3Si2 + (Al) at 630 °C;
- U2: L+ Dy2Al3Si2 ⇄ DyAl2Si2 +(Al) 562 °C.
- There is one binary eutectic reaction located in the ternary field:
- L(2.0at%Dy, 94.0at%Al) ⇄ DyAl2Si2 + (Al) at 630 °C.
- There is one binary peritectic reaction located in the ternary field:
- + DyAlxSi(2−x) ⇄ DyAl2Si2 at 632 °C.
4. Conclusions
The obtained results can be compared with literature data on the different R Al–Si systems, since a consistent analysis of the behavior when cooled reveals many similarities. Owing to the regular trend in the chemical properties of the lanthanides, the identified equilibria are basically the same in all the systems. The ternary eutectic occurs in all the systems R Al–Si studied (R: Pr, Nd, Sm, Tb, and Dy) at a temperature ranging from 561 °C (Nd), 566 °C (Pr, Tb, and Dy) and 567 °C Sm; the composition of the eutectic liquid does not exceed 1 at% R. In these systems, there is no evident trend both in temperature and composition ongoing from the light to the heavy rare earth systems.
In all the systems, near the aluminum corner, there is an invariant equilibrium U type occurring between the liquid and the binary RxAly solid phase richest in aluminum (Pr3Al11, NdAl3, SmAl3, TbAl3, and DyAl3). This reaction takes place in a large range of temperatures and leads to Al and the first ternary compound formed moving towards silicon at low R content (RAlSi for the light ones, R3Al2Si3 for the two heavy ones).
Close to the ternary eutectic composition, a second U-type invariant reaction occurs, always at a temperature lower than the U reaction discussed above. This reaction leads to Al and the RAl2Si2 compound, in all the studied systems, starting from liquid and the ternary compound deriving from the previous U reaction (RAlSi -the light ones, R3Al2Si3 the two heavy ones). From the experimental knowledge of various R Al–Si ternary systems, it will be possible to attempt a prediction for systems that are still unknown or with greater complexity in the experimental study (e.g., EuAlSi).
Author Contributions
Conceptualization, N.P. and A.M.C.; methodology, A.M.C.; software, A.M.C.; validation, N.P. and A.M.C.; formal analysis, N.P. and A.M.C.; investigation, N.P. and A.M.C.; resources, A.M.C.; data curation, N.P. and A.M.C.; writing—original draft preparation, A.M.C.; writing—review and editing, N.P. and A.M.C.; visualization, N.P. and A.M.C.; supervision, N.P. and A.M.C.; project administration, A.M.C.; funding acquisition, A.M.C. All authors have read and agreed to the published version of the manuscript.
Funding
This research received no external funding.
Data Availability Statement
The data presented in this study are available on request from the corresponding author.
Acknowledgments
The authors express their appreciation to E. Puzo for the help provided in the use of microscopy techniques.
Conflicts of Interest
The authors declare no conflict of interest.
References
- Manani, S.; Pradhan, A.K. Effects of melt thermal treatment on cast Al-Si alloys: A review. Mater. Today Proc. 2022, 62, 6568–6572. [Google Scholar] [CrossRef]
- Nikanorov, S.P.; Osipov, V.N.; Regel, L.I. Structural and mechanical properties of directionally solidified Al-Si alloys. J. Mater. Eng. Perform. 2019, 28, 7302–7323. [Google Scholar] [CrossRef]
- Kayitmazbatir, M.; Lien, H.-H.; Mazumder, J.; Wang, J.; Misra, A. Effect of Cooling Rate on Nano-Eutectic Formation in Laser Surface Remelted and Rare Earth Modified Hypereutectic Al-20Si Alloys. Crystals 2022, 12, 750. [Google Scholar] [CrossRef]
- Osinskaya, J.V.; Pokoev, A.V.; Magamedova, S.G. Influence of the intensity of a constant magnetic field on the process of phase formation in an aged aluminium alloy Al-Si-Cu-Fe. J. Surf. Investig. X-ray Synchrotron Neutron Tech. 2022, 16, 159–162. [Google Scholar] [CrossRef]
- Ervina Efzan, M.N.; Kong, H.J.; Kok, C.K. Review: Effect of alloying element on Al-Si alloys. Adv. Mat. Res. 2014, 845, 355–359. [Google Scholar] [CrossRef]
- Beolchini, F.; Pagnanelli, F.; Reverberi, A.P.; Vegliò, F. Copper biosorption onto Rhizopus oligosporus: pH-edge tests and related kinetic and equilibrium modeling. Ind. Eng. Chem. Res. 2003, 42, 4881–4887. [Google Scholar] [CrossRef]
- Chankitmunkong, S.; Eskin, D.G.; Limmaneevichitr, C. Effect of Cu addition on the microstructure, mechanical and thermal properties of a piston Al-Si alloy. In Proceedings of the Minerals, Metals and Materials Series, Light Metals Symposium held at the TMS Annual Meeting and Exhibition, San Antonio, TX, USA, 10–14 March 2019; pp. 463–469, Code 224839. [Google Scholar]
- Gursoy, O.; Timelli, G. Lanthanides: A focused review of eutectic modification in hypoeutectic Al-Si alloys. J. Mater. Res. Technol 2020, 9, 8652–8666. [Google Scholar] [CrossRef]
- Slattery, B.E.; Perry, T.; Edrisy, A. Microstructural evolution of a eutectic Al-Si engine subjected to severe running conditions. Mat. Sci. Eng. 2009, 512, 76–81. [Google Scholar] [CrossRef]
- Miller, W.S.; Zhuang, L.; Bottema, J.; Wittebrood, A.J.; De Smet, P.; Haszler, A.; Vieregge, A. Recent development in aluminum alloys for the automotive industry. Mat. Sci. Eng. A 2000, 280, 37–49. [Google Scholar] [CrossRef]
- Zhu, M.; Jian, Z.; Yao, L.; Liu, C.; Yang, G.; Zhou, Y. Effect of mischmetal modification treatment on the microstructure, tensile properties, and fracture behavior of Al-7.0%Si-0.3%Mg foundry aluminum alloys. J. Mater. Sci. 2011, 46, 2685–2694. [Google Scholar] [CrossRef]
- Mazahery, A.; Shabani, M.O. Modification Mechanism and Microstructural Characteristics of Eutectic Si in Casting Al-Si Alloys: A Review on Experimental and Numerical Studies. J. Miner. Met. Mater. Soc. 2014, l66, 726–738. [Google Scholar] [CrossRef]
- Traverso, P.; Spiniello, R.; Monaco, L. Corrosion Inhibition of Al 6061T6/Al2O3p 10% (v/v) composite in 3.5% NaCl solution with addition of cerium (III) chloride. Surf. Interface Anal. 2002, 34, 185–188. [Google Scholar] [CrossRef]
- Heusler, L.; Schneider, W. Influence of alloying elements on the thermal analysis results of Al-Si cast alloys. J. Light Metals 2002, 2, 17–26. [Google Scholar] [CrossRef]
- Qiu, H.; Yan, H.; Hu, Z. Effect of samarium (Sm) addition on the microstructures and mechanical properties of Al–7Si–0.7Mg alloys. J. Alloys Compd. 2013, 567, 77–81. [Google Scholar] [CrossRef]
- Nogita, K.; Yasuda, H.; Yoshiya, M.; McDonald, S.D.; Uesugi, K.; Tacheuchi, A.; Suzuki, Y. The role of trace element segregation in the eutectic modification of hypoeutectic Al-Si alloys. J. Alloys Comp. 2010, 489, 415–420. [Google Scholar] [CrossRef]
- Cardinale, A.M.; Macciò, D.; Luciano, G.; Canepa, E.; Traverso, P. Thermal and corrosion behavior of as cast Al-Si alloys with rare earth. J. Alloys Compd. 2016, 695, 2180–2189. [Google Scholar] [CrossRef]
- Li, Q.; Li, B.; Li, J.; Zhu, Y.; Xia, T. Effect of yttrium addition on the microstructures and mechanical properties of hypereutectic Al-20Si alloy. Mater. Sci. Eng. A 2018, 722, 47–57. [Google Scholar] [CrossRef]
- Mahmoud, M.G.; Samuel, A.M.; Doty, H.W.; Valtierra, S.; Samuel, F.H. Effect of Solidification Rate and Rare Earth Metal Addition on the Microstructural Characteristics and Porosity Formation inA356 Alloy. Adv. Mater. Sci. Eng. 2017, 2017, 5086418. [Google Scholar] [CrossRef]
- Ahmad, R.; Asmael, M.B.A.; Shahizan, N.R.; Gandouz, S. Reduction in secondary dendrite arm spacing in cast eutectic Al–Si piston alloys by cerium addition. Int. J. Miner. Metall. Mater. 2017, 24, 91–101. [Google Scholar] [CrossRef]
- Cardinale, A.M.; Parodi, N. R-Al-Si systems (R: Pr,Nd): Experimental investigation of phase equilibria in the Al-rich corner. J. Therm. Anal. Calorim. 2018, 134, 1327–1335. [Google Scholar] [CrossRef]
- Markoli, B.; Spaic, S.; Zupanic, F. The constitution of alloys in the Al-rich corner of the Al-Si-Sm ternary system. Z. Met. 2001, 92, 1098–1102. [Google Scholar]
- Cardinale, A.M.; Macciò, D.; Saccone, A. Phase Relationships of the R-Al-Si Systems: The Pr-Al-Si Isothermal Section at 500 °C. J. Therm. Anal. Calorim 2015, 121, 1151–1157. [Google Scholar] [CrossRef]
- Cardinale, A.M.; Macciò, D.; Saccone, A. Phase equilibria in the Sm–Al–Si system at 500 °C. J. Therm. Anal. Calorim. 2014, 116, 61–67. [Google Scholar] [CrossRef]
- Pukas, S.; Lasocha, W.; Gladyshevskii, R. Phase equilibria in the Er-Al-Si system at 873 K. Calphad 2009, 33, 23–26. [Google Scholar] [CrossRef]
- Murray, J.L.; McAlister, A.J. The Al-Si (Aluminum-Silicon) system. Bull. Alloy. Phase Diagrams 1984, 5, 74–84. [Google Scholar] [CrossRef]
- Okamoto, H. Supplemental Literature Review of Binary Phase Diagrams: Al-Bi, Al-Dy, Al-Gd, Al-Dy, C-Mn, Co-Ga, Cr-Hf, Cr-Na, Er-H, Er-Zr, H-Zr, and Ni-Pb. J. Phase Equilibria Diffus. 2014, 35, 343–354. [Google Scholar] [CrossRef]
- Kim, J.; Jung, I.H. Critical evaluation and thermodynamic optimization of the Si-RE systems: Part II. Si-RE system (RE= Gd, Dy, Dy, Ho, Er, Tm, Lu and Y). J. Chem. Thermodyn. 2015, 81, 273–297. [Google Scholar] [CrossRef]
- Cardinale, A.M.; Parodi, N.; Saccone, A. The 500 °C isothermal section of the Dy–Al–Si system and thermal behavior of selected Al-rich alloys. J. Therm. Anal Calorim. 2012, 108, 817–823. [Google Scholar] [CrossRef]
- Villars, P.; Cenzual, K. Pearson’s Crystal Data–Crystal Structure Database for Inorganic Compounds, Release 2021/22; ASM International: Materials Park, OH, USA, 2022. [Google Scholar]
- Van Vucht, J.H.N.; Buschow, K.H.J. On the binary aluminium-rich compounds of the rare-earth elements. Philips Res. Rep. 1964, 19, 319–322. [Google Scholar]
- Baenziger, N.C.; Hegenbarth, J.J. Gadolinium and dysprosium intermetallic phases. III. The structures of Gd3Al2, Dy3Al2, Gd5Ge3, Dy5Ge3 and DyAl3. Acta Crystallogr. 1964, 17, 620–621. [Google Scholar] [CrossRef]
- Mayer, I.; Felner, I. High- temperature x-ray study of rare-earth silicides. J. Less Comm. Met. 1972, 29, 25–31. [Google Scholar] [CrossRef]
- Holtzberg, F.; Gambino, R.J.; McGuire, T.R. New ferromagnetic 5:4 compounds in the rare earth silicon and germanium systems. J. Phys Chem Solids 1967, 28, 2283–2289. [Google Scholar] [CrossRef]
- Hohnke, D.; Parthè, E. AB Compounds with Sc, Y and Rare Earth Metals. II. FeB and CrB Type Structures of Monosilicides and Germanides. Acta Cryst. 1966, 20, 572–582. [Google Scholar] [CrossRef]
- Roger, J.; Guizouarn, T.; Hiebl, K.; Halet, J.F.; Guérin, R. Structural chemistry and physical properties of the rare earth silicide Dy3Si4. J. Alloys Compd. 2005, 394, 28–34. [Google Scholar] [CrossRef]
- Iandelli, A.; Palenzona, A.; Olcese, G.L. valence fluctuations of ytterbium in silicon-rich compounds. J. Less-Common Met. 1979, 64, 213–220. [Google Scholar] [CrossRef]
- Perri, J.A.; Banks, E.; Post, B. polymorphism of rare earth disilicides. Phys. Chem. 1959, 63, 2073–2074. [Google Scholar] [CrossRef]
- Kranenberg, C.; Johrendt, D.; Mewis, A. Investigations about the Stability Range of the CaAl2Si2 Type Structure in the Case of Ternary Silicides. Z. Anorg. Allg. Chem. 1999, 625, 1787–1793. [Google Scholar] [CrossRef]
- Bobev, S.; Tobash, P.H.; Fritsch, V.; Thompson, J.D.; Hundley, M.F.; Sarrao, J.L.; Fisk, Z. Ternary rare-earth alumino-silicides-single-crystal growth from Al flux, structural and physical properties. J. Solid State Chem. 2005, 178, 2091–2103. [Google Scholar] [CrossRef]
- Dubenko, I.S.; Evdokimov, A.A.; Ionov, V.M. Crystal structure of Dy6Al3Si. Sov. Phys. Crystallogr. 1987, 32, 201–203. [Google Scholar]
- Pukas, S.; Lutsyshyn, Y.; Manyako, M.; Gladyshevskii, E. Crystal structures of the RAlSi and RAlGe compounds. J. Alloys Compd. 2004, 367, 162–166. [Google Scholar] [CrossRef]
- He, W.; Zhang, J.; Zeng, L. New structure of the ternary compound DyAlSi. J. Alloys Compd. 2006, 424, 105–107. [Google Scholar] [CrossRef]
- Nolze, G.; Kraus, W. Powder Cell for Windows; Federal Institute for Materials Research and Testing: Berlin, Germany, 1999. [Google Scholar]
- King, G. Schwarzenbach LatconD. Xtal3.7 System; Hall, S.R., du Boilay, D.J., Olthof-Hazekamp, R., Eds.; University of Western Australia: Crawley, Australia, 2000. [Google Scholar]
- Meschel, S.V.; Kleppa, O.J. Standard enthalpies of formation of some carbides, silicides, germanides, stannides and borides of Dysprosium by high temperature direct synthesis calorimetry. J. Alloys Compd. 1996, 233, 272–278. [Google Scholar] [CrossRef]


Disclaimer/Publisher’s Note: The statements, opinions and data contained in all publications are solely those of the individual author(s) and contributor(s) and not of MDPI and/or the editor(s). MDPI and/or the editor(s) disclaim responsibility for any injury to people or property resulting from any ideas, methods, instructions or products referred to in the content. |
© 2023 by the authors. Licensee MDPI, Basel, Switzerland. This article is an open access article distributed under the terms and conditions of the Creative Commons Attribution (CC BY) license (https://creativecommons.org/licenses/by/4.0/).