Article

Effect of Nano-Y2O3 on the Microstructure and Properties of Fe-Cr-C-N-Al Surfacing Alloy

Department of Materials Science and Engineering, Shenyang University of Technology, Shenyang 110870, China
*
Author to whom correspondence should be addressed.
Crystals 2023, 13(7), 1023; https://doi.org/10.3390/cryst13071023
Submission received: 3 June 2023 / Revised: 22 June 2023 / Accepted: 26 June 2023 / Published: 28 June 2023

Abstract

:
In this paper, Fe-Cr-C-N-Al-Y wear-resistant surfacing alloy was prepared by open-arc surfacing with self-shielded flux-cored wire. The wear properties of the surfacing alloy were analyzed using an MLS-23 rubber wheel wet sand wear tester. The phase composition and microstructure of the surfacing alloy were analyzed using X-ray diffraction, scanning electron microscope, electron backscatter diffraction and transmission electron microscope; the strengthening mechanism and wear mechanism of the alloy were discussed. The results show that the microstructure of Fe-Cr-C-N-Al-Y surfacing alloy is composed of M + γ-Fe + M7C3 + AlN. When the content of nano-Y2O3 is 0.456 wt.%, the formability of the surfacing alloy is the best, and the wetting angle is the smallest, which is 50.8°; AlN and M7C3 precipitate the most, and the microstructure grain is the smallest. At this time, the hardness value of the surfacing alloy is up to 62.3 HRC, which is 11.8% higher than that of the unmodified surfacing alloy. The minimum wear weight loss is 0.125 g, and the wear resistance is increased by 41.86%. The wear mechanism of the surfacing alloy is mainly a plastic deformation mechanism, and the material removal processes are microcutting and furrow wear. This study provides theoretical guidance for refining primary carbides and improving the wear resistance of high chromium cast iron.

1. Introduction

With the continuous progress of industrial civilization and science and technology, higher requirements are put forward for the performance of materials. Wear, corrosion and fatigue constitute three forms of mechanical parts failure. The energy consumption and economic loss caused by the wear of mechanical parts are particularly serious [1,2,3]. With the rapid development of industry, how to improve the wear resistance of mechanical parts and increase the service life of parts is very important and of great economic significance [4,5,6,7,8]. Fe-Cr-C surfacing alloy will generate a large number of M7C3 primary carbides in the structure. This high-hardness carbide can effectively improve the wear resistance of the surfacing layer and is very suitable for abrasive wear and erosion wear environment. However, large primary carbides are very easy to peel off, which greatly limits the application environment of Fe-Cr-C surfacing alloys [9,10]. In recent years, many scholars have found the use of cheap N elements instead of some C elements and the use of in situ self-generating technology to form fine nitrides in the surfacing process. The formation of nitrides can effectively refine the microstructure, increase the hardness of the surfacing alloy and effectively improve the wear resistance of the surfacing alloy [11,12]. In order to improve the wear resistance of Fe-Cr-C surfacing alloy, Wei et al. introduced titanium carbonitride in situ and deposited a TiC-Tix(C, N)y coating on the surface of ASTM G3101 steel with gas-shielded welding [13]. The results show that the formation of Tix(C, N)y carbonitride can effectively prevent the wear of the matrix and stop the dislocation sliding. Therefore, the titanium-carbonitride-reinforced coating has high hardness and excellent wear resistance under dry sliding wear test conditions.
In situ synthesis technology is simple, which is of great help to improve the wear resistance of iron-based surfacing materials, and has been of deep interest to domestic and foreign scholars [14,15,16]. Li et al. prepared an iron-based surfacing layer containing M7C3 and NbC in situ and studied the effect of NbC content on the microstructure and wear resistance of iron-based composites [17]. It was found that α-(Fe, Cr), (Fe, Cr) C3 and NbC existed in all the surfacing layers. NbC is formed by the chemical reaction of Nb and C in the molten pool. With the increase in NbC content, the size and quantity of NbC increase obviously. The shape of the hard phase also gradually changed from square to petal. In addition, with the increase in NbC content, the average microhardness increased from 819.3 HV0.2 (5 wt.%) to 900.5 HV0.2 (20 wt.%).
Nanometer rare earth oxide is a compound that is mainly used to improve the surface properties of materials. Because of its good physical and chemical properties, such as special electronic structure, good chemical activity and large ionic radius, it can be used as a grain refiner in surfacing alloys [18,19,20,21,22,23,24]. Adding an appropriate amount of nano rare earth oxide to the surfacing material may cause grain refinement and reduce crack sensitivity, thereby improving the hardness, wear resistance and corrosion resistance of the surfacing alloy surface. Chen et al. prepared TiC/Co-based coatings with different contents of nano-CeO2 additives on ferritic steel using laser surface cladding technology [25]. It is reported that the addition of nano rare earth oxides creates new conditions for the nucleation of precipitated phases. Due to the uniform distribution of the precipitated phase, the coating with 1.5 wt.% CeO2 exhibits high corrosion resistance, high microhardness and high wear resistance. Yun et al. prepared a hypereutectic Fe-Cr-C surfacing layer using flux-cored wire arc surfacing and studied the effect of different Y2O3 additives on the wear resistance of the hypereutectic Fe-Cr-C surfacing layer [26]. The results showed that the microstructure of the surfacing layer is composed of primary (Cr, Fe)7C3 and eutectic structure [A + (Cr, Fe)7C3]. Due to the small size of nano-Y2O3, it will lead to Y2O3 as a heterogeneous nucleation particle to refine the grain and reduce the crack sensitivity, thus improving the wear resistance, hardness and other mechanical properties of the surfacing alloy.
Abrasive wear is one of the most common wear phenomena of agricultural machinery, such as plowshare. The main way to deal with it is by surfacing a layer of Fe-Cr-C alloy on the worn parts by means of repair welding. However, the failure of plowshare after surfacing is mainly caused by the breakage and fracture of carbides and the shedding of matrix materials. Therefore, it is an important way to improve the service life of agricultural machinery by refining the hardfacing alloy carbides and improving the bonding strength between the hard phase and the matrix. Currently, the alloying elements used to optimize the Fe-Cr-C surfacing alloy are expensive. In this paper, the low-cost Al, N element is used to replace the expensive alloying elements, the addition of nano-Y2O3 in the surfacing alloy can be used as a heterogeneous nucleation particle of the hard phase to refine the M7C3 eutectic carbide, and the wear resistance of the surfacing alloy is improved. At present, Fe-Cr-C-N-AL hardfacing alloys have not been widely studied. In this study, Fe-Cr-C-N-Al-Y wear-resistant surfacing alloys were prepared using open-arc surfacing with self-shielded flux-cored wire. The effects of rare earth oxide Y2O3 on the microstructure and wear resistance of Fe-Cr-C-N surfacing alloys were studied.

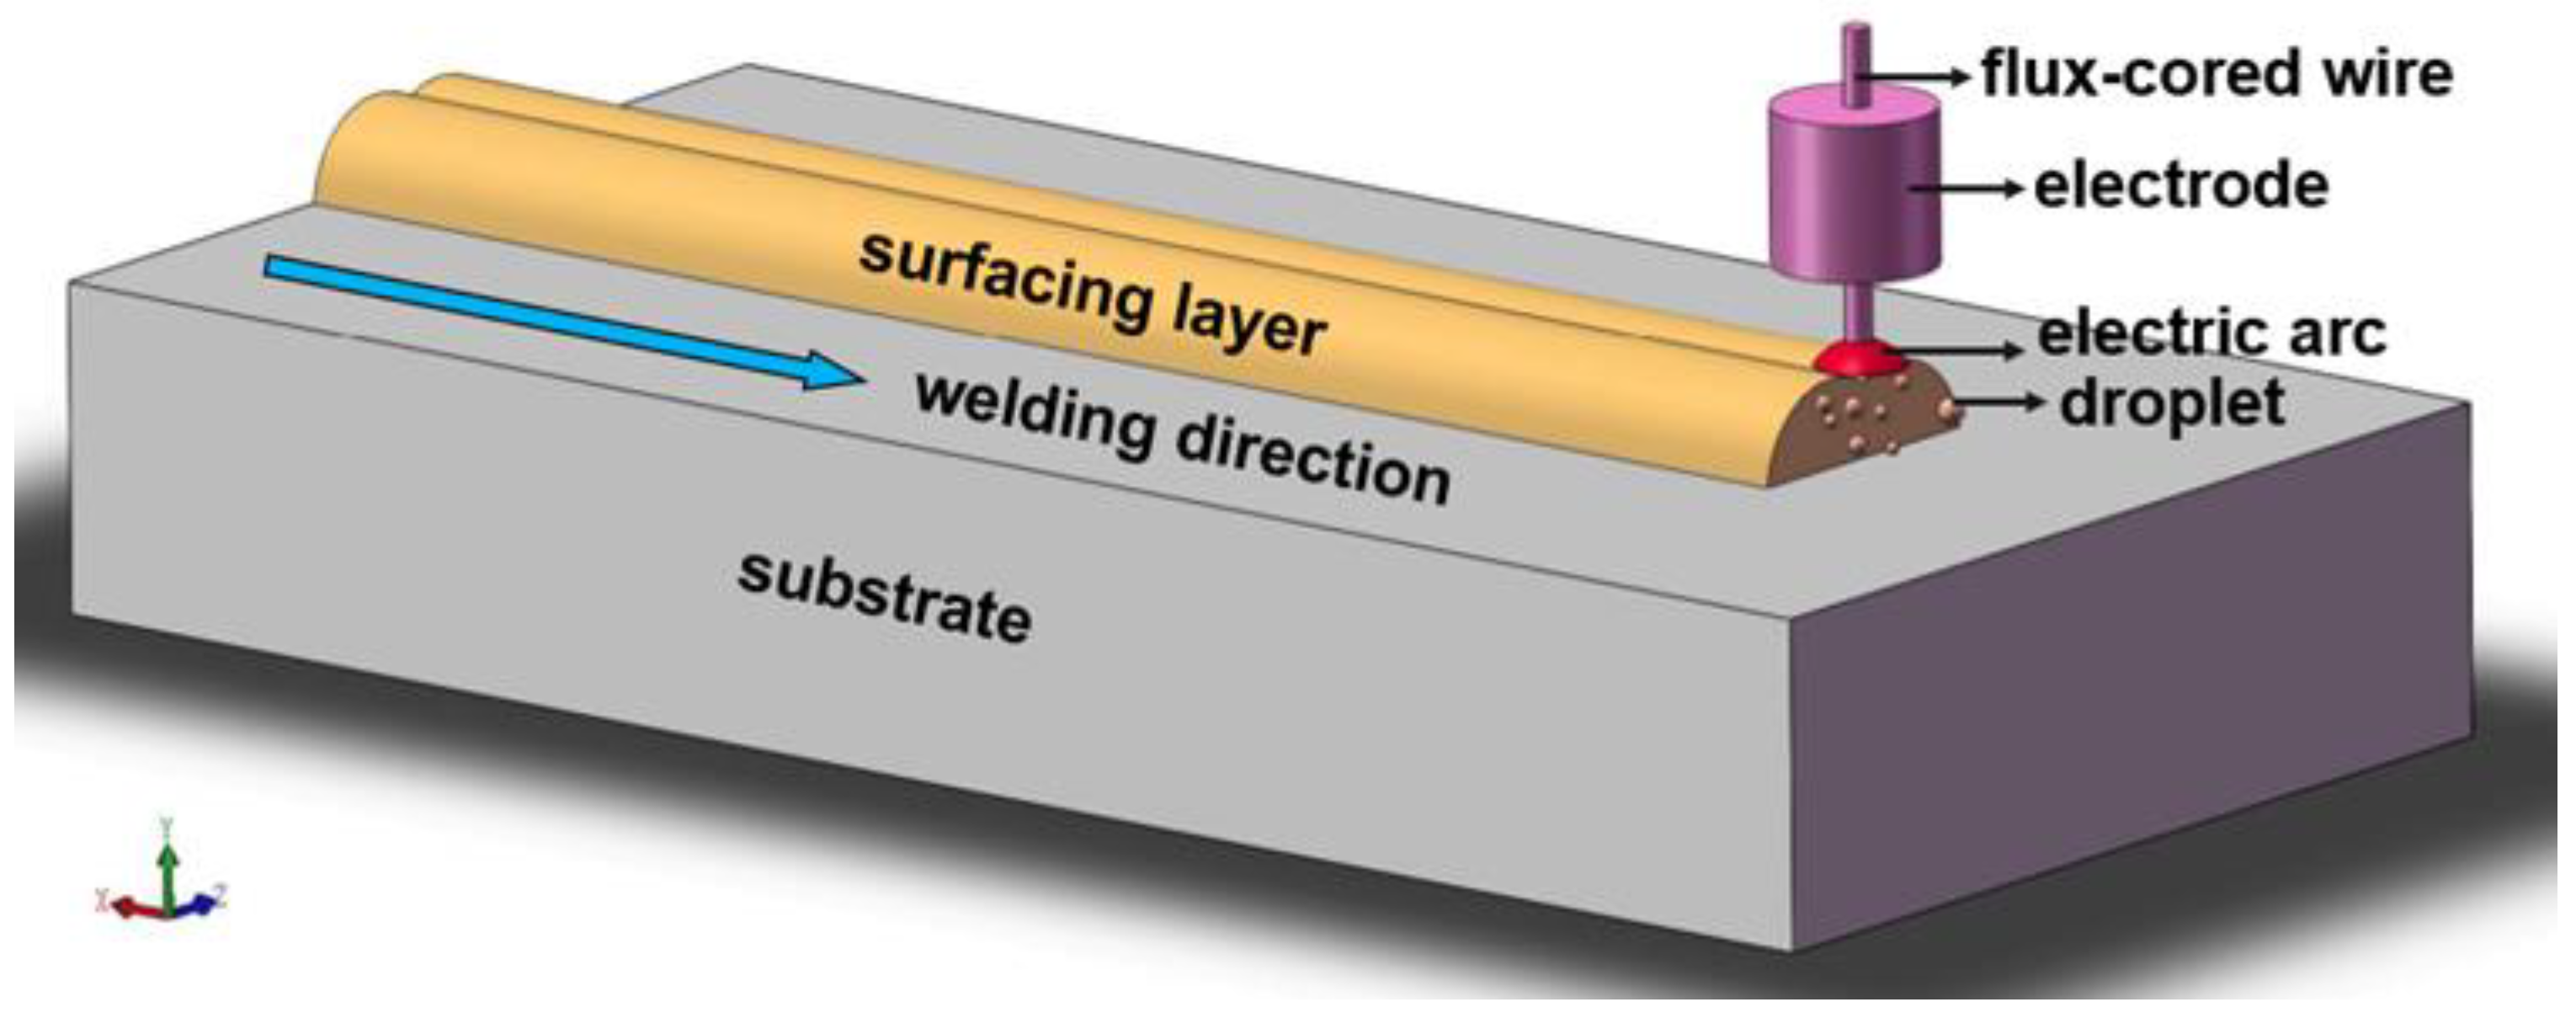
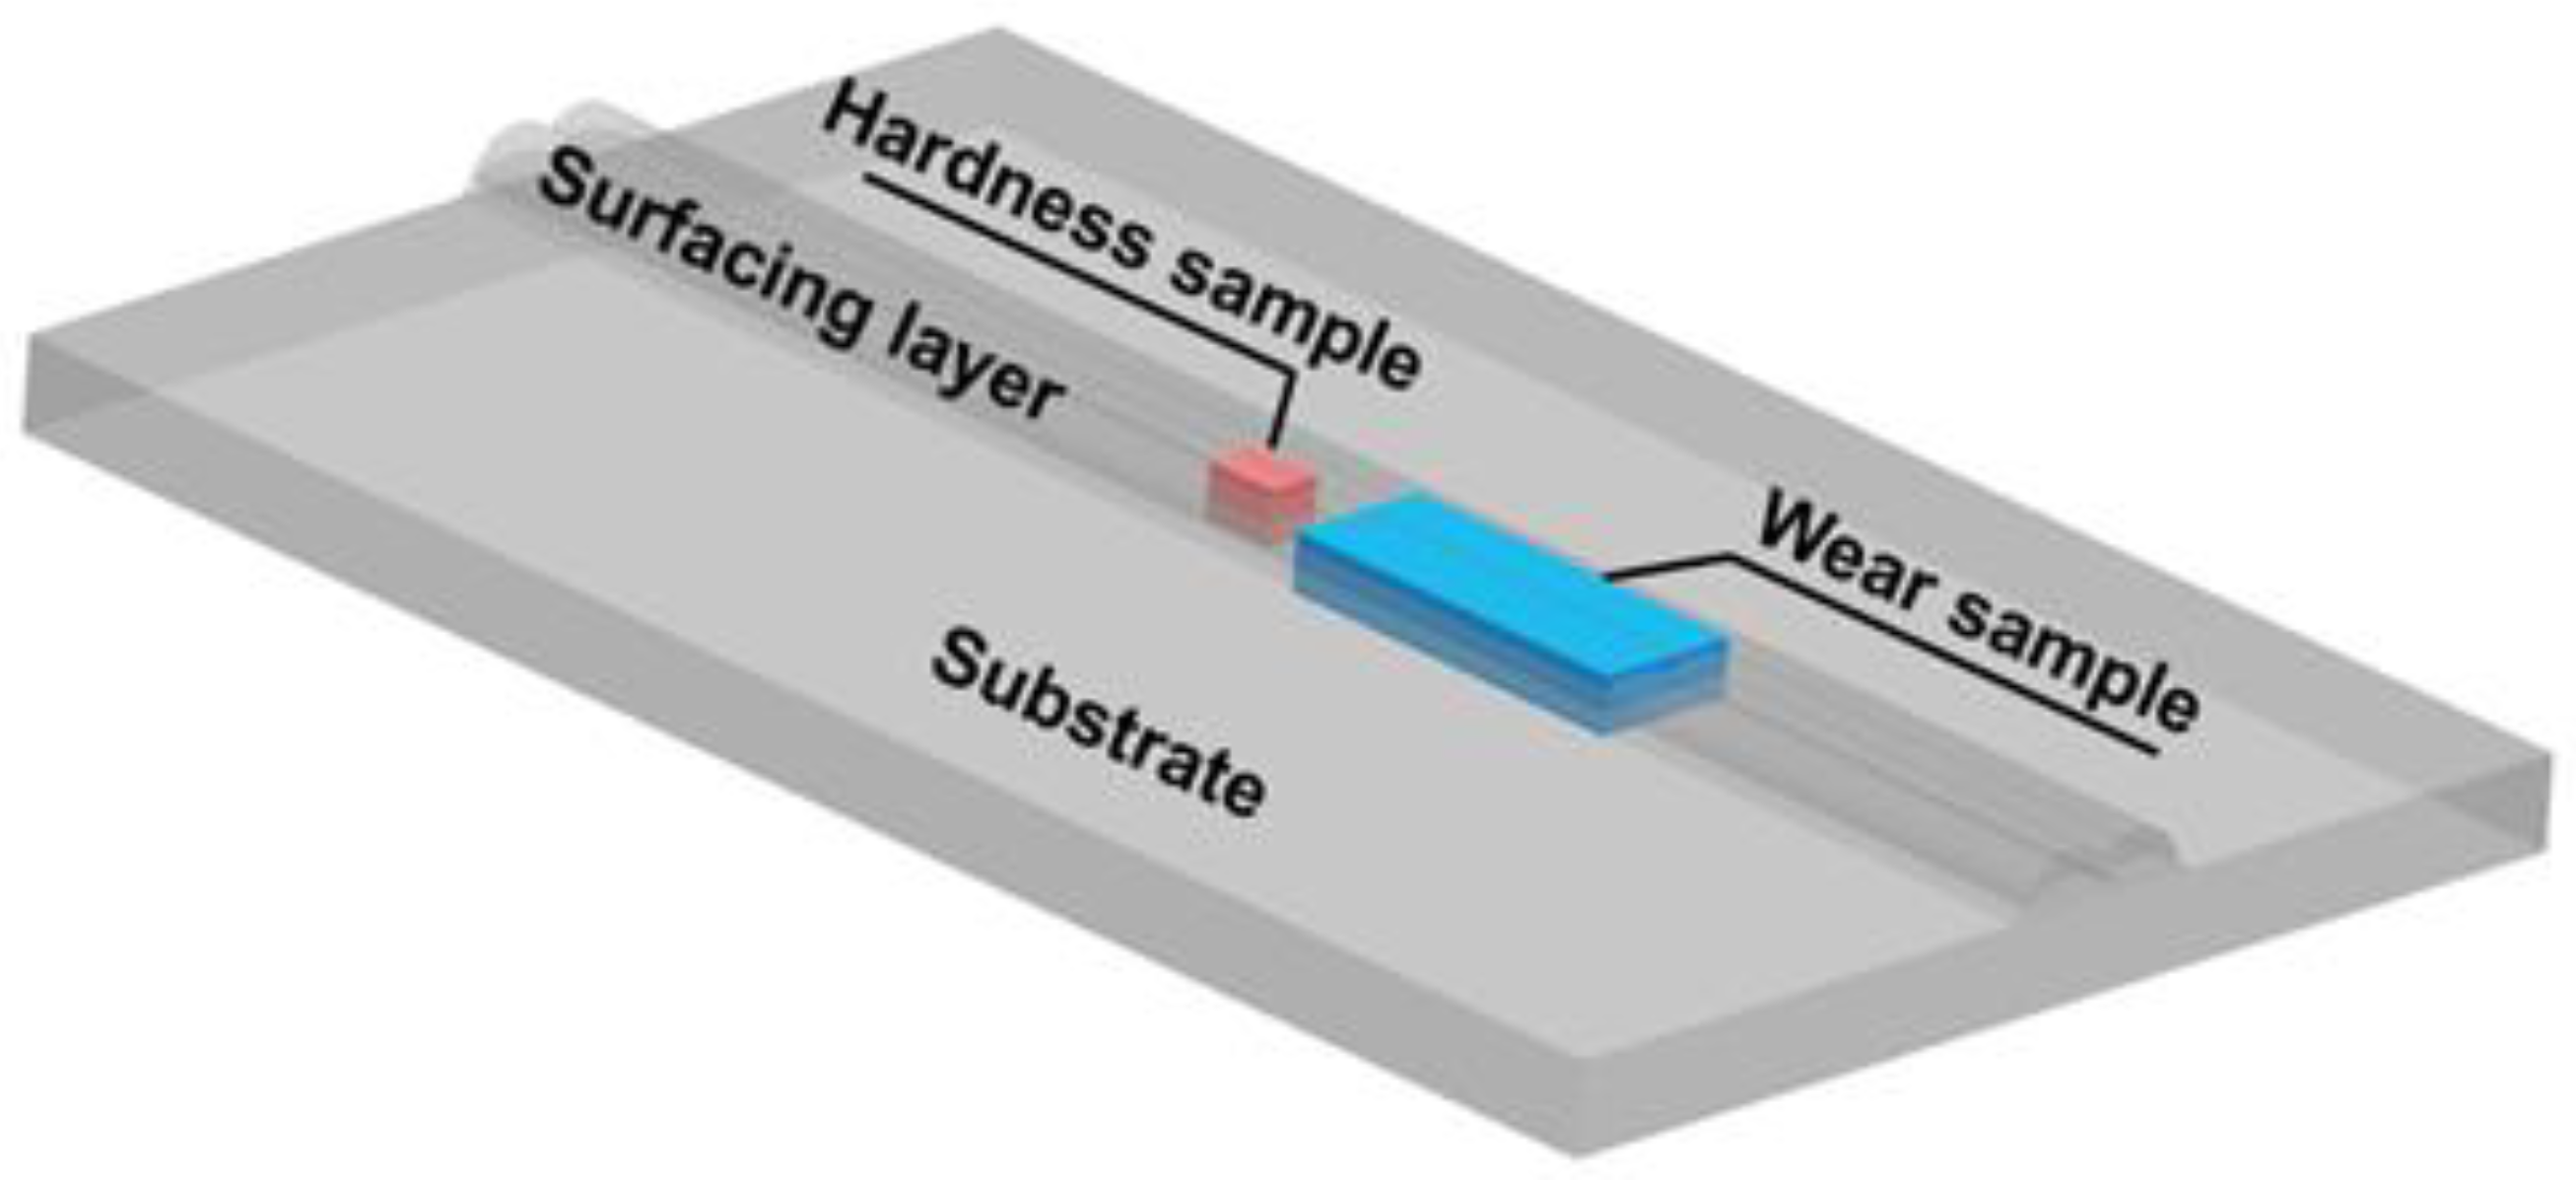
2. Experimental Process

Preparation of Surfacing Alloy

A self-shielded flux-cored wire was used in the surfacing experiment, and the core composition was alloy powder and mineral powder. The core composition mainly includes high carbon ferrochrome, chromium nitride, graphite, aluminum powder, reduced iron powder (90–120 mesh) and spheroidized nano-Y2O3 powder (50–100 nm, purity 99.9%). The powder required for flux-cored wire is filtered through a sieve to remove large particles of powder and impurities. We put the filtered powder into the electrode drying furnace to dry and remove the moisture. After that, the filtered powder was placed in a planetary ball mill at 250 rpm, running for 5 min, so that the powder was stirred evenly, which was conducive to maintaining welding stability and ensuring the homogenization of the microstructure of the surfacing layer. The outer skin of the flux-cored wire is H08A steel strip, and the base material is Q235 steel; the composition is shown in Table 1. The production process of flux-cored wire is the rolling-drawing method, which is simple in operation, high in production efficiency and good in wire forming quality. The diameter of the welding wire is reduced from Φ4.0 mm to Φ3.2 mm, Φ2.7 mm and Φ2.4 mm by four groups of reducing machines. The filling rate of the self-shielded wear-resistant surfacing flux-cored wire is about 38%. According to the preliminary experiment, the slag system of self-shielded welding wire for the surfacing experiment was determined by considering factors such as metal formability, splash, porosity and crack of the surfacing layer. The specific composition is shown in Table 2.
The open-arc surfacing experiment was carried out on a Q235 substrate by MZC-1250 AC automatic submerged arc welding machine to prepare surfacing alloys with different compositions. The welding diagram is shown in Figure 1, and the chemical composition of surfacing alloys is shown in Table 3. In order to reduce the dilution rate, a two-layer four-pass surfacing method was used to ensure that the microstructure of the top layer of the surfacing alloy was not affected by the substrate. After welding, enough cooling time should be maintained, and the interlayer temperature should be controlled at about 200 °C to prevent cracks. The overlap rate is between 35% and 50%. After machining, the microstructure and properties were tested. In this experiment, the content of nano-Y2O3 in self-shielded flux-cored wire was 0.114 wt.%, 0.228 wt.%, 0.342 wt.%, 0.456 wt.% and 0.570 wt.%, respectively. Due to the low addition of nano-Y2O3 and the large heat input during the surfacing process, it is easy to cause some nano-Y2O3 to burn. This will lead to a deviation in the measurement of Y content in the surfacing alloy. Therefore, the Y content in the surfacing alloy is expressed by the amount of Y2O3 added to the flux-cored wire.
The surfacing alloy was machined to obtain the experimental specimens of microstructure characterization and mechanical properties. The position of the specimen is shown in Figure 2. The phase composition of the surfacing alloy was analyzed using a Brooke D8 X-ray diffractometer. The test parameters: CuKα target, tube voltage 50 KV, scanning range 20–100°, scanning speed 4°/min. The microstructure, phase distribution and wear morphology of the surfacing alloy were observed by optical microscope and scanning electron microscope, and the composition of the precipitated phase was analyzed using an energy-dispersive spectrometer equipped with a scanning electron microscope.
The Compact field emission scanning electron microscope equipped with a symmetry probe was used to analyze the samples using the electron backscatter diffraction (EBSD) technique. The results were analyzed using Channel 5 software to analyze the grain size and volume fraction of the precipitated phase in the surfacing alloy. The preparation method of the EBSD sample is as follows: the polished sample is electropolished in 10% perchloric acid alcohol solution with a voltage of 30 V and a time of 30 s.
The microstructure of the surfacing alloy samples was observed using a transmission electron microscope (TEM). The type and structure of the precipitated phases in the surfacing alloy were determined using selected area electron diffraction (SAED), and the composition of the precipitated phases was determined by an energy spectrometer.
The surface hardness of the surfacing alloy was measured using an HRC-150 Rockwell hardness tester. The microhardness of the side of the surfacing alloy was tested using a Vickers hardness tester under the condition of loading 1 kg and loading time 15 s. The abrasive wear experiment was carried out using a rubber wheel wet sand wear tester, and the schematic diagram is shown in Figure 3. The experimental parameters are as follows: the number of rubber wheels is 240 rpm, the wear time is 3 min, and the maximum positive pressure of the rubber wheel is 23 kg.

3. Results and Discussion

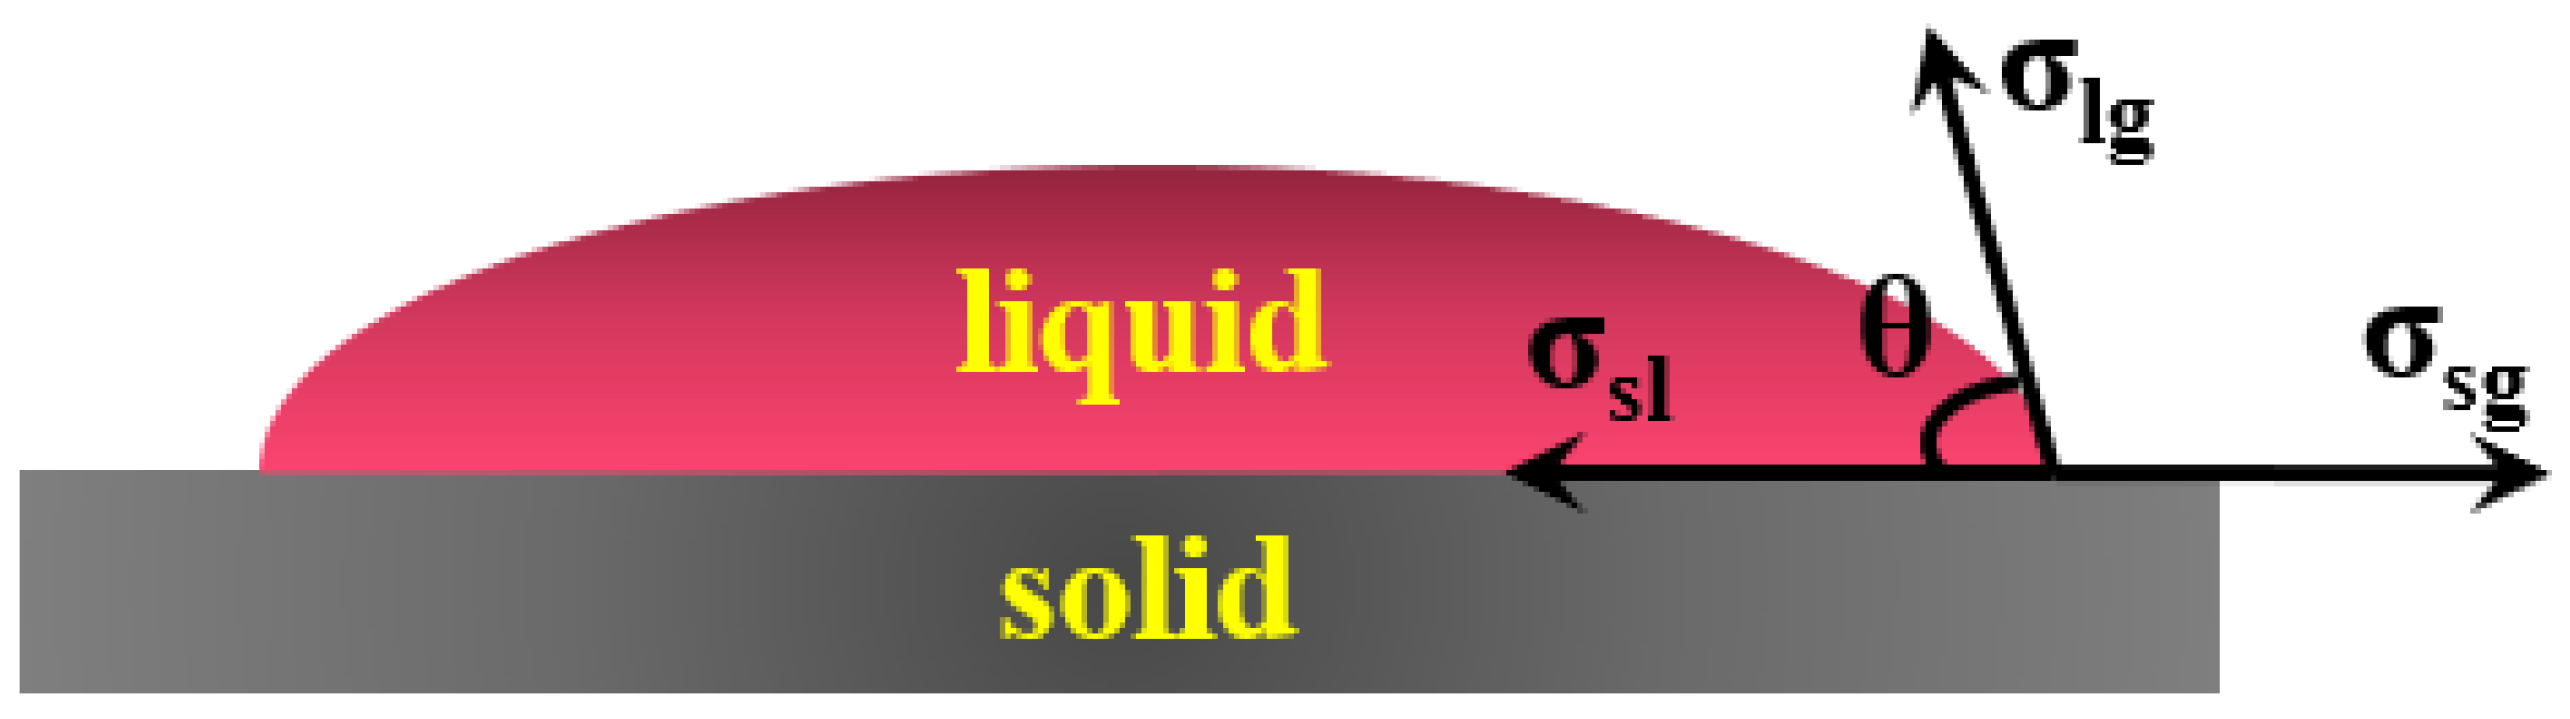
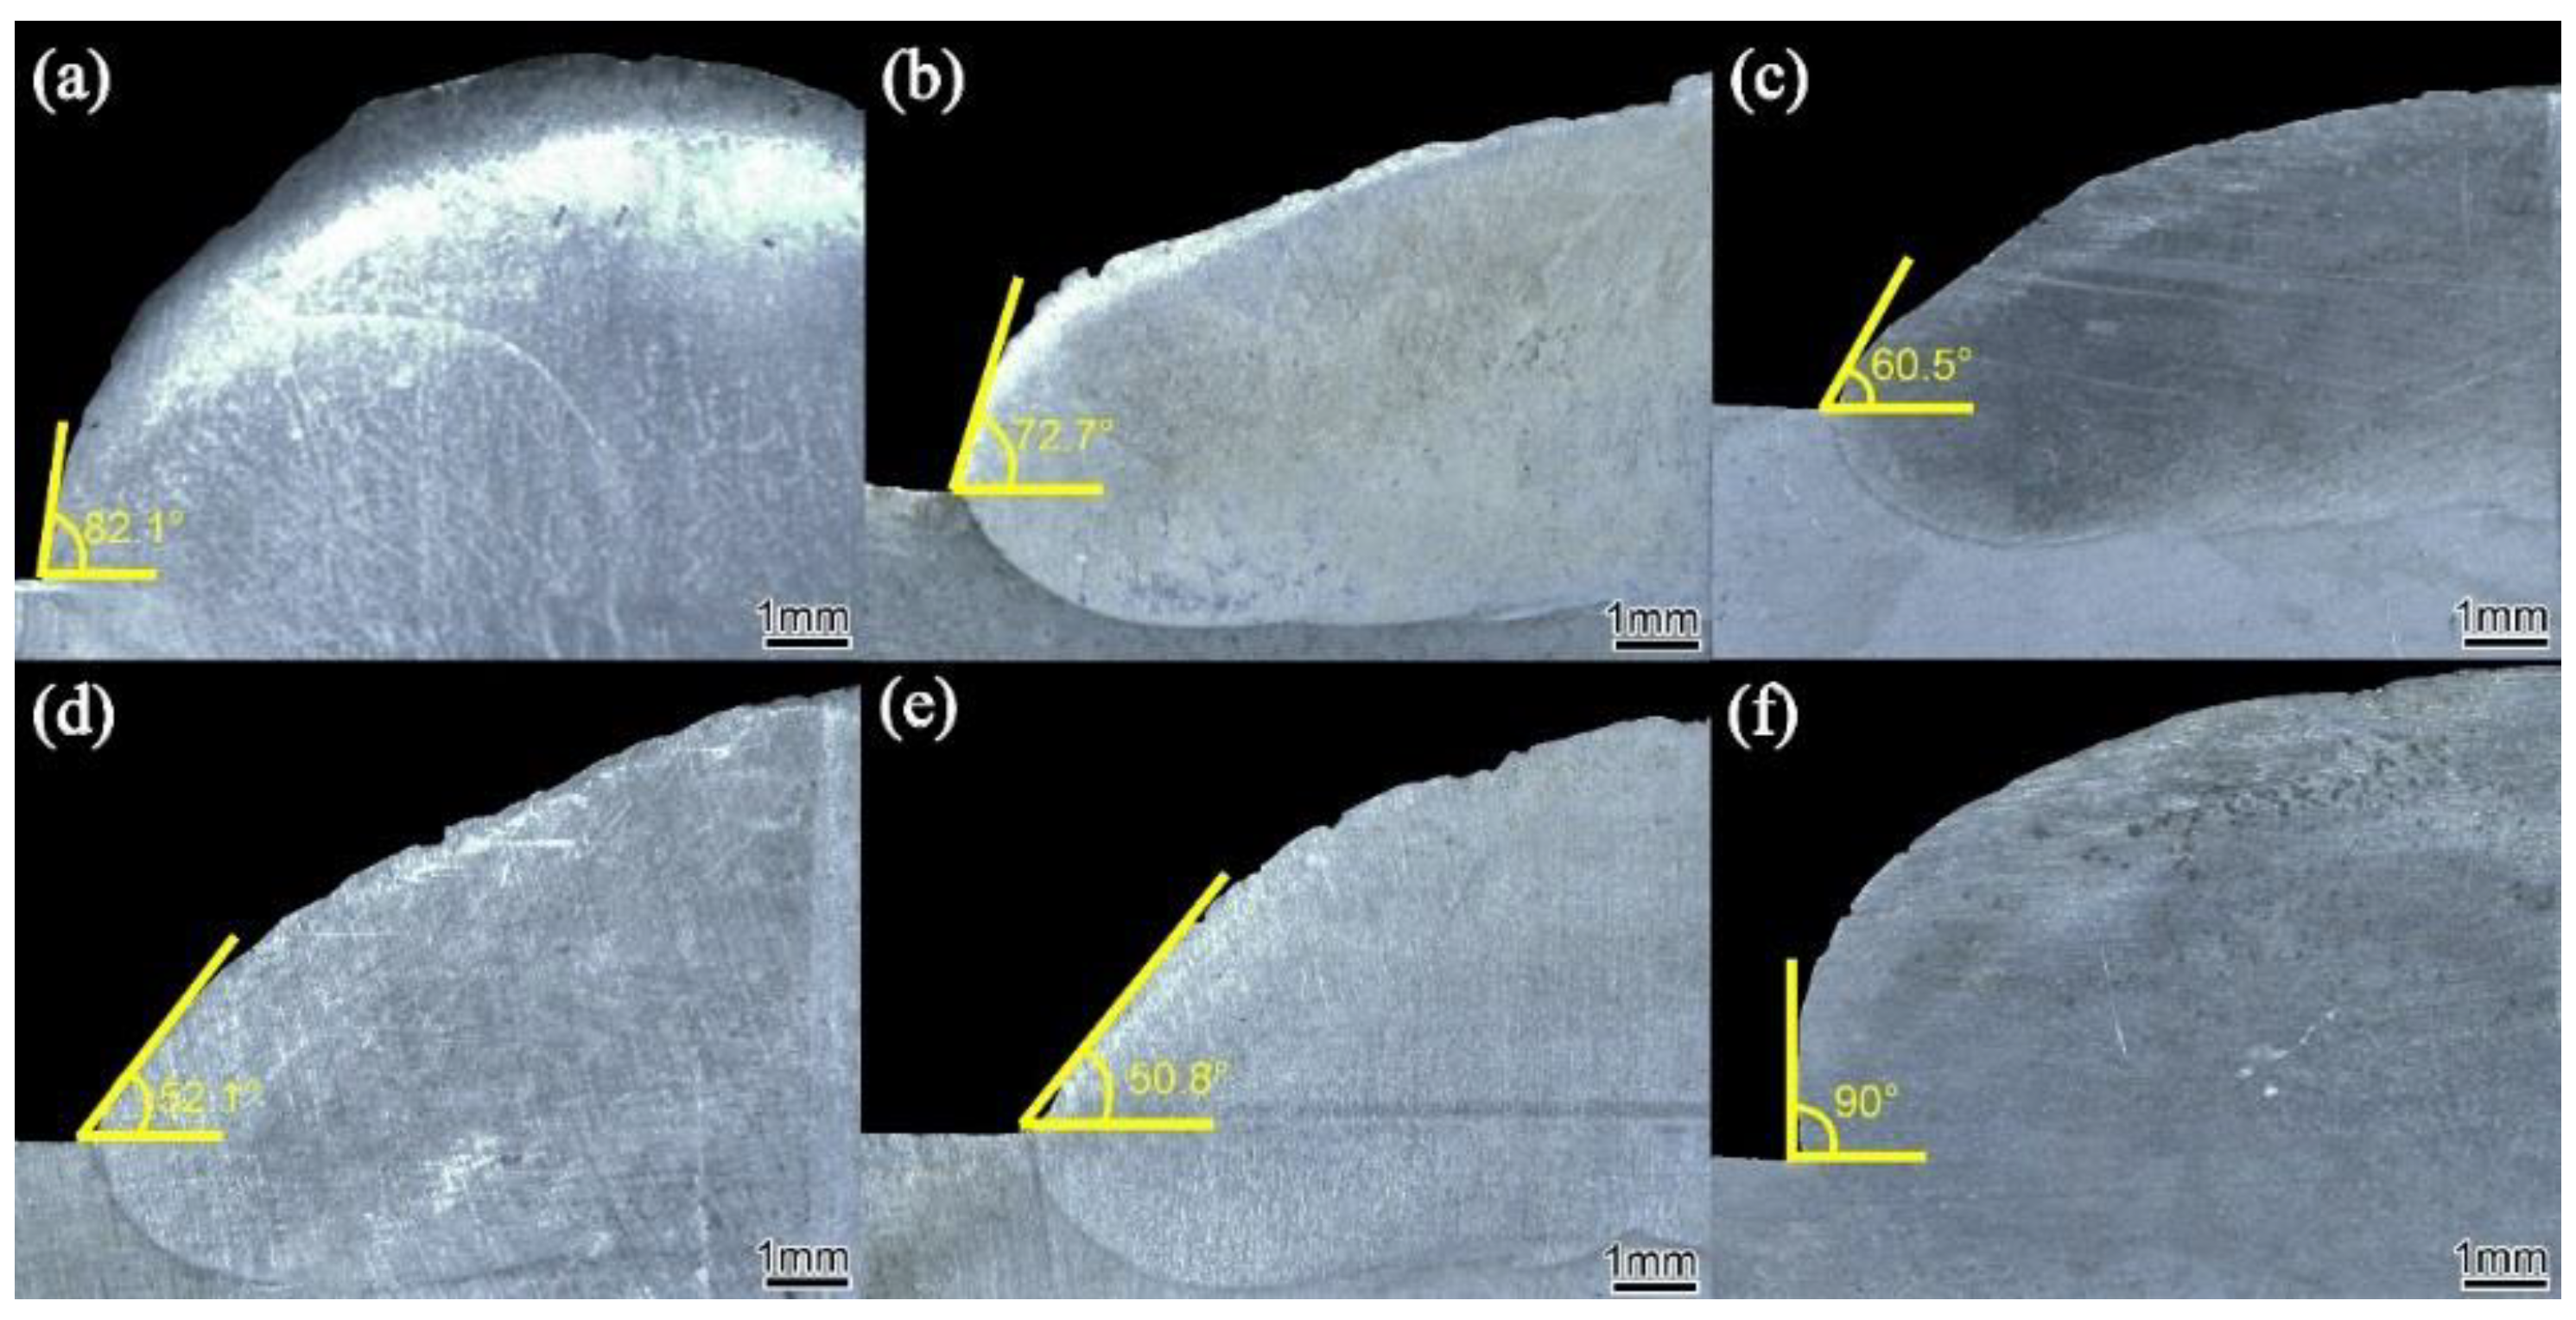
3.1. Formability Analysis
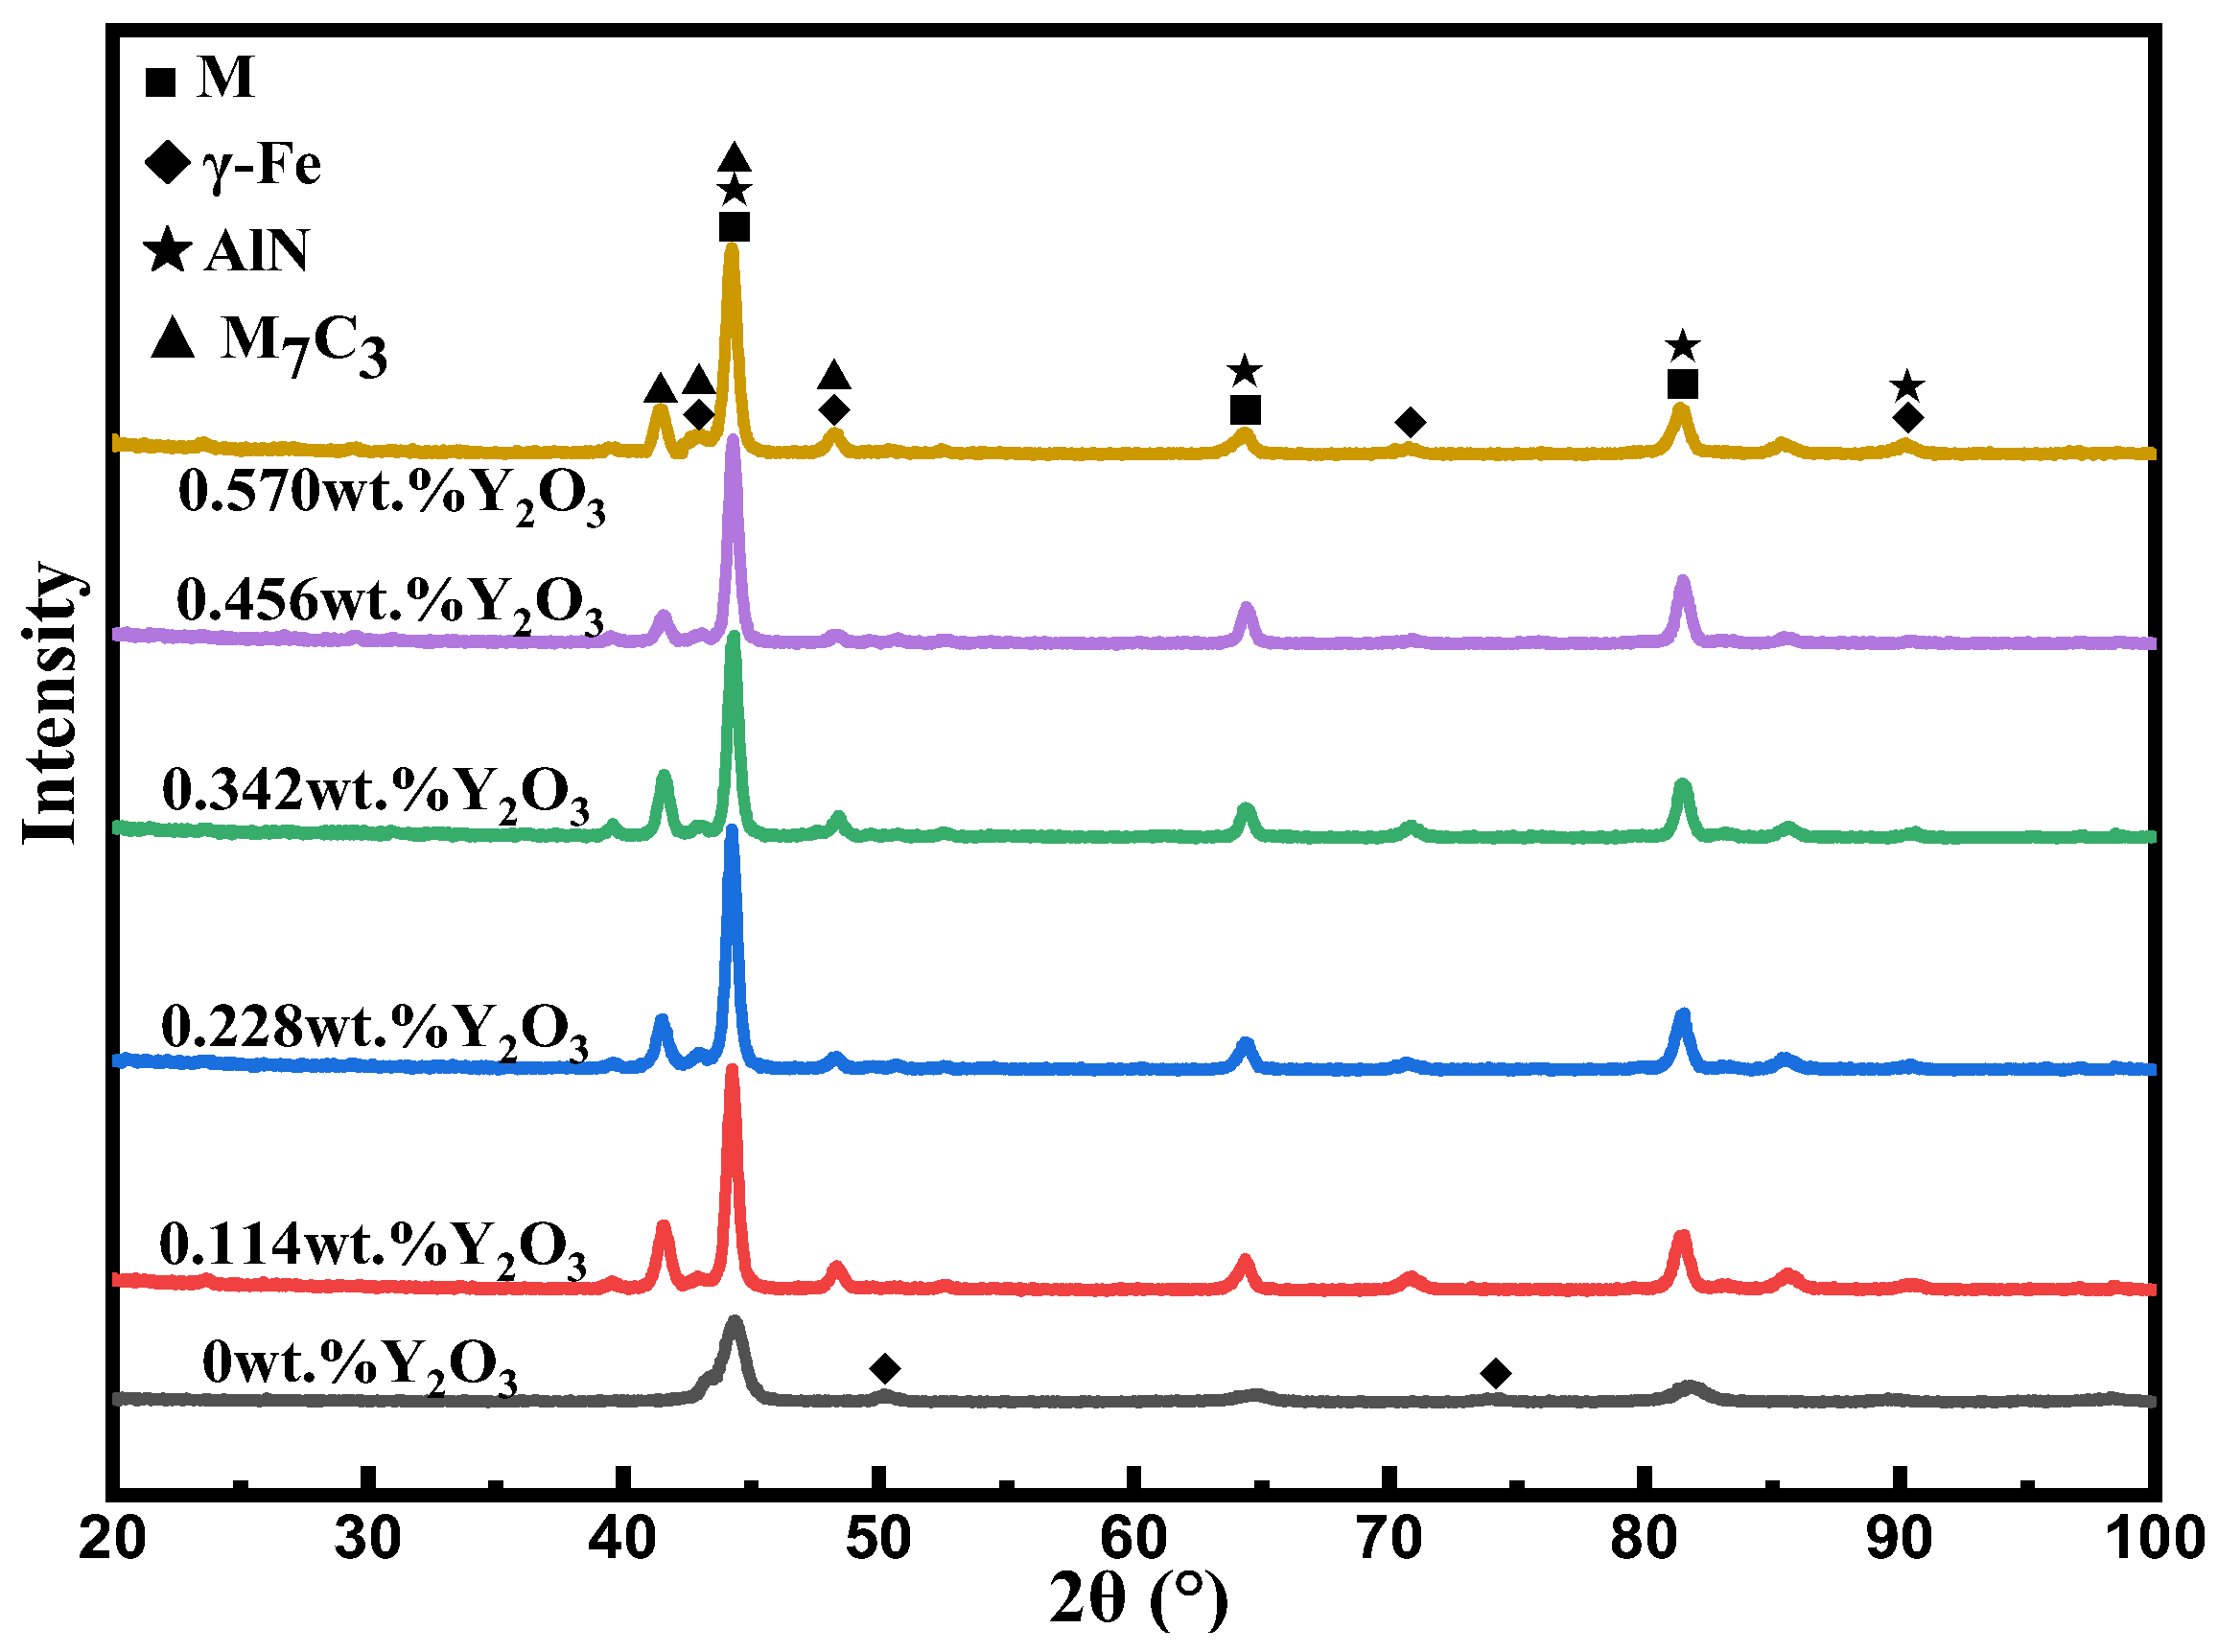
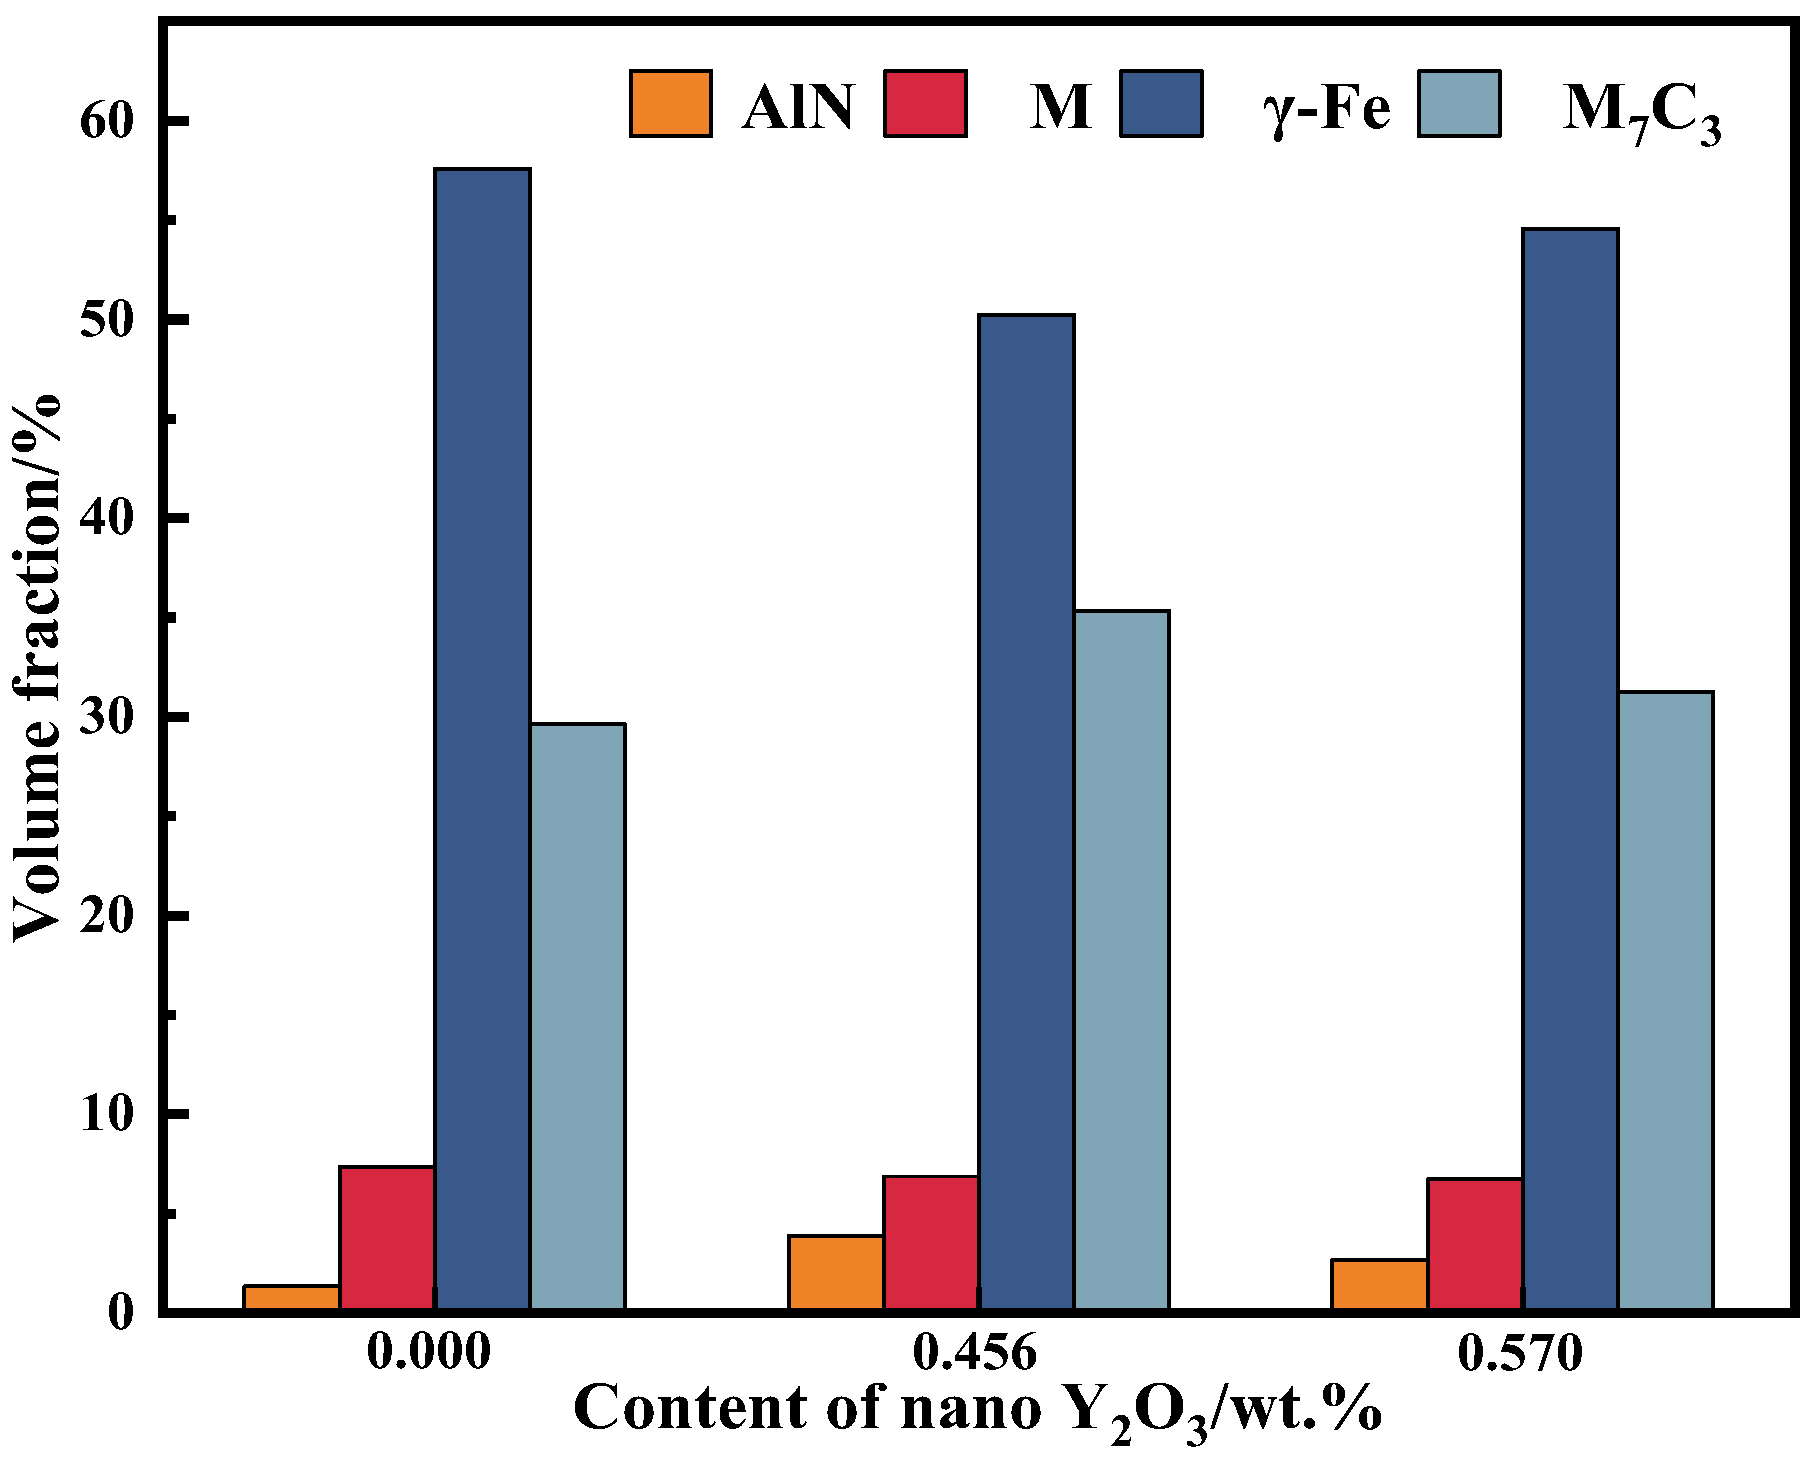
Wetting refers to the process in which one fluid on a solid surface is replaced by another fluid. The schematic diagram is shown in Figure 4. The basic wetting can be expressed by the Young–Dupre equation [27]:
c o s   θ = σ s g     σ s l / σ l g
In the formula, θ is the wetting angle; σsg is the surface tension of the solid; σsl is the solid–liquid interfacial tension; σlg is the liquid surface tension. The smaller the θ, the better the wettability. The wettability depends on the surface tension of the solid, the solid–liquid interface tension and the liquid surface tension. For liquid, the lower the surface tension, the better the wettability [28,29].
The addition of rare earth elements in the surfacing alloy can also improve the fluidity and wettability of the metal-based composite powder, eliminate defects such as pores and improve the macroscopic formability of the weld [30,31]. Figure 5 is the cross-section morphology of the surfacing alloy with a different nano-Y2O3 content perpendicular to the welding direction.
With the increase in nano-Y2O3 addition from 0 wt.% to 0.456 wt.%, the wetting angle decreases to a minimum of 50.8°, and the formability of the surfacing alloy is good. In the welding droplet transfer, the smaller the wetting angle, the lower the surface tension, which makes the alloy elements in the molten pool easier to transfer to the matrix so that the matrix and the surfacing layer are closely combined, and the amount of hard phase precipitation is large [32]. When the addition of nano-Y2O3 is 0.570 wt.%, the wetting angle of the surfacing alloy increases to 90°, and the formability becomes worse. The reason is that nano-Y2O3 is added to the deposited metal as an oxide dispersion particle. With the increase in the nano-Y2O3 content, the conductivity and thermal conductivity of the deposited metal decrease, thereby reducing the surface tension of the molten pool metal and reducing the wetting angle, which will lead to the improvement of the wettability between the molten pool metal and the base metal. Therefore, adding an appropriate amount of nano-Y2O3 can obtain a surfacing alloy with good forming quality.

3.2. Phase Analysis

Figure 6 is the XRD diffraction pattern of the surfacing alloy with different contents of nano-Y2O3. It can be found that the matrix structure of the surfacing alloy is composed of retained austenite (γ-Fe) (PDF 89-4185) and martensite M (PDF 85-1410), and the hard phase is mainly composed of M7C3 (PDF 89-7244) eutectic carbide and AlN (PDF 88-2250). It can be found that the base microstructure of the surfacing alloy is composed of retained austenite (γ-Fe) and M, and the hard phase is mainly composed of M7C3 and AlN. The addition of nano-Y2O3 has little effect on the phase composition of the surfacing alloy. However, compared with the surfacing alloy without the nano-Y2O3 additive, the diffraction peaks of γ-Fe in the surfacing alloy with nano-Y2O3 additive shifted from 49.9° and 73.84° to 48.26° and 70.76°, respectively. According to Bragg’s law:
2 d s i n   θ = λ
In the formula, λ is the wavelength of the X-ray, d is the interplanar spacing, and θ is the diffraction angle. In the experiment, the diffraction condition of the X-ray diffraction experiment is constant. The decrease in the diffraction angle leads to the increase in γ-Fe crystal plane spacing d, resulting in lattice distortion. This is because the atomic radius of the Y atom is 2.27 Å. With the larger atomic radius Y occupying the γ-Fe lattice position, the lattice distortion energy increases significantly, the solid solution strengthening effect increases, and the strength of the surfacing alloy matrix is improved [33]. With the addition of a nano-Y2O3 additive, M7C3 has an obvious diffraction peak at 41.5°. This shows that the addition of nano-Y2O3 changes the growth orientation of M7C3. However, no diffraction peak of nano-Y2O3 was found in the X-ray diffraction pattern, which may be due to the fact that the content of rare earth elements added is lower than the limit value that XRD equipment can detect.

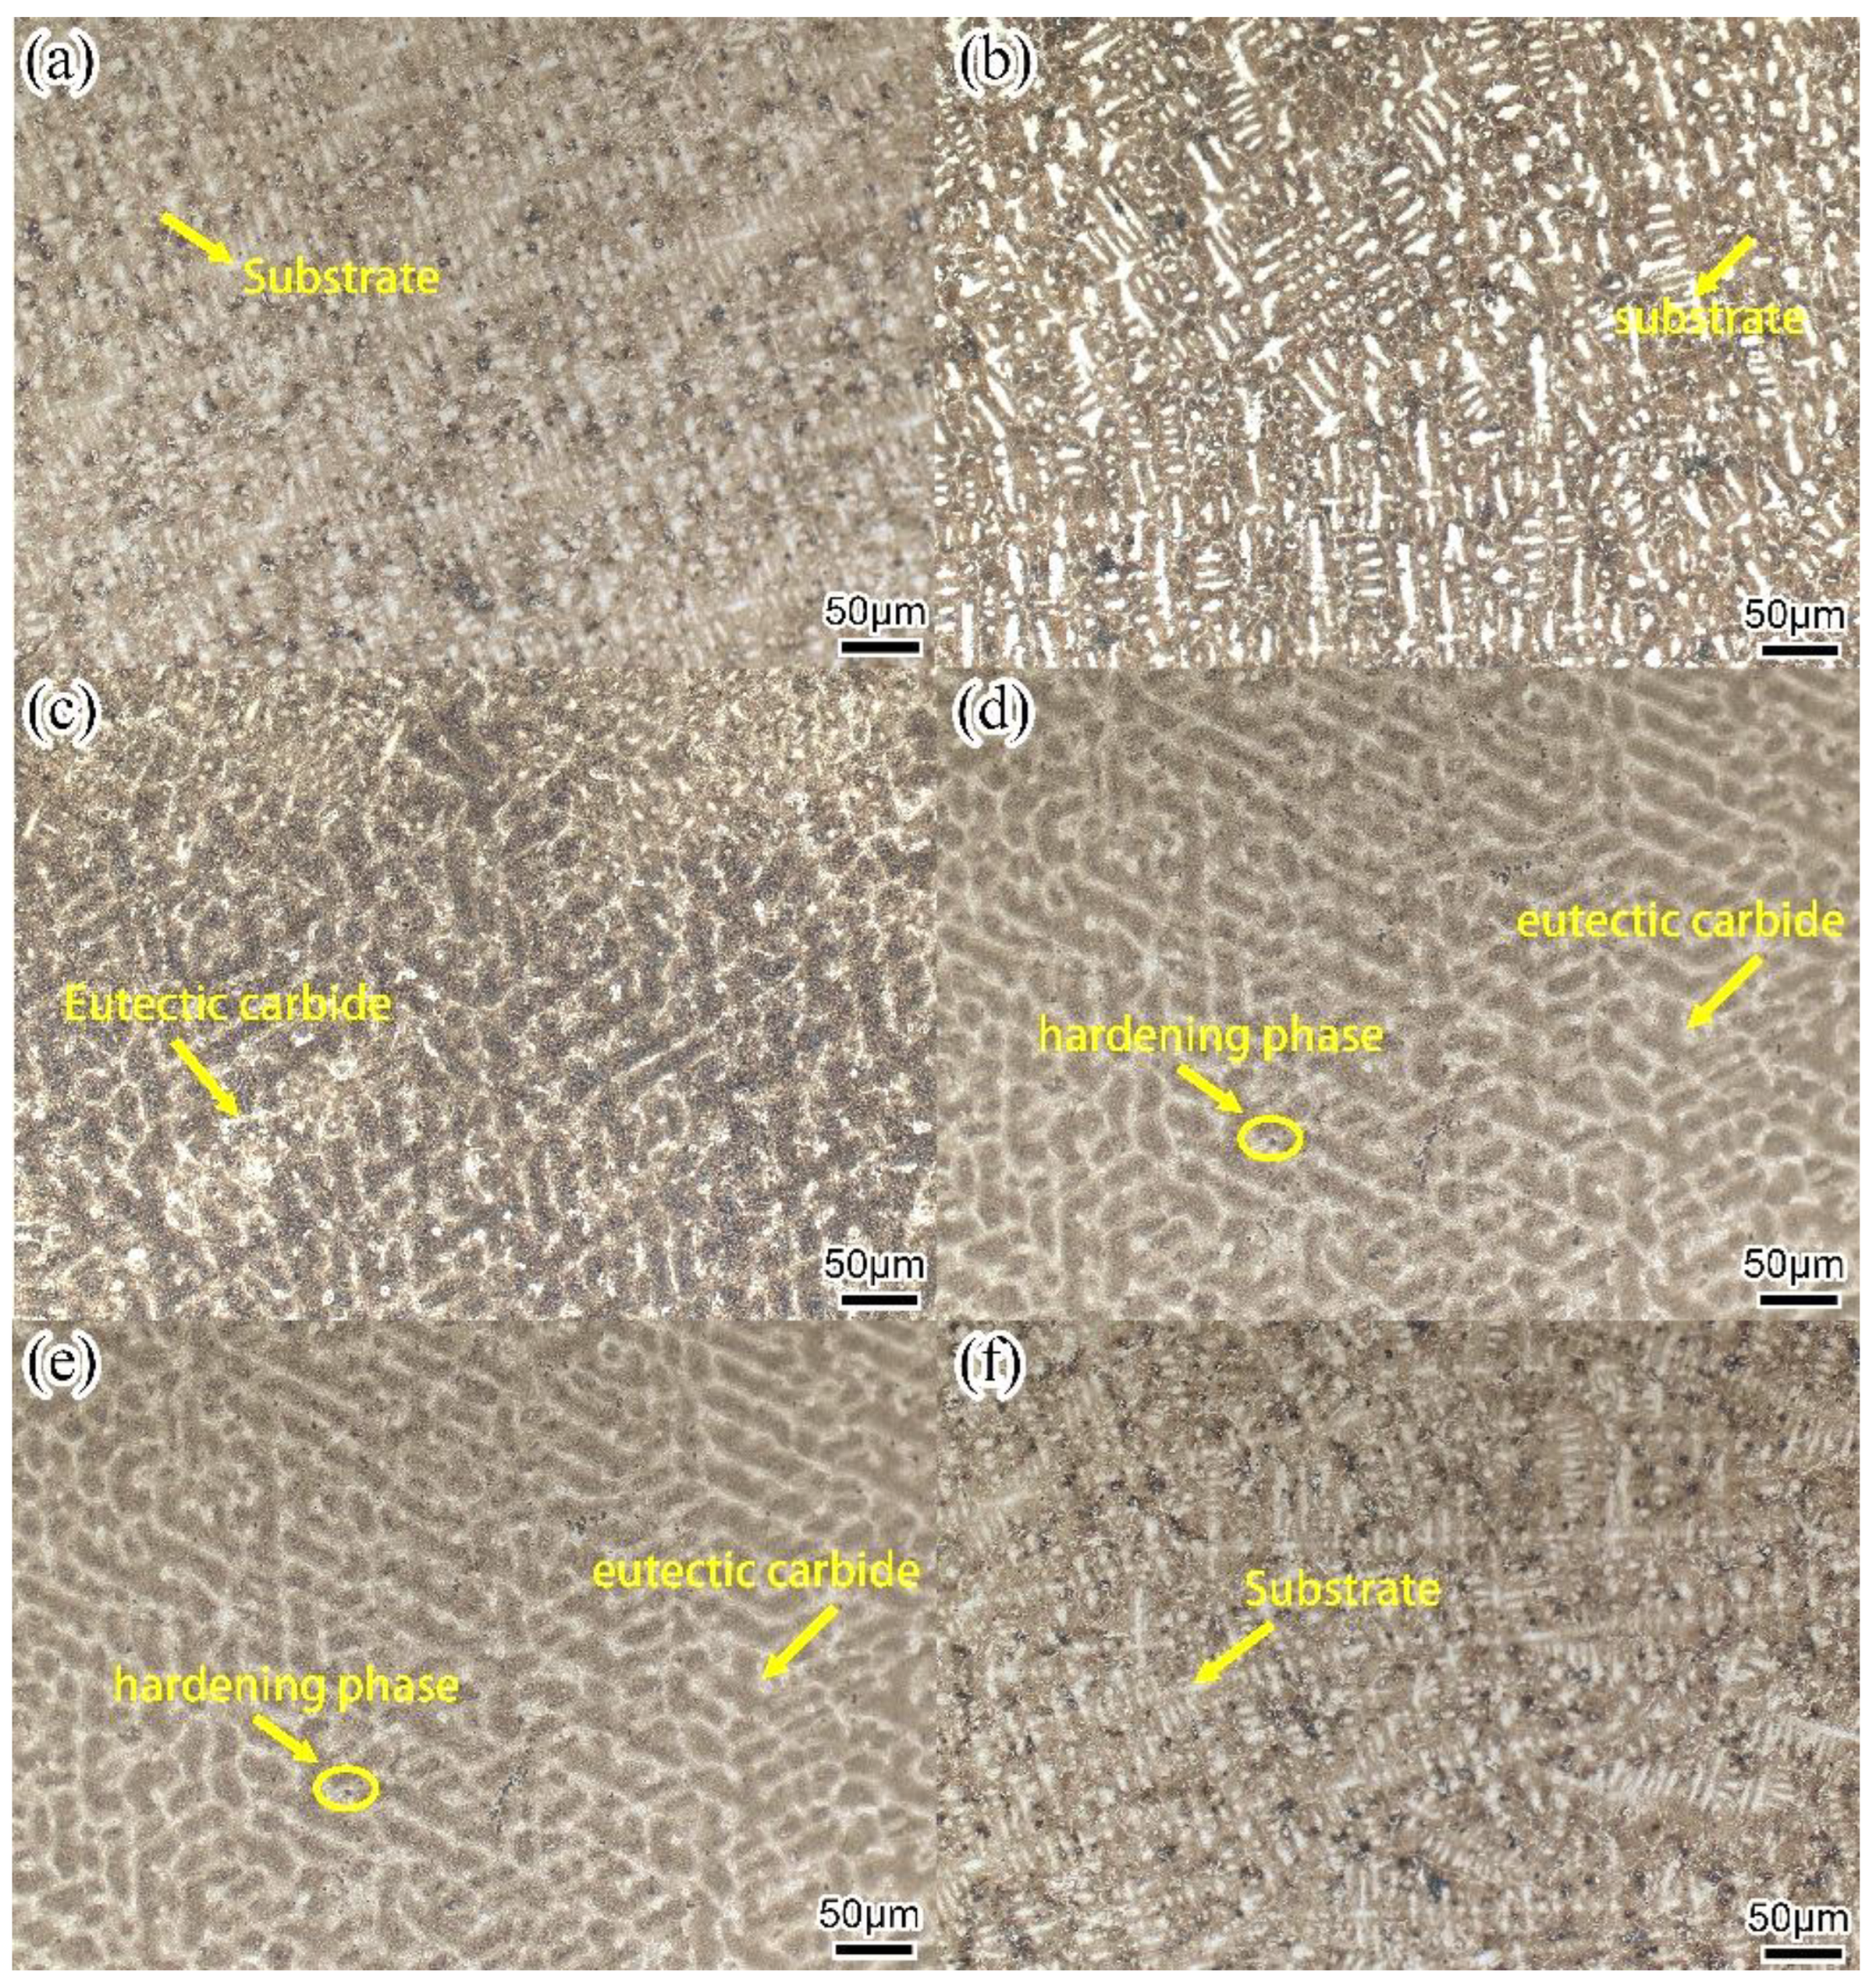
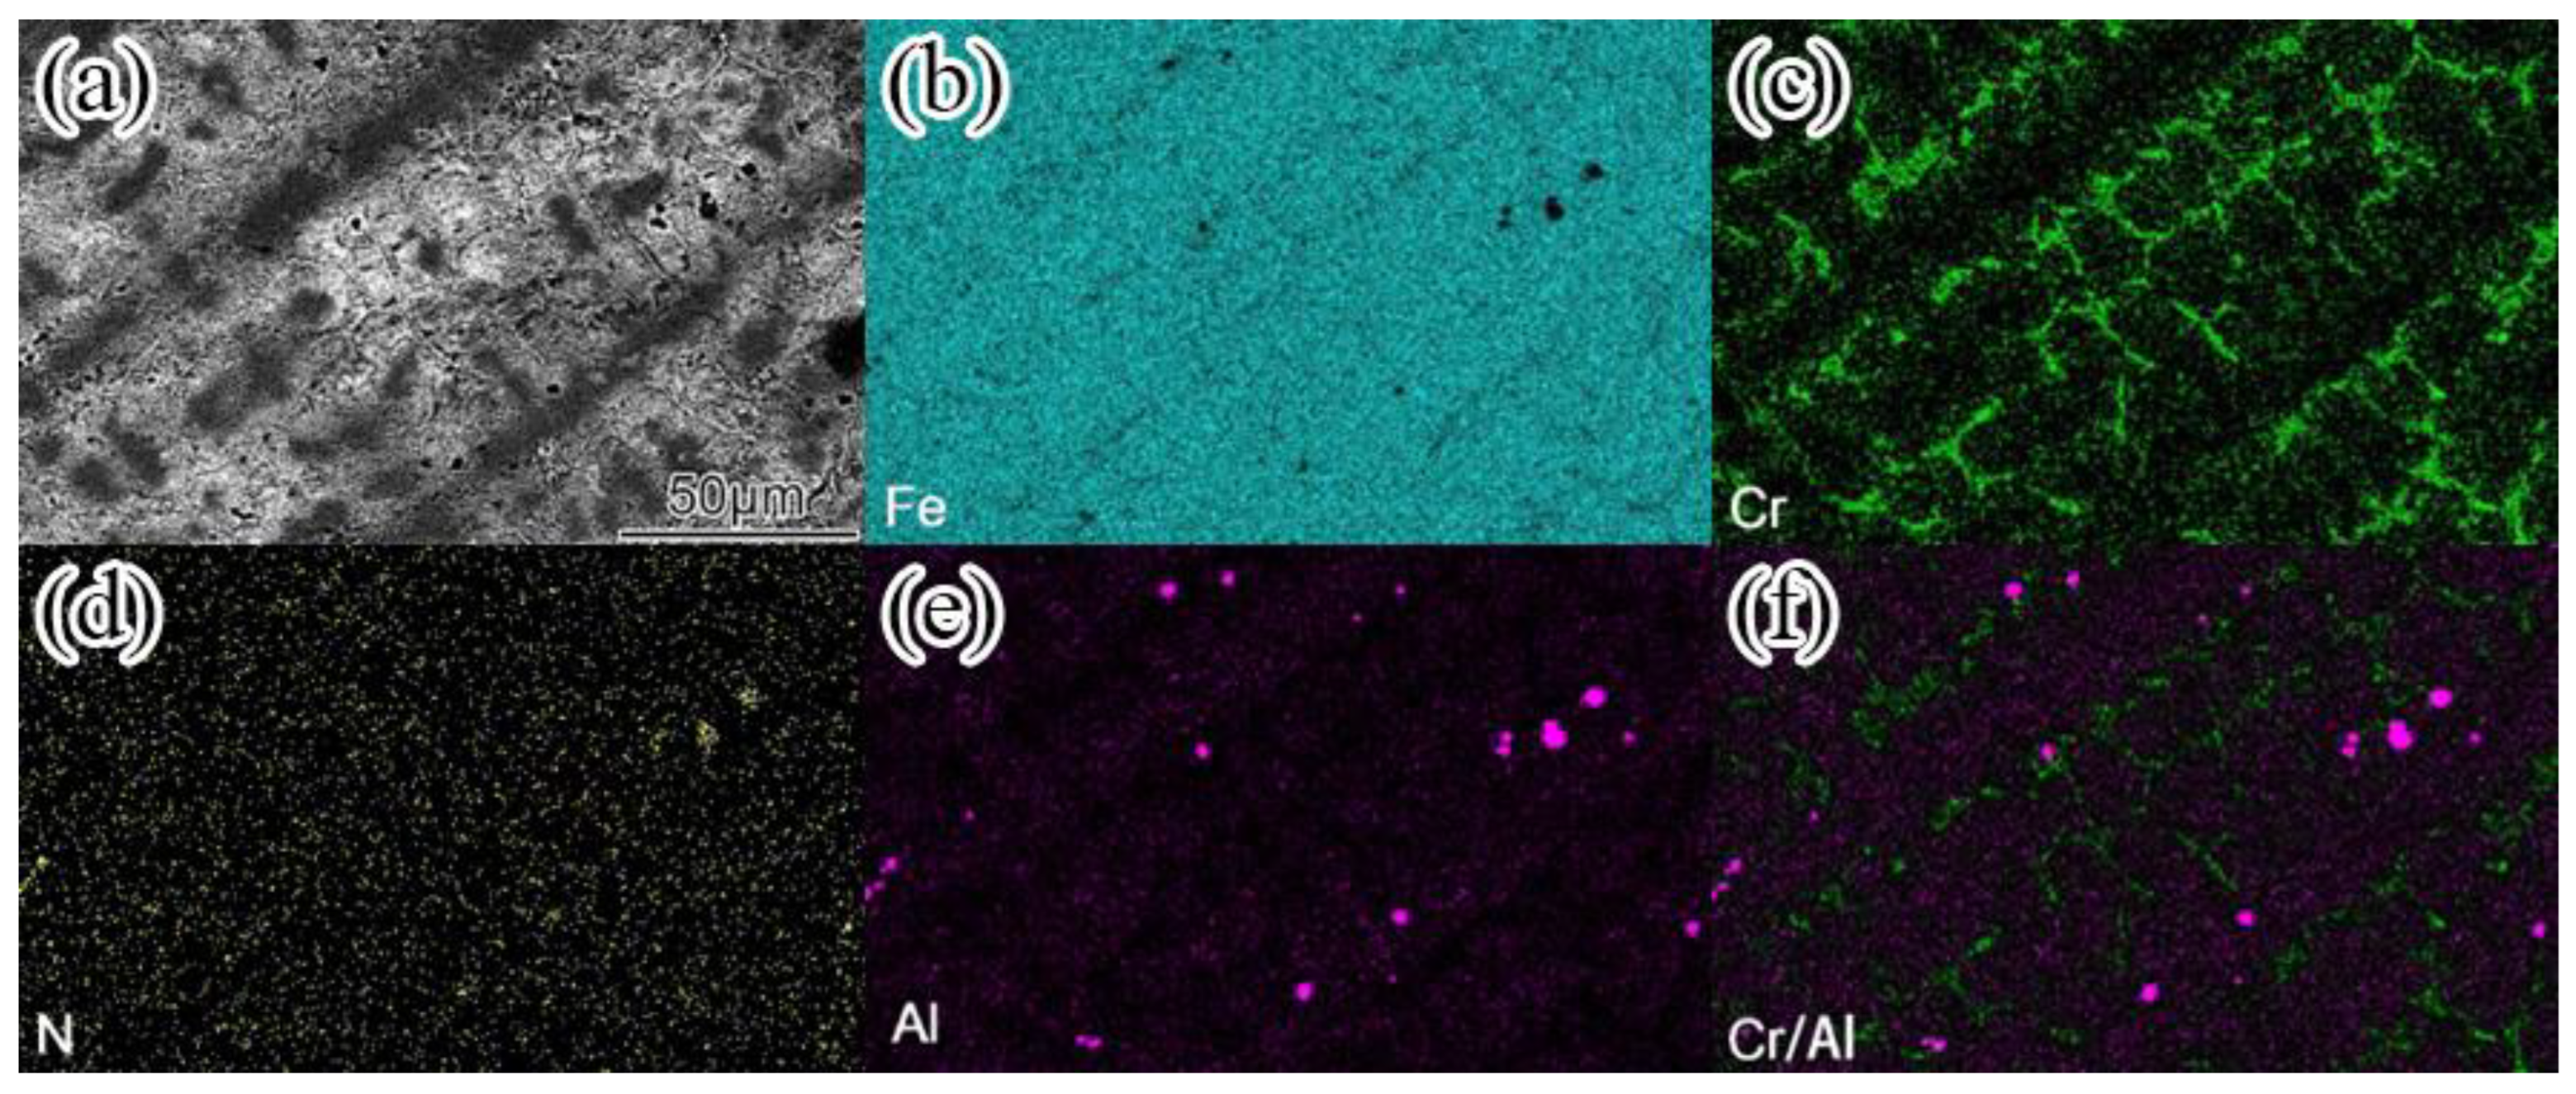
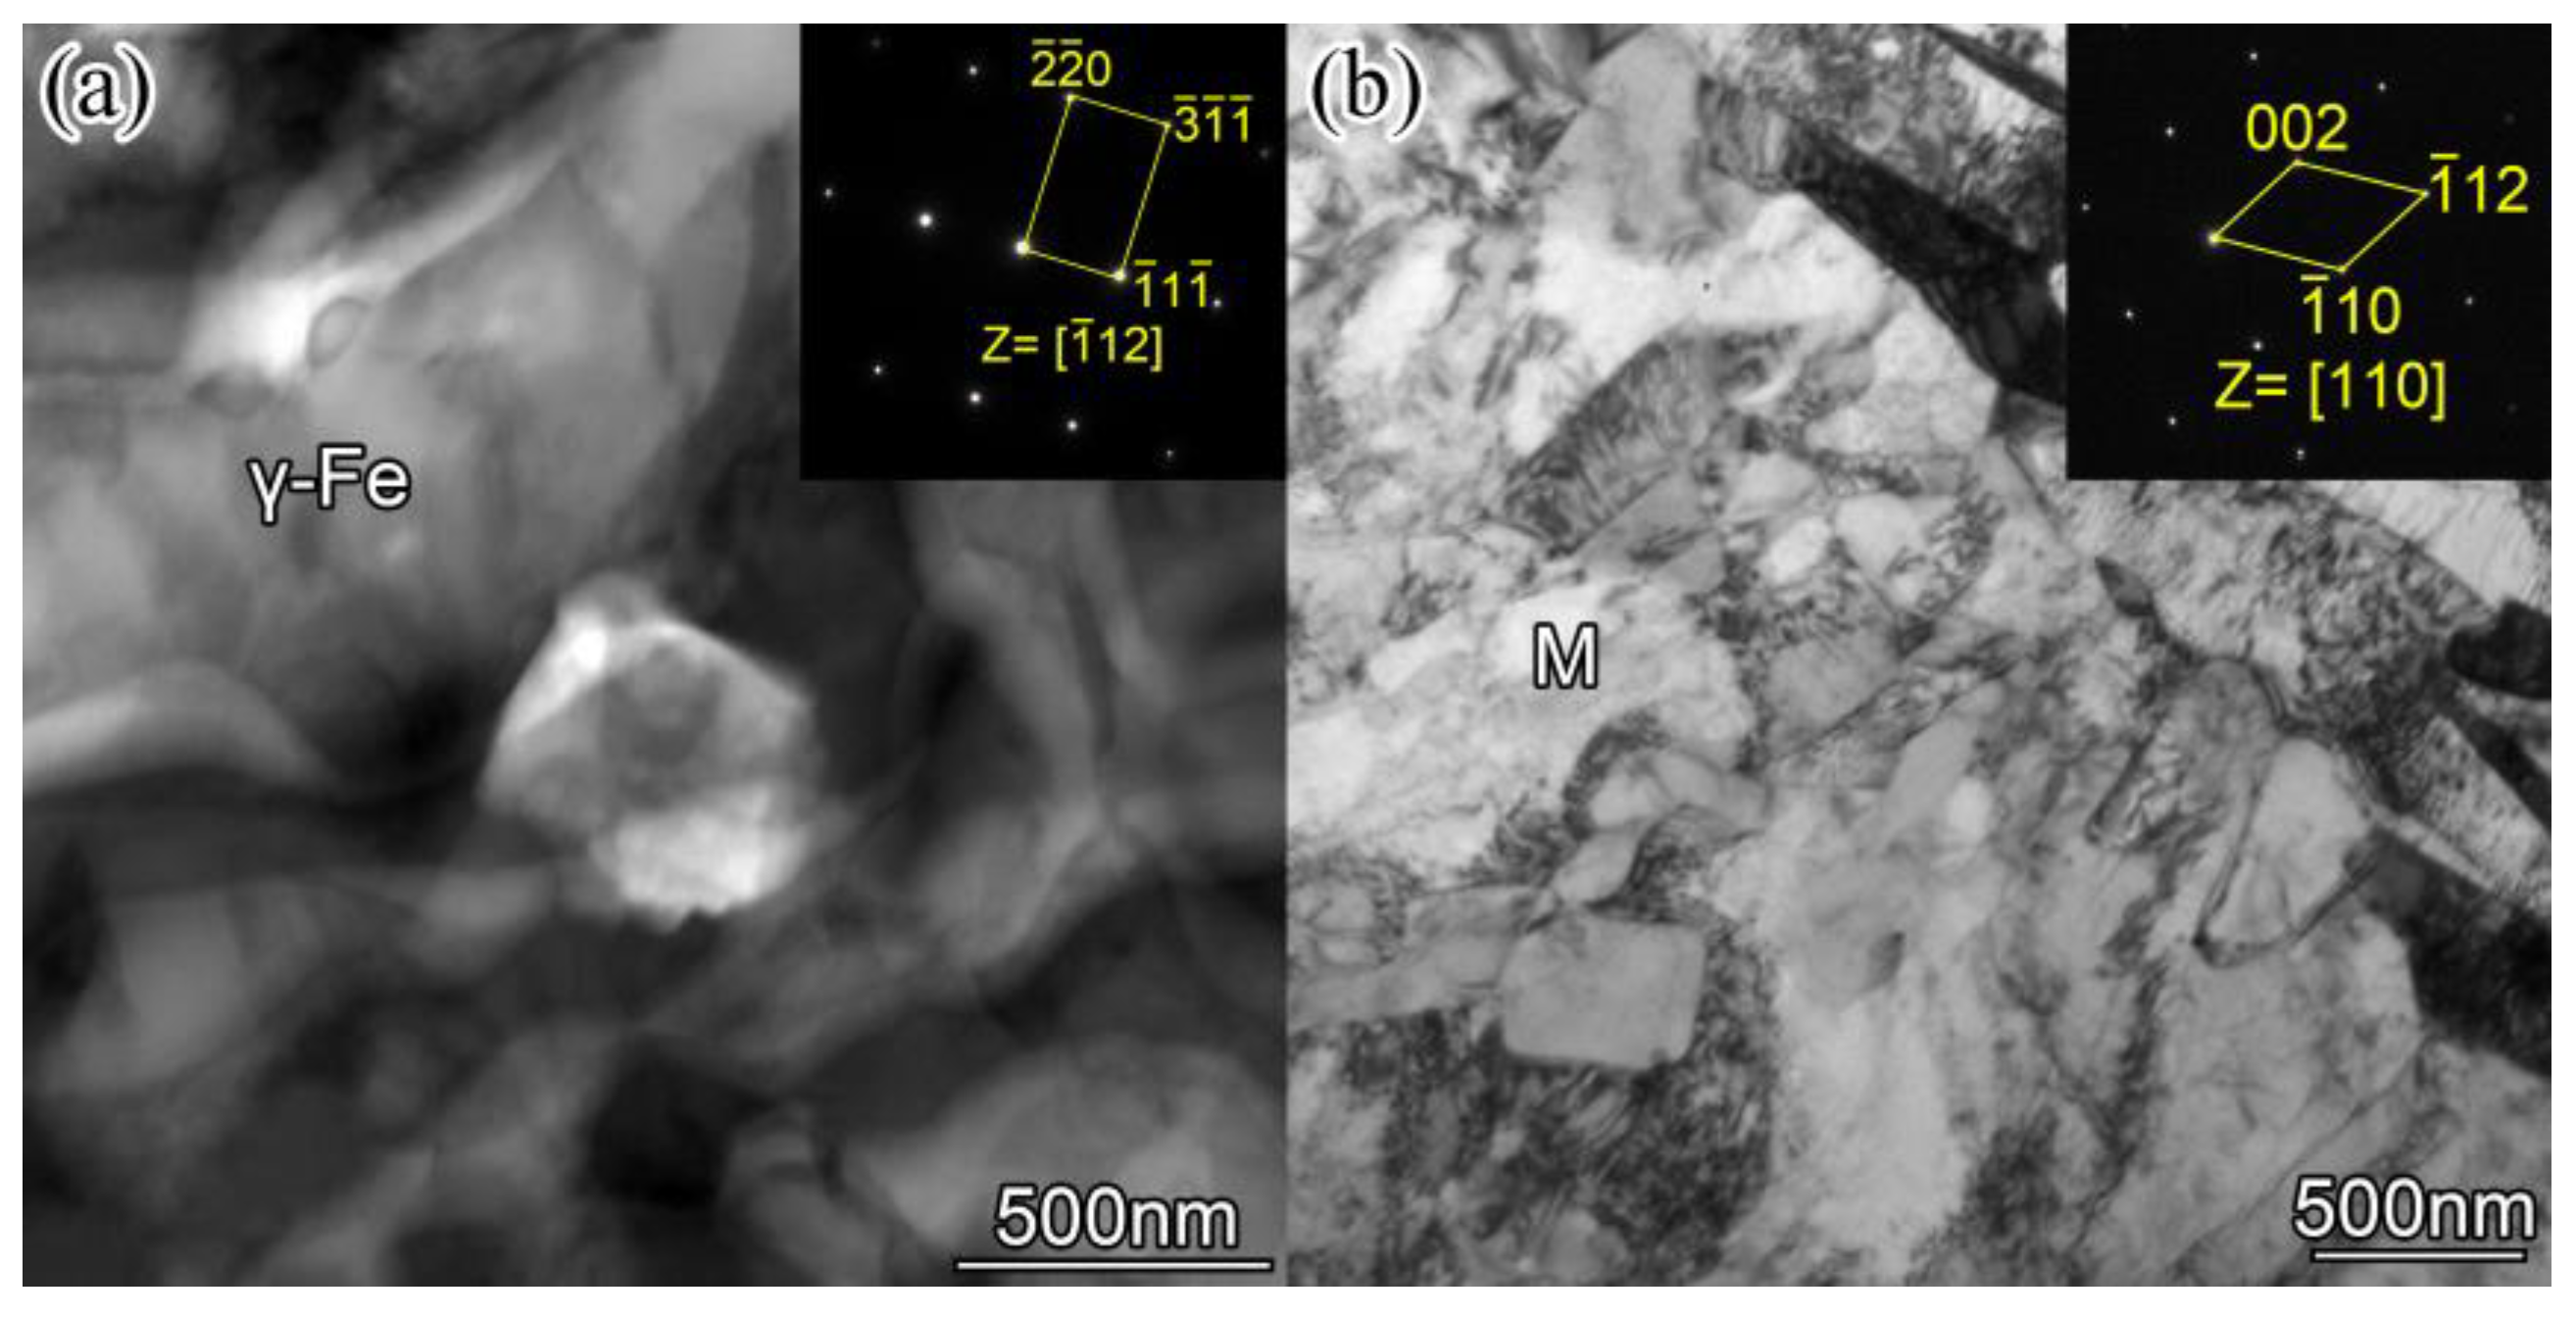
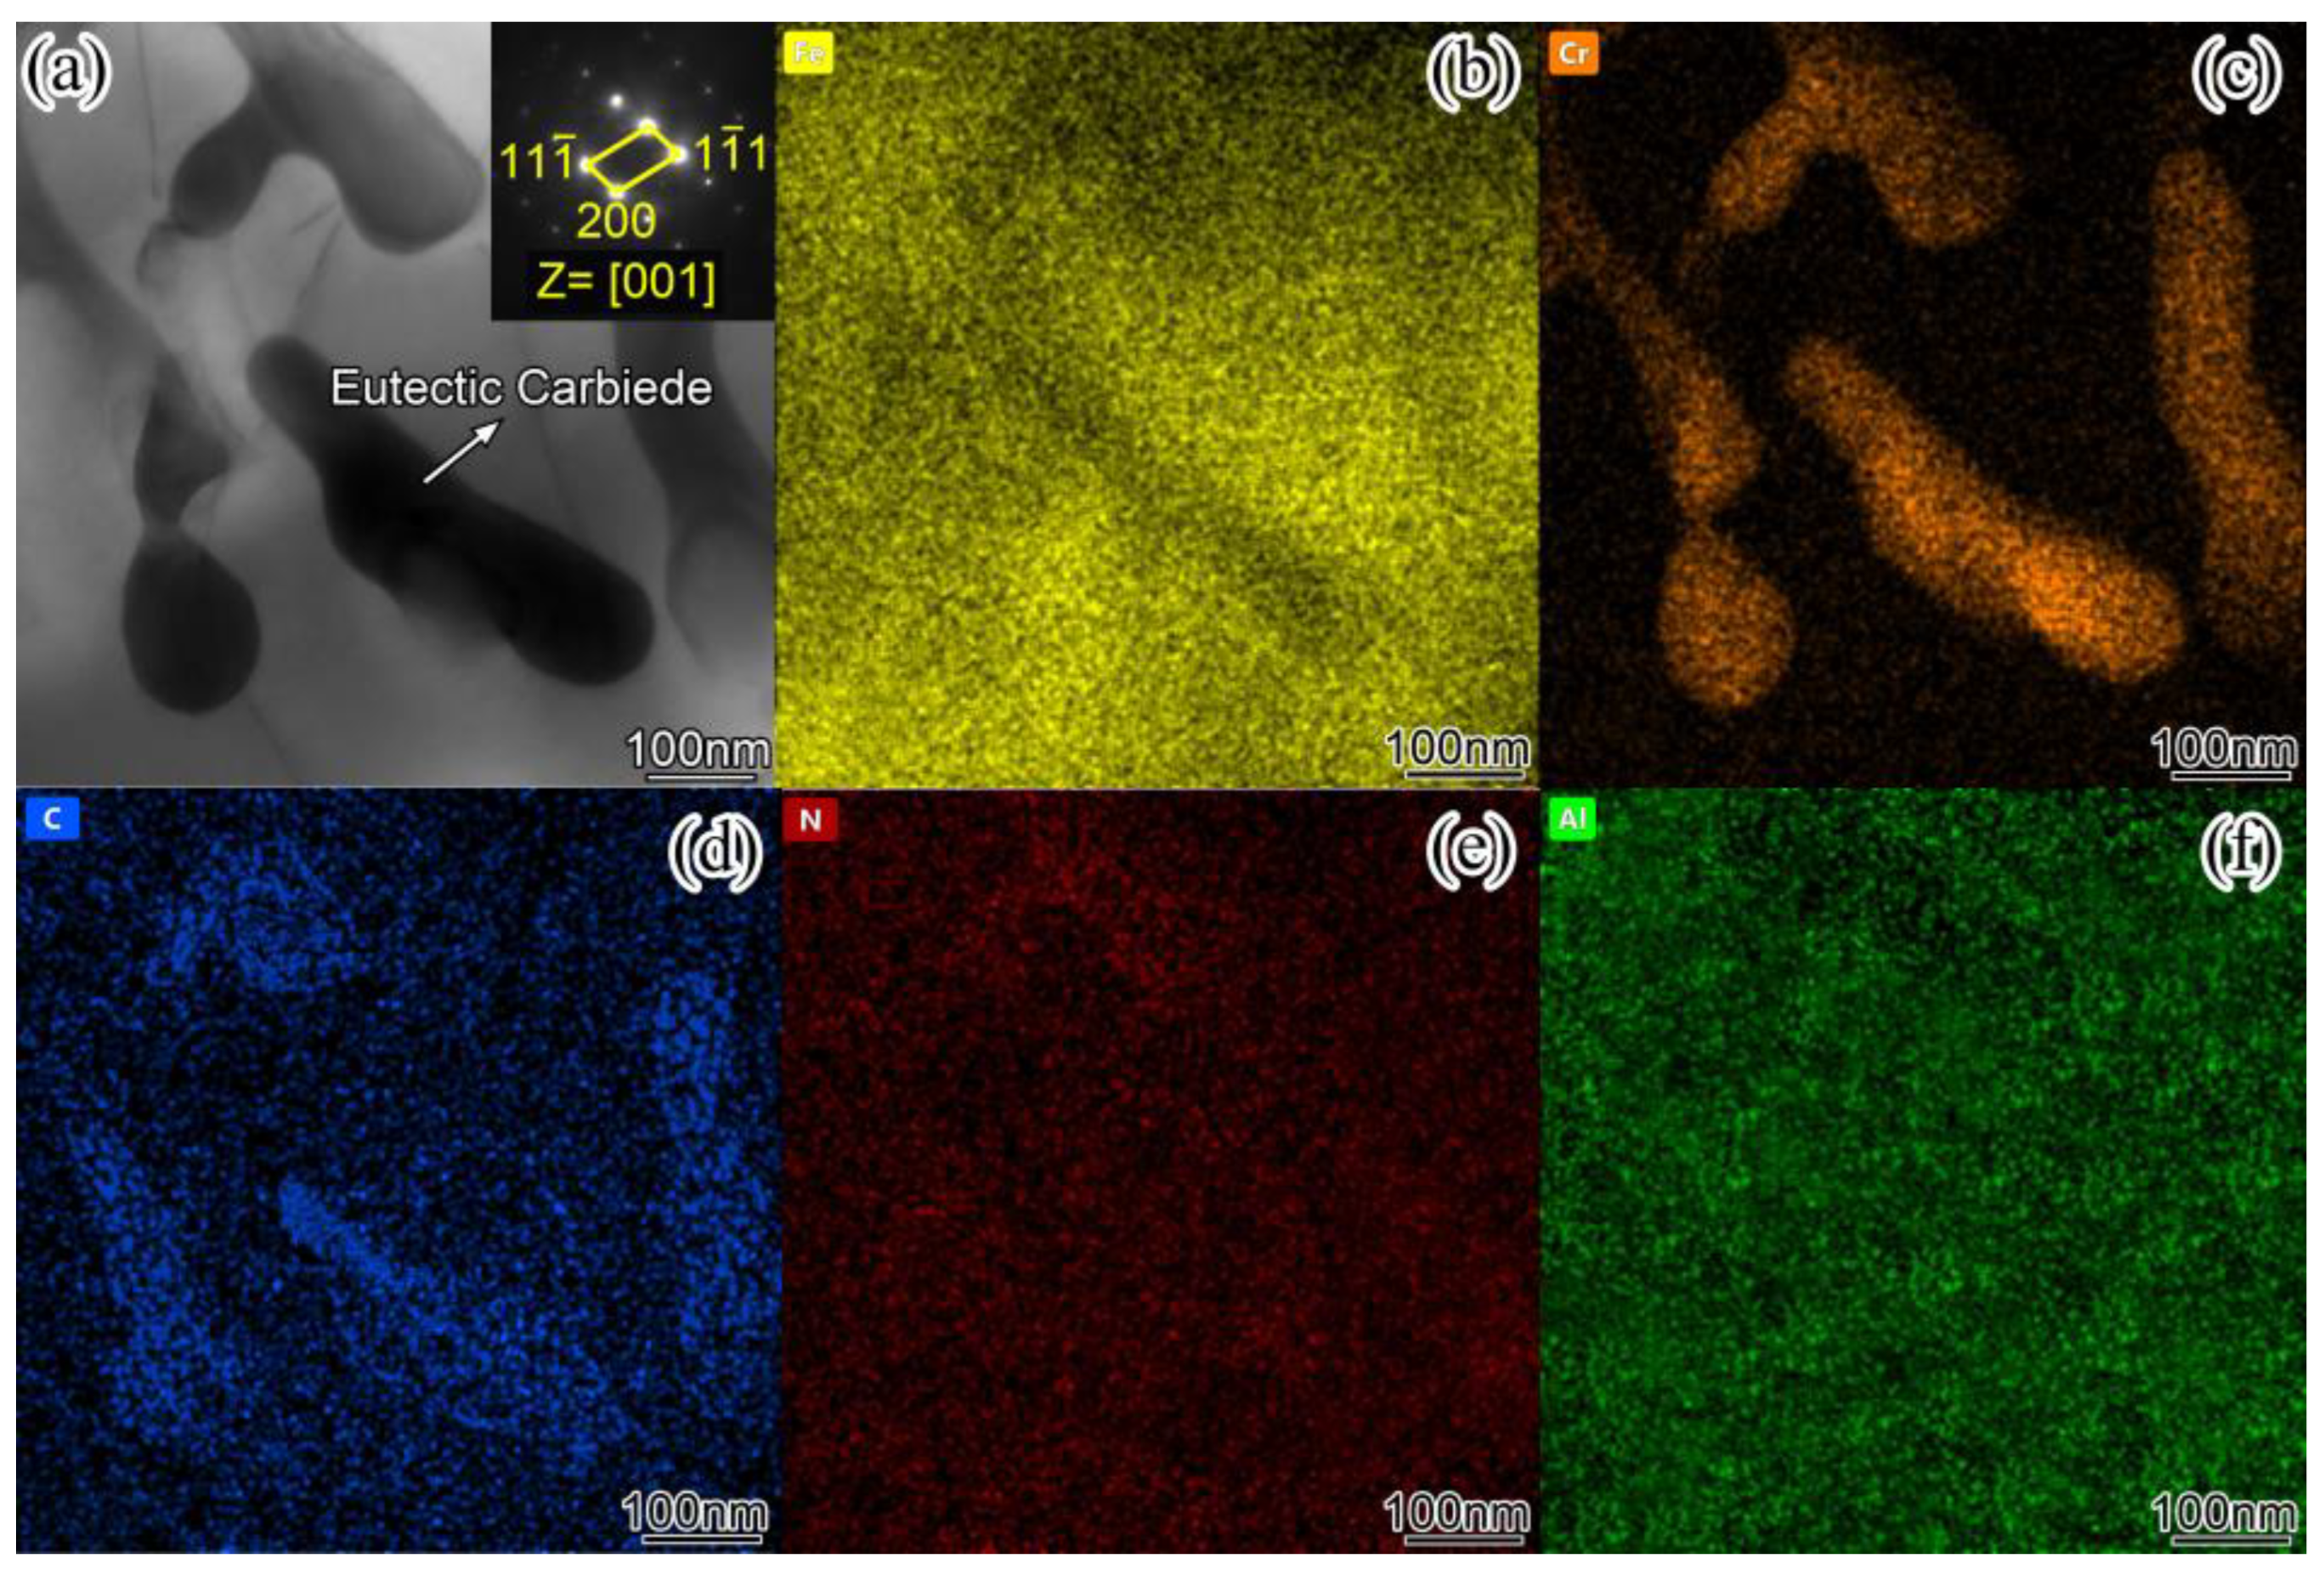
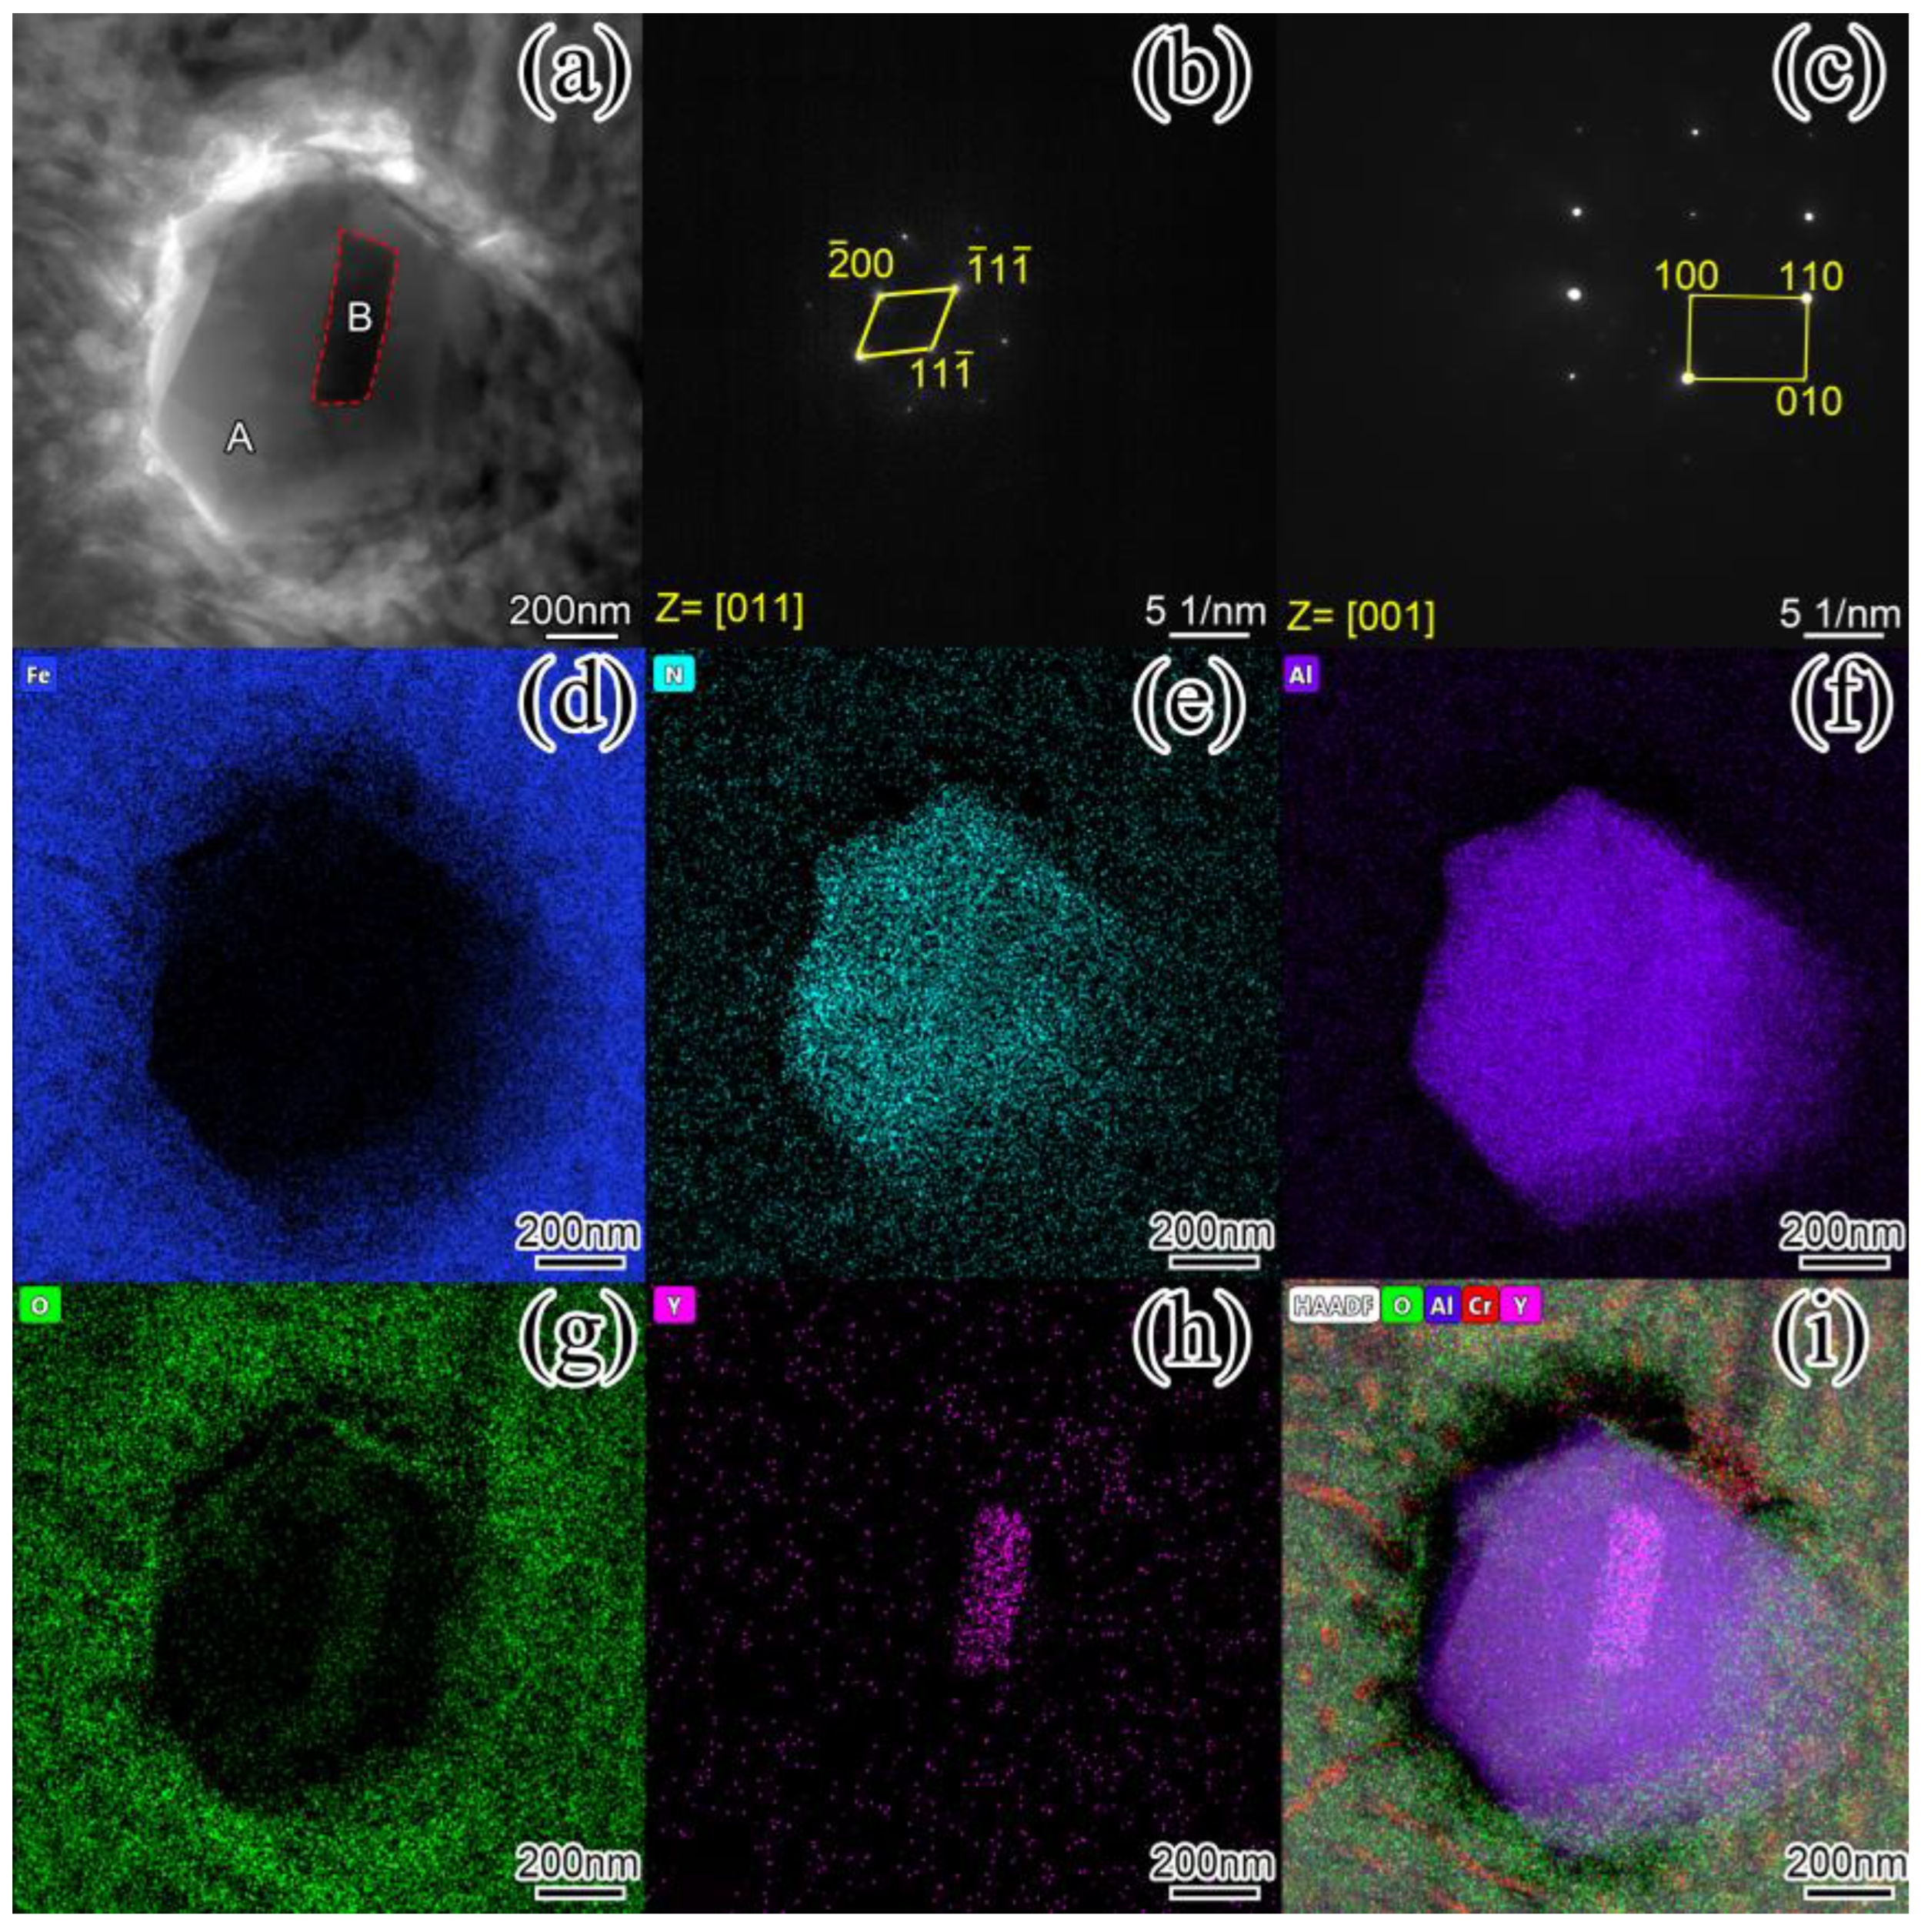
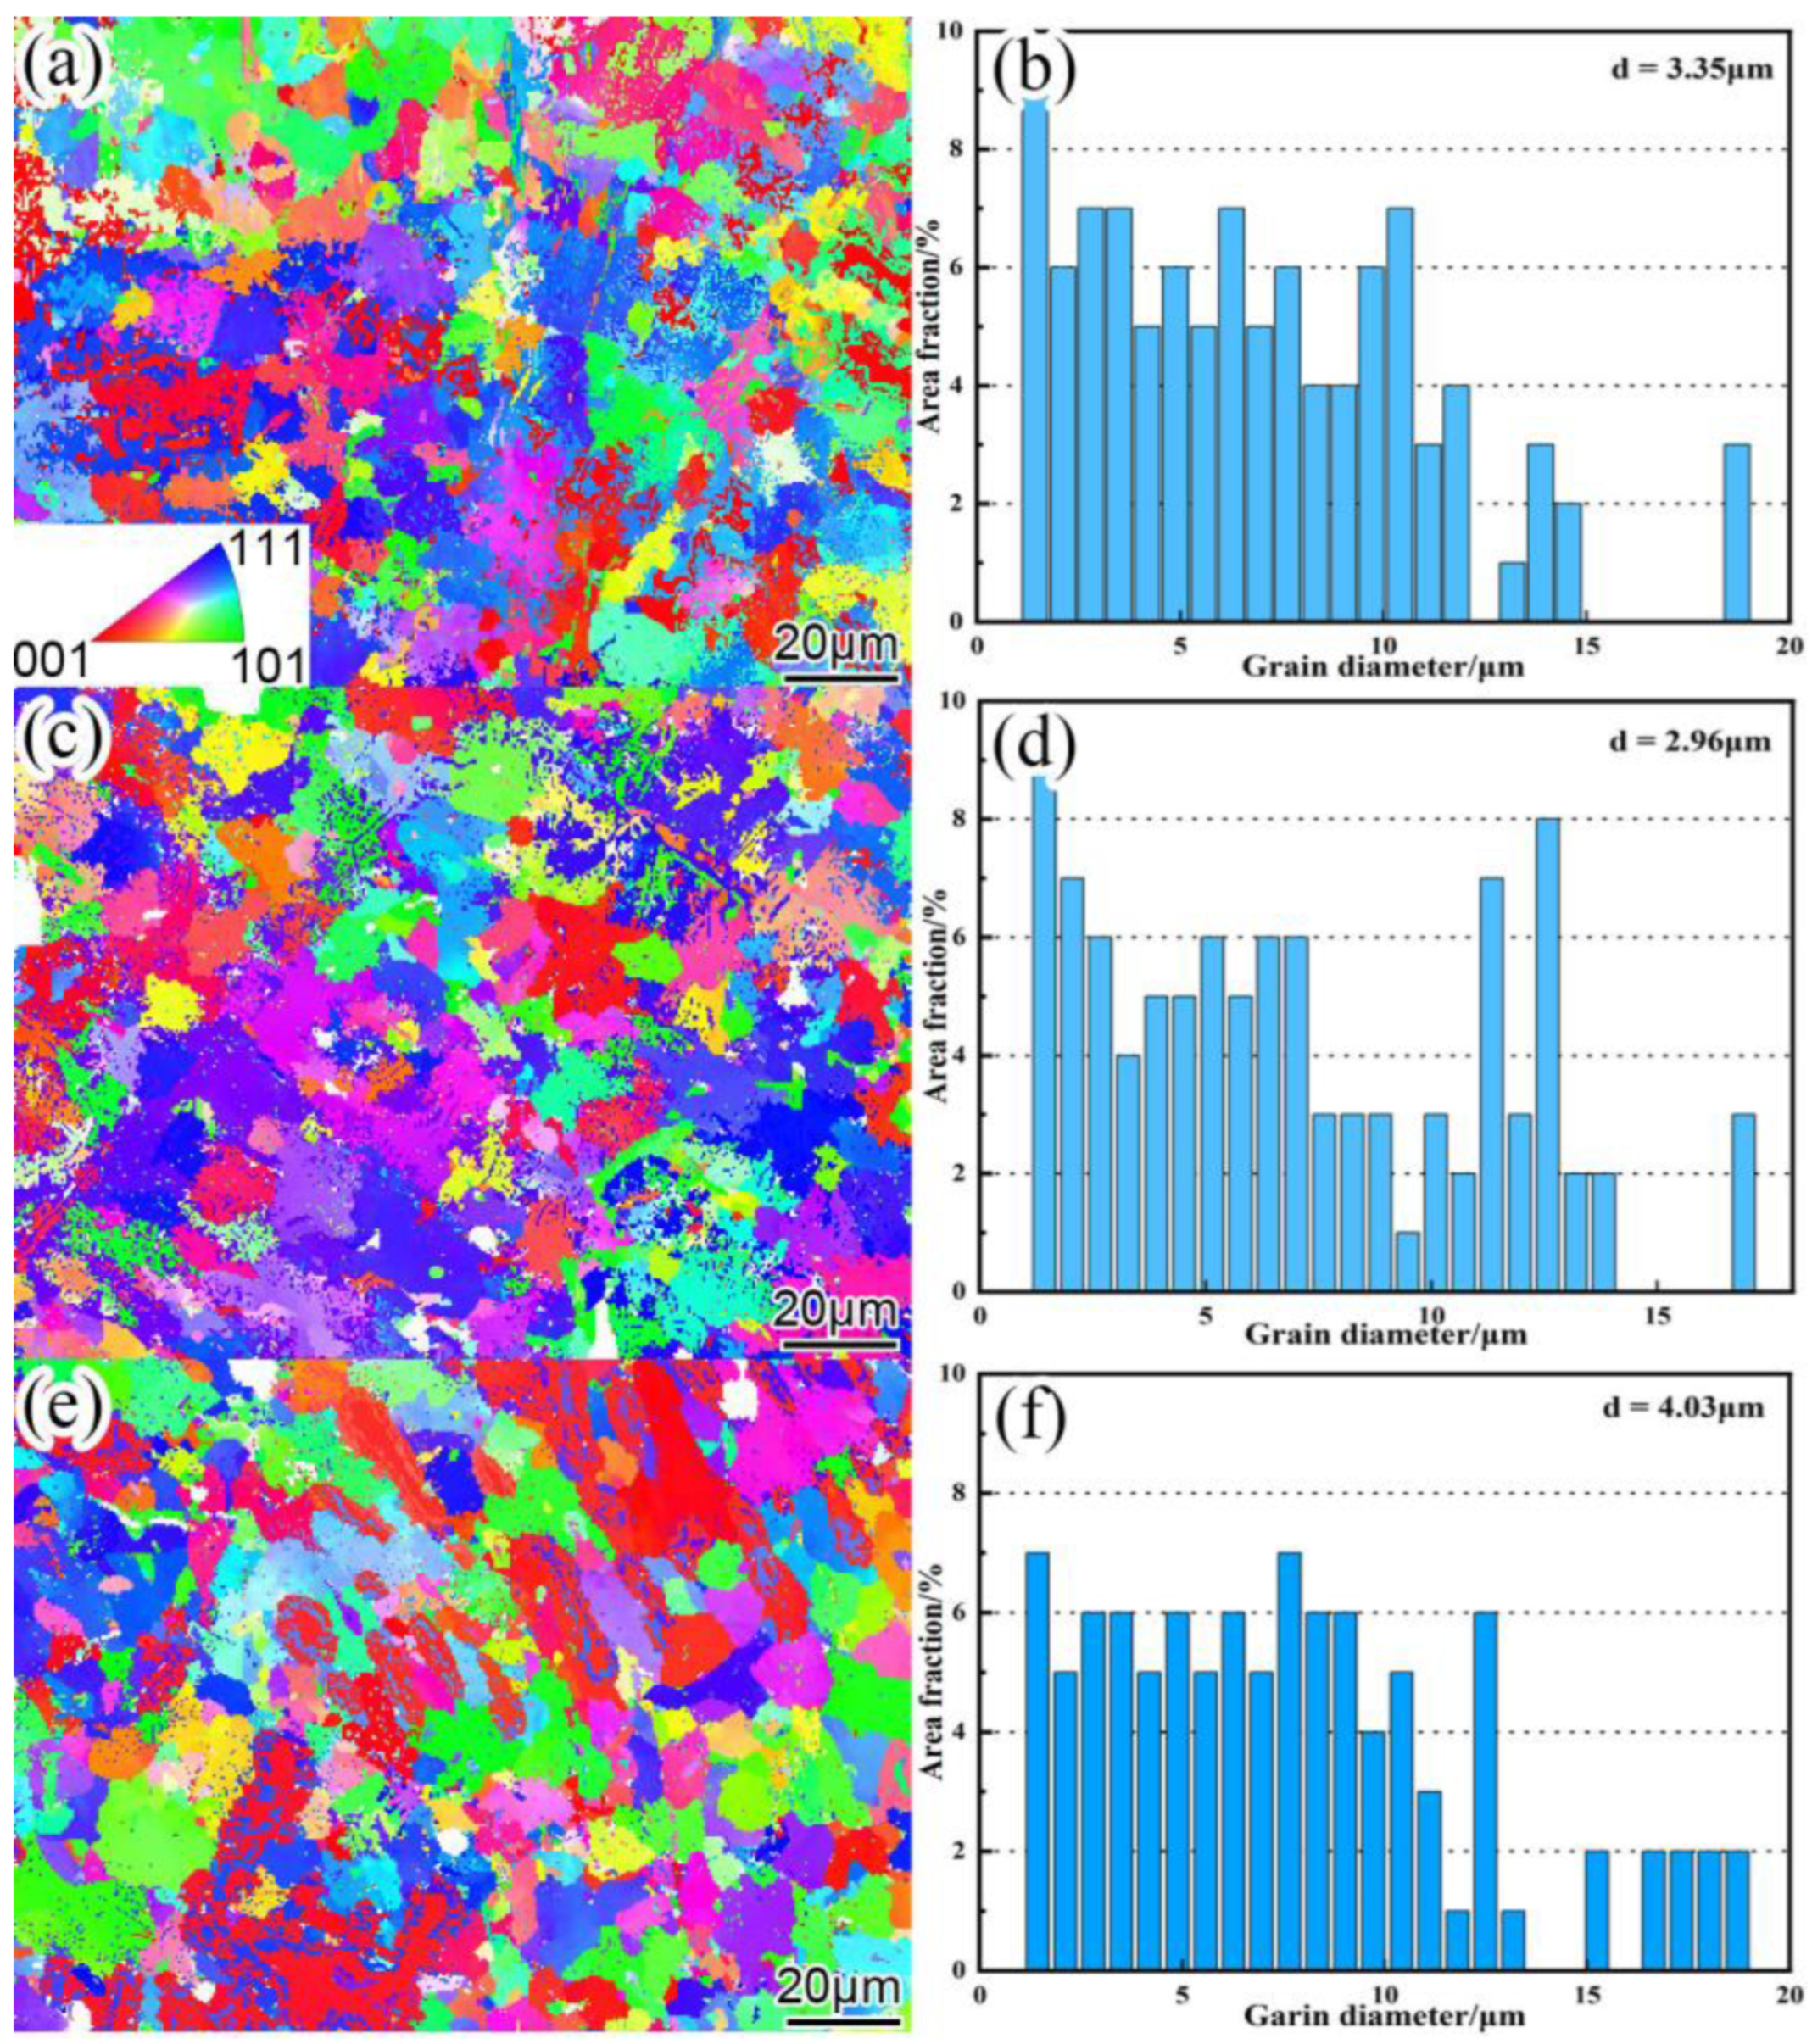
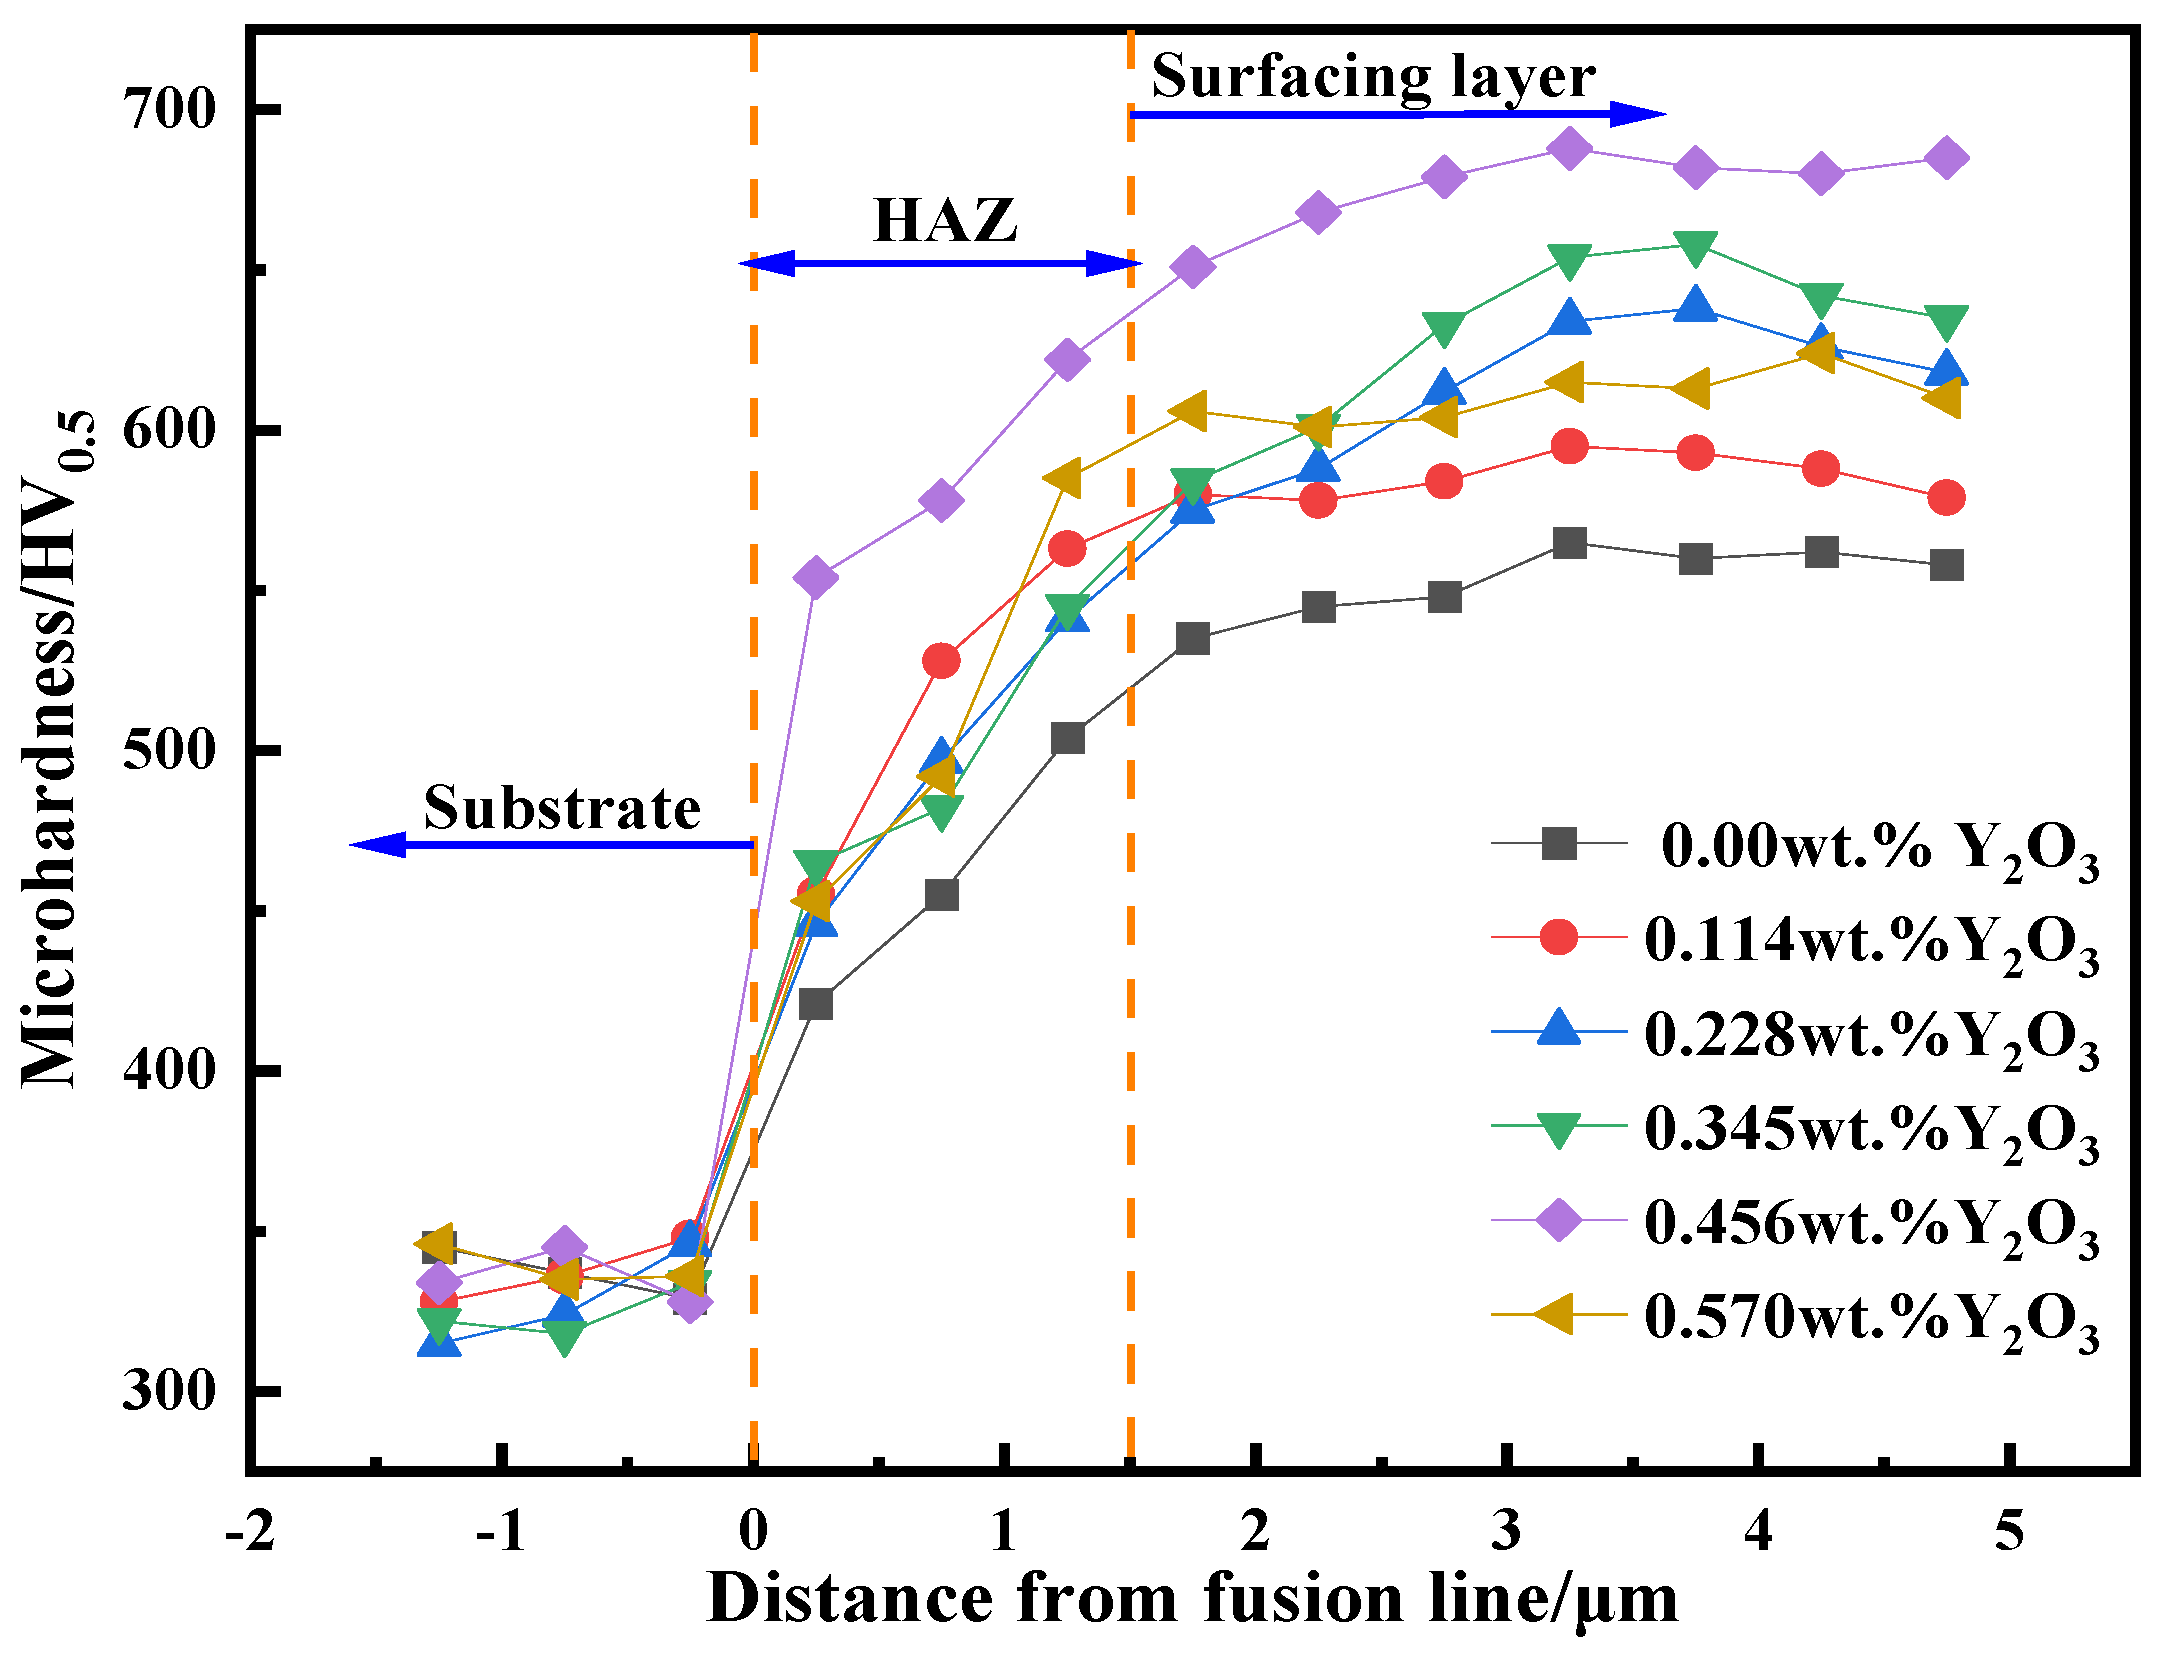
3.3. Microstructure Analysis

Figure 7 shows the metallographic structure of surfacing alloy with different nano-Y2O3 content. It can be seen from the figure that the surfacing alloy is a typical hypoeutectic structure. The matrix is composed of γ-Fe and M, and the precipitated phase is composed of network M7C3 and black-spotted AlN. When the added amount of nano-Y2O3 is 0.456 wt.%, the microstructure of the surfacing alloy is the smallest, and the original coarse dendrites become equiaxed grains. The precipitation of M7C3 and AlN is the largest and is evenly distributed. This is because, with the high melting point of nano-Y2O3, it is difficult to completely melt during the surfacing process. The incompletely melted Y2O3 in the surfacing alloy can easily become the core of heterogeneous nucleation, which can improve the nucleation rate and promote the formation of AlN. The large amount of dispersed AlN can effectively pin the grain boundary, hinder the grain boundary migration and refine the grain [34,35]. As the addition of nano-Y2O3 continues to increase to 0.570 wt.%, the structure becomes coarse dendrite crystals again. This is because the addition of excessive nano-Y2O3 leads to a decrease in the fluidity of the molten pool, slowing down the convection speed and slowing down the cooling of the molten pool, thereby increasing the time of dendrite growth [36,37]. This shows that adding an appropriate amount of nano-Y2O3 can play a role in grain refinement, and excessive nano-Y2O3 is not conducive to improving the microstructure of the surfacing alloy.
In order to intuitively understand the elemental composition of each phase in the surfacing alloy structure, the EDS element distribution of the surfacing alloy with 0.456 wt.% nano-Y2O3 was analyzed. The analysis results are shown in Figure 8. Figure 8a is the microstructure morphology of the surfacing alloy. Figure 8b–f are the element distribution maps of Fe, Cr, N, Al and Al/Cr, respectively. Due to the low content of Y and the small atomic radius of C, the element distribution of these two elements is not accurate and, therefore, not listed in the figure. The area with bright color in the figure is the element enrichment area, while the dark area represents the element depletion area. From the diagram, it can be clearly observed that the surfacing alloy is an Fe matrix, the network eutectic carbide is rich in Cr, and the content of Fe is lower than that of Cr. The hard phase particles are rich in Al and N. Combined with XRD analysis, M7C3 carbide is (Cr, Fe)7C3. The black granular hard phase is AlN. Meanwhile, a small amount of Al, N and Cr are also distributed in the matrix. These alloying elements present in the matrix can play a role in solid solution strengthening of the surfacing alloy and play a positive role in improving the wear resistance of the surfacing alloy. In the analysis of the surface distribution of surfacing alloy elements, the presence of Y in AlN cannot be detected. In order to prove that nano-Y2O3 can become the nucleation particle of AlN, the microstructure of the surfacing alloy should be analyzed using TEM.
Figure 9 is the STEM-BF image and selected area electron diffraction pattern (SAED) of the surfacing alloy matrix with 0.456 wt.% nano-Y2O3 addition. From the electron diffraction pattern of Figure 9a, it can be analyzed that the matrix is austenite γ-Fe, face-centered cubic structure (fcc), the crystal band axis is [ 1 ¯ 12], and the lattice constant a = 0.385 nm. From the electron diffraction pattern of Figure 9b, it can be analyzed that the matrix is M, body-centered cubic structure (bcc), with a band axis [110], and it has a lattice constant a = 0.293, c = 0.315. Through TEM analysis, the matrix of the surfacing alloy is composed of retained austenite and martensite, which is consistent with the results of XRD analysis.
Figure 10 is the STEM-BF and the corresponding STEM-EDS of eutectic carbides in the surfacing alloy with 0.456 wt.% nano-Y2O3 addition. From Figure 10a, it can be seen that the dark, irregular area is eutectic carbide, and the light area is the surfacing alloy iron matrix. From the STEM-EDS (Figure 10b–f) corresponding to Figure 10a, it can be found that the eutectic carbide region is poor in N and Al. The enrichment area of Cr and C corresponds to the shape of eutectic carbides. Combined with the electron diffraction pattern of the eutectic carbide in Figure 10a, it can be seen that the eutectic carbide is a face-centered cubic structure (fcc), and the crystal band axis is [001]. The lattice constants are a = 4.53 Å, b = 7.01 Å and c = 12.2 Å. This is consistent with the M7C3 structure. When the Fe atom replaces the Cr atom in Cr7C3 because the difference between the radius of the Fe atom and the radius of the Cr atom is very small, the crystal structure of the formed (Cr, Fe)7C3 eutectic carbide does not undergo large lattice distortion, and the final eutectic carbide structure is orthogonal [38].
Figure 11 is the STEM image of the hard phase of the surfacing alloy with 0.456 wt.% nano-Y2O3 addition. It can be found from Figure 11a that the hard phase is an irregular hexagon, and there are dark strip particles in the middle area of the hard phase. The corresponding electron diffraction patterns were obtained by selecting electron diffraction in A and B regions. In Figure 11b, it can be known from the calibration of the diffraction pattern that the A region is a typical face-centered cubic structure (bcc), the crystal band axis is [011], and the lattice constant is a = 4.1 Å. By comparing with the PDF card, it is determined that the hard phase is AlN, and the space group is Fm-3m (225). In Figure 11c, it was found to be a face-centered cubic structure, a = 10.554 Å, and it can be determined to be Y2O3 after comparing the PDF card. From Figure 11a, it can be clearly seen that the AlN hard phase grows around Y2O3, and the two are closely combined. This confirms the experimental results that AlN and Y2O3 can form a heterogeneous nucleation interface. Y2O3 can be used as a nucleation particle to effectively promote the formation of AlN, refine the grains and promote the precipitation of eutectic carbides, and the wear resistance of the surfacing alloy is significantly improved [37].
Figure 12 is the EBSD inverse pole figure (IPF) and grain size statistics of nano-Y2O3 surfacing alloys with different contents. It can be seen from the figure that with the increase in nano-Y2O3 content to 0.456 wt.% Y2O3, the grain refinement of the surfacing alloy is obvious, the average grain equivalent diameter is reduced from 3.35 μm to 2.96 μm, and the grain size distribution is more uniform. As the content of nano-Y2O3 continues to increase to 0.570 wt.%, the grain size of the surfacing alloy increases to 4.03 μm, and the grain size varies.
The decrease in grain size will increase the hardness of the surfacing alloy. The relationship between the yield strength and grain size can be expressed by Hall–Petch [39]:
σ s = σ i + k d 1 / 2
The formula: σs represents the yield limit of the material; σi represents the lattice friction resistance generated by moving a single dislocation; k represents the correlation constant; d represents the grain size. It can be found that the yield strength increases with the decrease in grain size. Generally, the hardness of the material increases with the increase in strength. With the addition of nano-Y2O3, the grains are refined, which increases the hardness of the surfacing alloy. When the nano-Y2O3 is added too much, the microstructure of the surfacing alloy is gradually coarse, which in turn reduces the hardness.
Figure 13 is the variation trend of the volume fraction of each phase of EBSD with the content of nano-Y2O3 additive. It can be seen from the figure that with the increase in nano-Y2O3 additive content, the volume fraction of e M7C3 and AlN in the surfacing alloy increases first and then decreases. When the content of nano-Y2O3 is 0.456 wt.%, the volume fractions of M7C3 and AlN are 35.34% and 3.87%, respectively. The volume fraction of M7C3 and AlN increased by 5.7% and 2.52%, respectively, compared with that without nano-Y2O3. With the increase in nano-Y2O3 content, the volume fraction of M7C3 and AlN changes little.
This indicates that the addition of appropriate nano-Y2O3 can effectively act as heterogeneous nucleation particles, increase the precipitation amount of AlN and increase the volume fraction of M7C3. The matrix of surfacing alloy is mostly retained austenite; the volume fraction of martensite is less, and the change in nano-Y2O3 content has little effect on the volume fraction of martensite. The surfacing alloy matrix is mainly composed of retained austenite and a small amount of martensite, which ensures that the surfacing alloy matrix has good strength and toughness.

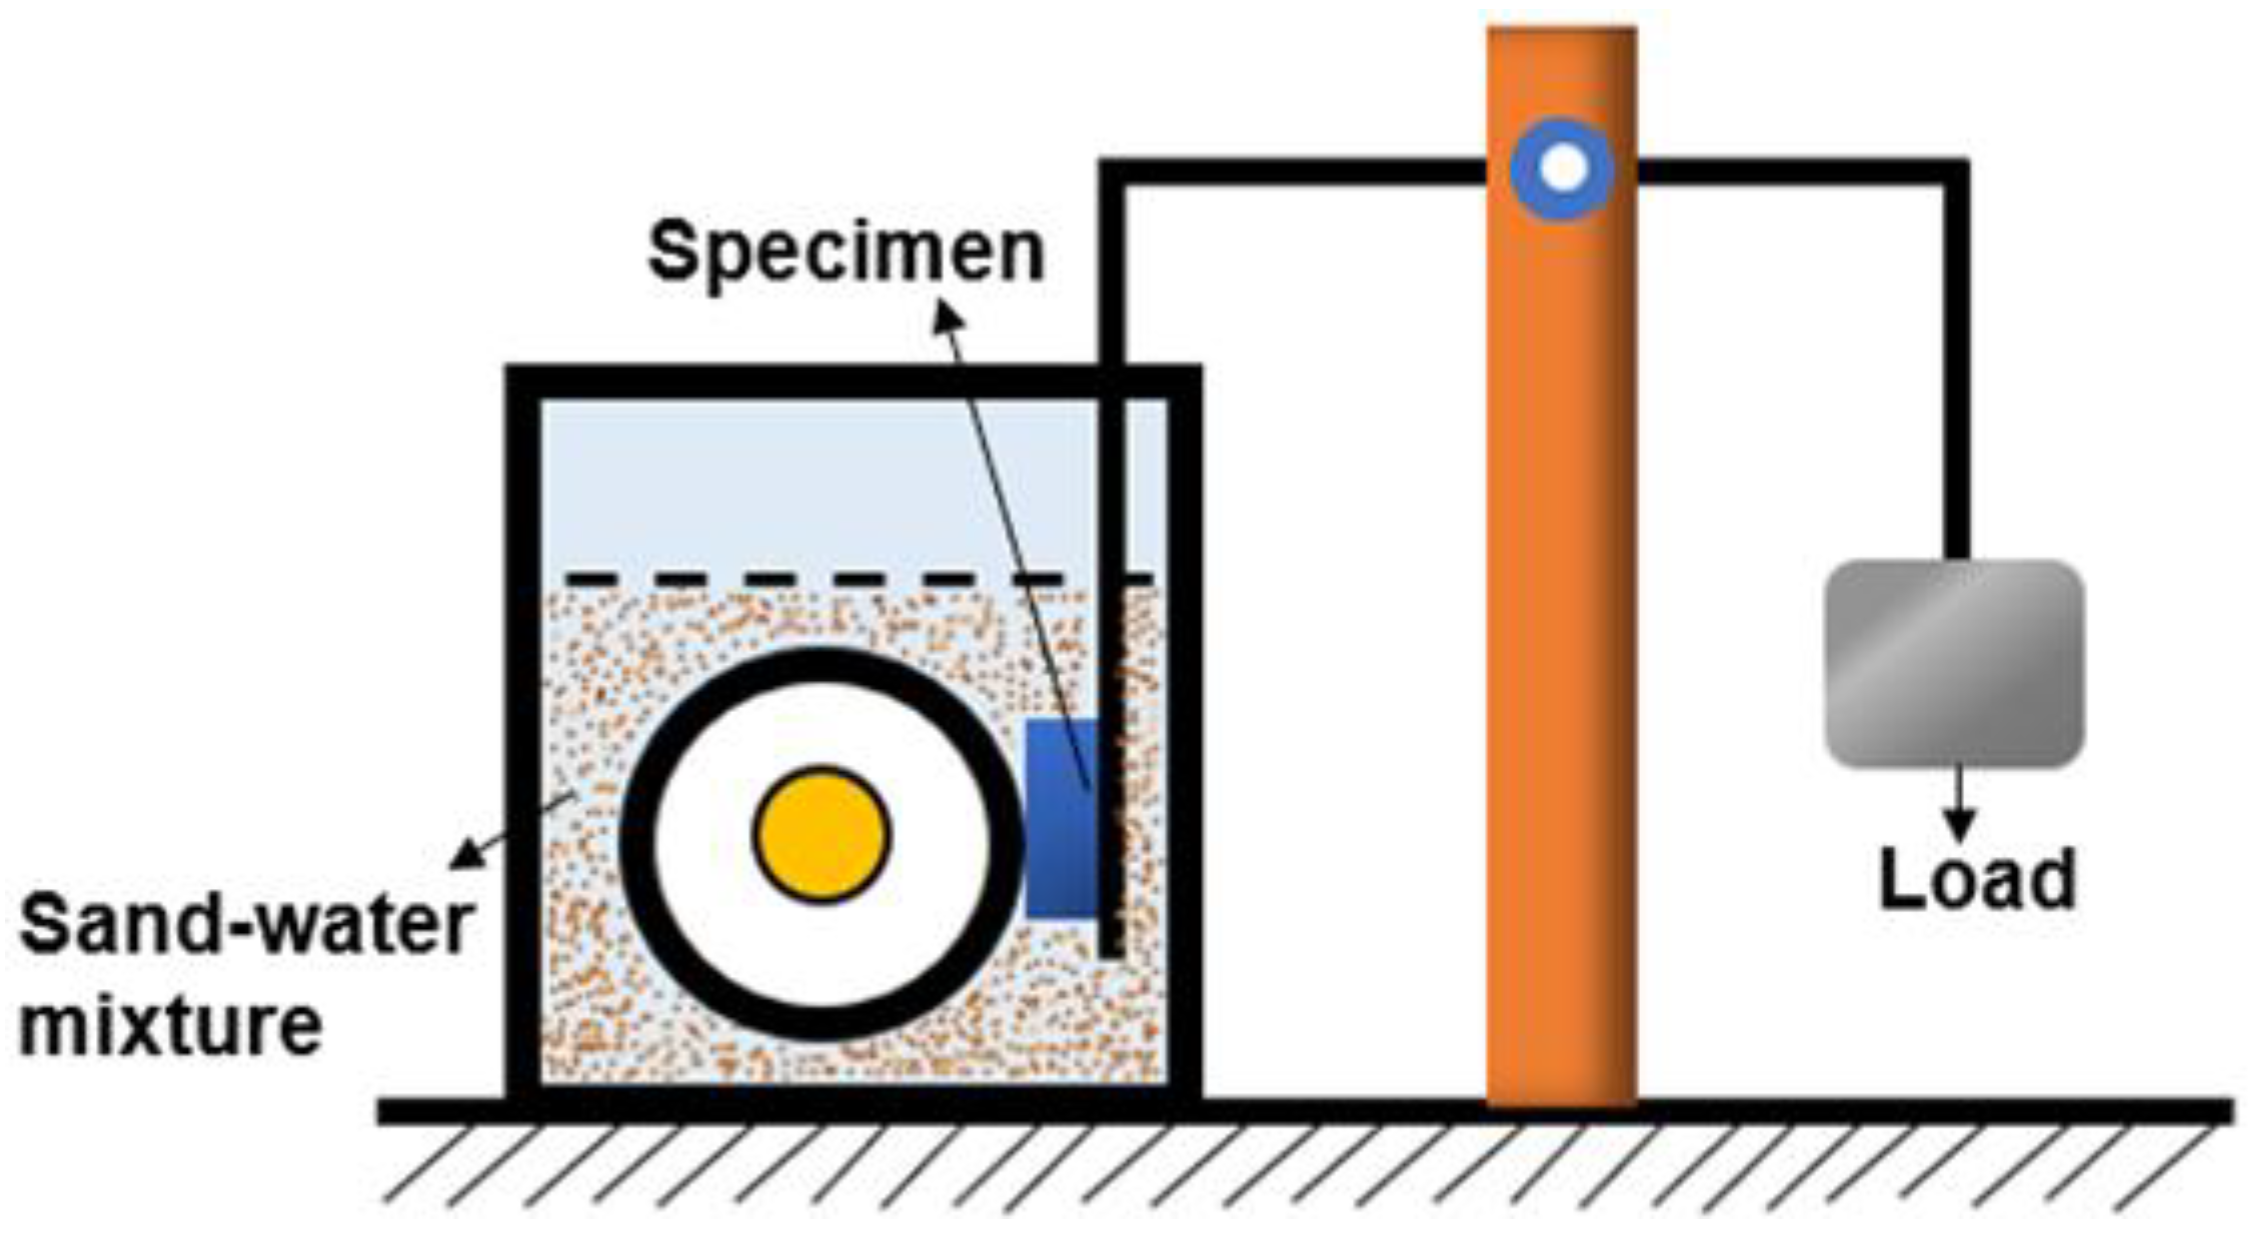
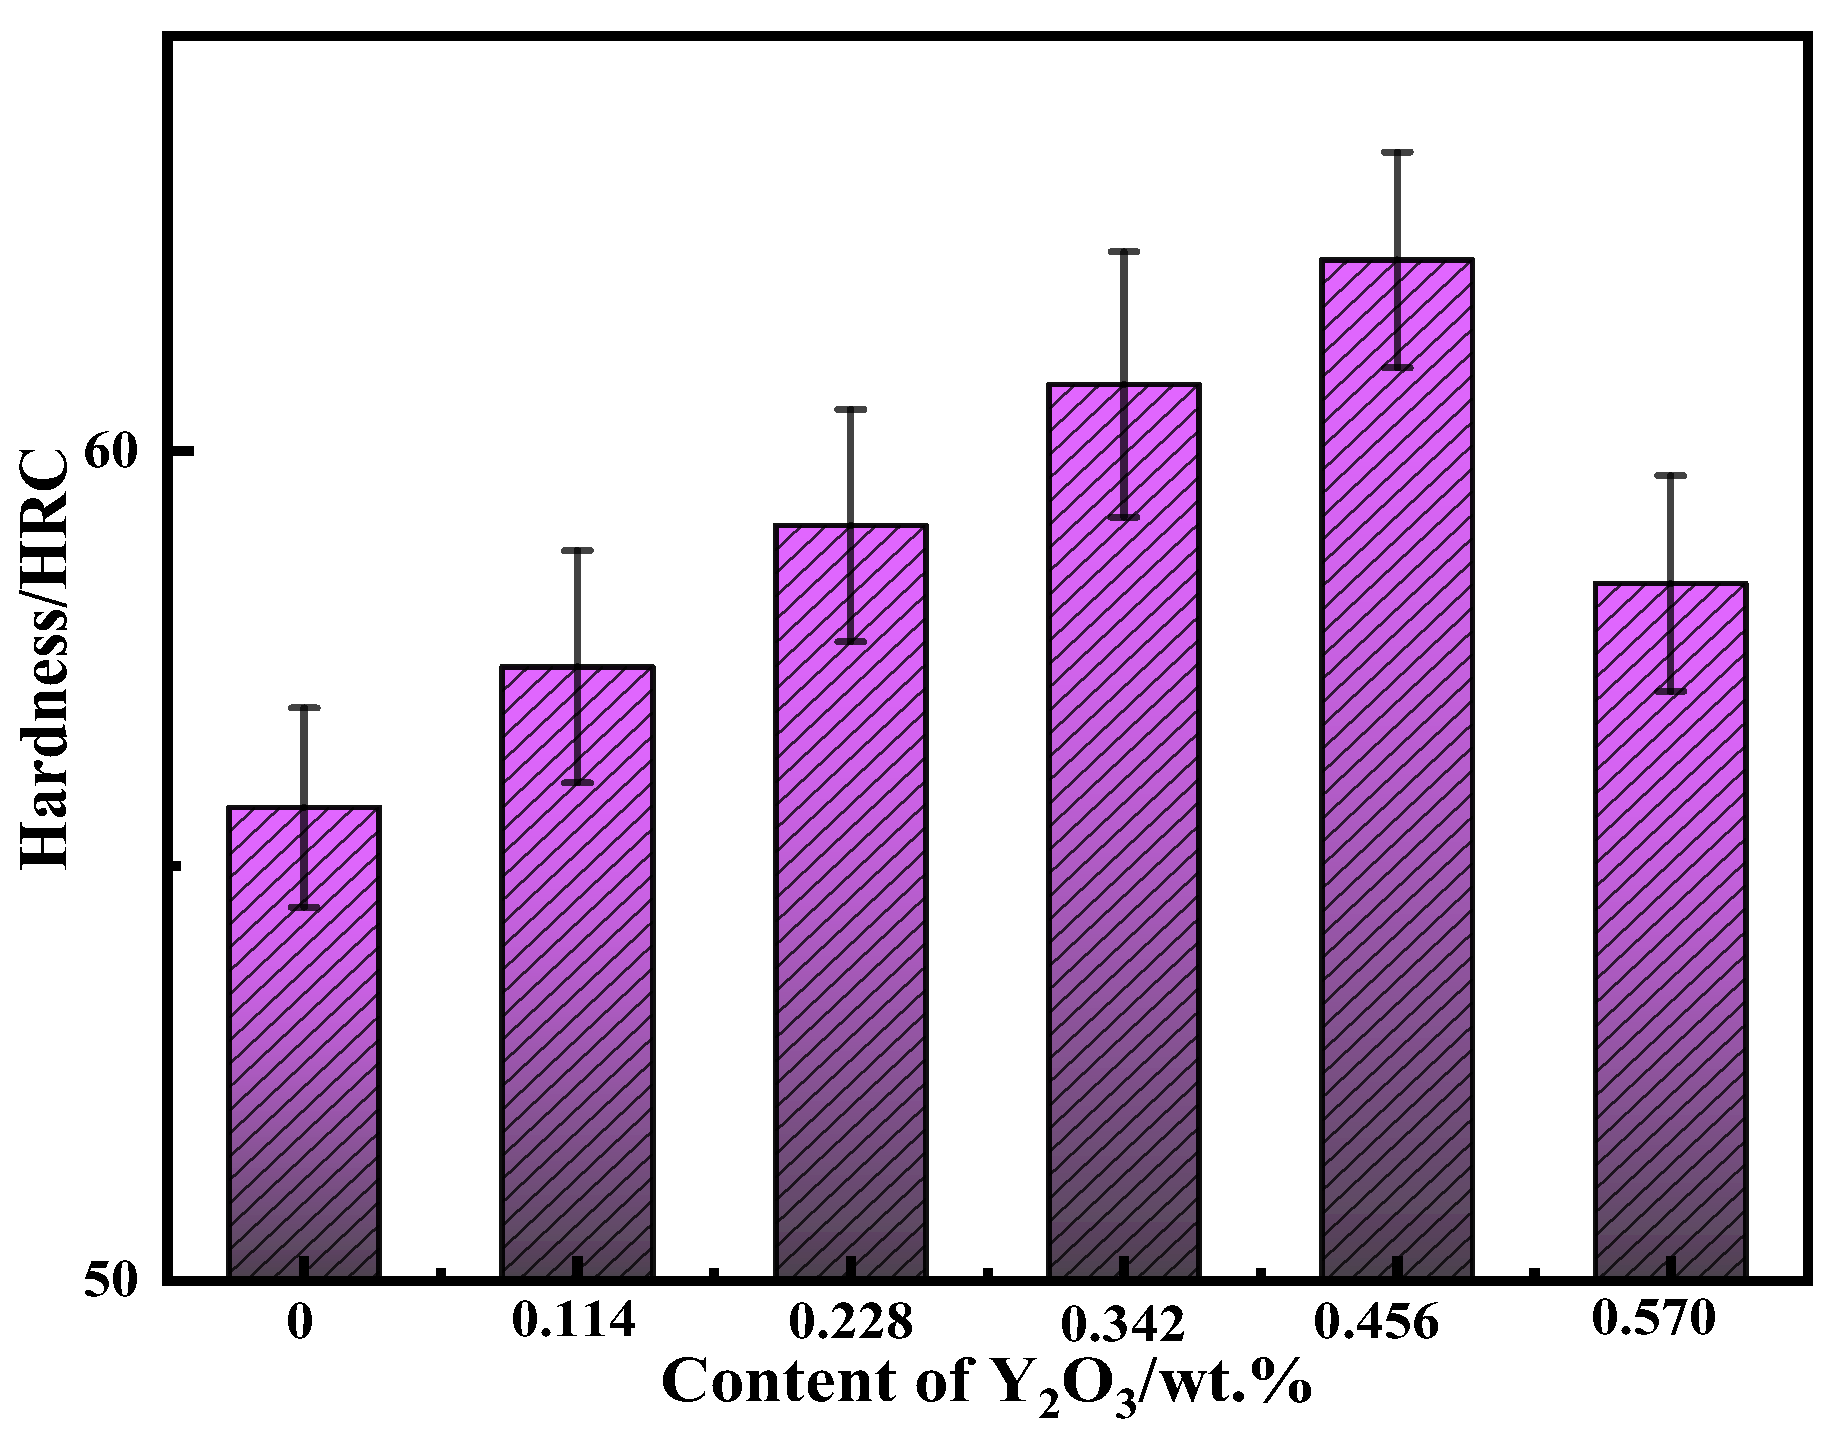
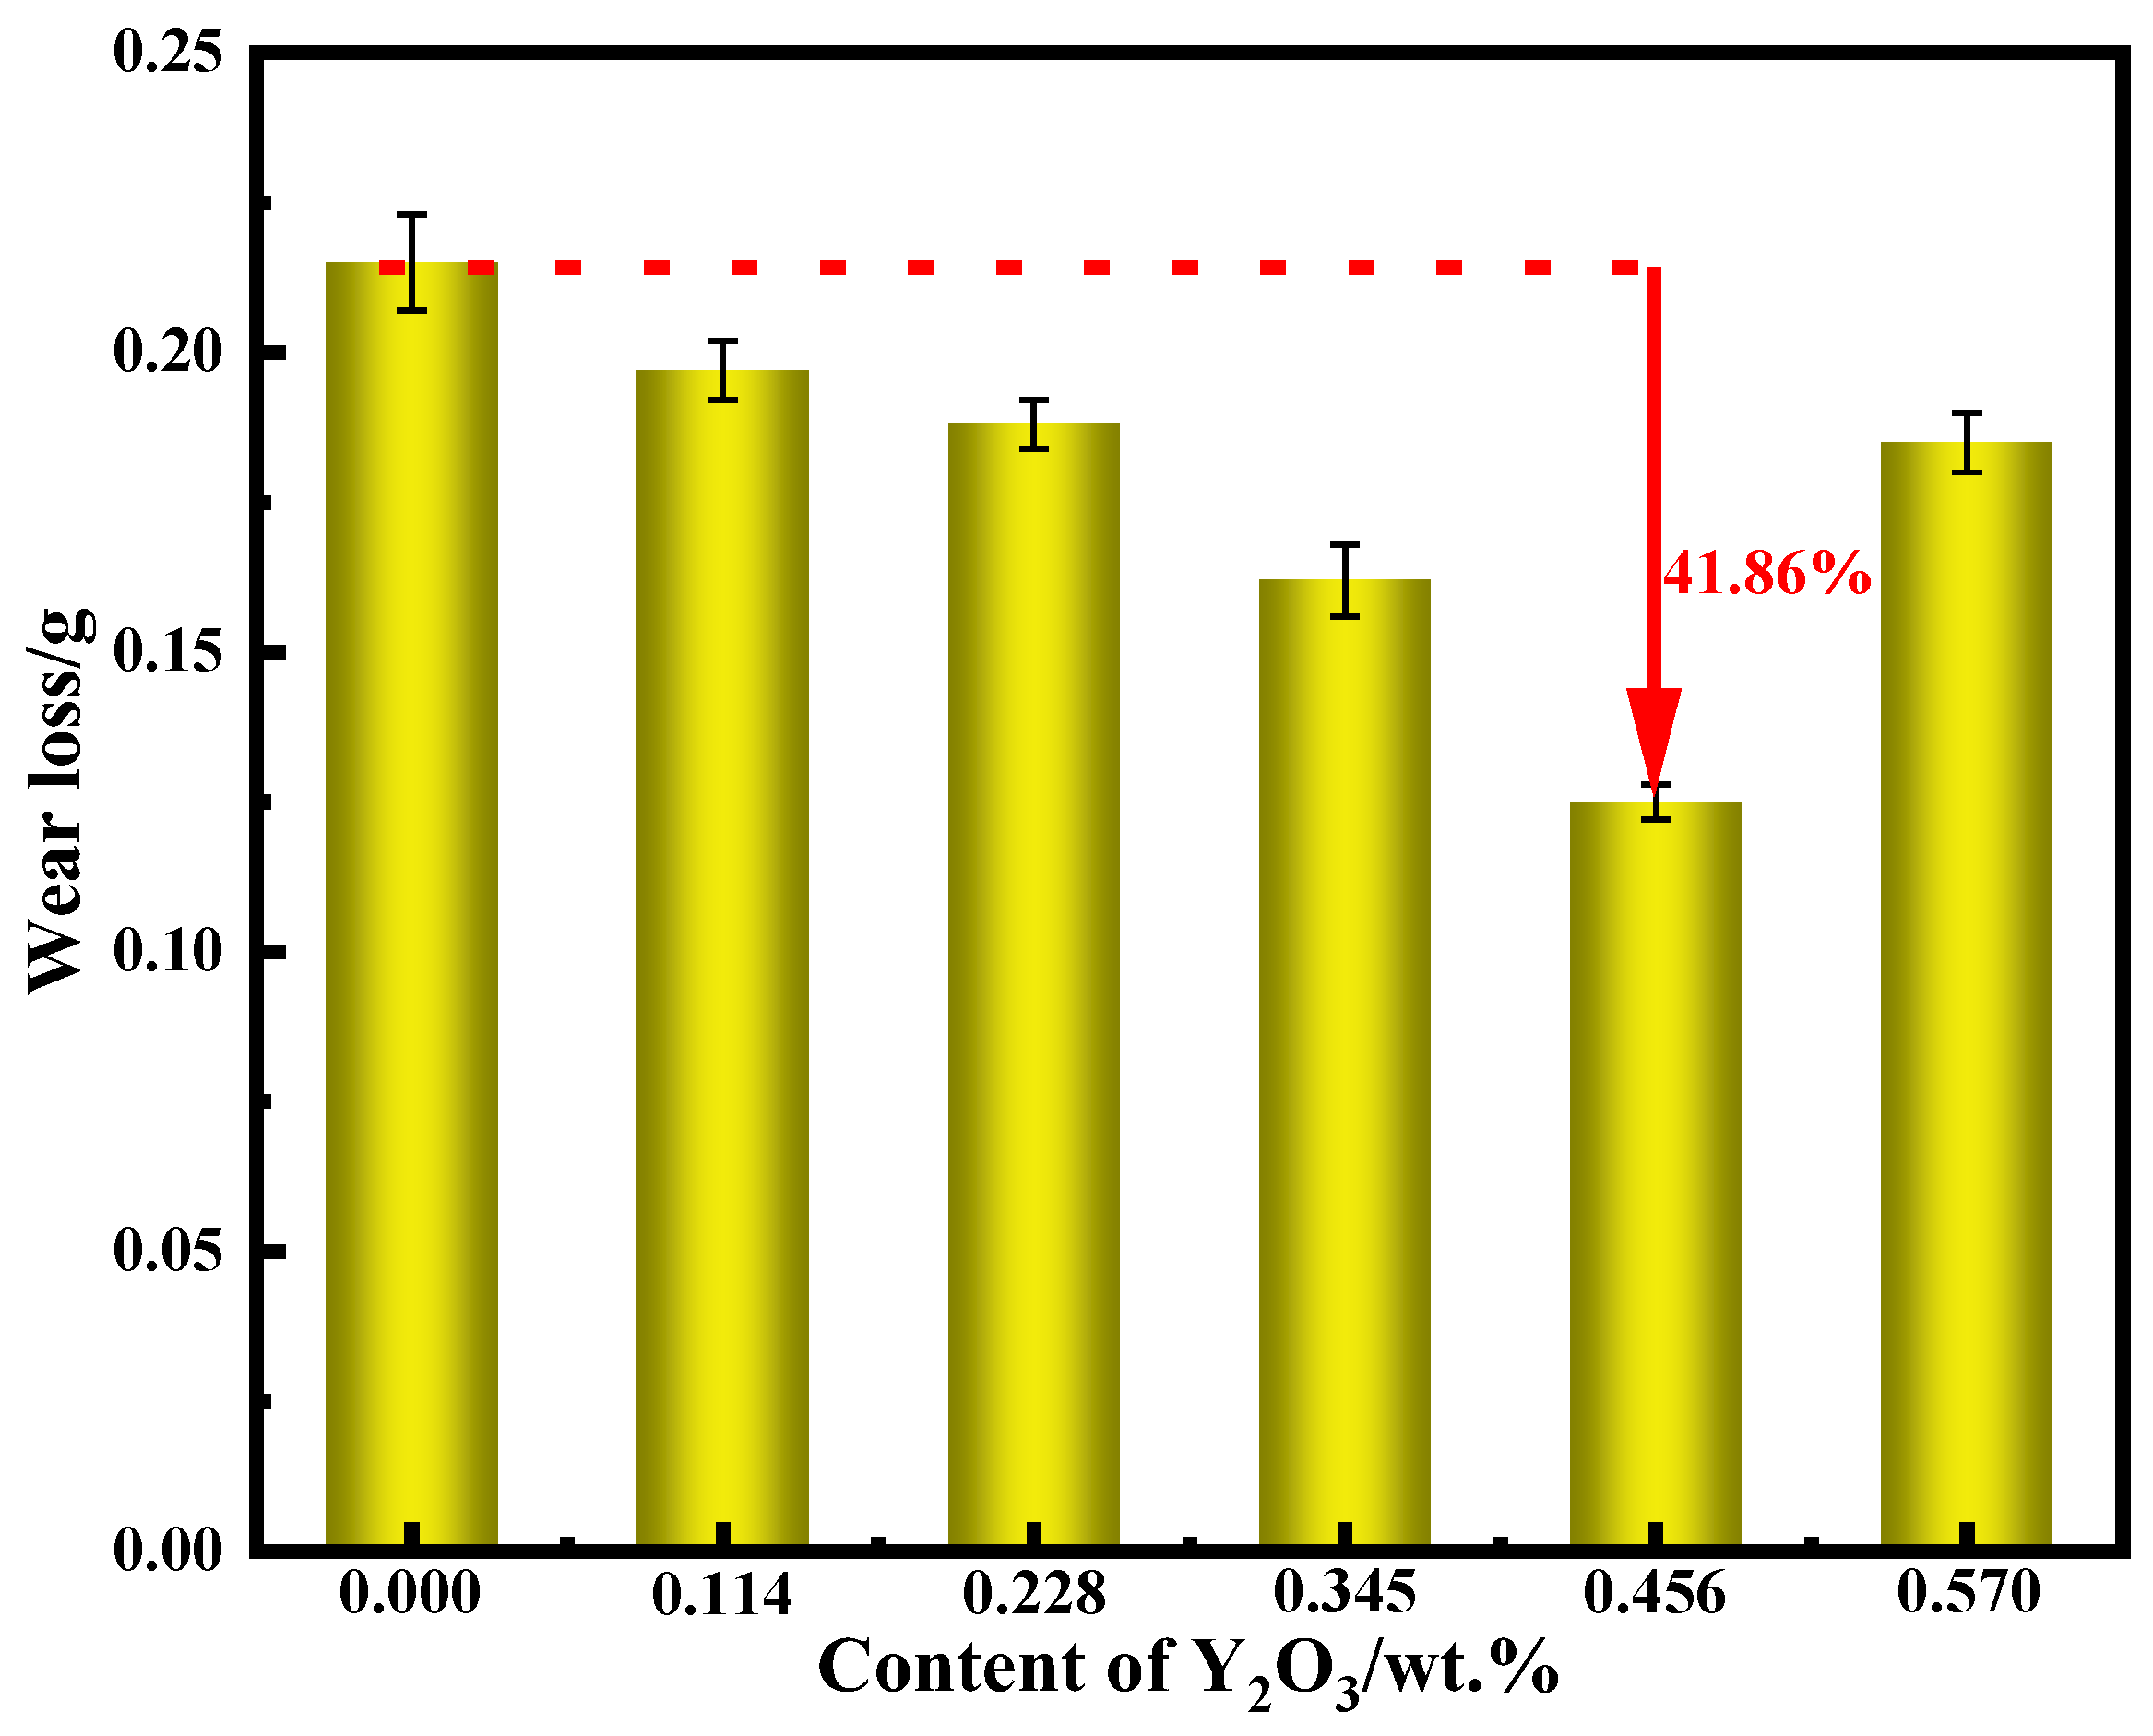
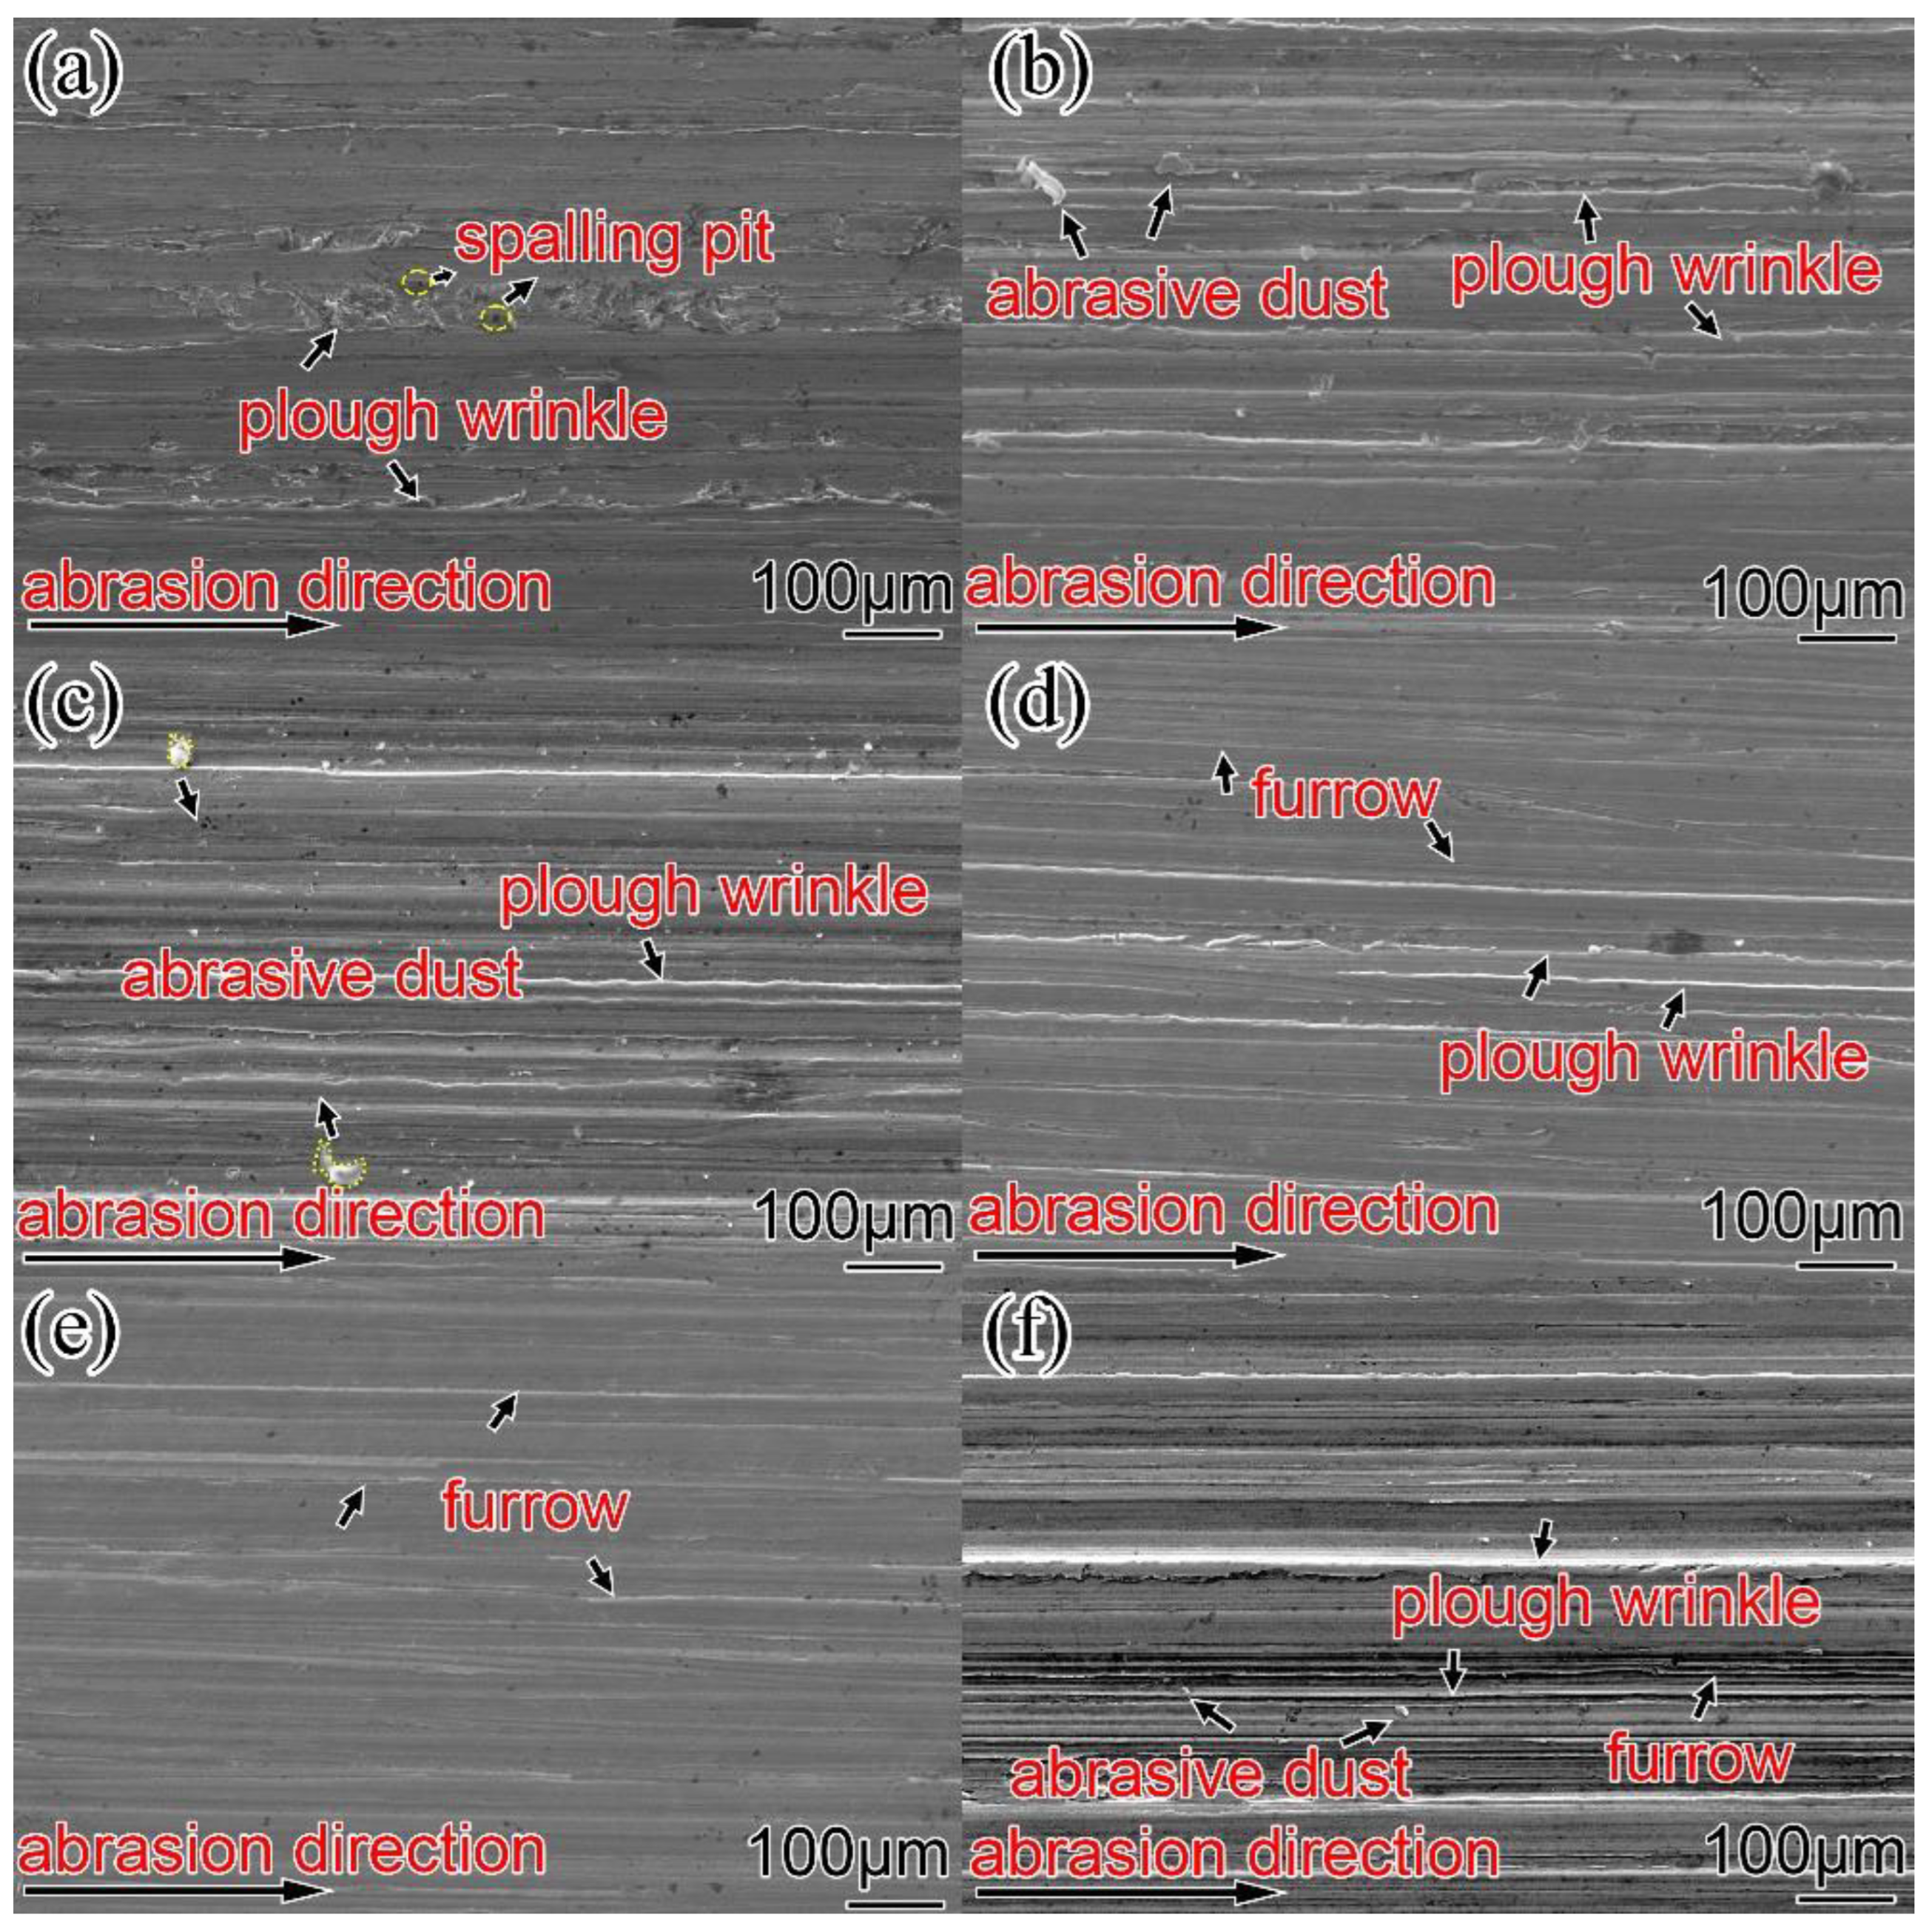
3.4. Analysis of Hardness and Wear Resistance

Figure 14 is the histogram of the Rockwell hardness change of surfacing alloy with different content of nano-Y2O3. From the diagram, it can be found that with the increase in nano-Y2O3 content, the hardness of the surfacing alloy increases first and then decreases. When nano-Y2O3 is not added, the Rockwell hardness of the surfacing alloy is 55.7 HRC. When the addition amount of nano-Y2O3 is 0.456%, the Rockwell hardness of the surfacing alloy reaches 62.3 HRC, and the Rockwell hardness increases by 11.8%. From the above volume fraction analysis results, it can be seen that with the increase in nano-Y2O3 content, the volume fraction of martensite and retained austenite in the surfacing alloy matrix does not change much, while the volume fraction of M7C3 and AlN precipitates increases significantly. However, the content of nano-Y2O3 in the surfacing alloy continues to increase, which will lead to the weakening of the fluidity of the surfacing alloy molten pool, the difficulty of slag and gas discharge, the slow cooling rate of the surfacing alloy molten pool, the long growth time of the surfacing alloy structure and the coarse structure, which will reduce the hardness of the surfacing alloy [40].
Figure 15 is the lateral microhardness distribution map of surfacing alloy with different nano-Y2O3 content. It can be found from the figure that with the increase in nano-Y2O3 content, the hardness of surfacing alloy increases first and then decreases. When the content of nano-Y2O3 reaches 0.456 wt.%, the microhardness of the surfacing alloy reaches the maximum value of 688 HV0.5, which is 23% higher than that without nano-Y2O3. Due to the low hardness of the base metal Q235 itself, it is generally around 330 HV; as the distance from the surface of the surfacing alloy is closer, the microhardness gradually increases. This is due to the dilution effect of the base metal on the surfacing alloy. The eutectic carbide M7C3 of the surfacing alloy is small, and the hardness is low.
Figure 16 is the change of wear weight loss of surfacing alloy with different content of nano-Y2O3. It can be seen from the diagram that with the increase in nano-Y2O3 additive content, the wear weight loss of the surfacing alloy decreases first and then increases. When the addition of nano-Y2O3 is 0.456 wt.%, the wear resistance of the surfacing alloy is the best, and the minimum wear loss is 0.125 g. Compared with the surfacing alloy without nano-Y2O3, the wear resistance is increased by 41.86%. As the content of the nano-Y2O3 additive continues to increase to 0.570 wt.%, the wear loss increases, and the wear rate decreases. The change trend of wear resistance of surfacing alloy with the content of nano-Y2O3 additive is basically consistent with the change in hardness. Adding an appropriate amount of nano-Y2O3 will increase the precipitation of the AlN hard phase with a small size and uniform distribution. The increase in the AlN hard phase can further improve the distribution and precipitation of M7C3. The increase in the hard phase will inevitably lead to an increase in hardness and wear resistance. The austenitic matrix has the capability of work hardening. When under the action of abrasive wear load, the surface of the surfacing alloy will undergo work hardening, which hinders the expansion of microcracks and improves the wear resistance of the surfacing alloy [41]. When excessive nano-Y2O3 is added, the microstructure of the surfacing alloy will be coarse, which will reduce the wear resistance of the surfacing alloy.
Figure 17 is the wear morphology of the surfacing alloy with different content of nano-Y2O3. Figure 17a shows the wear morphology of the surfacing alloy without nano-Y2O3. At this time, the furrow is deep, there are plow wrinkles and spalling pits, and no obvious cracks are observed on the surface. It can be seen from Figure 17b–e that after adding nano-Y2O3 to the surfacing alloy, the plow wrinkles and peeling pits on the surface of the surfacing alloy are reduced, and the furrows become shallow. It can be found from Figure 17e that when the content of nano-Y2O3 reaches 0.456 wt.%, the depth of wear marks on the surface of the surfacing alloy is the shallowest and is evenly distributed, and the spalling pits disappear. At this time, the wear resistance of surfacing alloy is the best. With the further increase in nano-Y2O3 content, the surface wear scar of the surfacing alloy becomes deeper, the surface appearance has abrasive dust and furrows, and the wear resistance of the surfacing alloy becomes worse. The appropriate amount of nano-Y2O3 can increase the precipitation of AlN, change the distribution of M7C3 and significantly improve the wear resistance of surfacing alloy.
Figure 18 shows the effect of AlN on abrasive wear. In this study, the hard phase of the surfacing alloy is mainly AlN particles + M7C3. Among them, M7C3 has high hardness and is distributed in the matrix in a grid shape, playing the role of a wear-resistant skeleton. A large number of dispersed AlN particles also play a positive role in the wear resistance of the surfacing alloy. When nano-Y2O3 is not added to the surfacing alloy, the amount of AlN precipitation is less, so that the wear resistance cannot be effectively exerted. When an appropriate amount of nano-Y2O3 is added to the surfacing alloy, the amount of AlN precipitates is large, the hard phase is evenly distributed, and the interval between them is small, which makes the abrasive unable to continuously cut the matrix, thus obtaining higher wear resistance [42].

4. Conclusions

Different contents of nano-Y2O3 were added to the Fe-Cr-C-N-Al surfacing alloy. The microstructure and mechanical properties of the modified surfacing alloy were analyzed. The evolution of the microstructure and properties of nano-Y2O3 was studied. The mechanism of abrasive wear of the surfacing alloy was discussed in detail. The conclusions are as follows:
(1)
The formability of surfacing alloy with different content of nano-Y2O3 was analyzed. It was found that adding an appropriate amount of nano-Y2O3 can obtain a surfacing alloy with good forming quality. When the nano-Y2O3 content is 0.456 wt.%, the formability of the surfacing alloy is the best, and the wetting angle is the smallest, which is 50.8°.
(2)
The addition of nano-Y2O3 does not change the phase composition of the surfacing alloy. The microstructure of the alloy is still M + γ-Fe + M7C3 + AlN. When the content of nano-Y2O3 is 0.456 wt.%, the precipitation of AlN and M7C3 is the most, and the grain size is the smallest.
(3)
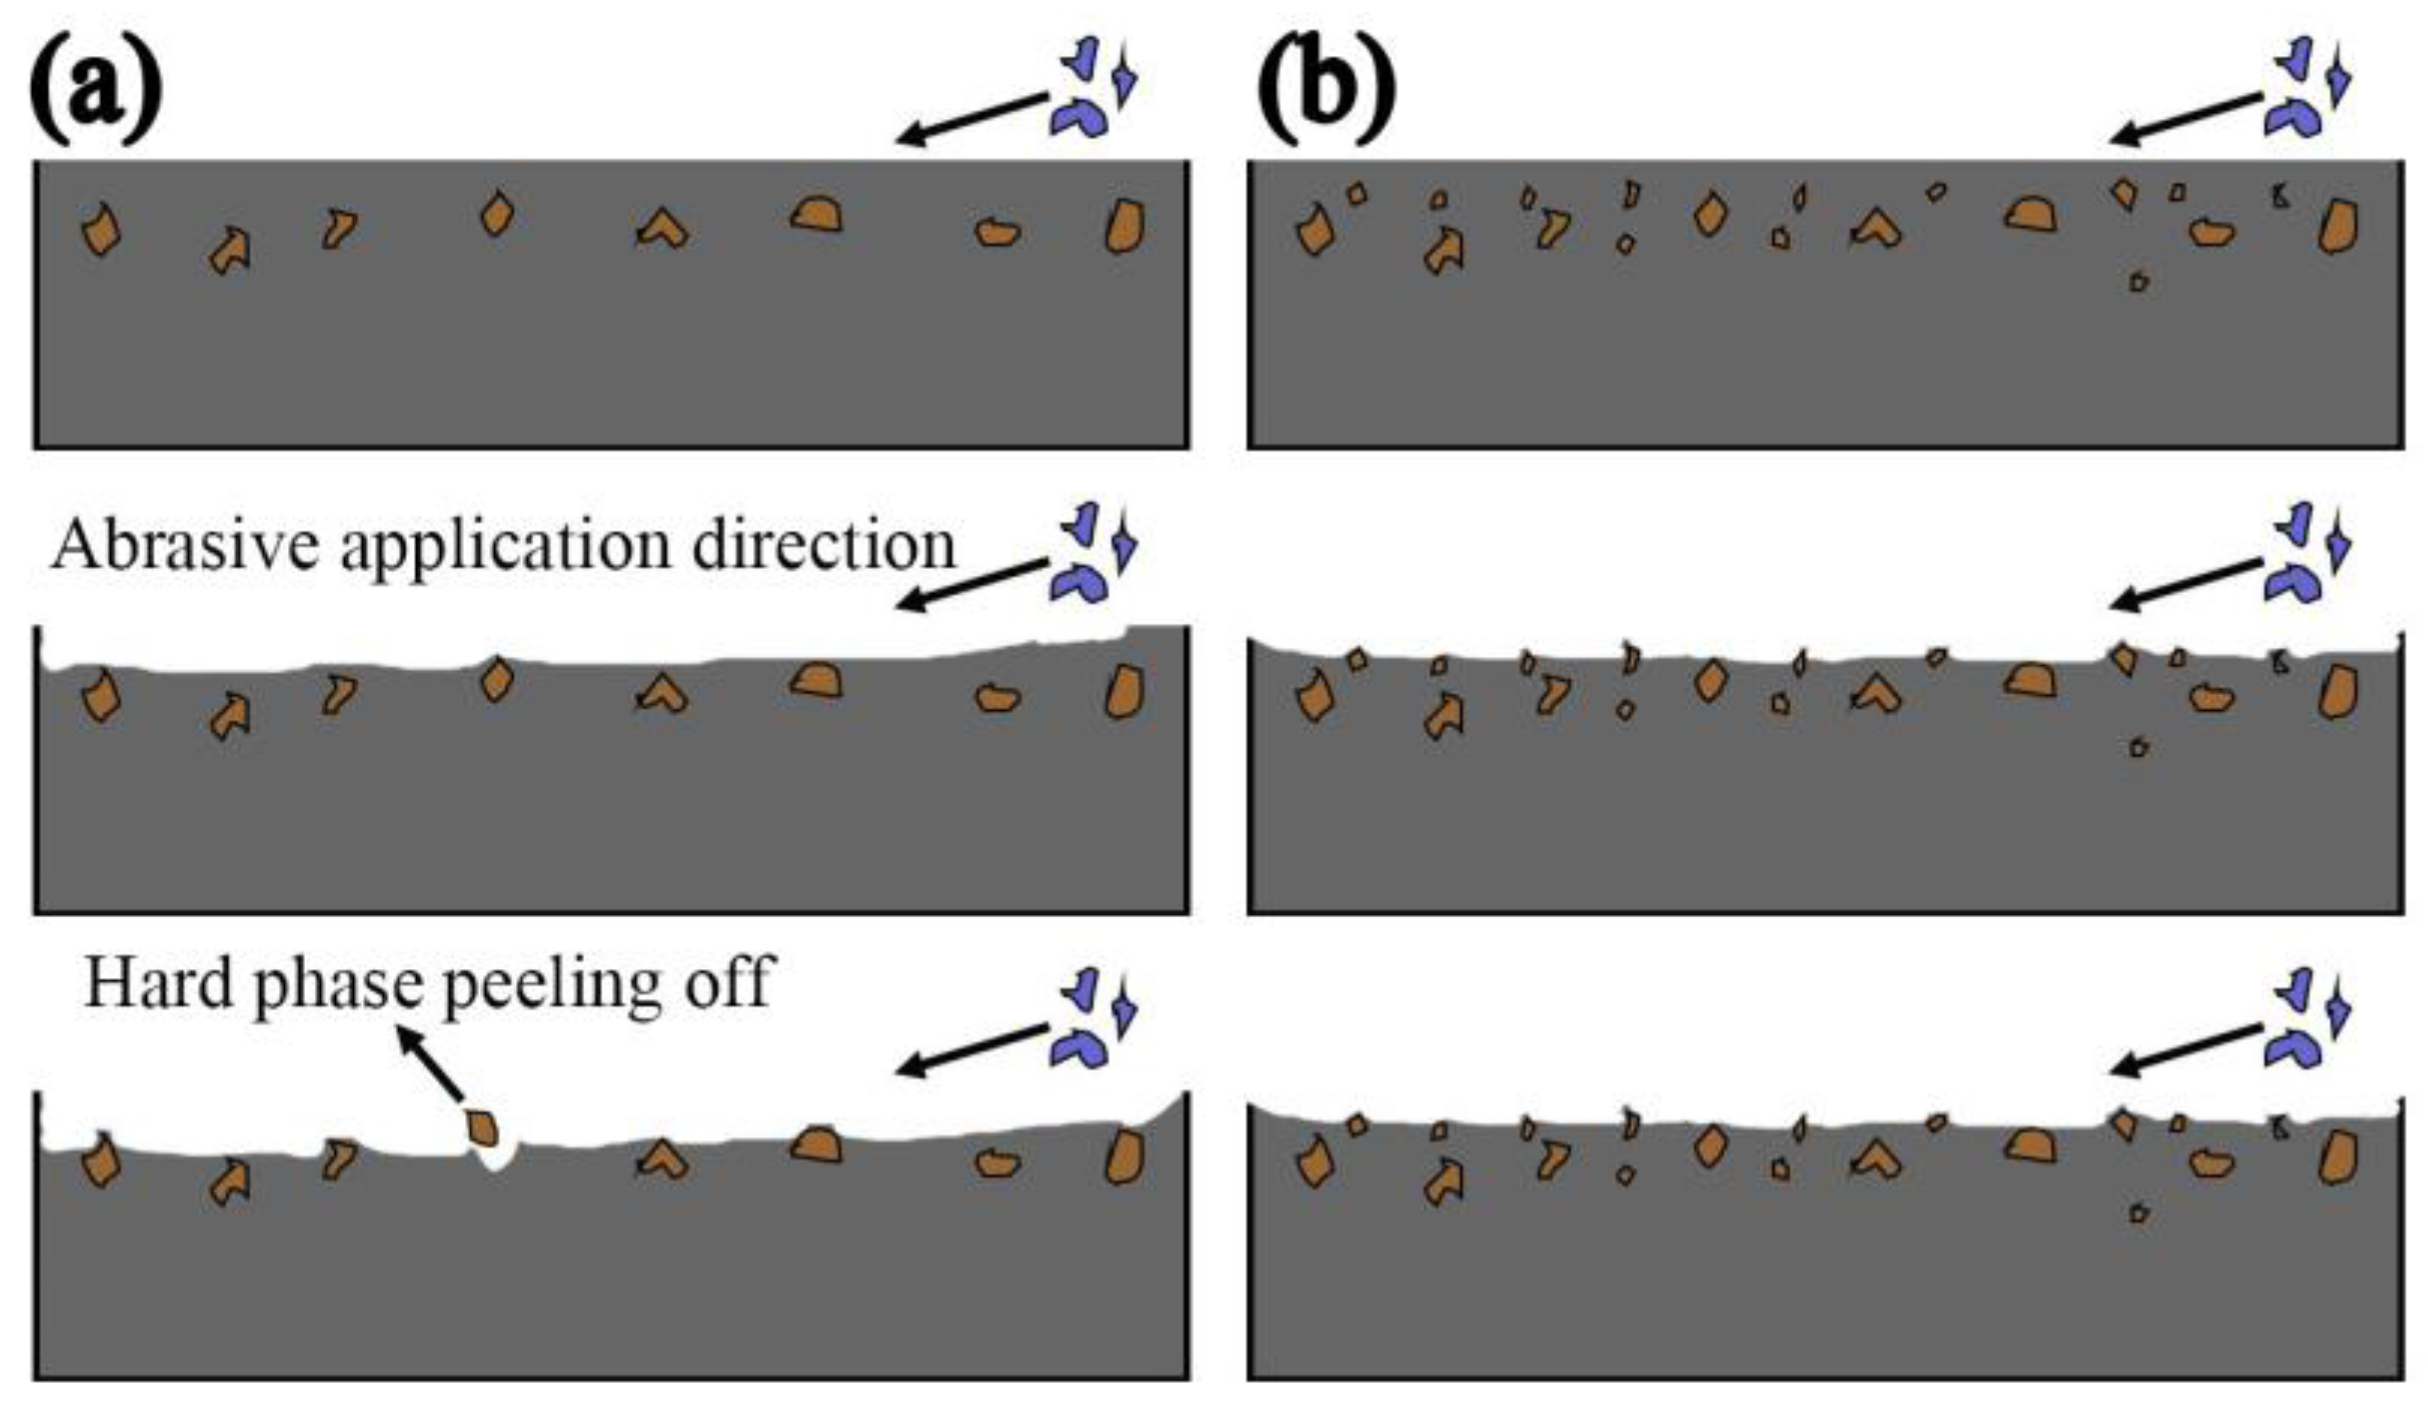
Compared with no nano-Y2O3, the hardness and wear resistance of the surfacing alloy modified by nano-Y2O3 were significantly improved. When the nano-Y2O3 content is 0.456 wt.%, the hardness of the surfacing alloy is 62.3 HRC, and the Rockwell hardness is increased by 11.8%. The minimum wear weight loss is 0.125 g, and the wear resistance is increased by 41.86%. The wear mechanism of surfacing alloy is mainly a plastic deformation mechanism, and the material removal process comprises microcutting and furrow wear.
(4)
After studying the abrasive wear mechanism, it is found that the wear resistance of the surfacing layer is not only affected by the hardness when the external conditions are constant. The size, quantity and distribution of the second phase precipitated in the surfacing alloy play a decisive role in the wear resistance of the surfacing alloy.

Author Contributions

Conceptualization, X.A. and Z.L.; methodology, X.A.; software, Z.Z.; data curation, Z.Z.; writing—original draft preparation, X.A.; writing—review and editing, X.A. All authors have read and agreed to the published version of the manuscript.

Funding

This research received no external funding.

Institutional Review Board Statement

Not applicable.

Informed Consent Statement

Not applicable.

Data Availability Statement

All the data and results supporting this research paper are already presented within this publication.

Conflicts of Interest

The authors declare no conflict of interest.

References

  1. Bembenek, M.; Prysyazhnyuk, P.; Shihab, T.; Machnik, R.; Ivanov, O.; Ropyak, L. Microstructure and Wear Characterization of the Fe-Mo-B-C—Based Hardfacing Alloys Deposited by Flux-Cored Arc Welding. Materials 2022, 15, 5074. [Google Scholar] [CrossRef] [PubMed]
  2. Holmberg, K.; Erdemir, A. Influence of tribology on global energy consumption, costs and emissions. Friction 2017, 5, 263–284. [Google Scholar] [CrossRef] [Green Version]
  3. Sousa, J.; Lobato, M.; Garcia, D.; Machado, P. Abrasion resistance of Fe-Cr-C coating deposited by FCAW welding process. Wear 2021, 476, 203688. [Google Scholar] [CrossRef]
  4. Venkatesh, B.; Sriker, K.; Prabhakar, V. Wear characteristics of hardfacing alloys: State-of-the-art. Procedia Mater. Sci. 2015, 10, 527–532. [Google Scholar] [CrossRef] [Green Version]
  5. Rojacz, H.; Katsich, C.; Kirchgassner, M.; Kirchmayer, R. Badisch EImpact-abrasive wear of martensitic steels and complex iron-based hardfacing alloys. Wear 2022, 492–493, 204183. [Google Scholar]
  6. Garbade, R.; Dhokey, N. Effect of mechanical alloying of Ti and B in pre alloyed gas atomized powder on carbide dispersed austenitic matrix of Iron based hardfacing alloy. Mater. Charact. 2022, 191, 112134. [Google Scholar] [CrossRef]
  7. Günen, A.; Gürol, U.; Koçak, M.; Çam, G. A new approach to improve some properties of wire arc additively manufactured stainless steel components: Simultaneous homogenization and boriding. Surf. Coat. Technol. 2023, 460, 129395. [Google Scholar] [CrossRef]
  8. Günen, A.; Gürol, U.; Koçak, M.; Çam, G. Investigation into the influence of boronizing on the wear behavior of additively manufactured Inconel 625 alloy at elevated temperature. Prog. Addit. Manuf. 2023. [Google Scholar] [CrossRef]
  9. Buytoz, S. Microstructural properties of M7C3 eutectic carbides in a Fe-Cr-C Alloy. Mater. Lett. 2006, 60, 605–608. [Google Scholar] [CrossRef]
  10. Fan, C.; Chen, M.; Chia Chang, M.; Wu, W. Microstructure Change Caused by (Cr, Fe)23C6 Carbides in High Chromium Fe-Cr-C Hardfacing Alloys. Surf. Coat. Technol. 2006, 201, 908–912. [Google Scholar] [CrossRef]
  11. Yang, K.; Xie, X.; Bao, Y. Effect of niobium and titanium carbonitride precipitates on the high-temperature wear behavior of hardfacing alloy. Tribology 2010, 30, 15–19. [Google Scholar]
  12. Ke, Y.; Qin, Y.; Bao, Y. Effect of carbonitride precipitates on the solid/liquid erosion behaviour of hardfacing alloy. Appl. Surf. Sci. 2013, 284, 540–544. [Google Scholar]
  13. Wei, S.; Liu, Y.; Zhang, G.; Xu, L.; Li, J.; Ren, Y. Microstructure and Wear Resistance of Fe-Cr-C Hardfacing Alloy Reinforced by Titanium Carbonitride. Tribol. Trans. 2015, 58, 745–749. [Google Scholar] [CrossRef]
  14. Amuda, M.; Akinlabi, E.T.; Moolla, M. Microstructure evolution in Ti6Al4V alloy laser cladded with Premix Ti + TiB2 powders. Mater. Today Proc. 2017, 4, 763–7736. [Google Scholar]
  15. Li, M.; Huang, J.; Zhu, Y. Effect of heat input on the microstructure of in-situ synthesized TiN-TiB/Ti based composite coating by laser cladding. Surf. Coat. Technol. 2012, 206, 4021–4026. [Google Scholar] [CrossRef]
  16. Qi, C.; Zhan, X.; Gao, Q. The influence of the pre-placed powder layers on the morphology, microscopic characteristics and microhardness of Ti-6Al-4V/WC MMC coatings during laser cladding. Opt. Laser Technol. 2019, 119, 1055721–1055729. [Google Scholar] [CrossRef]
  17. Li, Q.; Lei, Y.; Fu, H. Growth Characteristics and Reinforcing Behavior of In-situ NbCp in Laser Cladded Fe-based Composite Coating. J. Mater. Sci. Technol. 2015, 31, 766–772. [Google Scholar] [CrossRef]
  18. Li, J.; Luo, X.; Li, G. Effect of Y2O3 on the sliding wear resistance of TiB/TiC-reinforced composite coatings fabricated by laser cladding. Wear 2014, 310, 72–82. [Google Scholar] [CrossRef]
  19. Debta, M.K.; Masanta, M. Effect of nano-Y2O3 on the microstructure and wear behaviour of TIG cladded TiC-Co-nY2O3 coating. Int. J. Refract. Met. H. 2023, 111, 106078. [Google Scholar] [CrossRef]
  20. Shu, D.; Cui, X.; Li, Z. Effect of the Rare Earth Oxide CeO2 on the Microstructure and Properties of the Nano-WC-Reinforced Ni-Based Composite Coating. Metals 2020, 10, 383. [Google Scholar] [CrossRef] [Green Version]
  21. Zhang, H.; Zou, Y.; Zou, Z.D.; Wu, D.T. Microstructure and properties of Fe-based composite coating by laser cladding Fe-Ti-V-Cr-C-CeO2 powder. Opt. Laser Technol. 2015, 65, 119–125. [Google Scholar] [CrossRef]
  22. Zhang, T.; Xiao, H.; Zhang, Z. Effect of Y2O3 Addition on Microstructural Characteristics and Microhardness of Laser-Cladded Ti-6Al-4V Alloy Coating. J. Mater. Eng. Perform. 2020, 29, 8221–8235. [Google Scholar] [CrossRef]
  23. Li, M.; Zhang, S.; Li, H. Effect of nano-CeO2 on cobalt-based alloy laser coatings. J. Mater. Process. Technol. 2008, 202, 107–111. [Google Scholar] [CrossRef]
  24. Zhang, K.; Zou, J.; Jun, L. Synthesis of Y2O3 particle enhanced Ni/TiC composite on TC4 Ti alloy by laser cladding. Trans. Nonferrous Met. Soc. China 2012, 22, 1817–1823. [Google Scholar] [CrossRef]
  25. Chen, J. Effects of CeO2 on Microstructural Evolution, Corrosion and Tribology Behavior of Laser Cladded TiC Reinforced Co-based Coatings. Int. J. Electrochem. Sci. 2021, 16, 210511. [Google Scholar] [CrossRef]
  26. Yun, X.; Zhou, Y.; Zhao, B. Influence of Nano-Y2O3 on Wear Resistance of Hypereutectic Fe-Cr-C Hardfacing Coating. Tribol. Lett. 2015, 58, 23. [Google Scholar] [CrossRef]
  27. Lee, J.E.; Kim, K.S.; Inoue, M. Effects of Ag and Cu addition on microstructure properties and oxidation resistance of Sn-Zn eutectic alloy. J. Alloys Compd. 2008, 454, 310–320. [Google Scholar] [CrossRef]
  28. Chen, C.M.; Chen, C.H. Interfacial Reactions between Eutectic SnZn Solder and Bulk or Thin-Film Cu Substrates. J. Electron. Mater. 2007, 36, 1363–1371. [Google Scholar] [CrossRef]
  29. Sharif, A.; Chan, Y.C. Effect of substrate metallization on interfacial reactions and reliability of Sn-Zn-Bi solder joints. Microelectron. Eng. 2007, 84, 328–335. [Google Scholar] [CrossRef]
  30. Lin, Y.C.; Wang, T.H. Effects of Rare Earth Y2O3 on the Microstructure and Wear Behaviors of Ti-6Al-4V Cladding with SiC. Mater. Sci. Forum 2018, 934, 89–94. [Google Scholar] [CrossRef]
  31. Liu, W.; Tong, W.; Lu, X. Effects of different types of rare earth oxide additives on the properties of silicon nitride ceramic substrates. Ceram. Int. 2019, 45, 12436–12442. [Google Scholar] [CrossRef]
  32. Attinger, D.; Zhao, Z.; Poulikakos, D. An Experimental Study of Molten Microdroplet Surface Deposition and Solidification: Transient Behavior and Wetting Angle Dynamics. J. Heat Transf. 2000, 122, 544–556. [Google Scholar] [CrossRef]
  33. Zhu, R.D.; Li, Z.Y.; Li, X.X. Microstructure and properties of the low-power-laser clad coatings on magnesium alloy with different amount of rare earth addition. Appl. Surf. Sci. 2015, 353, 405–413. [Google Scholar] [CrossRef]
  34. Zhang, M.; Wang, X.H.; Qu, K.L. Effect of Rare Earth Oxide on Microstructure and High Temperature Oxidation Properties of Laser Cladding Coatings on 5CrNiMo Die Steel Substrate. Opt. Laser Technol. 2019, 119, 105597. [Google Scholar] [CrossRef]
  35. Li, X.F.; Feng, Y.H.; Liu, B. Influence of NbC Particles on Microstructure and Mechanical Properties of AlCoCrFeNi High-Entropy Alloy Coatings Prepared by Laser Cladding. J. Alloys Compd. 2019, 788, 485–494. [Google Scholar] [CrossRef]
  36. Sun, S.T.; Fu, H.G.; Ping, X.L. Effect of CeO2 Addition on Microstructure and Mechanical Properties of in-situ (Ti, Nb)C/Ni Coating. Surf. Coat. Technol. 2019, 359, 300–313. [Google Scholar] [CrossRef]
  37. Wang, C.L.; Gao, Y.; Wang, R. Microstructure of Laser-Clad Ni60 Cladding Layers Added with Different Amounts of Rare-Earth Oxides on 6063 Al Alloys. J. Alloys Compd. 2018, 740, 1099–1107. [Google Scholar] [CrossRef]
  38. Ma, S.Q.; Xing, J.D.; He, Y.L.; Li, Y.F.; Huang, Z.F.; Liu, G.Z.; Geng, Q.J. Microstructure and crystallography of M7C3 carbide in chromium cast iron. Mater. Chem. Phys. 2015, 161, 65–73. [Google Scholar] [CrossRef]
  39. Wen, Y.; Guan, B.; Xin, Y. Solute atom mediated Hall-Petch relations for magnesium binary alloys. Scr. Mater. 2022, 210, 114451. [Google Scholar] [CrossRef]
  40. Hou, Q.Y.; Huang, Z.Y.; Gao, J.S. Effects of Y2O3 on the microstructure and wear resistance of cobalt-based alloy coatings deposited by plasma transferred arc process. Rare Earth 2007, 26, 103–109. [Google Scholar] [CrossRef]
  41. Yang, J.; Hou, X.R.; Zhang, P.; Zhou, Y.F.; Yang, Y.L.; Ren, X.J.; Yang, Q.X. Mechanical properties of the hypereutectoid Fe-Cr-C hardfacing coatings with different nano-Y2O3 additives and the mechanism analysis. Mater. Sci. Eng. A 2016, 655, 346–354. [Google Scholar] [CrossRef]
  42. Chang, C.M.; Chen, Y.C.; Wu, W. Microstructural and abrasive characteristics of high carbon Fe-Cr-C hardfacing alloy. Tribol. Int. 2010, 43, 929–934. [Google Scholar] [CrossRef]
Figure 1. Schematic diagram of surfacing welding process.
Crystals 13 01023 g001
Figure 2. Schematic diagram of sampling location.
Crystals 13 01023 g002
Figure 3. Schematic diagram of abrasion test.
Crystals 13 01023 g003
Figure 4. Schematic diagram of wetting.
Crystals 13 01023 g004
Figure 5. Cross-sectional morphology of surfacing alloy with different content of Y2O3 (a) 0 wt.% Y2O3, (b) 0.114 wt.% Y2O3, (c) 0.228 wt.% Y2O3, (d) 0.342 wt.% Y2O3 (e) 0.456 wt.% Y2O3, (f) 0.570 wt.% Y2O3.
Crystals 13 01023 g005
Figure 6. XRD diffraction pattern of the surfacing alloys with different content of nano-Y2O3.
Crystals 13 01023 g006
Figure 7. Microstructure metallographic diagram of surfacing alloy with different nano-Y2O3 content (a) 0 wt.% Y2O3, (b) 0.114 wt.% Y2O3, (c) 0.228 wt.% Y2O3, (d) 0.342 wt.% Y2O3 (e) 0.456 wt.% Y2O3, (f) 0.570 wt.% Y2O3.
Crystals 13 01023 g007
Figure 8. Microstructure of 0.456 wt.% Y2O3 surfacing alloy and EDS element mapping analysis (a) morphology of microstructure, (b) Fe, (c) Cr, (d) N, (e) Al, (f) Cr/Al.
Crystals 13 01023 g008
Figure 9. STEM image and selected area electron diffraction pattern of 0.456 wt.% Y2O3 surfacing alloy matrix microstructure (a) γ-Fe, (b) M.
Crystals 13 01023 g009
Figure 10. STEM-BF image of 0.456 wt.% Y2O3 surfacing alloy eutectic carbide and STEM-EDS maps (a) Morphology of eutectic carbide and SAED patterns, (bf) STEM-EDS maps corresponding to (a).
Crystals 13 01023 g010
Figure 11. STEM-BF image of 0.456 wt.% Y2O3 surfacing alloy hardening phase and STEM-EDS maps (a) Morphology of hardening phase, (b) SAED patterns of A, (c) SAED patterns of B, (di) STEM-EDS maps corresponding to (a).
Crystals 13 01023 g011
Figure 12. IPF diagram and grain size statistics of surfacing alloy with different nano-Y2O3 contents (a) 0 wt.% Y2O3 IPF diagram, (b) grain size statistics to (a,c) 0.456 wt.% Y2O3 IPF diagram, (d) grain size statistics to (c,e) 0.570 wt.% Y2O3 IPF diagram, (f) grain size statistics to (e).
Crystals 13 01023 g012
Figure 13. Effect of different nano-Y2O3 content on the volume fraction of the phase in surfacing alloy.
Crystals 13 01023 g013
Figure 14. Rockwell hardness curve of surfacing alloy with different Y2O3 content.
Crystals 13 01023 g014
Figure 15. Microhardness across the vertical section of surfacing layer with different Y2O3 content.
Crystals 13 01023 g015
Figure 16. Abrasion weight loss of surfacing alloys with different Y2O3 content.
Crystals 13 01023 g016
Figure 17. Abrasion morphology of surfacing alloy with different Y2O3 content: (a) 0 wt.% Y2O3, (b) 0.114 wt.% Y2O3, (c) 0.228 wt.% Y2O3, (d) 0.342 wt.% Y2O3 (e) 0.456 wt.% Y2O3, (f) 0.570 wt.% Y2O3.
Crystals 13 01023 g017
Figure 18. Schematic diagram of the effect of AlN hardening phase on abrasive wear: (a) small amount of AlN, (b) large amount of AlN.
Crystals 13 01023 g018
Table 1. Chemical composition of H08A steel strip and base metal (mass fraction, wt.%).
CSiMnSpFe
Q2350.14–0.22≤0.300.30–0.65<0.045<0.045Bal
H08A<0.01≤0.030.30–0.55≤0.03≤0.03Bal
Table 2. Slag system content of self-shielded flux-cored wires (mass fraction, wt.%).
CaF2SiO2CaOMgOAl2O3
Content1.2–1.50.8–1.00.3–0.50.2–0.51.0–1.5
Table 3. Chemical composition of wear-resistant surfacing alloys with different Y content.
NumberCCrNAlYFe
02.6715.320.393.24Bal.
12.4313.850.393.63<0.01Bal.
22.6613.610.413.69<0.01Bal.
32.5815.310.453.840.02Bal.
42.7116.210.513.810.03Bal.
52.5714.870.483.790.04Bal.
Disclaimer/Publisher’s Note: The statements, opinions and data contained in all publications are solely those of the individual author(s) and contributor(s) and not of MDPI and/or the editor(s). MDPI and/or the editor(s) disclaim responsibility for any injury to people or property resulting from any ideas, methods, instructions or products referred to in the content.

