Abstract
Three octahedral iron(III) nitrate complexes with dimethylated urea ligand isomers, [hexakis(N,N’-dimethylurea-O)iron(III)] nitrate (compound 1), trans-[diaquatetrakis(N,N-dimethylurea-O)iron(III)] nitrate (compound 2), and [hexakis(N,N-dimethylurea-O)iron(III)] nitrate trihydrate (compound 3) were prepared and characterized with single crystal X-ray diffraction, IR, Raman and UV–Vis methods. In compounds 1 and 3, six dimethylurea ligands coordinate to the central FeIII ion via the oxygen in octahedral geometry and the ligands are arranged in a propeller-like manner, dividing the complex cations into two sides. In compound 1, the dimethylurea propellers screw in the opposite direction on the two sides of the complex and in compound 3, they are arranged with the same handedness on the two sides. The complexes have helical chirality. The two sides of the complex cations differ not only in the rotation direction of the ligands but also in the hydrogen bond formation. On one side of the complex cation, the ligands form intermolecular hydrogen bonds only with the crystal waters, meanwhile on the other side of the complex, the ligands form hydrogen bonds only with the nitrate ions. In compound 2, [Fe(N,N-dimethylurea)4(H2O)2]3+ cations form layers that are separated by interconnected NO3− ions forming a hydrogen bonding system and connecting the complex cations A-s and B-s. The three crystallographically different nitrate ions each form four hydrogen bonds in a way that they have one bidentate O atom and two monodentate O atoms; however, the anions differ in their hydrogen bonding. The spectroscopic characteristics of compound 2 were determined by IR measurements on the deuterated compound 2 as well.
1. Introduction
The quasi-intramolecular solid phase redox reactions of complexes having oxidizing anions and reducing ligands are extensively studied in inorganic chemistry [1,2,3,4,5,6,7,8,9,10,11,12,13,14,15,16,17,18,19]. The heat-induced solid phase processes of complexes [MLn](XO4)m (M = Fe, Cu, Zn, Co; L = urea, NH3 or pyridine, and n = 2–6; X = Mn, Mo, Cl, S, and m = 0.5–3 [1,2,3,4,5,6,7,8,9,10,11,12,13,14,15] ensure a convenient way to prepare simple or mixed nanosized transition metal oxides that proved to be excellent catalysts in various industrial processes such as the Fischer–Tropsch synthesis [16,17,18,19]. The key point of triggering these solid phase redox reactions is the existence of hydrogen bonds between the potential redox active components of the complexes [1,2,3,4,6,7,8,9]. In order to explore new precursor complexes with advantageous thermal decomposition features and with useful decomposition product properties, some complexes with methyl substituted urea ligands, including iron(III) nitrate complexes with dimethylated urea isomers (N,N (1,1-dimethylurea)) and (N,N’ (1,3-dimethylurea)) have been prepared. Due to the key parameter, the existence of hydrogen bonds between N,N- and N,N’-dimethylurea ligands and nitrate ions have enormous importance from the point of view of further investigations. In this paper, we present our results about the preparation and crystal structure of three new complexes, [hexakis(N,N’-dimethylurea-O)iron(III)] nitrate (compound 1), trans-[diaquatetrakis(N,N-dimethylurea-O)iron(III)] nitrate (compound 2), and [hexakis(N,N-dimethylurea-O)iron(III)] nitrate trihydrate (compound 3). In order to characterize the influence of the hydrogen bonds in compounds 1–3, detailed spectroscopic (IR, Raman, and UV–Vis) studies were also performed.
Numerous crystallographically characterized unsubstituted urea complexes of iron(III) salts are known (ESI Table S1), whereas only two complexes of iron(III) perchlorate with methyl or ethyl substituted urea ligands have been structurally characterized until now [1,2,20,21,22,23,24,25]. Neither diaquo-complexes of asymmetric dimethylurea with metals nor its hexacoordinated complexes with trivalent metals has been structurally characterized. There are four structurally characterized isomorphic monoclinic complexes with divalent Mn, Co, Ni, and Zn cations known (ESI Table S1). There are only five examples of crystallographically characterized symmetric dimethylurea complexes. Among them, one is an iron(III) complex with perchlorate anion (monoclinic), the other four complexes that are formed with divalent metals are triclinic.
The urea and its derivatives can coordinate to the central metal atoms via the oxygen of the carbonyl group or via one of the nitrogens of the amino groups (in a few cases, it coordinates as a bidentate ligand) [26,27]. The complexes of trivalent cations (MnIII, FeIII) [1,2,28,29,30,31,32,33] are mostly O-coordinated compounds [1,2,21,22,23,24,25,28,29,30,31,32]. The methyl substitution of the urea ligand is expected to be of great influence on the hydrogen bond systems with the respective anion of the iron(III) salts due to the electron density shift inside the urea molecule and due to steric factors as well. Thus, because of structural changes, the ability of the urea–iron(III) complexes to show heat-induced quasi-intermolecular redox reactions will surely be altered. Some octahedral iron(III) complexes containing urea with various anions (Cl−, Br−, NO3−, ClO4−, MnO4−, and S2O82−) have been studied with several spectroscopic methods [1,2,22,23,24,25,26,27,28,29,30,31,32,33], and the most extensively studied iron(III)–urea complex is clearly the [Fe(urea)6](NO3)3 [25,26]. Thus, to clarify the effect of methyl substitution in the ligand on the properties of N-H···O interactions, we selected the iron(III) complexes of dimethyl substituted urea isomers (N,N- and N,N’-) with nitrate counter ions.
2. Materials and Methods
Chemical grade iron(III) nitrate nonahydrate, N,N-dimethylurea, N,N’-dimethylurea, and urea and the analytical reagents or solvents were supplied by Deuton-X Ltd., Érd, Hungary. The syntheses of compounds 1–3 were based on the previously described methods [1,2,22,23,24,25,31,32,33].
2.1. [Hexakis(N,N’-dimethyurea-O)iron(III)] Nitrate (Compound 1)
Compound 1 was prepared in the following way: iron(III) nitrate nonahydrate (8.08 g, 0.02 mol) and N,N’-dimethylurea (10,6 g, 0.12 mol) were dissolved in 12 mL of distilled water. The light orange solution was slowly evaporated at 25 °C. After a week, orange colored block-like crystals were formed that were filtered off and then washed first in water, then in abs. ethanol and finally in diethyl ether. The yield was 88%.
2.2. [Diaquatetrakis(N,N-dimethyurea-O)iron(III)] Nitrate (Compound 2) and [Hexakis(N,N-dimethyurea-O)iron(III)] Nitrate Trihidrate (Compound 3)
Compounds 2 and 3 were prepared in the following way: iron(III) nitrate nonahydrate (8.08 g, 0.02 mol) and N,N-dimethylurea (10,6 g, 0.12 mol) were dissolved in 13.5 mL of distilled water and the deep orange solution was left to evaporate at room temperature. Two kinds of orange crystals were formed, the prism-like ones were identified as [diaquatetrakis(N,N-dimethylurea-O)iron(III)] nitrate (compound 2), and the needle-like crystals were proven to be the expected [hexakis(N,N-dimethylurea-O)iron(III)] nitrate trihydrate (compound 3). The further slow evaporation of the mother liquor resulted in only compound 2 after four days. The yield was 93%. Compound 2 was the main product, whereas compound 3 was a byproduct formed in a small amount.
The same reaction conditions were used for the Fe(NO3)3·9H2O to N,N-dimethylurea molar ratios 1:4 and 1:8. At ratio 1:4, the final product was only compound 2; however, when the Fe to N,N-dimethylurea ratio in the reaction mixture was 1:8, first the excess (2 mol) N,N-dimethylurea crystallized and after that only compound 2 formed. Based on these observations, the formation of compound 2 is favorable against compound 3.
2.3. Powder X-ray Diffractometry
Powder X-ray tests were performed with a Philips PW-1050 Bragg–Brentano parafocusing goniometer equipped with a copper cathode (40 kV, 35 mA, secondary beam graphite monochromator, proportional counter). Scans were recorded in step mode, and the diffraction patterns were evaluated with a full profile fitting technique [34,35].
2.4. Single Crystal X-ray Diffraction
The single crystal X-ray diffraction measurements on compound 1 and 3 were done at 100 and 105 K, respectively. Intensity data were collected on a Rigaku XtaLAB Synergy R, HyPix diffractometer (rotating anode X-ray tube, PhotonJet R X-ray source, mirror monochromator; Cu-Kα radiation, λ = 1.54184 Å) [1]. The cell parameters were determined by the least-squares method, and analytical absorption correction was applied to the data. The structure was solved with the intrinsic phasing method as implemented in SHELXT [36]. Refinement was carried out using SHELXL [37] and Olex2 [38] with full matrix least squares method on F2. Hydrogen atoms were included in the structure factor calculation, but they were not refined. The isotropic displacement parameters of the hydrogen atoms were approximated from the U(eq) value of the atom they were bonded to. Olex2 [38] and Mercury [39] were used for molecular graphics and analyzing crystal packing.
The single crystal X-ray diffraction measurement on compound 2 was done at 113 K. Intensity data were collected on a Rigaku R-Axis Rapid diffractometer (graphite monochromator; Mo-Kα radiation, λ = 0.71073 Å). Hydrogen atomic positions were calculated from assumed geometries. Hydrogen atoms were included in structure factor calculations but they were not refined. The isotropic displacement parameters of the hydrogen atoms were approximated from the U(eq) value of the atom they were bonded to.
Crystal data and details of the structures’ refinement are listed in Table 1 and ESI Tables S2–S10. The CCSD numbers are 2,267,946 (compound 1), 2,267,944 (compound 2), and 2,267,945 (compound 3).

Table 1.
Crystal data and structure refinement of compounds 1, 2 and 3.
2.5. Infrared Spectroscopy
The far-IR and mid-IR spectra of compound 1, 2, and 2-D12 were recorded using the attenuated total reflection technique (ATR). The details of the instrumentation (BioRad-Digilab FTS-30-FIR and Bruker Alpha IR spectrometers) were given in [2]. The far-IR and FT-IR measurements were carried out between 400 and 40 cm−1 and 4000 and 400 cm−1, respectively.
2.6. Raman Spectroscopy
The Raman spectroscopic measurement was done between room temperature and −180 °C on a Horiba Jobin-Yvon LabRAM microspectrometer. Two external diode laser sources were applied (785 nm diode and 532 nm frequency-doubled Nd:YAG) (~80 mW and 40 mW, respectively) and an Olympus BX-40 (Evident Co., Tokyo, Japan) optical microscope was used. A Linkam THMS600 (Empire Optics Co., New York, NY, USA), temperature-controlled microscope stage was used in the low-temperature measurements. The laser beam was focused by an objective of 20×. Due to the heat-sensitivity of compound 1, a D0.3 intensity filter, in the case of compound 2, a D0.6 (−180 °C) and a D1 (25 °C) were used for excitation with Nd:YAG laser to decrease the laser power to 50%, 25%, and 10%, respectively. For light dispersion, the confocal hole of 1000 µm and a monochromator with 950 (785 nm) and 1800 (532 nm) groove mm−1 grating were used. The resolution was 4 cm−1, and the exposure times were 20 s, exceptionally 120 s at the highest power filtering.
2.7. UV–Vis Spectroscopy
The UV–Vis spectra were recorded in diffuse reflectance mode, the details of the instrumentation were given in [40] (Jasco V-670 UV–Vis instrument, an NV-470 integrating sphere, BaSO4 as standard).
3. Results and Discussion
The prism and needle-like orange crystals of compounds 2 and 3, respectively, were prepared from aq. iron(III) nitrate nonahydrate and six equivalents of N,N-dimethylurea solutions with slow evaporation at room temperature. Upon further slow evaporation of the mother liquor, only compound 2 was obtained. For the same reaction conditions at Fe(NO3)3·9H2O to N,N-dimethylurea molar ratio of 1:4 and 1:8, the final product was only compound 2 and a mixture of free N,N-dimethylurea ligand and compound 2, respectively.
3.1. Single Crystal Structure of Compounds 1–3
Single-crystal X-ray diffraction measurements were performed on the orange, block-like crystals of [hexakis(N,N’-dimethylurea-O)iron(III)] nitrate (compound 1) and on the orange rod-like crystals (needles) of [hexakis(N,N-dimethylurea-O)iron(III)] nitrate trihydrate (compound 3). Measurement conditions and cell parameters are listed in Table 1. Both compound 1 and compound 3 crystallized from aqueous solution by slow evaporation of the solvent in the trigonal crystal system and R-3 space group. Orange prism-like crystals of [diaquatetrakis(N,N-dimethylurea-O)iron(III)] nitrate (compound 2) were grown from the same solution together with compound 3 and measured by single-crystal X-ray diffraction. Compound 2 crystallized in the triclinic crystal system and P-1 space group. The cell parameters for compounds 1–3 are given in Table 1. The calculated and the experimental powder X-ray diffraction patterns agree well for compounds 1 and 2 (ESI Figures S1 and S2, the differences in the intensities of peaks in the experimental and calculated PXRDs may be attributed to orientation effects) and there was no sign of structural change between −140 and 20 °C on DSC spectra (ESI Figures S3 and S4).
In compounds 1 and 3, six dimethylurea ligands coordinate to the central FeIII ion via the oxygen in octahedral geometry (Figure 1a,b). Dimethylurea ligands are arranged in a propeller-like manner, dividing the complex cations into two sides, as characteristic of hexaurea transition metal complexes. In compound 1, the dimethylurea propellers screw in the opposite direction on the two sides of the complex and in compound 3, they are arranged with the same handedness on the two sides. In compound 2, two of the N,N-dimethylurea ligands are exchanged for water in the coordination sphere of iron (Figure 1c). The accidental replacement of the urea ligands with water within the coordination sphere of the central metal ion can also be observed at MnII, CoII, NiII, and ZnII analogs [41,42,43,44].
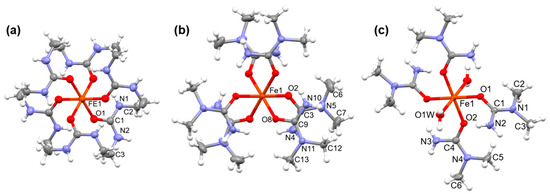
Figure 1.
Comparison of the structures of the complex cations in (a) compound 1 [Fe(N,N’-dimethylurea)6]3+, (b) compound 3 ([Fe(N,N-dimethyurea)6]3+), and (c) compound 2 ([Fe(N,N-dimethylurea)4(H2O)2]3+) (Ellipsoid representation, thermal ellipsoids are drawn at the 50% probability level.).
The different positions of the methyl groups on the urea ligands and the partial substitution of the urea ligands with water in the coordination sphere of iron result in basically different packing arrangements of the complexes (Figure 2). In compound 1, the complex cations are sandwiched between two nitrate anions and the resulting “ionic sandwiches” are arranged in columns running parallel to the crystallographic c direction. However, these sandwiching nitrates have hydrogen bond interactions only with the complex cations in the neighboring columns and not with the cations that they straddle. Their interaction with the straddling nitrate ions is rather an ionic interaction with the positively charged coordination sphere of the Fe3+ ion. A large number of intramolecular hydrogen bridges are formed between the dimethylurea ligands of the [hexakis(dimethylurea-O)iron(III)]3+ cations that consume the hydrogen bond donor and acceptor abilities of the inside of the coordination sphere of iron and no hydrogen bonds can be formed under and above the cations. Therefore, the cations interact with the nitrate ions only with their external functional groups. Between the nitrate-[Fe(N,N’-dimethylurea)6]3+-nitrate sandwiches, two strongly disordered nitrate anions fill the space each with half occupancy. In compound 3, the complex cations form columns that are separated by distinct columns of the nitrate anions. The neighboring complex cations within one column do not have any hydrogen bond interactions with each other only radially with the nitrate ions. In compound 2, layers of the complex cations are separated by nitrate layers. The [diaquatetrakis(N,N-dimethylurea-O)iron(III)]3+ cations are able to form hydrogen bonds even axially, through their water ligands.
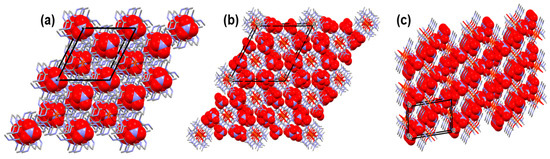
Figure 2.
Packing arrangements of (a) compound 1, (b) compound 3, and (c) compound 2. (Complex cations are drawn with stick representation and nitrate anions with space fill representation).
In compound 1, all coordinative Fe-O bond lengths are equal, 2.004(1) Å; however, the O-Fe-O angles show a slight distortion from the octahedral geometry, since they are 92.13(6)° and 87.87(6)°. The bond lengths and angles are listed in ESI Table S2. This distortion is more remarkable than that in the complex cation of the perchlorate salt (Fe(N,N’-dimethylurea)6](ClO4)3), where the O-Fe-O bond angles vary between 88.19 and 91.81° (ESI Table S3). The distortion of the complex cation of compound 1 is caused by the internal hydrogen bond system (Figure 3). The Fe-O distances in the perchlorate salt are between 1.989 and 2.023 Å, whereas the Fe···Fe interatomic distances are 10.038 and 10.278 Å in the nitrate and perchlorate salt, respectively. The other bond distances and angles were found to be very close to those found for other dimethylurea complexes (ESI Table 1).
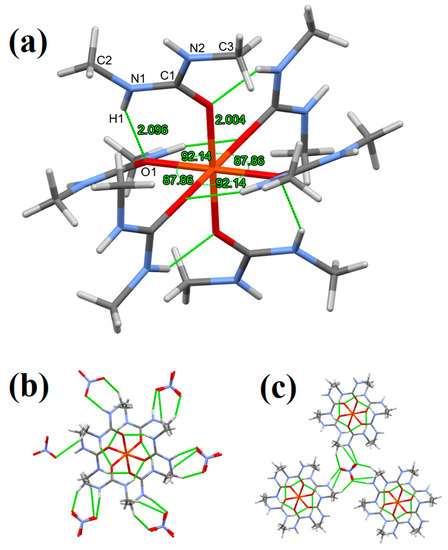
Figure 3.
(a) Coordination geometry, intramolecular hydrogen bonding, (b,c) hydrogen bonding in compound 1 (stick representation, hydrogen bonds are drawn by green dashed lines).
The H1 amide hydrogens facing the interior part of the complex cation get close to the coordinated O1 atoms of the neighboring N,N’-dimethylurea ligands and in this arrangement, an intramolecular hydrogen bond is formed between them. The result of this hydrogen bonding is that the ligands A are “pulled down” and the ligands B are “pulled up” which causes the distortion of the complex (Figure 3a).
Beside the internal hydrogen bonding, the H2 amine hydrogens of N,N’-DMU ligands form intermolecular hydrogen bonds with the NO3− anions (2.05 Å). Each NO3− ion forms three identical hydrogen bonds with three different complex cations (Figure 3b,c) and the nitrate anions are symmetric, i.e., the N-O bond lengths are uniformly 1.252(2) Å and the O-N-O angles are 120.00°. The C-O bond length increases from 1.242 to 1.283(2) upon coordination as compared to the uncoordinated N,N’-dimethylurea [1]. Furthermore, the N1-C-N2 bond lengths become asymmetric in the complex, one of them becomes longer and the other becomes shorter (from 1.329 to 1.335(3) and 1.324(3), respectively) [1]. For these changes, the coordination and the different hydrogen bond strengths are responsible.
In compound 3, the six coordinated N,N-dimethylurea ligands are placed around the Fe3+ ion in an octahedral geometry and are arranged in a propeller-like manner, dividing the complex into two sides and the rotation direction of the ligands are different at the two sides of the complex. This way, the complex has a helical chirality. This arrangement is similar to the [Fe(urea)6]3+ cation [1,2]; however, it differs from that in compound 1 (Figure 1b). The two sides of the complex cations differ not only in the rotation direction of the ligands but also in the hydrogen bond formation. On one side of the complex cation, the ligands form intermolecular hydrogen bonds only with the crystal waters, meanwhile on the other side of the complex, the ligands form hydrogen bonds only with the NO3− ions (Figure 4). These differences result in different Fe-O bond lengths on the two sides of the complex cation of compound 3, three 2.009(1) Å and three 2.017(1) Å bond lengths were measured, the shorter one belongs to the side where hydrogen bonds are formed only with the water molecules (Figure 4). Due to these effects, there is a slight distortion in the octahedral geometry of the complex cation of compound 3 (ESI Tables S6 and S7). The O-Fe-O angles prove to have distorted octahedral geometry too, as they vary between 88.70°and 91.19° (ESI Figure S5).
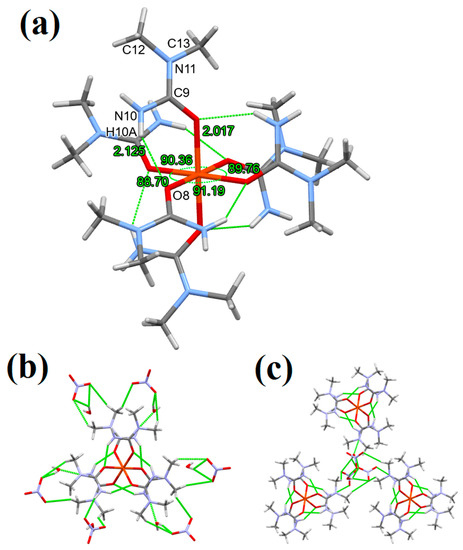
Figure 4.
(a) Coordination geometry, intramolecular hydrogen bonding, (b,c) hydrogen bonding in compound 3 (stick representation, hydrogen bonds are drawn by green dashed lines).
One of the H atoms of the -NH2 groups (the one facing inside) on each ligand forms an intramolecular hydrogen bond with the coordinated O atom of the neighboring ligand, all together six internal hydrogen bonds just like in the [M(N,N-dimethylurea)6]2+ (M = MnII, CoII, NiII and ZnII complex cations [41,42,43,44]. The other H atoms of the -NH2 groups (facing outside) form intermolecular hydrogen bonds with the nitrate anions or water molecules (Figure 4). The methyl groups on the N5 and N11 atoms of complex cation of compound 3 are facing outside of the center of the complex cation due to the steric hindrance (Figure 1c) and these groups do not form any hydrogen bonds (Figure 4). Similarly to the compound 1 structure, in compound 3, the [Fe(N,N-dimethylurea)6]3+ cations form columns along the c unit cell axis (Figure 3b). The columns are filled with interconnected NO3− anions and water molecules forming a hydrogen bonding system. Each of the O atoms of the NO3− ions form hydrogen bonds: one O atom with the complex cation, one with hydrogen of one water molecule, and one with the H atoms of two different water molecules (bidentate), resulting in structurally distorted anions with three non-equivalent N-O bond lengths: 1.243(2) Å (connected to the complex cation), 1.243(2) Å (connected to one water molecule), and 1.251(2) Å (connected to two water molecules) (ESI Figure S6). The O atom of each water molecule forms hydrogen bond with the complex cations. Both H atoms of the water molecules form H bonds as well: one with one O atom and one with two of the NO3− ions (ESI Figure S6). This hydrogen bond system is similar to the MnII, CoII, NiII, and ZnII–N,N-dimethylurea analogue complexes [41,42,43,44].
In compound 2, in contrast to compound 3, only four N,N-dimethylurea (equatorial) and two water (axial) molecules coordinate to the central Fe3+ atom forming an octahedral coordination geometry (Figure 1c). The crystallization of compound 2 seems energetically more favorable, since from the reaction solution (described in Section 2.2), a large amount of compound 2 formed (at the whole area of the solution) and a small amount of compound 3. Our assumption was confirmed by changing the condition of the synthesis: when the reaction mixture contained a 1:4 molar ratio of Fe to N,N-dimethylurea, only crystals of compound 2 formed. Two different complex cations can be found in the unit cell of compound 2 (A and B) with a slight distortion from the octahedral symmetry with different Fe-O bond lengths. The Fe-O bond lengths which belong to the coordinated water molecules are different: 2.026(2) (complex cation A) and 2.033(2) Å (complex cation B). In both complex cations, the H atoms of the coordinated water molecules differ: the H1(WB) and H2(WB) form monodentate-, while H1(WA) and H2(WA) form a bidentate hydrogen bond (Figure 5). In complex cation A, the H1(WB) hydrogen binds to an O atom of a nitrate anion, whereas in complex cation B, the H2(WB) binds to the O atom of a nitrate anion, which has a hydrogen bond with the N,N-dimethylurea ligand (the neighbor of the coordinated water molecule) (Figure 5) (the Fe-O bond length is 2.026(2) Å). In the complex cations A and B of compound 2, the N,N-dimethylurea ligands can be divided into two groups: N,N-dimethylurea ligands I have shorter Fe-O bond lengths (1.960 and 1.970 Å) N,N-dimethylurea ligands II having longer bonds (2.002 and 2.009 Å). The shorter Fe-O bond lengths (1.960 and 2.002 Å) belong to the complex cation A. The hydrogen bonding system is also responsible for the differences. The –NH2 groups of N,N-dimethylurea ligands I form one intramolecular (with the O atom of neighboring N,N-dimethylurea ligand II) and one intermolecular (with a bidentate O atom of a NO3− ion) hydrogen bond, while the –NH2 groups of the N,N-dimethylurea ligands II form two intermolecular hydrogen bonds (with two different NO3− ion) (Figure 5). In complex cation A and B, ligands I differ in the intermolecular hydrogen bond lengths (2.081 and 2.090 Å, respectively) and in the (N-)H-O(-N)-H(-O) angle of the bidentate nitrate anion (176.2 and 108.6, respectively) (Figure 5). In complex cation A and B, ligands II differ in the angles enclosed by the two nitrate anions and the –NH2 group of the ligand ((O2N-)O-N-O(-NO2)), being 96.4 and 120.6°, respectively (Figure 5).
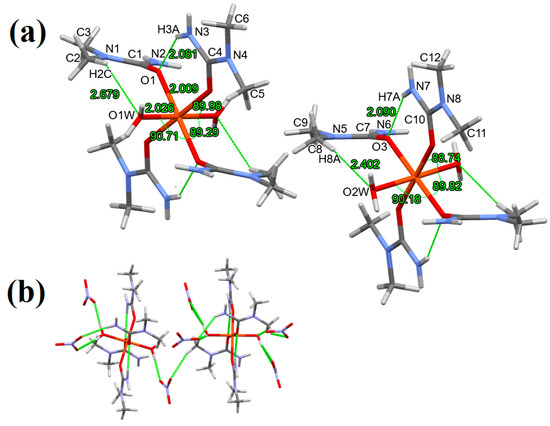
Figure 5.
(a) Coordination geometry, intramolecular hydrogen bonding, (b) hydrogen bonding in compound 1 (stick representation, hydrogen bonds are drawn by green dashed lines).
Unlike the structures of compounds 1 and 3, in compound 2 [Fe(N,N-dimethylurea)4(H2O)2]3+ cations form layers (Figure 2c) that are separated by interconnected NO3− ions forming a hydrogen bonding system and connecting the complex cations A-s and B-s. Three crystallographically different nitrate anions can be found in each cationic column, and all three kinds are slightly distorted (the N-O bond lengths and O-N-O angles are listed in ESI Table S11). The three nitrate ions form four hydrogen bonds in a way that they have one bidentate O atom and two monodentate O atoms (ESI Figure S7); however, the anions differ in their hydrogen bondings. NO3− A and B connect three different complex cations via hydrogen bonding, but the bonding angles of their bidentate bonded O atoms differ (176.2° and 108.6°, respectively). Meanwhile, NO3− C is connected to two different parts of two different complex cations: the bidentate O atom is connected to the H of a coordinated water molecule and a H of the amino group of the coordinated N,N-dimethylurea, while one monodentate O atom is coordinated to the H of the a water molecule, and another monodentate O atom is coordinated to the H of the amino group of the N,N-dimethylurea. The hydrogen bonding system in compound 2 resembles more the MnII, CoII, NiII, and ZnII N,N-dimethylurea complexes than compounds 1 and 3 since there are more crystallographically different NO3− and all of them have bidentately connected O atoms to different complex cations [41,42,43,44]. In both complex cations of compound 2, only two intramolecular hydrogen bonds can be found, which is much less than the 6 intramolecular hydrogen bonds in both compounds 1 and 3. This is due to the asymmetric methylation of urea, the two coordinated water molecule, and the propeller-like structure of the complex cations. In this way, only two amino groups face the center of the complex cations and are close enough to the neighboring O atom of the coordinated N,N-dimethylurea ligands. The other two coordinated N,N-dimethylurea ligands and the two coordinated water molecules form only intermolecular hydrogen bonds with two different nitrate anions. A similar effect was recognized in the case of MnII, CoII, NiII, and ZnII complexes, where with the decrease of the N,N-dimethylurea ligands the number of internal hydrogen bonds decrease as well (and become zero in the case of [M(N,N-dimethylurea)2(H2O)4]2+ (M = MnII, CoII, NiII, and ZnII) [41,42,43,44].
In compound 1, two Fe-Fe distances were found between the neighboring [Fe(N,N’-dimethylurea)6]3+: 10.275 Å and 12.123 Å, the shortest is similar to the analogue perchlorate complex (10.038 Å) (ESI Figure S8) [23]. The Fe-Fe distances in compound 3 are much shorter than in compounds 1 and 2, and are similar to the Me-Me distances in the CoII, NiII, and ZnII analogues, the shortest distances are 6.633 and 7.280 Å (ESI Figure S9). The shortest Fe-Fe distance in [diaquatetrakis(N,N-dimethylurea)iron(III)] nitrate is longer than that in compound 3 and shorter than that in compound 1, so it is closer to the Co II, Ni II, and Zn II N,N-dimethylurea complexes. Its value is 9.388 Å (ESI Figure S10) [41,42,43,44].
3.2. Vibrational Spectrum of Compound 1
The room temperature IR spectra of compound 1 ([hexakis(N,N’-dimethylurea)iron(III)] nitrate) has partly been evaluated by Masłowska et al. [45], but there are no available data about the far-IR and Raman studies of this compound. The results of the IR (room temperature) and Raman (room temperature and liq. N2 temperature) measurements on compound 1 and the assignments of the vibrational modes are given in ESI Figures S11 and S12 and ESI Table S12. The results of the correlation analysis for the nitrate ions are given in Figure 6.
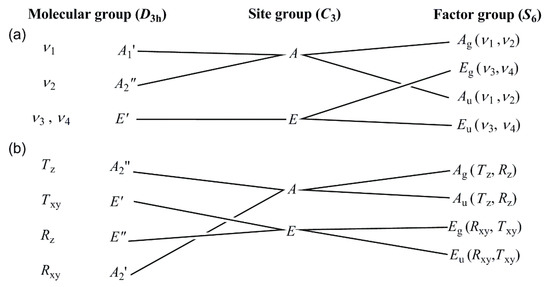
Figure 6.
(a) Internal and (b) external NO3− modes in compound 1.
The N-H stretching mode region contains four IR and five Raman bands, whereas Masłowska found only one wide IR band in this region [45]. The appearance of these bands might be attributed to the presence of the two crystallographically different cations (A and B—Figure 2a, Section 3.1), the non-equivalence of ligands in the trans- and cis-octahedral positions, and the distorted nature of the octahedral cations, or because the N,N’-dimethylurea ligand has a considerable double-bond character, the relative positions of two imides and the carbonyl groups. The (cis,trans)-configuration of the free N,N’-dimethylurea is less favorable [46] and less symmetric than the trans, trans, and (cis,cis)-configurations, but the coordination to iron(III) and the hydrogen bonds fix the ligands in this configuration causing splitting and shifting the νs(N-H) and νas(N-H) bands as compared to the νs(N-H) and νas(N-H) modes of the free ligand.
The room temperature and low-temperature Raman spectra (−80 and −180 °C) show that the lowering of the temperature resulted in the splitting of the Raman bands (ESI Figures S12 and S13). Similar reasons explain the increase in the number of bands belonging to symmetric and antisymmetric C-H modes of the methyl groups in the IR and Raman spectra, respectively (Figure 7 and ESI Tables S12 and S13a).
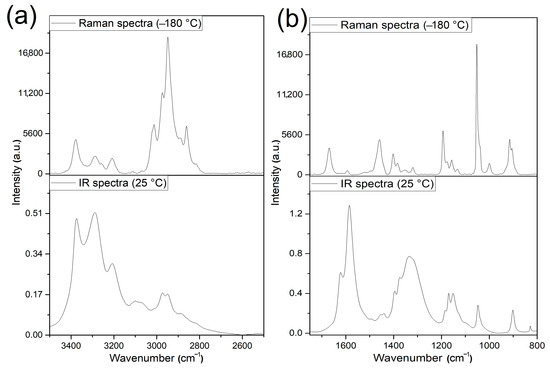
Figure 7.
The IR (room temperature) and Raman (−180 °C) spectra of compound 1 in (a) the N-H and C-H bond stretching mode and (b) in the amide bands ranges.
The band observed at 3111 cm−1 in the IR spectrum of compound 1 might belong to the strongest N-H bond facing outside of the complex cation of compound 1, bonded to a nitrate anion (the smallest length and angle difference between the cations A and B were observed for this hydrogen bonding environment (discussed in Section 3.1). Making this assumption, we can expect that these N-H bonds of ligands A and B energetically do not differ enough to result in splitting or making a shoulder/widening of the band belonging to these fragments. The band positions of νs(C-H) and νas(C-H) modes in the IR spectrum of compound 1 slightly differ from the results given by Mido [46] due to the different configurations of the free (trans, trans) and the complexed (cis,trans) ligand in compound 1. A temperature dependence could be observed in the Raman spectra similar to that found for ν(N-H) bands (Figure 7a, ESI Table S12). The amide I, II, and III bands belong to the mixed modes of ν(C=O), ν(C-N), and δ(NH) and are located at 1625 cm−1, 1596 cm−1, and 1266 cm−1 in the IR spectrum of the free ligands, respectively. The greatest contribution of ν(C=O) is expected in the amide I band and a lesser contribution of ν(C=O) is expected in the amide II band. Accordingly, due to the C=O coordination “pile-up” and “spill-over” effects, the amide I and II bands observed in the IR spectrum of compound 1 were shifted to 1621 cm−1 and 1595 cm−1, respectively. The higher shift of the amide I band than the amide II band confirms the higher contribution of ν(C=O) mode in the amide I than in the amide II band. The splitting of amide I and II bands may be attributed to the influence of the (cis,trans)-NH, or axial/equatorial ligand arrangements. The main components in the amide II band are the ν(C-N) and the δ(NH) modes (ESI Table S12), whereas the main component of the amide III band is the δ(NH), and additional components are ν(CN) and ν(C’-N). A strong band at 1336 cm−1, and two bands at 1280 and 1255 cm−1 appeared.
The band at 1336 cm−1 may be attributed to the presence of the (cis,trans)-conformer, because the solution phase IR spectrum of the free ligand contains a band at this position (due to rotation of the dissolved species) [46], which cannot be seen in the solid (frozen) sample. The Raman spectra recorded at liq. N2 temperature showed an unresolved wide band around 1669 cm−1 (amide I), whereas the amide II and III bands are weak due to low Raman intensity of CN and N-H modes (Figure 7b, ESI Figure S13c,d and ESI Table S12). The symmetric deformation mode of methyl groups and a combined band of ν(C’N) and rocking mode of methyl groups are expected to be in the band position range of the antisymmetric and symmetric stretching modes of the nitrate ion. Therefore, a correlation analysis has been done to determine the number and splitting of the expected modes of the nitrate anion in compound 1 (Figure 6). The intensity of the antisymmetric and symmetric N-O modes of the nitrate ion is higher and lower in the IR and then the Raman spectra, respectively. The isolated D3h nitrate ion has three IR active (ν2, ν3, and ν4) and three Raman active (ν1, ν3, and ν4) modes. The symmetry decrease causes all four normal modes to become IR and Raman active in the spectra of compound 1.
There are two formula units in the primitive cell, the site group is C3, and the factor group is S6. We can expect two (ν1 and ν2) singlet IR (Au) and Raman (Ag) and two (ν3 and ν4) doubly degenerate IR (Eu) and Raman (Eg) bands. The Ag and Au rotational and translational (Rz, Tz) modes are singlets, whereas the Eg and Eu rotational and translational modes (Rxy, Txy) are doubly degenerate. Considering the singlet nature of ν1(N-O) band, among the four experimentally found bands with weak/medium intensity at 1099, 1064, 1047, and 1037 cm−1, in the IR spectrum, three belong to the ν(C’-N) and ρ(CH3) mixed bands of ligands, and only one may belong to the nitrate ion (Figure 7b). The Raman spectrum recorded at low temperature unambiguously shows a very strong narrow singlet at 1052 cm−1, which is much more intense than the other bands, thus it is assigned as ν1(NO3) in the Raman spectrum. One among the bands located at 1064 or 1047 cm−1 in the IR spectrum might belong to the ν1(NO3) mode and the other to a mixed N,N’-dimethylurea ligand band. Since no N-H-containing species contributes to the mixed ligand bands, we cannot distinguish these bands by deuteration. However, the nitrate ion ν1(NO3) mode in compound 2 was assigned at 1044 cm−1 (see below); thus, the band at 1047 cm−1 probably belongs to the nitrate ion ν1(NO3) mode in the IR spectrum of compound 1. The ν2 band of the nitrate ion was found at 829 and 762 cm−1 as a doublet in the IR spectrum of compound 1, the Raman intensity of this deformation mode is low (ESI Figure S13e,f). The antisymmetric stretching mode of nitrate ion appears as a doublet both in the IR and Raman spectra, at 1396/1374 cm−1 and 1402/1384 cm−1, respectively (ESI Figure S13c,d). The intensities of these bands are much lower in the Raman than in the IR spectrum. The well-separated bands around 1300 (IR) and 1330 cm−1 (Raman) are close to the expected range of the ν3(NO3) mode belonging to the mixed δ(NH), ν(CN), ν(C’N), and ν(C=O) modes (ESI Table S12). The ν4(N-O) mode (deformation) is located at 724/707 and 729/716 cm−1 in the IR and Raman spectra, respectively (Figure 7 and ESI Figure S13g,h). The bands belonging to Fe-O coordination of the cations types A and B were found at 389 cm−1 in the IR as a wide band with shoulders and at 420 and 383 cm−1 in the low-temperature Raman spectra (ESI Figure S12 and ESI Table S12). The lattice modes appear in the far-IR spectra at 303, 248, 157, and 129 cm−1 (ESI Figure S11a).
3.3. Vibrational Spectrum of Compound 2
Compound 2 ([diaquatetrakis(N,N-dimethylurea)iron(III)] nitrate) has not been prepared previously, therefore there are no available spectroscopic data about it. The equatorial positions are filled only with N,N-dimethylurea ligands, whereas the axial position is filled only with water ligands. One would expect the resonance structures to contribute less to the spectral characteristics (due to the lack of NH-C(=O)-NH linkage) than in the complexes with N,N’-dimethylurea [46]. The IR and Raman spectroscopic data (the latter measured at both room temperature and liq. N2 temperature) together with the IR spectrum of the perdeuterated derivative (2-D12, the ligands are Me2NCOND2 and D2O) are given in Figure 8 and Figure 9, ESI Table S13 and ESI Figures S14–S16.
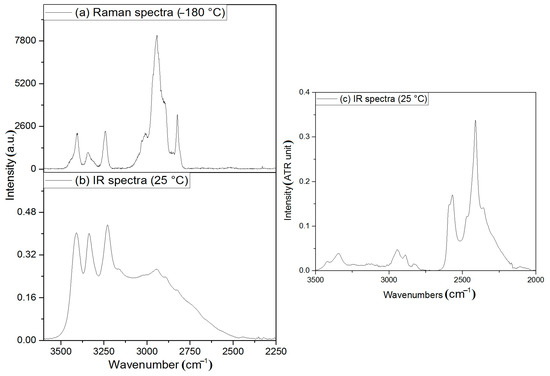
Figure 8.
(a): Raman (−180 °C), (b): IR (room temperature) spectra of compound 2, and (c): IR (room temperature) spectra of compound 2-D12 in the N-H and C-H bond stretching mode range.
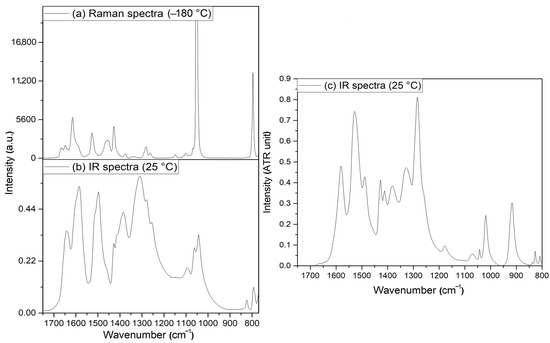
Figure 9.
(a) Raman (−180 °C) spectra and (b) IR (room temperature) of compound 2 and (c) IR (room temperature) spectra of compound 2-D12 in the amide bands range.
Since the structure consists of relatively strong hydrogen bonds by NH2 groups and H2O ligands (Figure 8), the symmetric/antisymmetric OH and NH bands appear in the IR spectrum of compound 2 at 3410 and 3336/3229/3159sh cm−1. The band at the highest wavenumber belongs to the coordinated water, whereas the other two bands and the shoulder may belong to the symmetric and antisymmetric modes of NH2 group. The deuteration experiments resulted in four bands in the IR spectrum of compound 2-D12 (Figure 8c and Figure 9c and ESI Figure S14). The ν(OH)/ν(OD) ratio is 1.33, whereas the ν(NH)/ν(ND) ratio is varied between 1.37 and 1.45 due to the difference in the strength of hydrogen bonds between the amino group hydrogens and electron donating groups. The band at 1641 cm−1 is located close to the amide I band of the free ligand (1642 cm−1). This band completely disappears on deuteration, while a somewhat broad band appears in the IR spectrum of compound 2-D12 between 1190 and 1160 cm−1. Thus, this band and the shoulder can be assigned to the δ(OH) scissoring modes of the coordinated and crystal water. The amide I band of the coordinated ligand is located at 1585 cm−1 in the IR spectrum of compound 2 and contains ν(C=O), ν(C-N), and δ(NH) contributions. The δ(NH)/δ(ND) ratio in the free ligand was found to be 1.37 [46], and accordingly, the δ(ND) mode coincides with the experimentally found wide band system between 1190 and 1160 cm−1 in the IR spectrum of compound 2-D12 (Figure 9c and ESI Figure S14 and ESI Table S13). The amide II IR band is found at 1514/1497 cm−1, and the component of 1497 cm−1 disappeared on deuteration, whereas the component at 1520 cm−1 remained. Thus, the components at 1497 and 1514 cm−1 in the IR spectrum of compound 2 belong to δ(NH2) and C-N mode contributions, respectively, and the δ(ND2) component appears at 1071 cm−1 in the IR spectrum of the deuterated compound (δ(NH)/δ(ND) = 1.40). The δr mode of NH2 group in the IR spectrum of compound 2 appeared at 1094 cm−1, and using the δr(NH)/δr(ND) value given the for the free ligand (1.27) by [46], the new intense band at 912 cm−1 in the IR spectrum of compound 2-D12 can be assigned to δr(ND2). The δr(Me) and νs(CN) combined band located at 1062 cm−1 shifts on deuteration only slightly, and splits into two bands at 1044 and 1023 cm−1, representing separated δr(Me) and νs(CN), respectively. The νs(CN) band is expected to be more sensitive to deuteration following the logic of mechanically coupled oscillators.
The νas(N-O) nitrate bands are expected to be in the range of δs(CH3) modes (~1400 cm−1) of the N,N-dimethylurea ligand [46] (ESI Table S13). The correlation analysis of the nitrate ion is given in Figure 10.
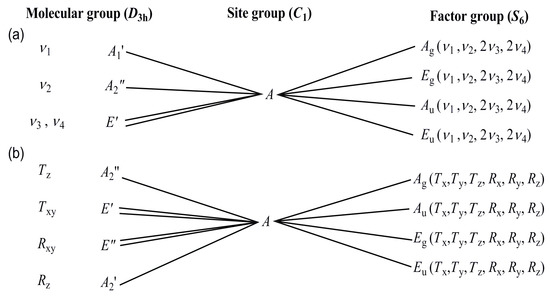
Figure 10.
(a) Internal and (b) external NO3− modes in compound 2.
The isolated D3h nitrate ion has three IR active (ν2–ν4) and three Raman active (ν1, ν3, and ν4) modes. In compound 2, (Z = 6), the primitive cell contains 2 formula units (Z/3), that is 6 nitrate anions, all being crystallographically equivalent. The site group is C1, and the factor group is S6. Accordingly, all bands become IR and Raman active (Figure 10). Six bands for both Au and Ag symmetries and another six for both Eu and of Eg symmetries are expected, in the IR (the ungerade modes) and Raman (the gerade modes).
The components of the antisymmetric stretching modes of the nitrate ion in the IR spectrum of compound 2 are located at 1384 and 1309 cm−1, whereas the deuteration causes minor ~2 cm−1 shifts of these positions, as is often the case because there are no pure group vibrations in reality (Figure 9b). In the Raman spectrum, only one very weak ν3(NO3) Raman band was detected (Figure 9a). A possible coinciding band at 1288 cm−1 in the IR appears at 1281 cm−1 in the Raman spectrum and was assigned to the ν(CN) mode, whereas the δs(CH3) appears at 1427 both in the IR and Raman spectra. The strong singlet Raman band is also typical for νs(N-O) (ν1) at 1044 cm−1, and the weak 719 and 713 cm−1 Raman bands belong to ν4(N-O). A very weak Raman band was observed as ν2(NO3) at 821 cm−1, and this mode was found also at 823 cm−1 in the IR spectra of compound 2 and 2-D12 as well (ESI Figures S14 and S16). In the IR spectrum, the band at 1044 cm−1 hardly changes on deuteration, whereas the two neighboring bands are shifted by ~20 cm−1, which indicates that these bands belong to ligand groups, which are located close to N-H(N-D) groups, whereas the band to 1044 cm−1 belongs to ν1(N-O) band. This band shifts only to a minor extent (1 cm−1) on deuteration which is comparable to the shift of other (ν3) nitrate bands (Figure 9b,c). There are three translational (Tx, Ty, Tz) and three rotational (Rx, Ry, Rz) modes for Au, Ag, Eu, and Eg, each, for the nitrate ions in compound 2, in the IR and Raman spectra (Figure 9a,b).
The correlation analysis of crystal water molecules is given in ESI Figure S17. For compound 2, the primitive cell contains 6 water molecules, all being crystallographically equivalent. Three normal modes (ν1, ν2, and ν3) are active in Ag and Eg, as well as in Au and Eu, as Raman and IR active modes, respectively. Similarly, there are 6 external modes (Tx, Ty, Tz, ρ, ω, τ) both in Ag and Eg (Raman), and in Au and Eu (IR) (ESI Figure S17).
The coordinated water in aqua complexes has several normal modes, ρr, ρw, ρt, and the ν(Fe-O) mode, the latter being one of the hindered translations. The ν(Fe-OH2) modes are found at 436 cm−1 (the Fe-O modes from ligand carbonyl oxygen coordination are located in the far-IR region (Figure 11), at 378/361 cm−1) [47,48]. These Fe-O modes were found in the Raman spectra at 440–430, 417, and 374 cm−1 (Figure 11). The deuteration of compound 2 induces a shift in the ν(Fe-O) band from 436 to 427 cm−1, thus this band belongs to a hindered translation Fe-OH2 and the low wavenumber Fe-O band belongs to the ν(Fe-O) (N,N-dimethylurea-ligand) mode. The bands belonging to the normal modes (ρr, ρw, ρt) of the coordinated and non-coordinated water can not be analyzed in detail, due to the complexity of this system). In what follows, we give a brief and tentative assignment. The non-coordinated H2O correlation analysis is given in ESI Figure S17. The ρw mode of water is assigned at 547 cm−1 in the IR spectrum of compound 2. The lattice modes of compound 2 were found at 320, 299, 250, 205, and 147 cm−1 in the IR, whereas at 311, 301, 280, 238, 208, 194, and 107 cm−1 in the Raman spectrum.
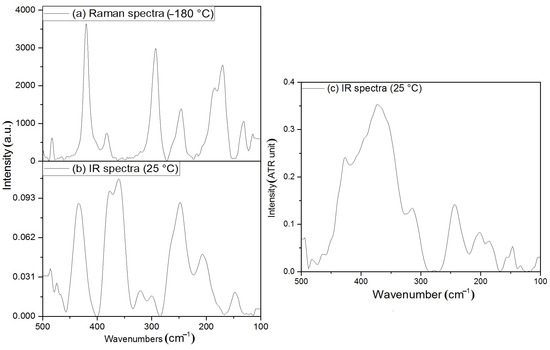
Figure 11.
(a) Raman (−180 °C), (b) IR (room temperature) spectra of compound 2, and (c) IR (room temperature) spectra of compound 2-D12 in the amide bands range.
3.4. UV Spectra of Compounds 1 and 2
Compounds 1 and 2 have only very weak absorption bands in their UV–Vis spectrum recorded in the solid phase (ESI Figure S18). Compounds 1 and 2 contain high-spin FeIII centers with 6S ground terms, which do not split by crystal field. The electronic transitions in these complexes are both spin and Laporte forbidden, thus all the expected d-d bands are weak. From among the expected 4T1g(G)←6S, 4T2g(G)←6S, and 4Ag, 4Eg(G)←6S transitions, the first one appears in the UV–Vis spectrum of compound 1 at 757 nm, but this band was not observed in the spectrum of compound 2. The second type of transitions gives bands at 540 and 490 nm, and the third ones appear at 420 and 415 nm. The 4Ag,4Eg(G)←6S transitions are degenerate in octahedral symmetry. The n-π* and/or π-π* bands of the nitrate and substituted urea ligands are located as a wide peak system in the UV spectra of compounds 1 and 2 centered around ~350 nm [2,49].
Numerous efforts have been made to measure the IR, Raman, and UV spectra of compound 3 as well; however, the crystals selected manually were deliquescent, and the compound decomposed during the sample preparations.
4. Conclusions
Three octahedral iron(III) nitrate complexes with isomeric dimethylated urea ligands, namely [hexakis(N,N’-dimethylurea-O)iron(III)] nitrate (compound 1), trans-[diaquatetrakis(N,N-dimethylurea-O)iron(III)] nitrate (compound 2), and [hexakis(N,N-dimethylurea-O)iron(III)] nitrate trihydrate (compound 3) were prepared. The single crystal structure and crystallographic parameters of complexes 1–3 were determined. The cation configurations including their intra and intermolecular hydrogen bonding systems were clarified.
In compound 1, the complex cations are sandwiched between two nitrate anions and are arranged in columns running parallel to the crystallographic c direction. These nitrate ions have hydrogen bond interactions only with the complex cations in the neighboring columns and not with the cations that they straddle. Their interaction with the straddling nitrate ions is rather ionic. Between the nitrate-[Fe(N,N’-dimethylurea)6]3+-nitrate sandwiches, two strongly disordered nitrate anions fill the space each with half occupancy.
In compound 2, layers of the complex cations are separated by nitrate layers. The [diaquatetrakis(N,N-dimethylurea-O)iron(III)]3+ cations are able to form hydrogen bonds even axially, through their water ligands. The interconnecting NO3− ions between the layers connect two types of complex cations A and B via hydrogen bonds. The three crystallographically different nitrate ions form four hydrogen bonds to one bidentate O atom and two monodentate O atoms. The spectroscopic characteristics of compound 2 were determined by low- and room temperature Raman, furthermore IR and far-IR measurements both on the non-deuterated and deuterated compound 2.
In compound 3, the complex cations form columns that are separated by distinct columns of the nitrate anions. The neighboring complex cations within one column do not have any hydrogen bond interactions with each other, they are only radially connected with the nitrate ions.
In compound 1, the dimethylurea propellers screw in the opposite direction on the two sides of the complex, whereas in compound 3, they are arranged with the same handedness on the two sides. The complexes have a helical chirality. The two sides of the complex cations differ in the hydrogen bond formation as well. On one side of the complex cation, the ligands form intermolecular hydrogen bonds only with the crystal waters; meanwhile, on the other side of the complex, the ligands form hydrogen bonds only with the nitrate ions.
Supplementary Materials
The following supporting information can be downloaded at: https://www.mdpi.com/article/10.3390/cryst13071019/s1, Figure S1: The calculated and the experimental powder X-ray diffraction of compound 1; Figure S2: The calculated and the experimental powder X-ray diffraction of compound 2; Figure S3: The low-temperature DSC of compound 1; Figure S4: The low-temperature DSC of compound 2; Figure S5: Coordination geometry of compound 3; Figure S6: Intra- and intermolecular hydrogen bonding system in compound 3; Figure S7: Intra- and intermolecular hydrogen bonding system in compound 2; Figure S8: The Fe-Fe distances in compound 1; Figure S9: The Fe-Fe distances in compound 3; Figure S10: The Fe-Fe distances in compound 2; Figure S11. (a) Far-range and (b) analytical rang IR spectra of compound 1 at room temperature; Figure S12. Raman spectra of compound 1 at different temperatures; Figure S13: Raman and IR spectra of compound 1 in different wavenumber regions; Figure S14: (a) Close range and (b) Far-range IR spectra of compound 2; (c) analytical and (d) Far-IR spectra of compound 2-D12; Figure S15: Raman spectra of compound 2 at different temperatures; Figure S16: Raman and IR spectra of compound 2 and 2-D12 in 1100 and 700 cm−1 wavenumber region; Figure S17. (a) Internal and (b) external H2O modes in compound 2; Figure S18: UV–Vis spectra of compounds 1 and 2; Table S1: Crystal data of urea/methylated urea compounds found in Cambridge Structural Database; Table S2: Bond lengths (Å) and angles (°) of compound 1; Table S3: Torsion angles for compound 1 (°); Table S4: Bond lengths (Å) and angles (°) of compound 2; Table S5: Torsion angles (°) of compound 2; Table S6: Bond lengths (Å) and angles (°) of compound 3; Table S7: Torsion angles (°) of compound 3; Table S8: Analysis of potential hydrogen bonds and schemes with d(D...A) < R(D) + R(A) + 0.50, d(H...A) < R(H) + R(A) − 0.12 Ang., D-H...A > 100.0 Deg in compound 1; Table S9: Analysis of potential hydrogen bonds and schemes with d(D...A) < R(D) + R(A) + 0.50, d(H...A) < R(H) + R(A) − 0.12 [Å]., D-H...A > 100.0 ° in compound 2; Table S10: Analysis of potential hydrogen bonds and schemes with d(D...A) < R(D) + R(A) + 0.50, d(H...A) < R(H) + R(A) − 0.12 (Å)., D-H...A > 100.0 ° in compound 3; Table S11: Torsion angles (°) of nitrate ions in compound 2; Table S12: Assignment of vibrational modes of compound 1; Table S13: Assignment of vibrational modes of compound 2.
Author Contributions
Conceptualization, L.K. and K.A.B.; formal analysis, V.M.P.; investigation, K.A.B., Z.H., L.B., Z.D. and A.F.; writing—original draft preparation, K.A.B. and L.K.; writing—review and editing, Z.H.; visualization, K.A.B. and L.B.; supervision, L.K. and Z.H. All authors have read and agreed to the published version of the manuscript.
Funding
The research was supported by the European Union and the State of Hungary, co-financed by the European Regional Development Fund (VEKOP-2.3.2-16-2017-00013) (L.K.) and the ÚNKP-21-3 and 22-3 New National Excellence Program of the Ministry for Innovation and Technology from the source of the National Research, Development, and Innovation Fund (K.A.B.). The crystallographic study was supported by the European Union and the State of Hungary and co-financed by the European Regional Development Fund (VEKOP-2.3.3-15-2017-00018).
Data Availability Statement
Not applicable.
Acknowledgments
We express our many thanks to Ildikó Filarszky for her help in the preparative work.
Conflicts of Interest
The authors declare no conflict of interest. The funders had no role in the design of the study; in the collection, analyses, or interpretation of data; in the writing of the manuscript; or in the decision to publish the results.
References
- Béres, K.A.; Homonnay, Z.; Kvitek, L.; Dürvanger, Z.; Kubikova, M.; Harmat, V.; Szilágyi, F.; Czégény, Z.; Németh, P.; Bereczki, L.; et al. Thermally Induced Solid-Phase Quasi-Intramolecular Redox Reactions of [Hexakis(urea-O)iron(III)] Permanganate: An Easy Reaction Route to Prepare Potential (Fe,Mn)Ox Catalysts for CO2 Hydrogenation. Inorg. Chem. 2022, 61, 14403. [Google Scholar] [CrossRef] [PubMed]
- Béres, K.A.; Homonnay, Z.; Barta Holló, B.; Gracheva, M.; Petruševski, V.M.; Farkas, A.; Dürvanger, Z.s.; Kótai, L. Synthesis, structure, and Mössbauer spectroscopic studies on the heat-induced solid-phase redox reactions of hexakis(urea-O)iron(III) peroxodisulfate. J. Mater. Res. 2023, 38, 1102. [Google Scholar] [CrossRef]
- Bereczki, L.; Petruševski, V.M.; Franguelli, F.P.; Béres, K.A.; Farkas, A.; Holló, B.B.; Czégény, Z.; Szilágyi, I.M.; Kótai, L. [Hexaamminecobalt(III)] Dichloride Permanganate—Structural Features and Heat-Induced Transformations into (CoII,MnII)(CoIII,MnIII)2O4 Spinels. Inorganics 2022, 10, 252. [Google Scholar] [CrossRef]
- Franguelli, F.P.; Kováts, É.; Czégény, Z.; Bereczki, L.; Petruševski, V.M.; Barta Holló, B.; Béres, K.A.; Farkas, A.; Szilágyi, I.M.; Kótai, L. Multi-Centered Solid-Phase Quasi-Intramolecular Redox Reactions of [(Chlorido)Pentaamminecobalt(III)] Permanganate—An Easy Route to Prepare Phase Pure CoMn2O4 Spinel. Inorganics 2022, 10, 18. [Google Scholar] [CrossRef]
- Müller, T.G.; Mogk, J.; Conrad, M.; Kraus, F. Octaammine EuII and YbII Azides and Their Thermal Decompositions to the Nitrides. Eur. J. Inorg. Chem. 2016, 26, 4162–4169. [Google Scholar] [CrossRef]
- Hetmanczyk, L.; Hetmanczyk, J. Comparison of vibrational dynamics, thermal behaviour, and phase transition in [Ni(NH3)4](ReO4)2 and [Ni(NH3)6](ReO4)2. J. Therm. Anal. Calorim. 2015, 119, 1415–1428. [Google Scholar] [CrossRef]
- Fogaca, L.A.; Kováts, É.; Németh, G.; Kamarás, K.; Béres, K.A.; Németh, P.; Petruševski, V.; Bereczki, L.; Holló, B.B.; Sajó, I.E.; et al. Solid-Phase Quasi-Intramolecular Redox Reaction of [Ag(NH3)2]MnO4: An Easy Way to Prepare Pure AgMnO2. Inorg. Chem. 2021, 60, 3749. [Google Scholar] [CrossRef] [PubMed]
- Fogaça, L.A.; Bereczki, L.; Petruševski, V.M.; Barta-Holló, B.; Franguelli, F.P.; Mohai, M.; Béres, K.A.; Sajó, I.E.; Szilágyi, I.M.; Kotai, L. A Quasi-Intramolecular Solid-Phase Redox Reaction of Ammonia Ligands and Perchlorate Anion in Diamminesilver(I) Perchlorate. Inorganics 2021, 9, 38. [Google Scholar] [CrossRef]
- Kovács, G.B.; May, N.v.; Bombicz, P.A.; Klébert, S.; Németh, P.; Menyhárd, A.; Novodárszki, G.; Petrusevski, V.; Franguelli, F.P.; Magyari, J.; et al. An Unknown Component of a Selective and Mild Oxidant: Structure and Oxidative Ability of a Double Salt-Type Complex Having κ 1 O-Coordinated Permanganate Anions and Three- and Four-Fold Coordinated Silver Cations. RSC Adv. 2019, 9, 28387. [Google Scholar] [CrossRef]
- Solt, H.E.; Németh, P.; Mohai, M.; Sajó, I.E.; Klébert, S.; Franguelli, F.P.; Fogaca, L.A.; Pawar, R.P.; Kótai, L. Temperature-Limited Synthesis of Copper Manganites along the Borderline of the Amorphous/Crystalline State and Their Catalytic Activity in CO Oxidation. ACS Omega 2021, 6, 1523. [Google Scholar] [CrossRef]
- Franguelli, F.P.; Barta-Holló, B.; Petruševski, V.M.; Sajó, I.E.; Klébert, S.; Farkas, A.; Bódis, E.; Szilágyi, I.M.; Pawar, R.P.; Kótai, L. Thermal Decomposition and Spectral Characterization of Di[Carbonatotetraamminecobalt(III)] Sulfate Trihydrate and the Nature of Its Thermal Decomposition Products. J. Therm. Anal. Calorim. 2021, 145, 2907. [Google Scholar] [CrossRef]
- Trif, L.; Franguelli, F.P.; Lendvay, G.; Majzik, E.; Béres, K.; Bereczki, L.; Szilágyi, I.M.; Pawar, R.P.; Kótai, L. Thermal Analysis of Solvatomorphic Decakis (Dimethylammonium) Dihydrogendodecatungstate Hydrates. J. Therm. Anal. Calorim. 2021, 144, 81. [Google Scholar] [CrossRef]
- Petrushevski, V.M.; Béres, K.A.; Bombicz, P.; Farkas, A.; Kótai, L.; Bereczki, L. Structural and Raman Spectroscopic Characterization of Tetrapyridinesilver(I) Perrhenate, [Agpy4]ReO4. Maced. J. Chem. Chem. Eng. 2022, 41, 37. [Google Scholar] [CrossRef]
- May, N.V.; Bayat, N.; Béres, K.A.; Bombicz, P.; Petruševski, V.M.; Lendvay, G.; Farkas, A.; Kótai, L. Structure and Vibrational Spectra of Pyridine Solvated Solid Bis(Pyridine)Silver(I) Perchlorate, [Agpy2ClO4]·0.5py. Inorganics 2022, 10, 123. [Google Scholar] [CrossRef]
- Mehrotra, R.N. Review on the chemistry of [M(NH3)n](XO4)m (M=transition metal, X=Mn, Tc or Re, n=1–6, m=1–3) ammine complexes. Inorganics, 2023; 2023050956, accepted for publication. [Google Scholar]
- Hu, B.; Frueh, S.; Garces, H.F.; Zhang, L.; Aindow, M.; Brooks, C.; Kreidler, E.; Suib, S.L. Selective Hydrogenation of CO2 and CO to Useful Light Olefins over Octahedral Molecular Sieve Manganese Oxide Supported Iron Catalysts. Appl. Catal. B 2013, 132, 54. [Google Scholar] [CrossRef]
- Jiang, J.; Wen, C.; Tian, Z.; Wang, Y.; Zhai, Y.; Chen, L.; Li, Y.; Liu, Q.; Wang, C.; Ma, L. Manganese-Promoted Fe 3O4 Microsphere for Efficient Conversion of CO2 to Light Olefins. Ind. Eng. Chem. Res. 2020, 59, 2155. [Google Scholar] [CrossRef]
- Liu, B.; Geng, S.; Zheng, J.; Jia, X.; Jiang, F.; Liu, X. Unravelling the New Roles of Na and Mn Promoter in CO2 Hydrogenation over Fe3O4 -Based Catalysts for Enhanced Selectivity to Light α-Olefins. ChemCatChem 2018, 10, 4718. [Google Scholar] [CrossRef]
- Liu, Y.; Chen, J.-F.; Bao, J.; Zhang, Y. Manganese-Modified Fe3O4 Microsphere Catalyst with Effective Active Phase of Forming Light Olefins from Syngas. ACS Catal. 2015, 5, 3905. [Google Scholar] [CrossRef]
- Okaya, Y.; Pepinsky, R.; Takeuchi, Y.; Kuroya, H.; Shimida, A.; Gallitelli, P.; Stemple, N.; Beevers, A. X-ray analyses of some complex-ion structures. Acta Crystallogr. 1957, 10, 798. [Google Scholar]
- Kuz’mina, N.E.; Palkina, K.K.; Savinkina, E.V.; Kozlova, I.A. Products of Reactions of Manganese(II) and Iron(II) Iodides with Urea: Comparison of Structures and Properties. Zh. Neorg. Khim. 2000, 45, 332–337. [Google Scholar]
- Galeazzi, G.; Russo, U.; Valle, G.; Calogero, S. Mössbauer study of some iron(III) complexes with urea type ligands and the crystal structure of hexakisdimethylureairon(III) perchlorate. Transit. Met. Chem. 1981, 6, 325. [Google Scholar] [CrossRef]
- Russo, U.; Calogero, S.; Pra, A.D. Characterization of some high-spin iron(III) complexes with urea derivaties. Crystal structure of diaquatetrakis(perhydropyrimidin-2-one)iron trichloride dihydrate and of perhydropyrimidin-2-one. J. Chem. Soc. Dalton Trans. 1980, 4, 646. [Google Scholar]
- Carp, O.; Patron, L.; Diamandescu, L.; Reller, A. Thermal decomposition study of the coordination compound [Fe(urea)6](NO3)3. Thermochim. Acta 2002, 390, 169. [Google Scholar] [CrossRef]
- Zhao, S.; Sin, A. Synthesis of iron(III)-urea complex in organic solvent and its thermal decomposition. Huaxue Shiji 2010, 32, 108. [Google Scholar]
- Theophanides, T.; Harvey, P.D. Structural and spectroscopic properties of metal-urea complexes. Coord. Chem. Rev. 1987, 76, 237. [Google Scholar] [CrossRef]
- Drakopoulou, L.; Papatriantafyllopoulou, C.; Terzis, A.; Perlepes, S.P.; Manessi-Zoupa, E.; Papaefstathiou, G.S. Synthesis, X-Ray Structure, and Characterization of a Complex Containing the Hexakis(urea)cobalt(II) Cation and Lattice Urea Molecule. Bioinorg. Chem. Appl. 2007, 2007, 51567. [Google Scholar] [CrossRef]
- Bala, R.; Sachdeva, D.; Kumar, M.; Parakash, V. Advances in coordination chemistry of hexaurea complexes of chromium(III). J. Coord. Chem. 2020, 73, 2801. [Google Scholar] [CrossRef]
- Aghabozorg, H.; Palenik, G.J.; Stoufer, R.C.; Summers, J. Dynamic Jahn-Teller effect in a manganese(III) complex. Synthesis and structure of hexakis(urea)manganese(III) perchlorate. Inorg. Chem. 1982, 21, 3903. [Google Scholar] [CrossRef]
- Figgis, B.N.; Wadley, L.G.B.; Graham, J. Crystal structure of hexaurea salts of trivalent metals. I. Ti(urea)6(ClO4)3 at room temperature. Acta Cryst. 1972, 28, 187. [Google Scholar] [CrossRef]
- Russo, U.; Calogero, S.; Burriesci, N.; Petrera, M. Mössbauer characterization of some new high-spin iron complexes with urea and thiourea derivatives. J. Inorg. Nucl. Chem. 1979, 41, 25. [Google Scholar] [CrossRef]
- Yamauchi, S.; Sakai, Y.; Tominaga, T. Paramagnetic relaxation effects on Mössbauer spectra of hexakis/alkylurea/iron/III/complexes. J. Radioanal. Nucl. Chem. 1987, 119, 283. [Google Scholar] [CrossRef]
- Yamauchi, S.; Sakai, Y.; Nishioji, H.; Tominaga, T. Mössbauer spectroscopic study of the magnetic relaxation in tris(β-diketonato)iron(III) complexes. Int. J. Appl. Radiat. Isot. 1983, 34, 977. [Google Scholar] [CrossRef]
- Martiz, A.; Károly, Z.; Domján, A.; Mohai, M.; Bereczki, L.; Trif, L.; Farkas, A.; László, K.; Menyhárd, A.; Kótai, L. Nano-ZrO2@C, Nano-(ZrC, ZrO2)@C and Nano-ZrC@C Composites Prepared by Plasma-Assisted Carbonization of Zr-Loaded Iminodiacetate-Functionalized Styrene-Divinylbenzene Copolymers. Inorganics 2022, 10, 77. [Google Scholar] [CrossRef]
- Martiz, A.; Károly, Z.; Trif, L.; Mohai, M.; Bereczki, L.; Németh, P.; Molnár, Z.; Menyhárd, A.; Pawar, R.P.; Tekale, S.; et al. Plasma-assisted preparation of nano-(ZrC, ZrO2)@ carbon composites from Zr-loaded sulfonated styrene–divinylbenzene copolymers. J. Therm. Anal. Calorim. 2022, 147, 9353–9365. [Google Scholar] [CrossRef]
- Sheldrick, G.M. SHELXT– Integrated space-group and crystal-structure determination. Acta Crystallogr. A 2015, 71, 3. [Google Scholar] [CrossRef]
- Sheldrick, G.M. Crystal structure refinement with SHELXL. Acta Crystallogr. C Struct. Chem. 2015, 71, 3. [Google Scholar] [CrossRef]
- Dolomanov, O.V.; Bourhis, L.J.; Gildea, R.J.; Howard, J.A.K.; Puschmann, H. OLEX2: A complete structure solution, refinement and analysis program. J. Appl. Crystallogr. 2009, 42, 339. [Google Scholar] [CrossRef]
- Macrae, C.F.; Sovago, I.; Cottrell, S.J.; Galek, P.T.A.; McCabe, P.; Pidcock, E.; Platings, M.; Shields, G.P.; Stevens, J.S.; Towler, M.; et al. Mercury 4.0: From visualization to analysis, design and prediction. J. Appl. Crystallogr. 2020, 53, 226. [Google Scholar] [CrossRef]
- Kocsis, T.; Magyari, J.; Sajó, I.E.; Pasinszki, T.; Homonnay, Z.; Szilágyi, I.M.; Farkas, A.; May, Z.; Effenberger, H.; Szakáll, S.; et al. Evidence of quasi-intramolecular redox reactions during thermal decomposition of ammonium hydroxodisulfitoferriate(III), (NH4)2[Fe(OH)(SO3)2]·H2O. J. Therm. Anal. Calorim. 2018, 132, 493. [Google Scholar] [CrossRef]
- Smeets, S.; Lutz, M. Hexakis(urea-κO)zinc(II) dinitrate at 110 and 250 K: Uniaxial negative thermal expansion. Acta Crystallogr. C Struct. Chem. 2011, 67, 50. [Google Scholar] [CrossRef] [PubMed]
- Kuz’mina, N.E.; Palkina, K.K.; Savinkina, E.V.; Kuznetsova, N.T.; Kozlova, I.A. Syntheses and Crystal Structures of Nickel(II) and Cobalt(II) Urea Diiodoiodates [Ni(CON2H4)6][I3]2·2(CON2H4) and [Co(CON2H4)6][I3]2 · 2(CON2H4). Zh. Neorg. Khim. 2000, 45, 780. [Google Scholar]
- Palkina, K.K.; Kuz’mina, N.E.; Orlova, V.; Kondokova, I. Coordination Compounds of Some Transition Metal, Magnesium, and Calcium Nitrates with Dimethylurea. Zh. Neorg. Khim. 1999, 44, 963. [Google Scholar]
- Figgis, B.N.; Skelton, B.W.; White, A.H. Crystal structures of hexa(N-methylurea)cobalt(II) sulfate and thiosulfate. Aust. J. Chem. 1980, 33, 425. [Google Scholar] [CrossRef]
- Masłowska, J.; Cedzyńska, K. The structure of iron(III) complexes with carbamide derivatives. J. Mol. Struct. 1973, 19, 521. [Google Scholar] [CrossRef]
- Mido, Y.; Murata, H. Infrared Absorption Spectra of Urea-formaldehyde Initial Condensation Products. II. Dimethylurea. Bull. Chem. Soc. JPN 1969, 42, 3372. [Google Scholar] [CrossRef]
- Penland, R.B.; Lane, T.J.; Quagliano, J.V. Infrared Absorption Spectra of Inorganic Coordination Complexes. VII. Structural Isomerism of Nitro- and Nitritopentamminecobalt(III) Chlorides. J. Am. Chem. Soc. 1956, 78, 887. [Google Scholar] [CrossRef]
- Cotton, S.A.; Gibson, J.F. Electron paramagnetic resonance and vibrational spectra of some iron(III) complexes with oxygen-containing ligands. J. Chem. Soc. A 1971, 1690. [Google Scholar] [CrossRef]
- Butorc, V.; Simeon, V.; Tomisic, V. Effect of temperature on the UV spectra of concentrated NaNO3 aqueous solutions. Croat. Chem. Acta 2007, 80, 533. [Google Scholar]
Disclaimer/Publisher’s Note: The statements, opinions and data contained in all publications are solely those of the individual author(s) and contributor(s) and not of MDPI and/or the editor(s). MDPI and/or the editor(s) disclaim responsibility for any injury to people or property resulting from any ideas, methods, instructions or products referred to in the content. |
© 2023 by the authors. Licensee MDPI, Basel, Switzerland. This article is an open access article distributed under the terms and conditions of the Creative Commons Attribution (CC BY) license (https://creativecommons.org/licenses/by/4.0/).