Article

Denoising of the Poisson-Noise Statistics 2D Image Patterns in the Computer X-ray Diffraction Tomography

by
Felix N. Chukhovskii
*,
Petr V. Konarev
and
Vladimir V. Volkov
A.V. Shubnikov Institute of Crystallography, Federal Scientific Research Centre “Crystallography and Photonics”, Russian Academy of Sciences, 59, Leninsky Prospect, 119333 Moscow, Russia
*
Author to whom correspondence should be addressed.
Crystals 2023, 13(4), 561; https://doi.org/10.3390/cryst13040561
Submission received: 21 February 2023 / Revised: 13 March 2023 / Accepted: 20 March 2023 / Published: 24 March 2023
(This article belongs to the Section Crystal Engineering)

Abstract

:
A central point of validity of computer X-ray diffraction micro tomography is to improve the digital contrast and spatial resolution of the 3D-recovered nano-scaled objects in crystals. In this respect, the denoising issue of the 2D image patterns data involved in the 3D high-resolution recovery processing has been treated. The Poisson-noise simulation of 2D image patterns data was performed; afterwards, it was employed for recovering nano-scaled crystal structures. By using the statistical average and geometric means methods of the acquired 2D image frames, we showed that the statistical average hypothesis works well, at least in the case of 2D Poisson-noise image data related to the Coulomb-type point defect in a crystal Si(111). The validation of results related to the de-noised 2D IPs data obtained was carried out by both the 3D recovery processing of the Coulomb-type point defect in a crystal Si(111) and using the peak signal-to-noise ratio (PSNR) criterion.

1. Introduction

Nowadays, progress in fabricating new semiconductor materials and 3D nano-scaled structures is due to a certain extent to developing X-ray diffraction techniques, such as X-ray reflectometry, X-ray reciprocal-space mapping [1,2,3] and high-resolution X-ray diffraction tomography (XRDT) [4,5].
The last is based on using inclined 2D tomograms in direct space, i.e., 2D image patterns (IPs), after which they are employed in decoding the reference 2D IPs data and the subsequent recovery of the 3D nano-scaled crystal structures (see, e.g., [6,7]).
In [8,9], the computer recovery of the 3D elastic displacement field around the Coulomb-type point defect in crystal Si(111) was carried out using the concept of decoding the 2D Gaussian noise IPs data.
In a sense, computer XRDT provides the 3D recovering of some objects by using a set of its 2D projections, well-known as the Radon transform problem. At the same time, from the viewpoint of the physical reliability (accuracy) of such a transformation, the noisiness of the 2D projections plays an important, if not the main, role [10,11,12]. The statistics of the noise (random) component of the measured X-ray flux intensity (contrast) is described with acceptable accuracy by the Poisson distribution. This is true in the range from very low intensities [13] to very high intensities, for which the dead time of the detector, which leads to a decrease of the registered signal, has to be taken into account [14]. So, in [10], the authors suggested a novel, singular-value, decomposition-based denoising method in the 4D computed tomography of the brain in stroke patients with a statistical evaluation. In [11], the improved denoising method of structural vibration data employing bilateral filtering was suggested.
In the recent work [12], the convolutional neural data networks method was applied, and it manifested itself as a rather powerful tool for denoising the XRDT 2D IPs.
In [15], the authors have undertook the endeavor of filtering the 2D noise IPs on the example of the Coulomb-type point defect in crystal Si(111). As was shown there, in the case of the Gaussian noise levels in the order of 3–10%, the governed filtering algorithm provides the effective noise level reduction of the order of its value, yielding the substantial figure of merit (FOM) in the processing of the reference 2D IPs data optimization.
It is noteworthy to mention that earlier in [16,17,18], to improve the signal-to-noise ratio, the authors pointed out the capacity of the statistical filtering of the 1D digital signals and the quantifying of the signal and noise components.
In [18], the authors demonstrated how the noise level reduction might be achieved with an acquisition system and statistical evaluation of the Gaussian noise 2D IPs data (cf. Schematics in Figure 1).
In general, all the noise-filtering approaches, except the last four, damage the true reference signal in an uncontrolled way, which in turn leads to the uncontrolled accuracy of the reference 2D IPs data in the post-processing recovery stage.
Thus, one can argue that even the interference image damage factors during the image signal recording, its acquisition and its transmission, in particular, such as the crystal sample vibrating, the intrinsic detector noises and etc., can be removed and/or, exactly speaking, minimized. However, the problem of reducing the Poisson-noise still remains to be opened.
In our study, to avoid some confusion, the term ‘denoising of the 2D IPs data’ means their digital noise filtering. As a result, presumably, it has to improve the 2D signal-to-noise ratio.
Before proceeding further, one needs to make the following remark. There is the noise-filtering problem of the reference 1D and 2D IPs data collected by the different X-ray techniques, for instance, in the 1D small-angle X-ray scattering [19], the 1D X-ray spectrometry and the 2D X-ray fluorescence computed tomography [20,21,22].
As it refers to the intrinsic noise in the X-ray detectors, certainly, blurring of the signal affects the signal-to-noise ratio, but does not change the Poisson-noise signal component. As is known from the literature [23], the average noise signal (constant dark current) of the high-speed 2D perovskite and silicon-drift detectors is significantly small (about 0.5%) in comparison with the pth pixel signal produced by the X-ray diffraction from the crystal sample. This means that in the further investigation, one treats the noise problem of the reference 2D IPs data as renormalized on the constant dark current of the detector registration system.
As it follows from the above in the computer XRDT, the main aim of study is to what extent, how and whether the cutting-edge issue of denoising the 2D Poisson-noise IPs data can be solved.
Following up to [24], one makes the Poisson-noise on the regular 2D IPs. Physically, the 2D Poisson-noise IPs are folded into a mosaic of the 2D detector pixel imaging. For this, in each imaging pixel, the X-ray quanta signal X is recorded corresponding to the Poisson distribution function:
P ( X = K ,   N ) = N K K !   e N
with integer number N as the expected value Mean[X]=E(X)≡Var(X).
The Mean Absolute Deviation E(|XN|) around the Mean[X]=N is equal to:
E ( | X N | ) = 2 N N + 1 N ! e N
Accordingly, in Stirling’s approximation, when N → ∞, the Mean Absolute Deviation (2) was evaluated as:
E ( | X N | ) = 2 N 1 / 2 2 π
It is interesting that the second moment of the Poisson distribution is equal to the Mean[X]=N.
In the present study, denoising the 2D Poisson-noise IPs data is the object of investigation in the case of a spherical inclusion incorporated within a crystal Si(111). The diffraction vector h = [ 2 2 ¯ 0 ] is an incident linear-polarized X-ray radiation with wavelength λ = 0.0709 nm, the Bragg angle θB = 10.65° and the X-ray extinction length Λ = 36.287 μm. The elastic 3D displacement field function f C t p d ( r r 0 ) around the spherical inclusion located at point r = r0 is approximated by the Coulomb-types function (cf. [9]).
f C t p d ( r r 0 ) = F 4 π h ( x x 0 ) | ( ( x x 0 ) ) 2 + ( y y 0 ) 2 + ( z z 0 ) 2 | ν + ε ,   ν = 3 2 ,   F = c o n s t ,   ε + 0
Hereafter, the crystal Si(111) thickness T is assumed to be equal to Λ. Each of the 2D imaging frames is simulated with a square dimension 2 Λ × 2 Λ and contains 61 × 61 imaging pixels. Accordingly, the linear size of each imaging pixel is about 0.6 μm.
Notice that for the 20 keV X-ray synchrotron radiation in the ESRF-Grenoble and/or DESY-Hamburg synchrotron facilities, the effective resolution of the CCD hybrid detectors employed at the X-ray diffraction tomography stations is about 1μm under the X-ray flux, being about 103 per pixel, and the exposure time is equal to about 0.1 s per frame.
Once more, a goal of our study is the denoising of the 2D Poisson-noise IPs data frames, with an aim to improve the computer recovery of the 3D function f C t p d ( r r 0 ) ; the latter was controlled by the FOM parameter (cf. [9]).

2. Results

2.1. Simulating the 2D Poisson-Noise IPs Data Frames

Let us consider the multi-frame registration of the 2D IPs data, according to the schematics set-up presented in Figure 1, when several dozens of the 2D IPs frames are acquired for the crystal sample position fixed.
Notice that in general, such a scheme has several advantages. First, this allows one to acquire the high-counting statistics of IPs data without a risk of the radiation damaging the atomic structure of the sample. Second, and most importantly, a possibility to improve the signal-to-noise ratio arises by acquiring the 2D IPs frames measured in such a way.
Keeping in mind the de-noised processing according to the Schematics in Figure 1, a number of the 2D noise-contaminated IPs frames with a noise level of 2–4% were simulated by using the Poisson random value generator [24] at the {−20°, 20°} interval of the crystal rotation angles {Φ}.
According to [24], based on the numerical inversion of the Poisson distribution formalism (1)–(3), the computer generator algorithm searched the Poisson values by using the uniform random distribution of the values of the Poisson distribution function (1).
In such a way, the integer number U = 102 of the Poisson-noise 61 × 61 imaging pixels frames (correspondingly, the Poisson-noise events U ˜ = 3721 × 10 2 ) was generated.
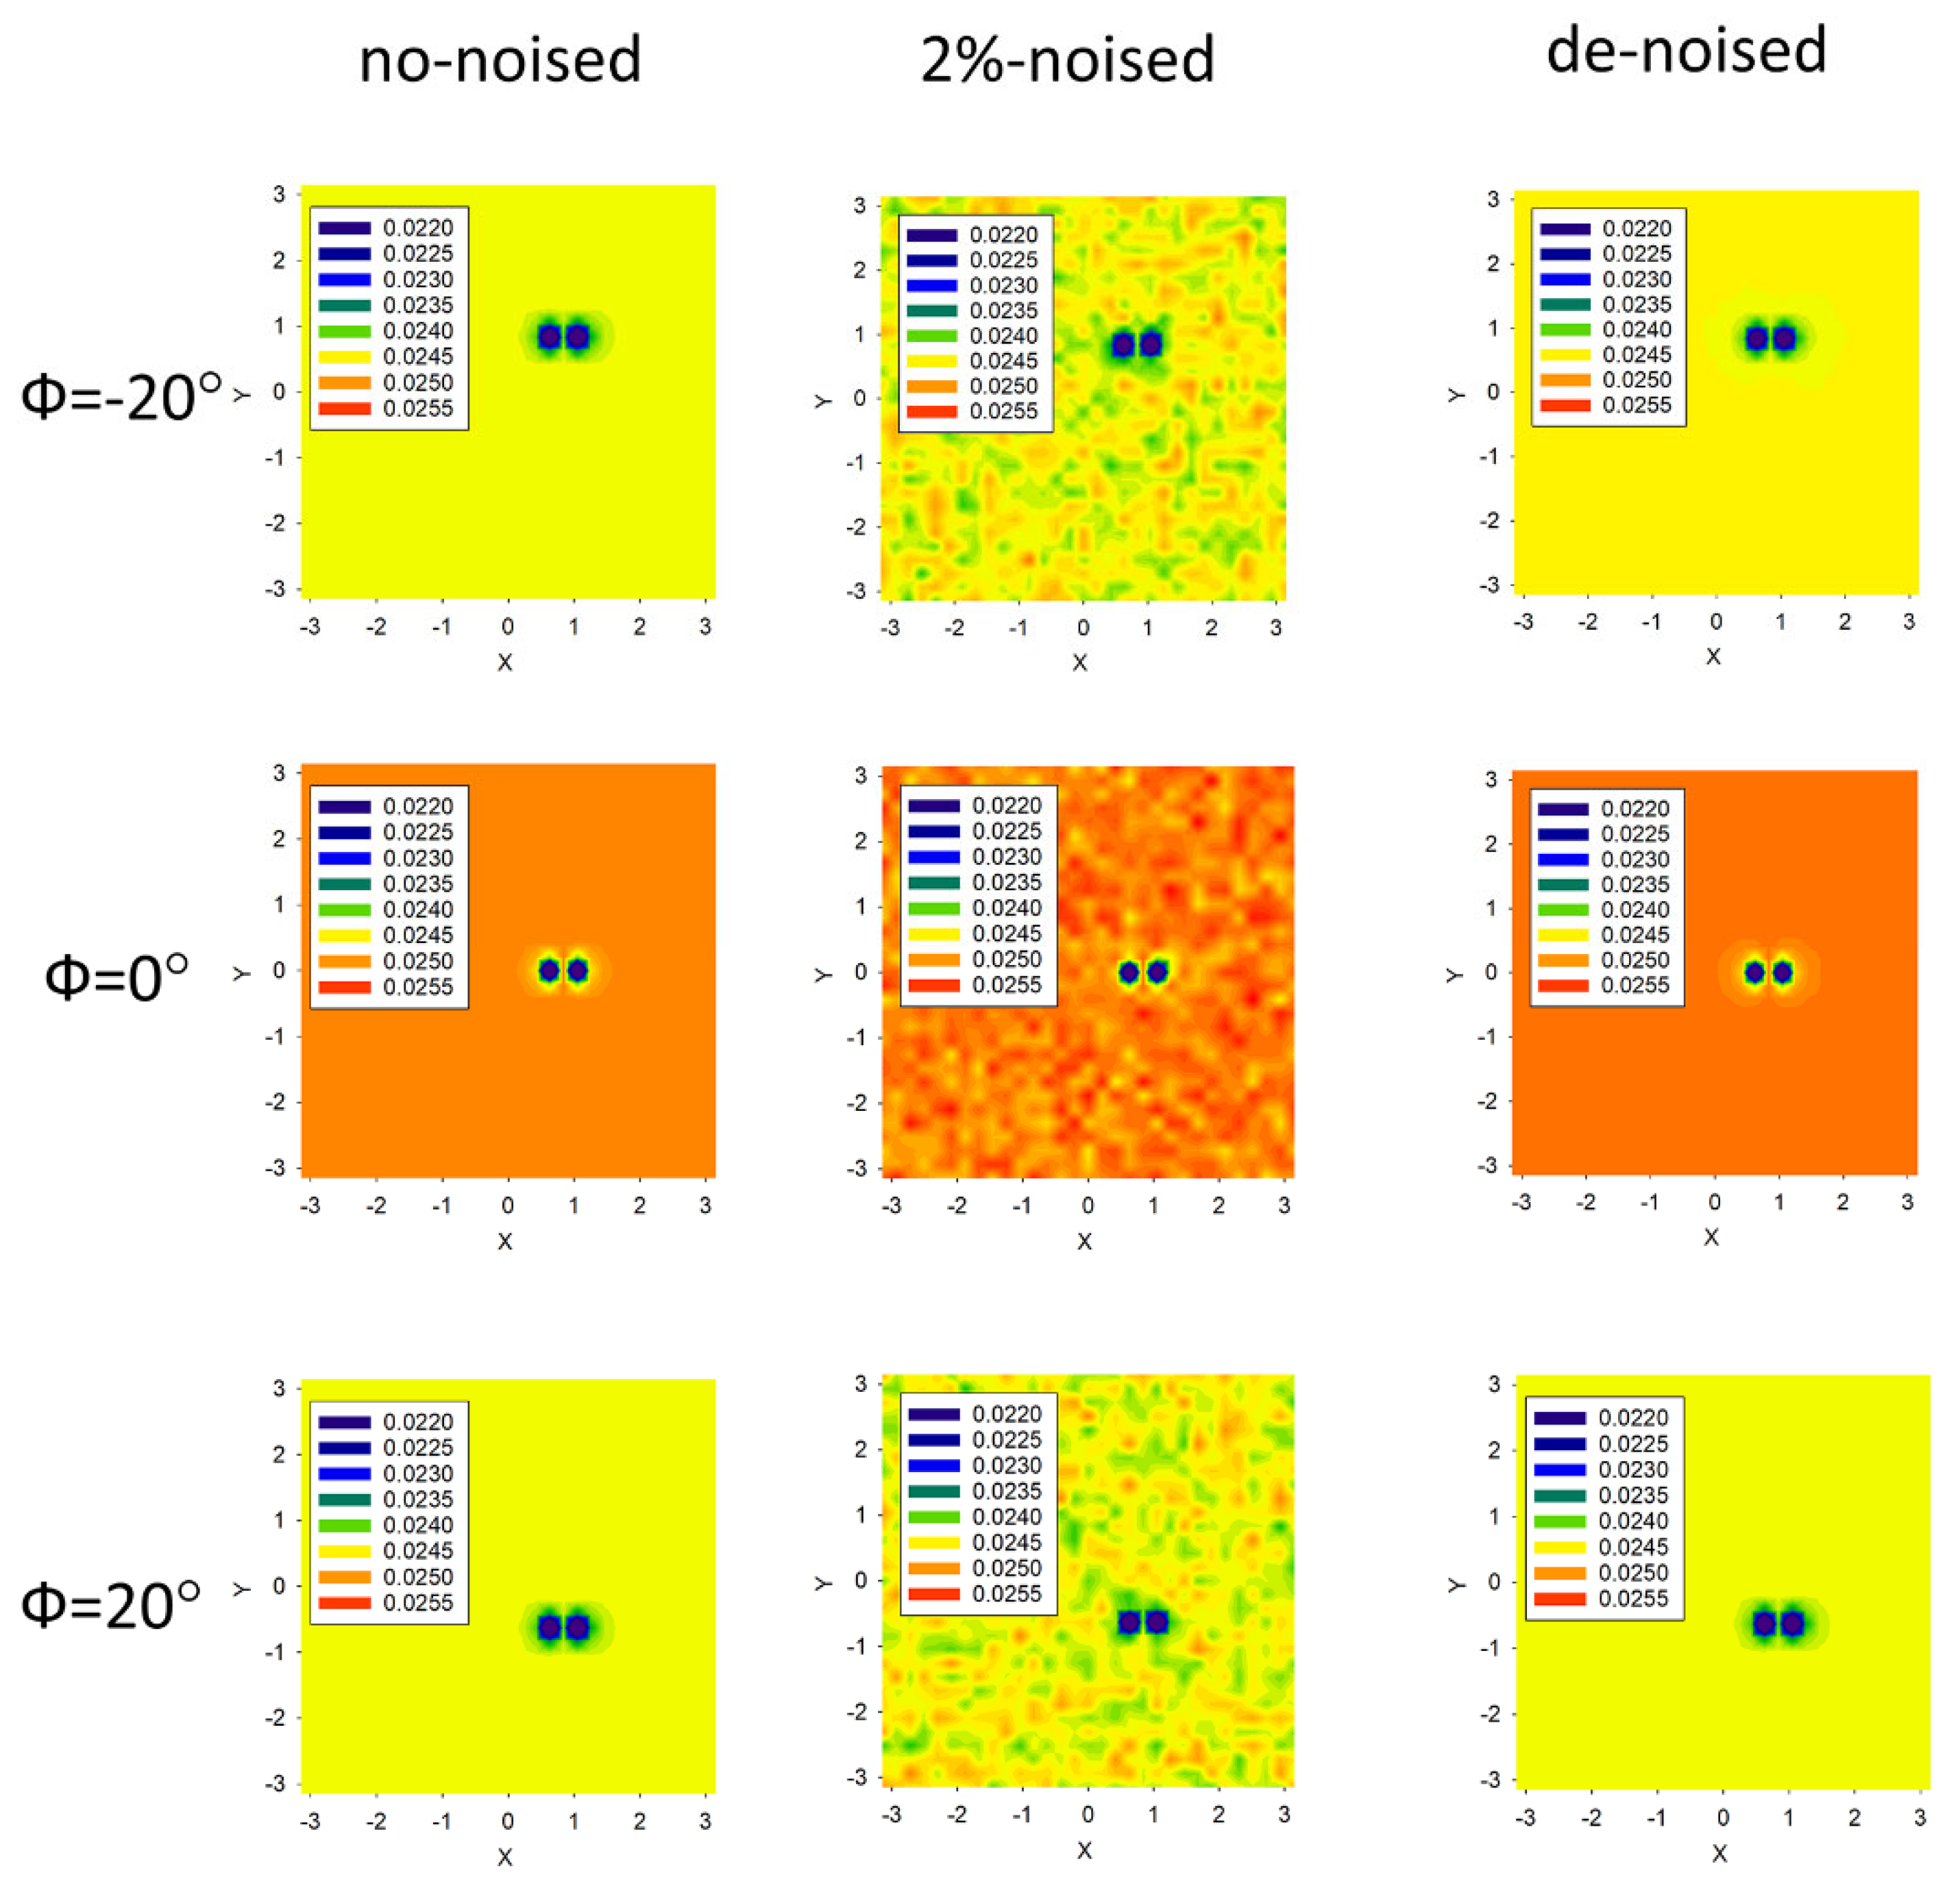
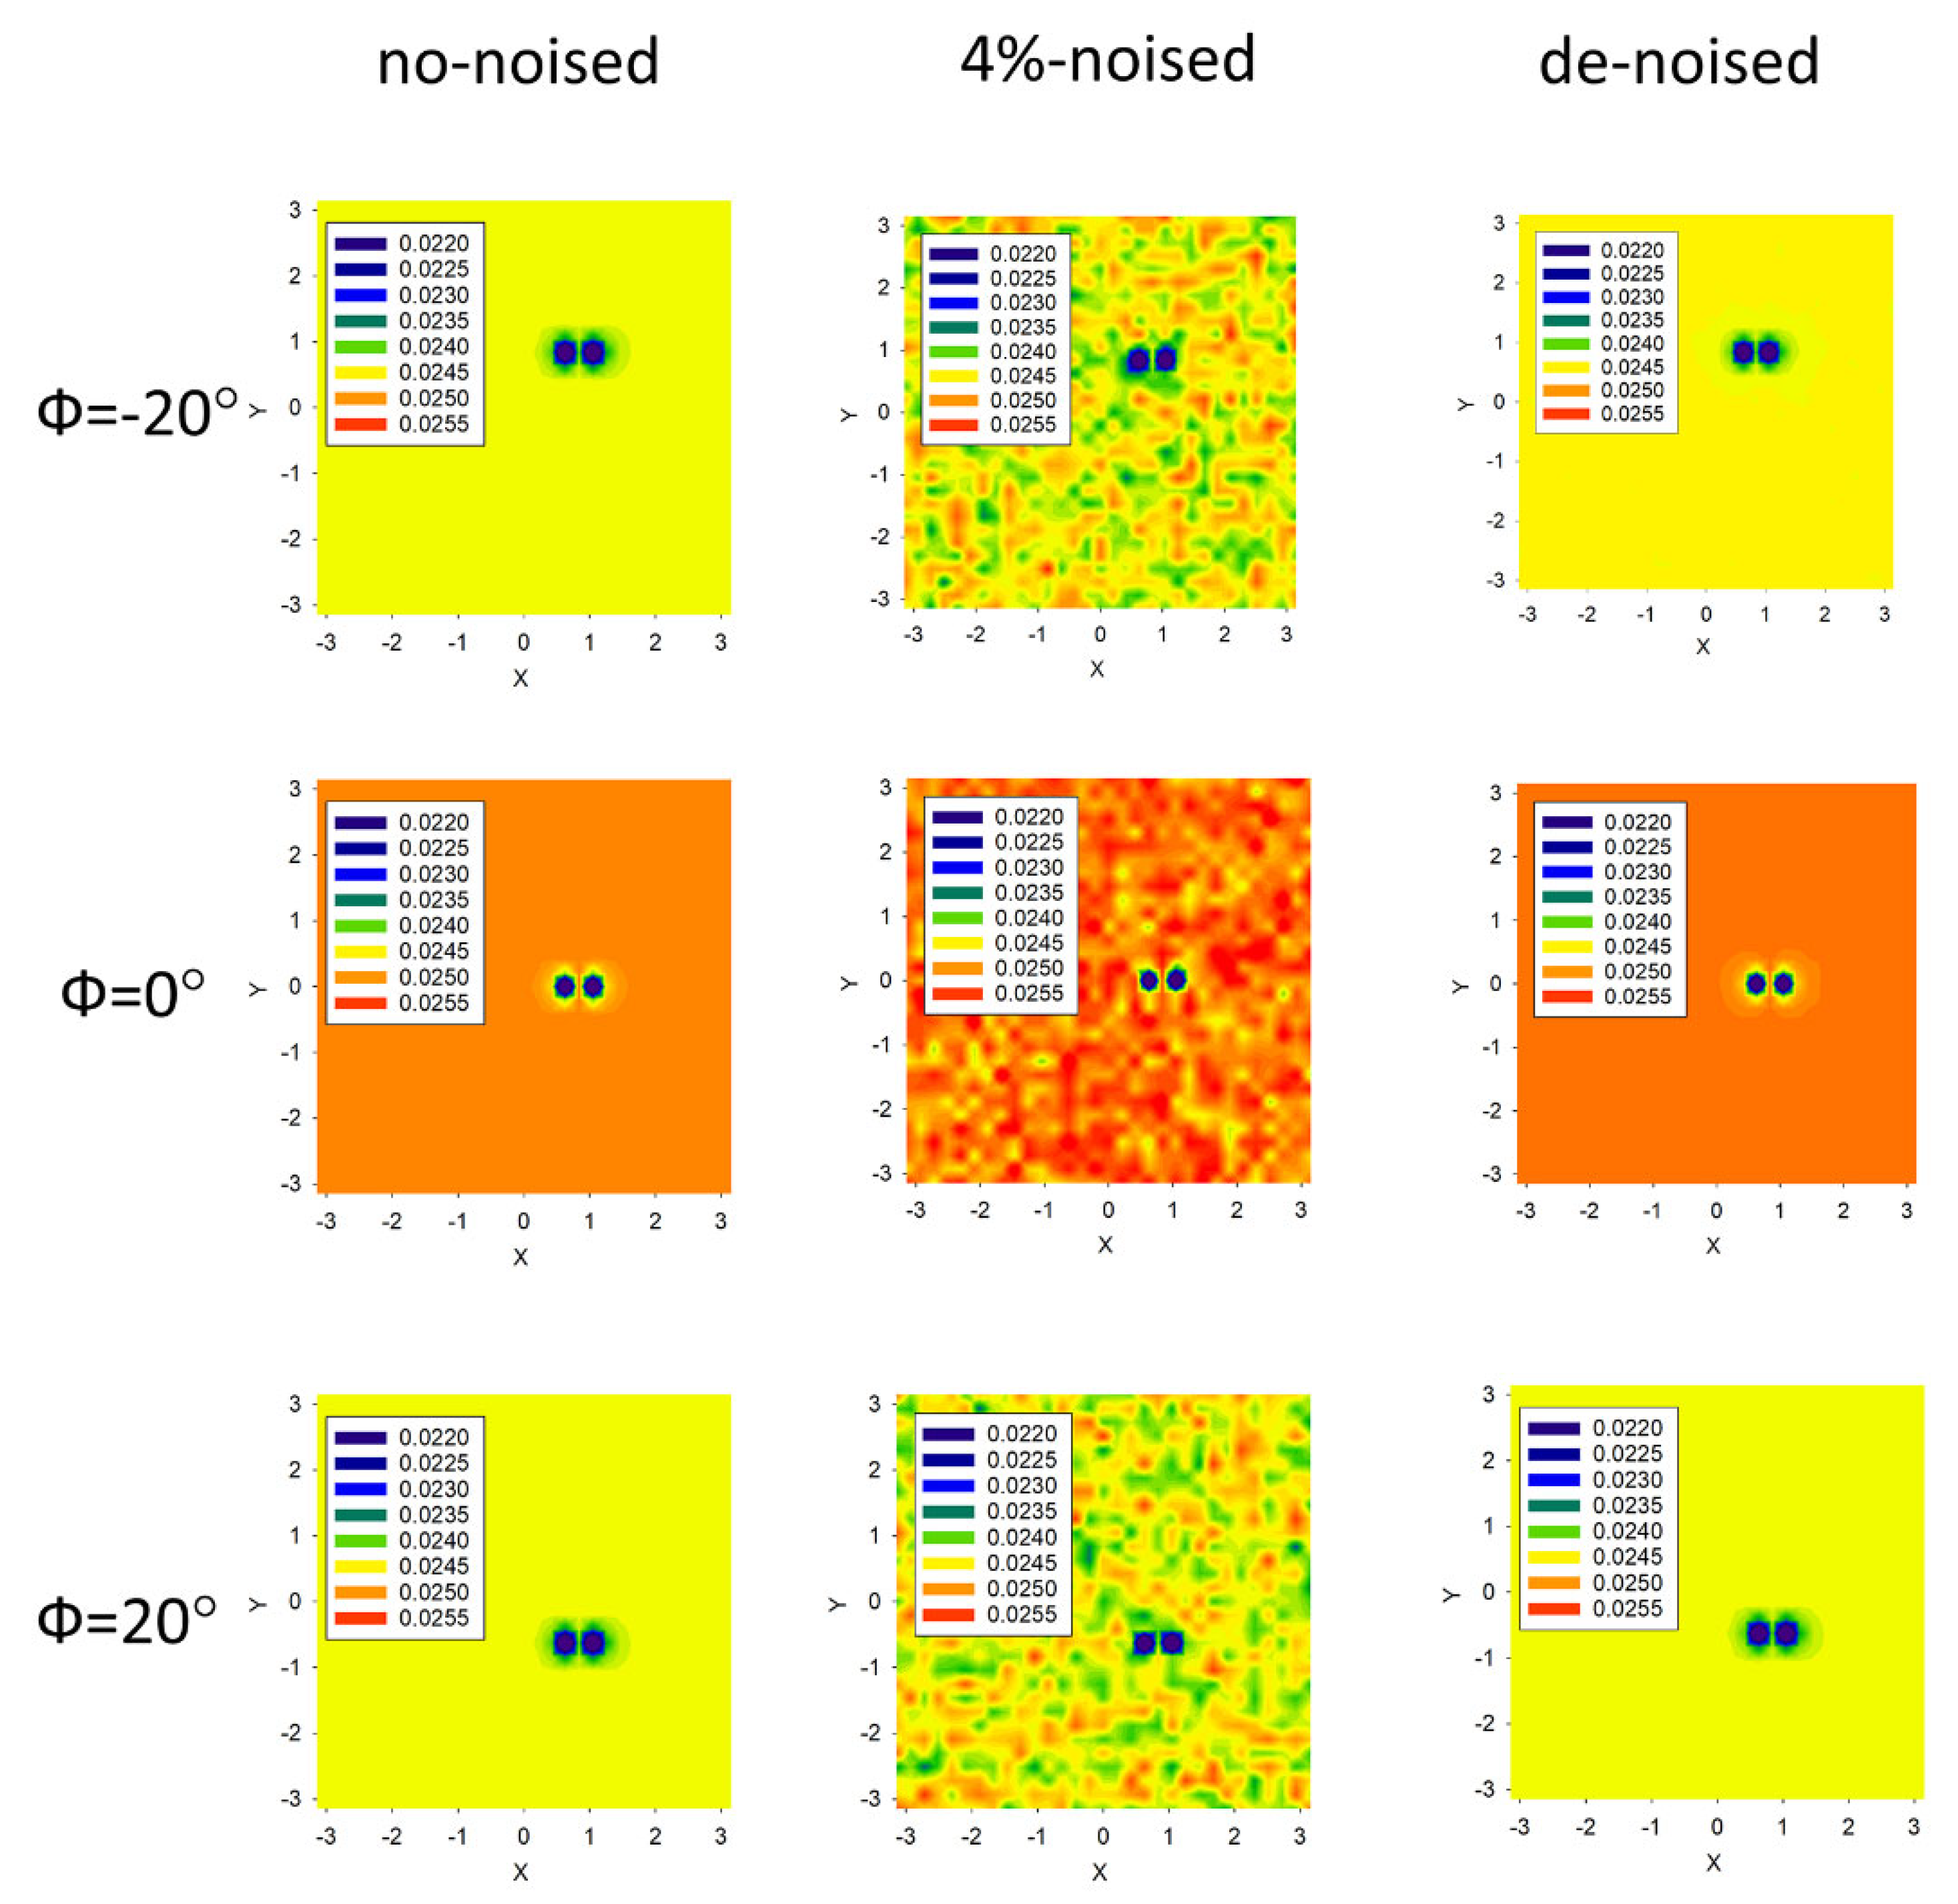
Respectively, in the first 2 columns of Figure 2 and Figure 3, the {0, 2% and 4%}-Poisson-noise levels frames for the rotation angle set Φ = {−20°, 0°, 20°} are depicted. Note that the 2D zero-noise imaging frames were calculated with the true 3D function f C t p d ( r r 0 ) , with the values r0=(x0 = 0, y0 = 0, z0 = Λ/2) and F = 0.064 μm3.
Correspondingly, the 3D function f C t p d ( r r 0 ) is characterized by the vector 𝓟 ( t r u e ) = ( 3 / 2 ,   / 2 , 0.064 ) during the XRDT recovery processing.

2.2. Statistical Denoising the 2D IPs Data Frames

To be specific, in Figure 2 and Figure 3, the third columns, the 2D IPs frames obtained by the statistical averaging of the number U = 102 of the 2D noise-contaminated frames, are presented.
As it follows from Figure 2 and Figure 3, the statistical-averaged IPs frames look much better in comparison with the no-noise 2D IPs frames and, in practice, do not differ from the no-noise IPs ones (cf. the first columns in Figure 2 and Figure 3).
It is worth emphasizing that the key idea of the direct statistical averaging of the 2D Poisson-noise IPs frames is due to the Poisson-noise distribution nature (see the fundamentals (1)–(3)). Namely, in each pth pixel of the statistically averaged IPs frame of the total U-number ones, the pth signal is equal to:
1 U u = 1 U ( N p + E ( | X p , u N p | ) × R a n d o m [ 1 ,   1 ] )
where the function R a n d o m [ 1 ,   1 ] is the uniform random distribution, noting that Np=Mean[Xp], Np >> 1.
When the number U is large enough and even, the number U 2 occurs as a large integer, as well. Accordingly, taking into account the estimate (3) for Np >> 1, the relative noise component ( E ( | X p , u N p | ) N p × R a n d o m [ 1 ,   1 ] ) is proportional to (Np)−1/2 and enters equally likely with opposite signs (cf. [25]). This means that one could immediately assert that the statistical processing in (4) reduces the Poisson-noise level on the resultant 2D IP frame.
Thus, it allows one to infer that evaluations based on the statistical averaging of the 2D Poisson-noisy IPs frames could be an effective tool for the denoising of the reference 2D IPs data in the high-resolution XRDT, which is reasonable from the physical viewpoint.
To be direct, in order to prove that the statistical mean in (4) is effective and works, the recovery processing of the true 3D displacement function f C t p d ( r r 0 ) was launched in the proper way.
Following up to [9], the quasi-Newton—Levenberg–Marquardt—Simulated Annealing (qNLMSA) algorithm to minimize the XRDT χ2-target function in the case of the 2D noise-filtering IPs was employed to find out the recovery solution of the inverse XRDT issue (Radon’s issue).
The detailed description of the computer script involved for the image reconstruction process is given in Appendix A.
Optimizing the XRDT χ2-target function { 𝓟 } was launched with { 𝓟 } , defined as (cf. [9]):
{ 𝓟 } = 1 N { X , Y } i = 1 N { X ( T ) , Y ( T ) } ( I r e f [ X ( T ) , Y ( T ) ; Φ i ] I m o d [ X ( T ) , Y ( T ) ; Φ i , { 𝓟 } ] ) 2 ( I h , r e f [ X ( T ) , Y ( T ) ; Φ i ] ) 2 = M i n
where the following assumptions and notations are introduced.
Namely, I r e f [ X ( T ) , Y ( T ) ; Φ i ]   is the 2D noise frame related to rotation angle Φ i . I m o d [ X ( T ) , Y ( T ) ; Φ i , { 𝓟 } ]   is the model frame with the same value of Φ i . 𝓟 is the fitting-vector, 𝓟 = {ν, Z0, G} in a search, with ν characterizing the power-law dependence of the function f C t p d ( r r 0 ) , the defect location at r 0 = (0, 0, Z0) and the parameter G being the defect power. N is the number of 2D frames involved, according to the rotation angle { Φ i , i=1, 2,…, N. Here above, the true vector 𝓟 ( t r u e ) =(ν, Z0, G) is chosen, with the dimensionless parameters as 𝓟 ( t r u e ) =(1.5, 0.5, 1.8), respectively.
It is interesting that for the sample rotation angle Φ = 0 ° ,   the de-noised images in Figure 2 and Figure 3 are more reddish than the corresponding no-noised ones. It is purely the color-imaging increase effect due to the shift in the “mean value” within 0.1%. In addition, it does not affect the subsequent 3D recovery processing in any way.
To estimate the validity assessment of the denoising processing, the recovery processing of the XRDT χ2-target function { 𝓟 } was launched according to (5), and the crystal bulk was chosen as the rectangular prism measured in the dimensionless coordinates (X,Y,Z) in the units of Λ/π, respectively, 0 ≤ ZT, −TX(T)T, −TY(T) ≤ T, T = Λ.
While the { 𝓟 } fitting was in action, the FOM value k was evaluated at each kth-step-iteration of the current vector 𝓟(k) as:
  k = Φ { X ( T ) , Y ( T ) } | I h , t r u e [ X ( T ) , Y ( T ) ; Φ ] 1 2 I h , c a l c [ X ( T ) , Y ( T ) ; , { 𝓟 ( k ) } ] 1 2 | / Σ Φ Σ { X ( T ) , Y ( T ) } I h , t r u e [ X ( T ) , Y ( T ) ; Φ ] 1 / 2
The results of the evaluations are listed in Table 1. Additionally, in Table 1, there are the evaluated results of the 2D noise-contaminated IPs frames related to the {Φi}={−20°,…, 0°,…, 20°}, i = 1, 2, 3,…, N, where N=3 and N=101.
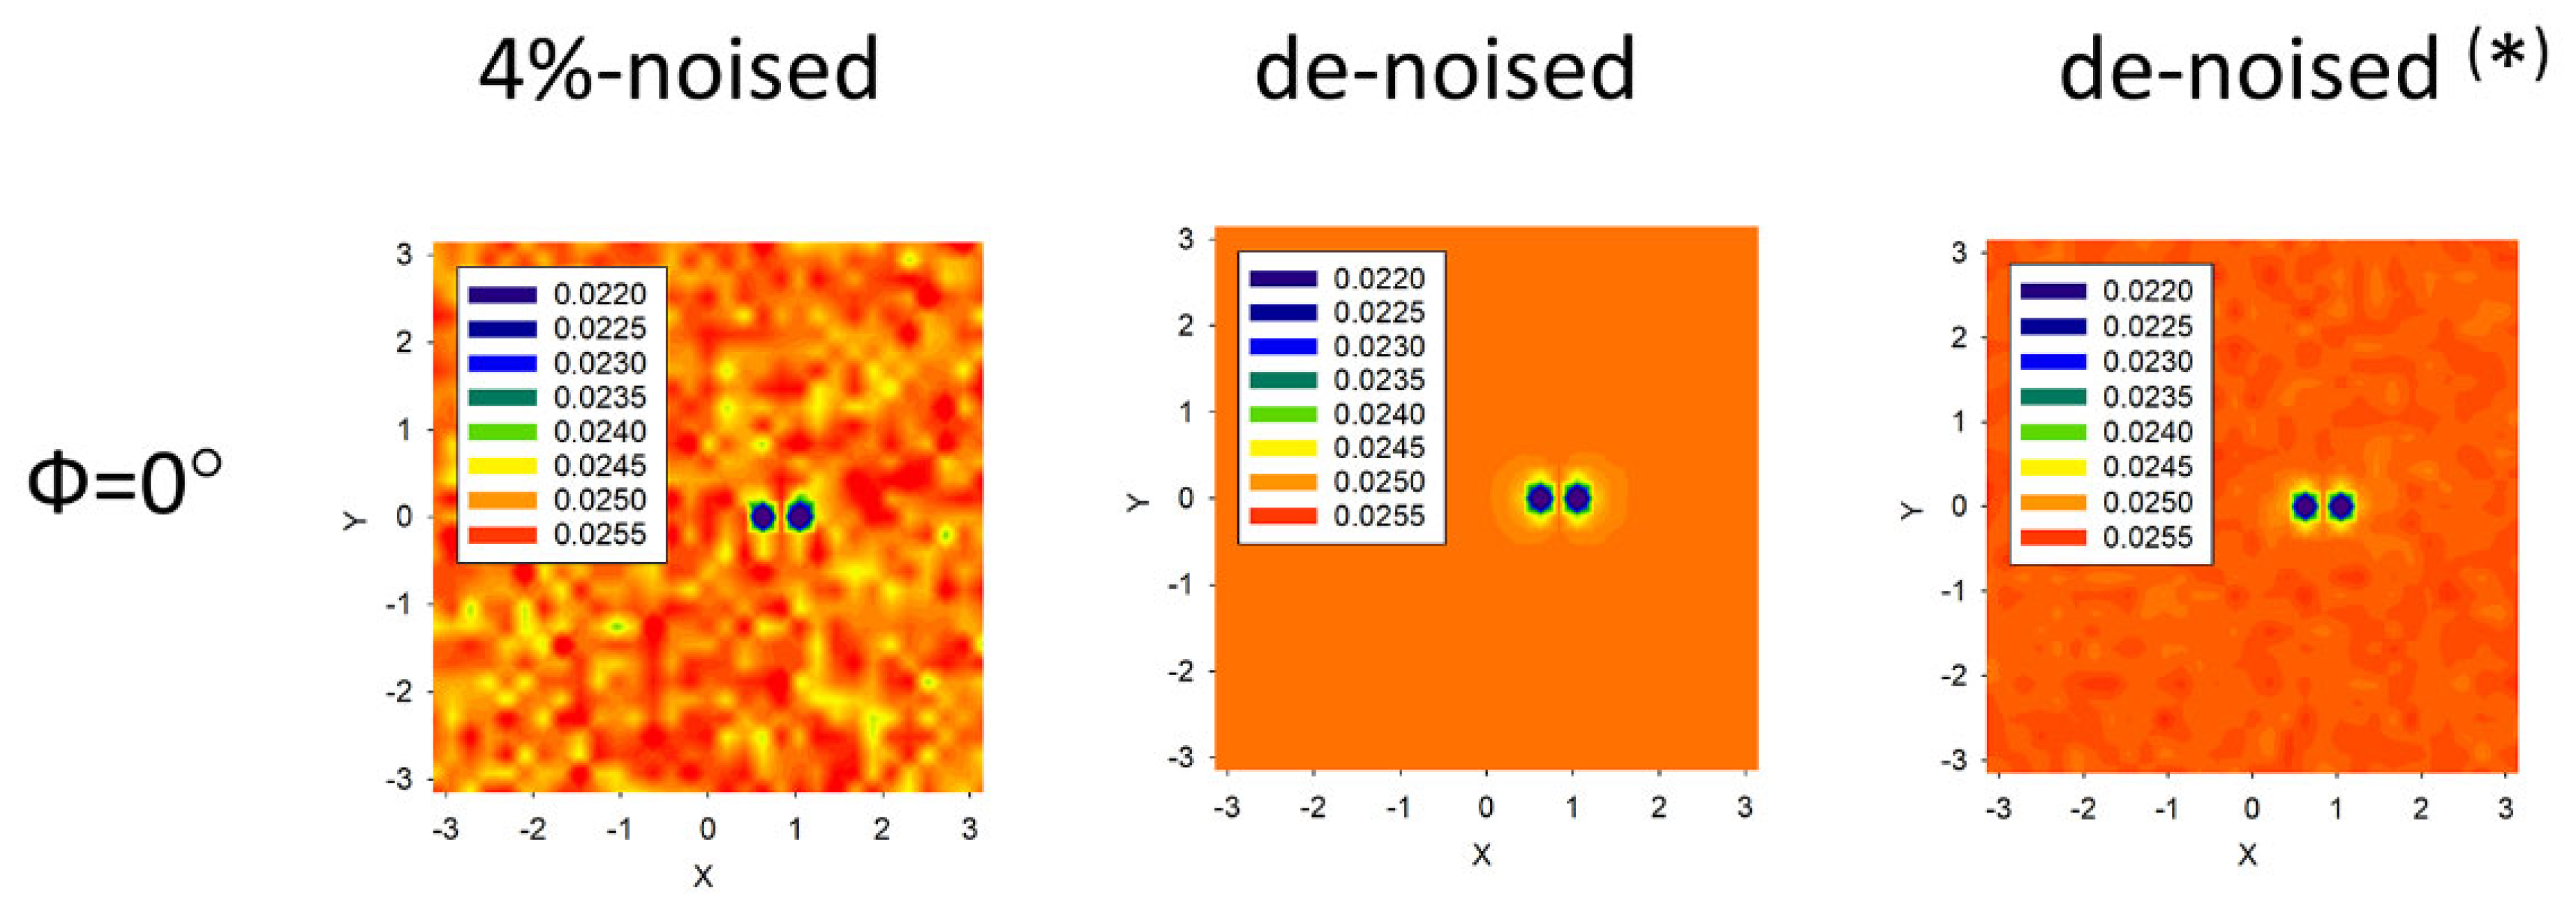
To complete the investigation of filtering the 2D Poisson-noise IPs data frames, the evaluations below using the geometric Means of the U-number of the 2D Poisson-noise Ips data frames were carried out, and the resultant recovery cross-sections of the 3D function f C t p d ( r r 0 ) are shown in Figure 4.
i = 1 U ( N p + E ( | X p , u N p | ) × R a n d o m [ 1 ,   1 ] ) U
For the validity assessment of the de-noised 2D IPs data, one may apply the peak signal-to-noise ratio (PSNR) criterion to be effective, as well [26]. For the sample rotation angle Φ = 0 ° , the corresponding evaluations yield the following levels of the PSNRs for the 2%- and 4%-noise 61× 61 IPs and maximum imaging signal in the vicinity of the defect (the coordinates x=1, y=0 in Figure 2 and Figure 3) , respectively: (a) no-averaged case — 37.76 and 32.99; (b) averaged case — 49.07 and 48.04; (c) geometric averaged case — 45.88 and 43.52.
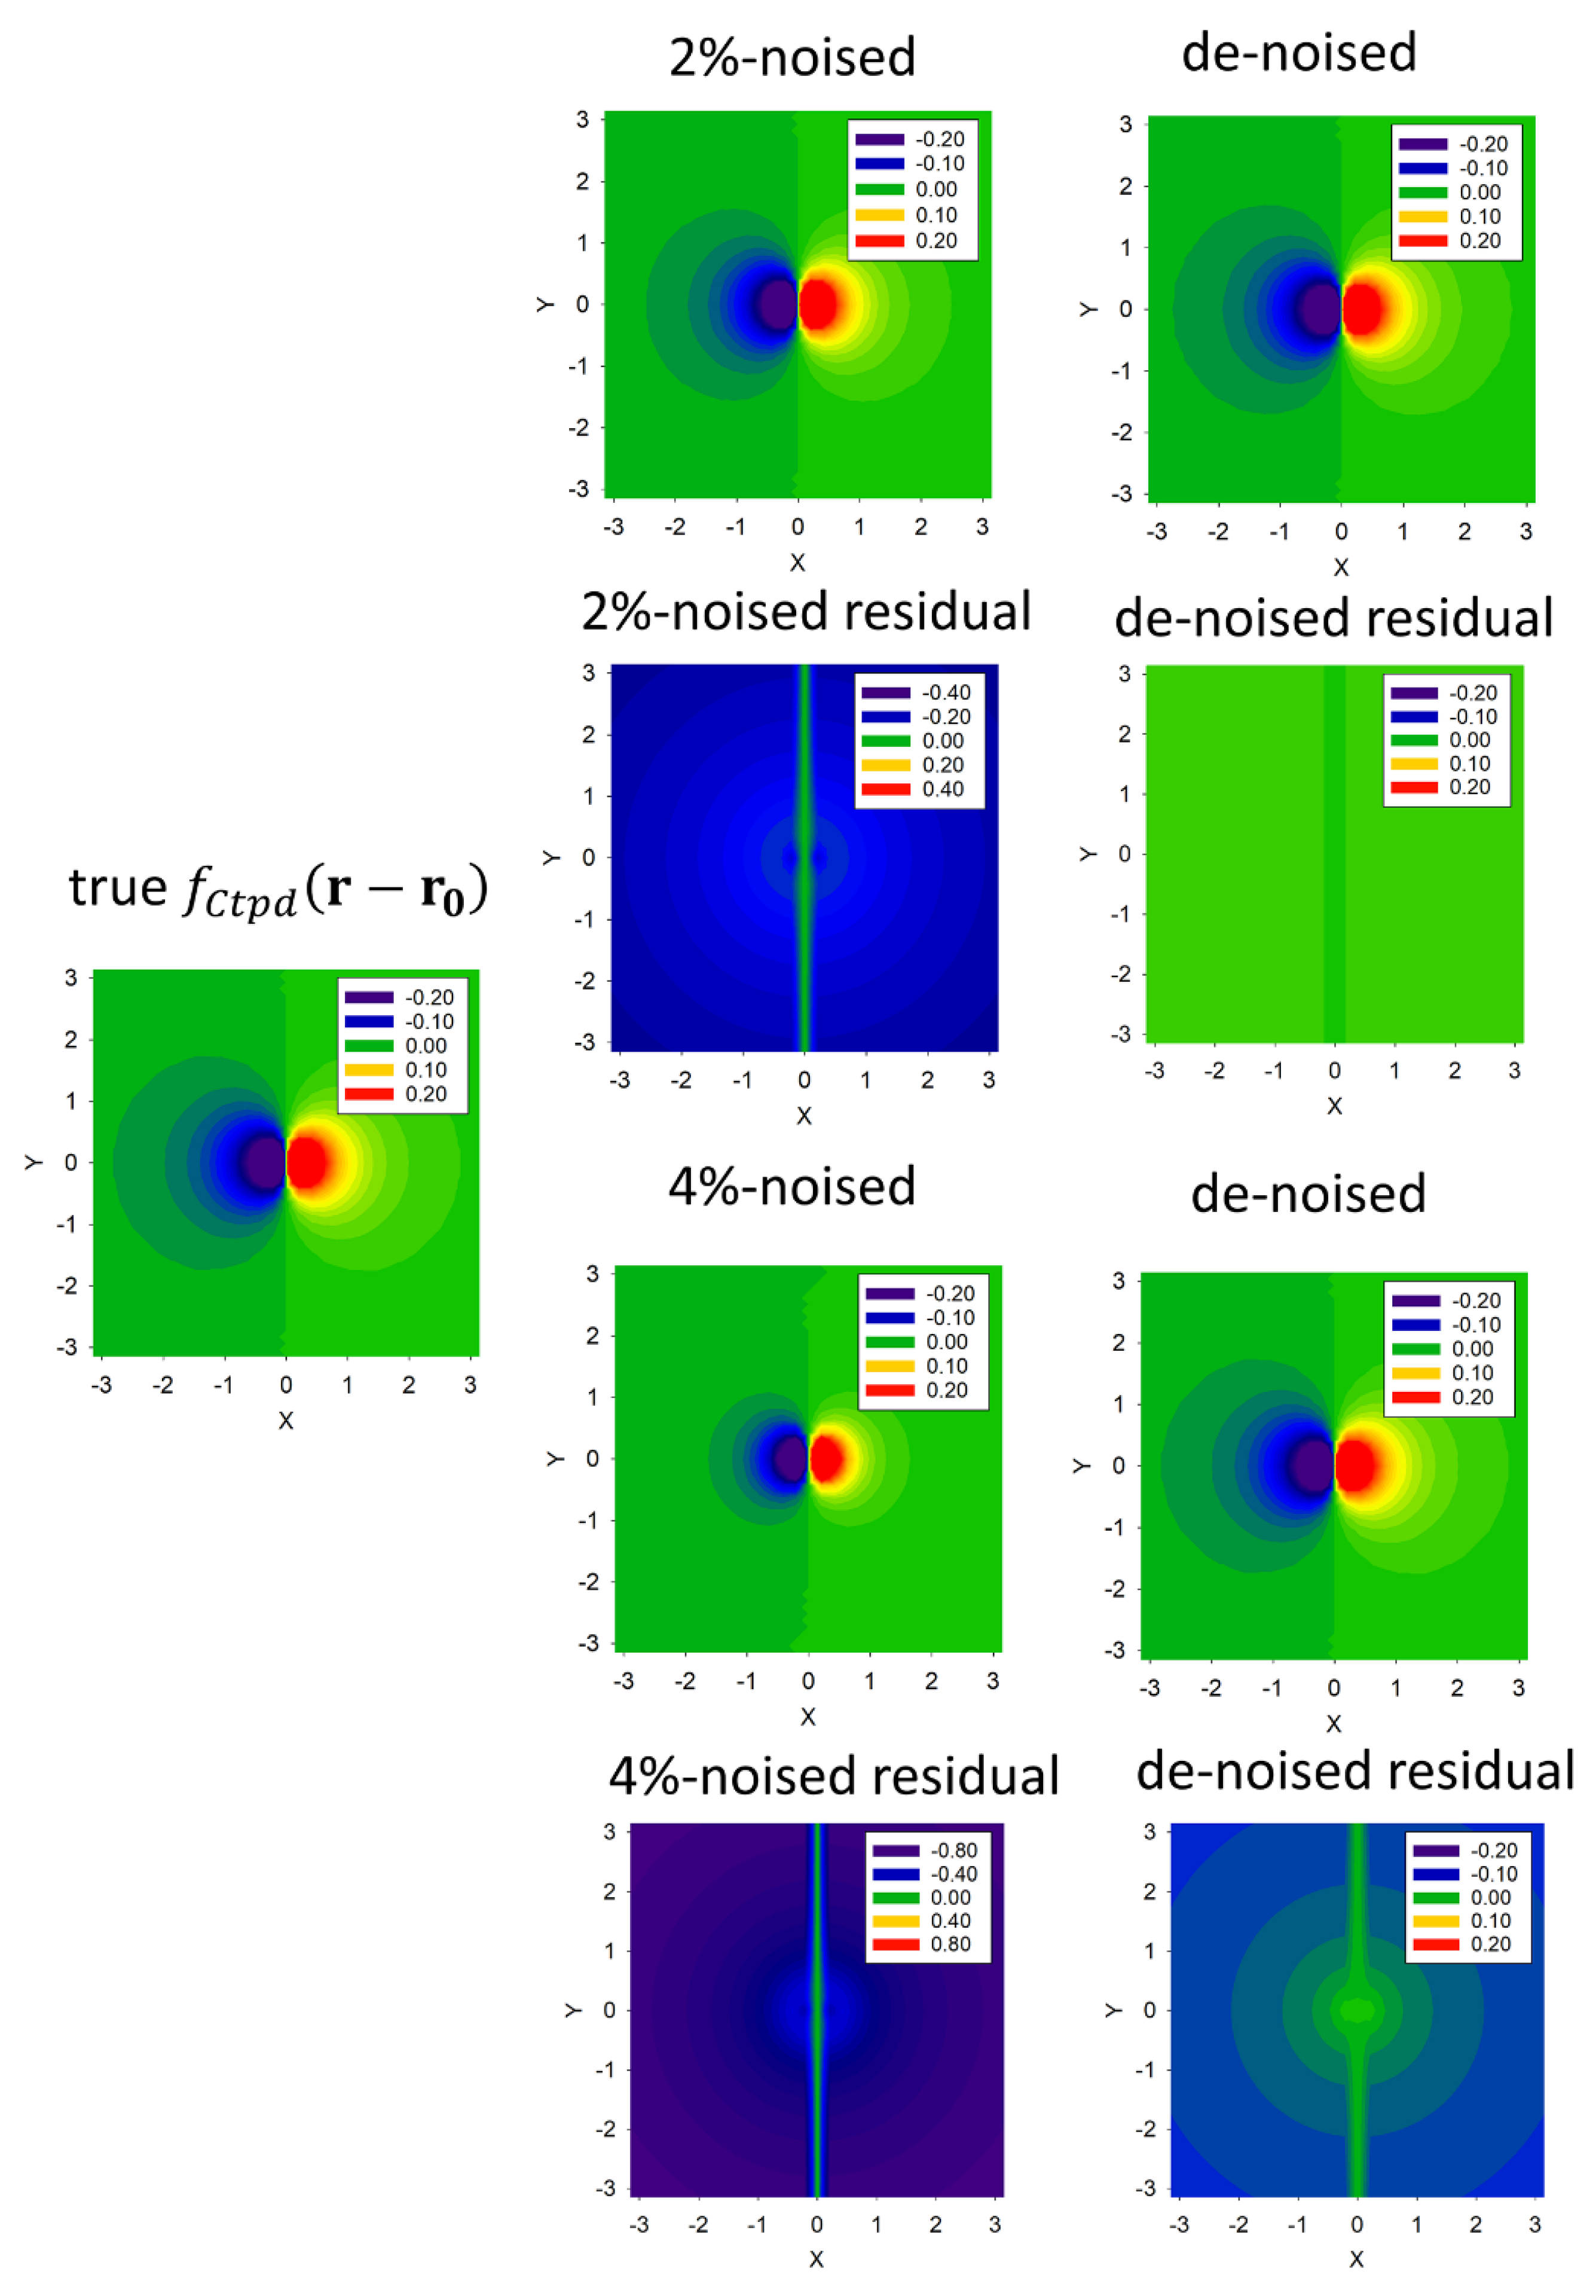
As it follows from all the massive calculations (Figure 5), they definitely show a solid trend of decreasing the FOM values k(end) with the increasing of the number of the 2D IPs frames involved, in particular, those involved in the average and geometric Means processing of the 2D Poisson-noise IPs frames. Thus, they clearly demonstrate the improvement of the accuracy of the recovery XRDT issue solution.
On the other hand, it is worth mentioning that the numerical FOM values k(end) depend on different realizations of the 2D Poisson-noise IPs frames. To be specific, when the Poisson-noise strongly damages the 2D IPs frames near the point defect core, the plausible quality of the 3D function f C t p d ( r r 0 ) recovery could become impossible. This means that one needs to have a set of various realizations of the 2D Poisson-noise IPs frames and then choose the realization that provides the best one related to the minimum FOM values k(end).
As follows from our calculations, sometimes, the direct recovery processing of some large number of the 2D non-averaged Poisson-noise IPs frames yields the self-consistent decreasing of the FOM values   k ( e n d ) . Such a fact itself is interesting and might be a good topic for further work.
Noteworthy is the fact that the calculated results listed in Table 1 allow one to conclude that the Poisson-noise filtering of the 2D IPs frames with statistical evaluations, particularly, the use of the average and geometric means processing, is a good tool anyway to improve the signal-to-noise ratio in computer XRDT.

3. Discussion

In the present study, we have pursued an aim to noise-filter the 2D Poisson-noise IPs data frames in order to obtain high-accuracy information about the nano-scaled crystal structures in the XRDT.
According to Devroye’s algorithm [24], numerically simulating the 2D Poisson-noise IPs data frames was carried out and employed for generating 2D Poisson-noise IPs frames with the counting noise levels of 2–4%. The de-noised processing with statistical evaluations using the average and geometric means techniques was proposed and realized. By applying the qNLMSA algorithm [9] to prove the denoising effect, the recovery XRDT problem was solved in the case of the Coulomb-type point defect in crystal Si(111). The latter allowed us to make a solid inference that the noised-filtering procedure of the 2D Poisson-noise IPs of the noise level counting of the order of 2–4% secures unambiguously plausible information about nano-scaled crystal structures with good accuracy.
It is important to notice that statistical averaging of some number of the 2D Poisson-noised frames provides high-quality improvement of the recovery XRDT solution, whereas geometric Mean processing yields a lower gain factor in comparison with using a set of the non-averaged IPs data frames, as follows from Table 1 (and Figure 4, as well). Apparently, the last circumstance is connected with the non-linear character of the statistical geometric Mean operation.
Noteworthy is the fact to be considered by a question of whether the ease-of-access of a number of the separate 2D IPs data frames is actual. Processing some number of the 2D IPs frames with a rather short time exposure has some advantages. Particularly, it allows one to avoid the incipient radiation sample damage and other parasitic systematic errors of the 2D IPs reference data with a long-time exposure. Moreover, the de-noised processing of the 2D IPs frames, along with using statistical evaluations, makes it possible to reveal the low-intensity 2D IP frame details masked by the Poisson-noise in the X-ray hybrid pixel detectors.
At present, the 2D IP framerate of the area CCD hybrid pixel detectors is quite high, and it can be altered within a wide range from one kHz to tens of MHz, only governed by the reasons of the sufficient X-ray intensity per pixel [27].
Assuming the exposure time to be about 0.1 s for the typical 2D IP frame, one might design a set of 100 frames at least, if each of them contains at least 103 ph/s, per the detector pixel in the notional and functional picture parts of the 2D IPs.
It is worthy to notice that a recent development in the field of CCD digital detector technology permanently decreases the limits of the achievable spatial resolution of X-ray diffraction imaging. CCD digital detectors with the resolution level of several microns have been used to be the domain of the synchrotron facilities for a long time.
Such a pixel resolution is now routinely achievable in laboratory X-ray diffracted imaging systems. Using microfocus X-ray sources, it is possible to reach the spatial resolution even deeply below one μm [28], not to mention the suitable optics, such as the Fresnel zone plates (FZP). X-ray microscopes equipped with FZP have been successfully used for the imaging of separate cells with a spatial resolution of 30 nm [29]. The single 2D IPs framerate count in such detectors usually exceeds the tens of kHz, and the intrinsic noise does not exceed several count units during a few seconds per pixel. Such detector characteristics are sufficient for 2D multi-frames imaging in high-resolution computer XRDT.
As to the influence of the vibrations of the sample relative to the source and the detector, such a question is missed for the following reasons. First, it is about the computer XRDT setups, for which the vibration amplitudes are negligibly small. The latter can be achieved by obvious methods: the elements of the setup device are placed on a rigid base (a plate or an optical bench placed on the vibration protection supports; otherwise, the XRDT images with a submicron resolution in the literature would be significantly blurred).
Frame-by-frame image processing makes it possible to recognize and even estimate the influence of instrumental vibrations by comparing the successive frames with each other and matching them in the registration panel with the least squares method. The acquisition system shown in Figure 1 transfers information about the amplitude and direction of vibrations and makes corrections of the signal shift into the 2D IPs frames.
In our paper, we assumed that the Poisson-noise of the 2D IPs does not exceed the 2–4% level. Thus, such a noise level of the 2D Poisson random IP component corresponds to the average image counting of about 625–103 ph/pixel.
Noteworthy is the fact that the validation of the results related to the de-noised 2D IPs data obtained is carried out by both the 3D recovery processing of the Coulomb-type point defect in a crystal Si(111) and using the peak signal-to-noise ratio (PSNR) criterion.
It should once more be stated in conclusion that both the feasibility and good skill of the 2D de-noised IPs data frames tested for the XRDT model spherical inclusion could further facilitate the development of the computer XRDT technique, which is of great interest. By improving the experimental XRDT counting statistics and simultaneously solving some theoretical issues, the nano-resolving XRDT method could be favorably applied to structure investigations of low-quality organic single crystals or dilute solid solutions, which is a good topic for future work.

4. Conclusions

The conducted study in the paper allows one to conclude that computer XRDT with statistical evaluations can be an effective tool for quantitatively investigating nano-sized defects in semiconductor crystals, such as various clusters, small dislocation loops, quantum wells, quantum wires and so on.
As is demonstrated in the paper, denoising of the 2D IPs data proposed matches the real-world measurements in the computer XRDT techniques.
A question of how are mathematical fundamentals elaborated for solving the computer XRDT issue will work in the case of any kind of defects and remains a good topic for future work. In addition to the denoising validation (cf. the FOM values   k ( e n d ) in the last column of Table 1 and the calculated PSNR values), the noise simulation results require testing to capture the real XRDT measurements.
Nevertheless, remaining in the scope of the study carried out, one could conclude that the statistical denoising of the 2D Poisson-noise IPs works well and facilitates pushing further the recovery XRDT processing technique.

Author Contributions

Conceptualization, F.N.C.; methodology, F.N.C., P.V.K. and V.V.V.; software, P.V.K. and V.V.V.; formal analysis, F.N.C. and P.V.K.; computational experiment, P.V.K.; original draft preparation, F.N.C. and P.V.K.; writing—review, F.N.C., P.V.K. and V.V.V.; results discussion, F.N.C., P.V.K. and V.V.V.; supervision, F.N.C. All authors have read and agreed to the published version of the manuscript.

Funding

This work was supported by the Ministry of Science and Higher Education of the Russian Federation within the State assignment FSRC «Crystallography and Photonics» RAS.

Data Availability Statement

Not applicable.

Acknowledgments

Special gratitude to Asadchikov, V.E. and Zolotov, D.A. for the invariable interest and fruitful discussions concerning the present study.

Conflicts of Interest

The authors declare no conflict of interest.

Appendix A

According to a general concept of the inverse XRDT problem solution by using the joint qNLMSA algorithm code described in [9], the flow procedure equation of the search process of optimizing the target function { 𝓟 } (Equation (5)) can be written as follows:
  • Do
  • [ Assign the initial vector   𝓟 j ( s t a r t ) ,   j = 1 , 2 , 3 for 𝓟 ={ν, Z0, G}.
  • Calculate the differential Δ 𝓟 L M ( k ) for the activated qNLM algorithm, 1 ≤ kK.
  • the qNLM algorithm is applied until the criterion | { 𝓟 ( k + 1 ) } { 𝓟 ( k ) } | { 𝓟 ( k ) } < 10−10 for the SA switch number m = 0.
  • Evaluate the figure of merit (FOM) Ɽk (see Equation (6)).
  • Terminate the minimization procedure of the target function { 𝓟 ( K * ) } when it becomes less than 10−10 and/or the FOM value K * becomes less than 10−6 for k=K*, and the switch number m=0, respectively.]
  • End Do.
The processing to recover the 3D function f C t p d ( r r 0 ) was performed using the flow procedure equation above-mentioned for the no-noised, noised and de-noised 2D-IPs data frames. The program code was implemented in Fortran. The program input requires the number of 2D IPs frames equal to N ; the array of sample rotation angles { Φ i } ,   i = 1 , , N ; the value of the relative noise level for the reference 2D IPs frames that relate to the true vector   𝓟 ( t r u e ) ; and the start-valued vector   i n   s e a r c h   = 𝓟{ν, Z0, G}. For each pixel of 2D IPs frames, the Poisson-noise was added according to Devroye’s algorithm [24]. On the terminate stage, the program yields the optimized vector 𝓟(k)(end)={ν, Z0, G}, for which the corresponding 3D function f C t p d ( r r 0 ) is the best one connected with the reference 2D-IPs frames.

References

  1. Bowen, D.K.; Tanner, B.K. High Resolution X-Ray Diffractometry and Topography; Taylor & Francis: New York, NY, USA, 1998. [Google Scholar]
  2. Chukhovskii, F.N. Dynamic Newton-gradient-direction-type algorithm for multilayer structure determination using grazing X-ray specular scattering: Numerical simulation and analysis. Acta Cryst. 2009, A65, 39–45. [Google Scholar] [CrossRef]
  3. Benediktovitch, A.; Feranchuk, I.; Ulyanenkov, A. Theoretical Concepts of X-Ray Nanoscale Analysis; Springer: Berlin/Heidelberg, Germany, 2013. [Google Scholar]
  4. Ludwig, W.; Cloetens, P.; Härtwig, J.; Baruchel, J.; Hamelin, B.; Bastie, P. Three-dimensional imaging of crystal defects by ’topo-tomography. J. Appl. Cryst. 2001, 34, 602–607. [Google Scholar] [CrossRef]
  5. Danilewsky, A.N.; Wittge, J.; Croell, A.; Allen, D.; McNally, P.; Vagovič, P.; dos Santos Rolo, T.; Li, Z.; Baumbach, T.; Gorostegui-Colinas, E.; et al. Dislocation dynamics and slip band formation in silicon: In-situ study by X-ray diffraction imaging. J. Cryst. Growth 2011, 318, 1157–1163. [Google Scholar] [CrossRef]
  6. Hänschke, D.; Danilewsky, A.; Helfen, L.; Hamann, E.; Baumbach, T. Correlated three-dimensional imaging of dislocations: Insights into the onset of thermal slip in semiconductor wafers. Phys. Rev. Lett. 2017, 119, 215504. [Google Scholar] [CrossRef] [PubMed] [Green Version]
  7. Asadchikov, V.; Buzmakov, A.; Chukhovskii, F.; Dyachkova, I.; Zolotov, D.; Danilewsky, A.; Baumbach, T.; Bode, S.; Haaga, S.; Hänschke, D.; et al. X-ray topo-tomography studies of linear dislocations in silicon single crystals. J. Appl. Cryst. 2018, 51, 1616–1622. [Google Scholar] [CrossRef]
  8. Chukhovskii, F.N.; Konarev, P.V.; Volkov, V.V. X-Ray diffraction tomography recovery of the 3D displacement-field function of the Coulomb-type point defect in a crystal. Sci. Rep. 2019, 9, 14216. [Google Scholar] [CrossRef] [Green Version]
  9. Chukhovskii, F.N.; Konarev, P.V.; Volkov, V.V. Towards a solution of the inverse X-ray diffraction tomography challenge: Theory and iterative algorithm for recovering the 3D displacement field function of Coulomb-type point defects in a crystal. Acta Cryst. 2020, A76, 16–25. [Google Scholar] [CrossRef]
  10. Yang, W.; Hong, J.-Y.; Kim, J.-Y.; Paik, S.; Lee, S.H.; Park, J.-S.; Lee, G.; Kim, B.M.; Jung, Y.-J. A novel singular value decomposition-based denoising method in 4-dimensional computed tomography of the brain in stroke patients with statistical evaluation. Sensors 2020, 20, 3063. [Google Scholar] [CrossRef]
  11. Liu, N.; Schumacher, T. Improved denoising of structural vibration data employing bilateral filtering. Sensors 2020, 20, 1423. [Google Scholar] [CrossRef] [Green Version]
  12. Hendriksen, A.A.; Bührer, M.; Leone, L.; Merlini, M.; Vigano, N.; Pelt, D.M.; Marone, F.; di Michiel Batenburg, K.J.M. Deep denoising for multi-dimensional synchrotron X-ray tomography without high-quality reference data. Sci. Rep. 2021, 11, 11895. [Google Scholar] [CrossRef]
  13. Alvarez, J.L. Poisson-based detection limit and signal confidence intervals for few total counts. Health Phys. 2007, 93, 120–126. [Google Scholar] [CrossRef]
  14. Muller, J.V. Counting Statistics of a Poisson Process with Dead Time. B.I.P.M. Report 111, F92 Serves 1970. pp. 1–14. Available online: https://www.bipm.org/documents/20126/30822082/bipm%20publication-ID-1760/e8c6bac9-b6e0-27a7-2511-b27eb9ab6e07 (accessed on 15 December 2019).
  15. Bondarenko, V.I.; Konarev, P.V.; Chukhovskii, F.N. On the theory of reducing the level of statistical noise and filtering of 2D images of diffraction tomography. Cryst. Rep. 2020, 65, 821–826. [Google Scholar] [CrossRef]
  16. Hudgings, D.W.; Dragt, A.J. Signal averaging at modest cost. Am. J. Phys. 1972, 40, 1206–1211. [Google Scholar] [CrossRef]
  17. Hassan, U.; Anwar, M.S. Reducing noise by repetition: Introduction to signal averaging. Eur. J. Phys. 2010, 31, 453–465. [Google Scholar] [CrossRef]
  18. Kraftmakher, Y. Noise reduction by signal accumulation. Phys. Teach. 2006, 44, 528–530. [Google Scholar] [CrossRef]
  19. Blanchet, C.E.; Zozulya, A.V.; Kikhney, A.G.; Franke, D.; Konarev, P.V.; Shang, W.; Klaering, R.; Robrahn, B.; Hermes, C.; Cipriani, F.; et al. Instrumental setup for high-throughput small- and wide-angle solution scattering at the X33 beamline of EMBL Hamburg. J. Appl. Cryst. 2012, 45, 489–495. [Google Scholar] [CrossRef]
  20. Corzo, R.; Steel, E. Improving signal-to-noise ratio for the forensic analysis of glass using micro X-ray fluorescence spectrometry. X-Ray Spectrom. 2020, 49, 679–689. [Google Scholar] [CrossRef]
  21. An, S.; Reza, S.; Norlin, B.; Froejdh, C.; Thungstroem, G. Signal-to-noise ratio optimization in X-ray fluorescence spectrometry for chromium contamination analysis. Talanta 2021, 230, 122236. [Google Scholar] [CrossRef]
  22. Feng, P.; Luo, Y.; Zhao, R.; Huang, P.; Li, Y.; He, P.; Tang, B.; Zhao, X. Reduction of Compton background noise for X-ray fluorescence computed tomography with deep learning. Photonics 2022, 9, 108. [Google Scholar] [CrossRef]
  23. Zhou, Y.; Zhao, L.; Ni, Z.; Xu, S.; Zhao, J.; Xiao, X.; Huang, J. Heterojunction structures for reduced noise in large-area and sensitive perovskite x-ray detectors. Sci. Adv. 2021, 7, eabg6716. [Google Scholar] [CrossRef] [PubMed]
  24. Devroye, L. The Computer generation of Poisson random variables. Computing 1981, 26, 197–207. [Google Scholar] [CrossRef]
  25. Chukhovskii, F.N.; Konarev, P.V.; Volkov, V.V. Statistical noise-filtering of the X-ray diffraction tomography data: Simulation and analysis. J. Mat. Sci. Appl. 2022, 6, 1–12. [Google Scholar] [CrossRef]
  26. Huynh-Thu, Q.; Ghanbari, M. Scope of validity of PSNR in image/video quality assessment. Electron. Lett. 2008, 44, 800. [Google Scholar] [CrossRef]
  27. Olbinado, M.P.; Just, X.; Gelet, J.-L.; Lhuissier, P.; Scheel, M.; Vagovic, P.; Sato, T.; Graceffa, R.; Schulz, J.; Mancuso, A.; et al. MHz frame rate hard X-ray phase-contrast imaging using synchrotron radiation. Opt. Express 2017, 25, 13857–13871. [Google Scholar] [CrossRef] [Green Version]
  28. Dudak, J. High-resolution X-ray imaging applications of hybrid-pixel photon counting detectors Timepix. Radiat. Meas. 2020, 137, 106409. [Google Scholar] [CrossRef]
  29. Jacobsen, C. Soft X-ray microscopy. Trends Cell Biol. 1999, 9, 44–47. [Google Scholar] [CrossRef]
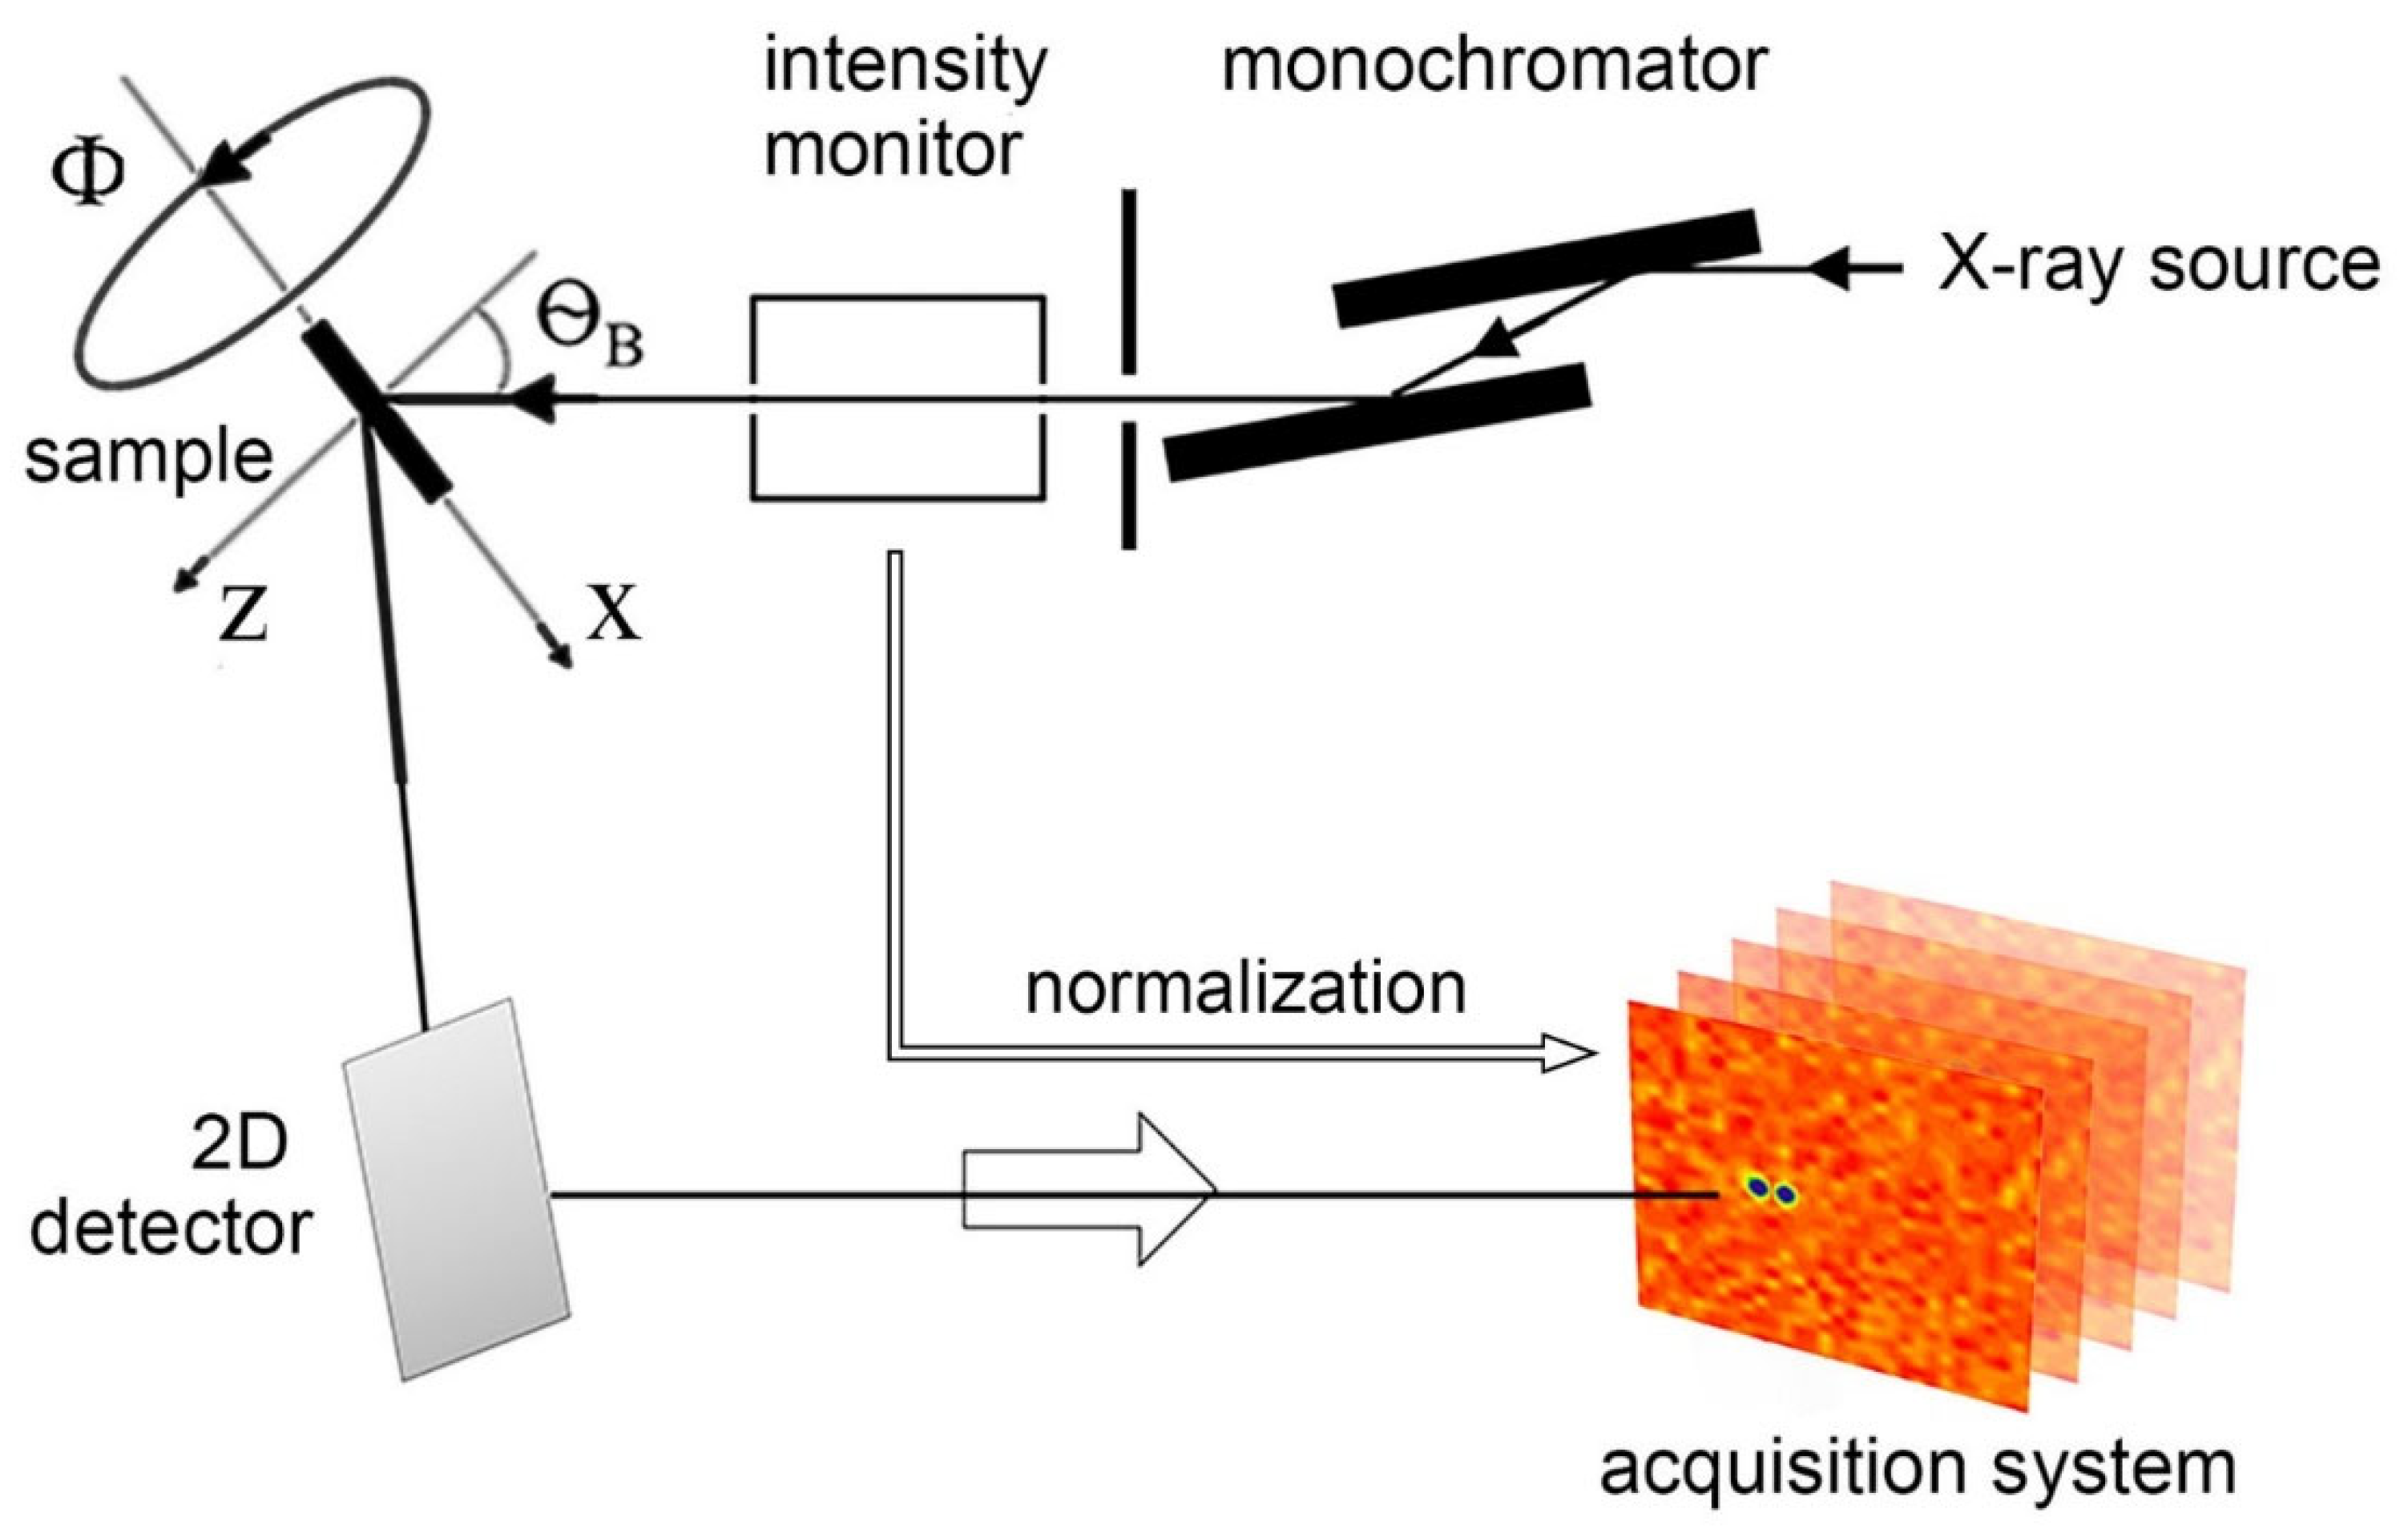
Figure 1. Schematics of set-up for measuring 2D IPs in the multi-frames mode. A set of frames is acquired for the crystal sample position fixed.
Crystals 13 00561 g001
Figure 2. The 2D IPs: no-noise (left), 2%-noise level (middle) and de-noised (right). The number of non-averaged IPs data frames is equal to 100. The sample rotation angles Φ are equal to {−20°, 0°, 20°}, respectively.
Crystals 13 00561 g002
Figure 3. The 2D IPs: no-noise level (left), 4%-noise level (middle) and de-noised (right). The number of non-averaged IPs data frames is equal to 100. The sample rotation angles Φ are equal to {−20°, 0°, 20°}, respectively.
Crystals 13 00561 g003
Figure 4. The 2D IPs frames: the 4%-noise level (left) and the de-noised ones. The number U of the frames under the average (de-noised) and geometric (de-noised(*)) Means processing is equal to 100. The sample rotation angle Φ = 0°.
Crystals 13 00561 g004
Figure 5. Cross-sections of the true function f C t p d ( r r 0 ) (left). Cross-sections of the function f C t p d ( r r 0 ) : the Poisson-noise (middle) and noise-average (right) ones. The total number of the 2D Poisson-noise IPs frames U=100. The residual cross-section functions Δ f C t p d ( r r 0 ) obtained by subtraction of the true f C t p d ( r r 0 ) from the recovered ones are shown, as well.
Crystals 13 00561 g005
Table 1. The Coulomb-type point defect in crystal Si(111). The sample rotation angles Φi are in the range (−20°, 20°). The true vector 𝓟 ( t r u e ) = {1.50, 0.50, 1.80} is chosen for the Coulomb-type point defect. The start iteration vector 𝓟(start) = {1.70, 0.55, 1.40}. Total grid crystal sizes along the dimensionless coordinates (X, Y, Z) are equal to 61×61×21. The case of the Poisson-noise with the levels of 2% and 4% are considered. Note bene: Data in the two lines marked with asterisk (*) relate to the XRDT recovery processing by means of using the geometric means of the single 2D Poisson-noise IPs data frames.
Noise Level,
%
Number of 2D IPs Frames,
N
Number of Noise-Averaged Frames per One IP, U𝓟(k)(end) { 𝓟 ( k ) ( e n d ) }
× 10 5
  k ( e n d )
zero31(1.50;0.50;1.80)2.2 × 10−34.3 × 10−5
zero1011(1.50;0.50;1.80)1.7 × 10−32.9 × 10−5
231(1.59;0.49;1.66)0.50.11
21011(1.48;0.50;1.79)0.20.03
23100(1.51;0.50;1.81)0.10.01
2 (*)3 (*)100 (*)(1.48;0.50;1.77) (*)0.4 (*)0.08 (*)
431(2.04;0.51;2.18)1.10.23
41011(1.59;0.50;1.86)0.40.09
43100(1.54;0.50;1.83)0.30.04
4 (*)3 (*)100 (*)(1.45;0.50;1.84) (*)0.7 (*)0.16 (*)
Disclaimer/Publisher’s Note: The statements, opinions and data contained in all publications are solely those of the individual author(s) and contributor(s) and not of MDPI and/or the editor(s). MDPI and/or the editor(s) disclaim responsibility for any injury to people or property resulting from any ideas, methods, instructions or products referred to in the content.