


Early Detection of Damage of Inconel 718 with the Use of Strain-Hardening Cross-Effect


Abstract
1. Introduction
2. Theoretical Foundations of Research
2.1. Strain-Hardening Cross-Effect
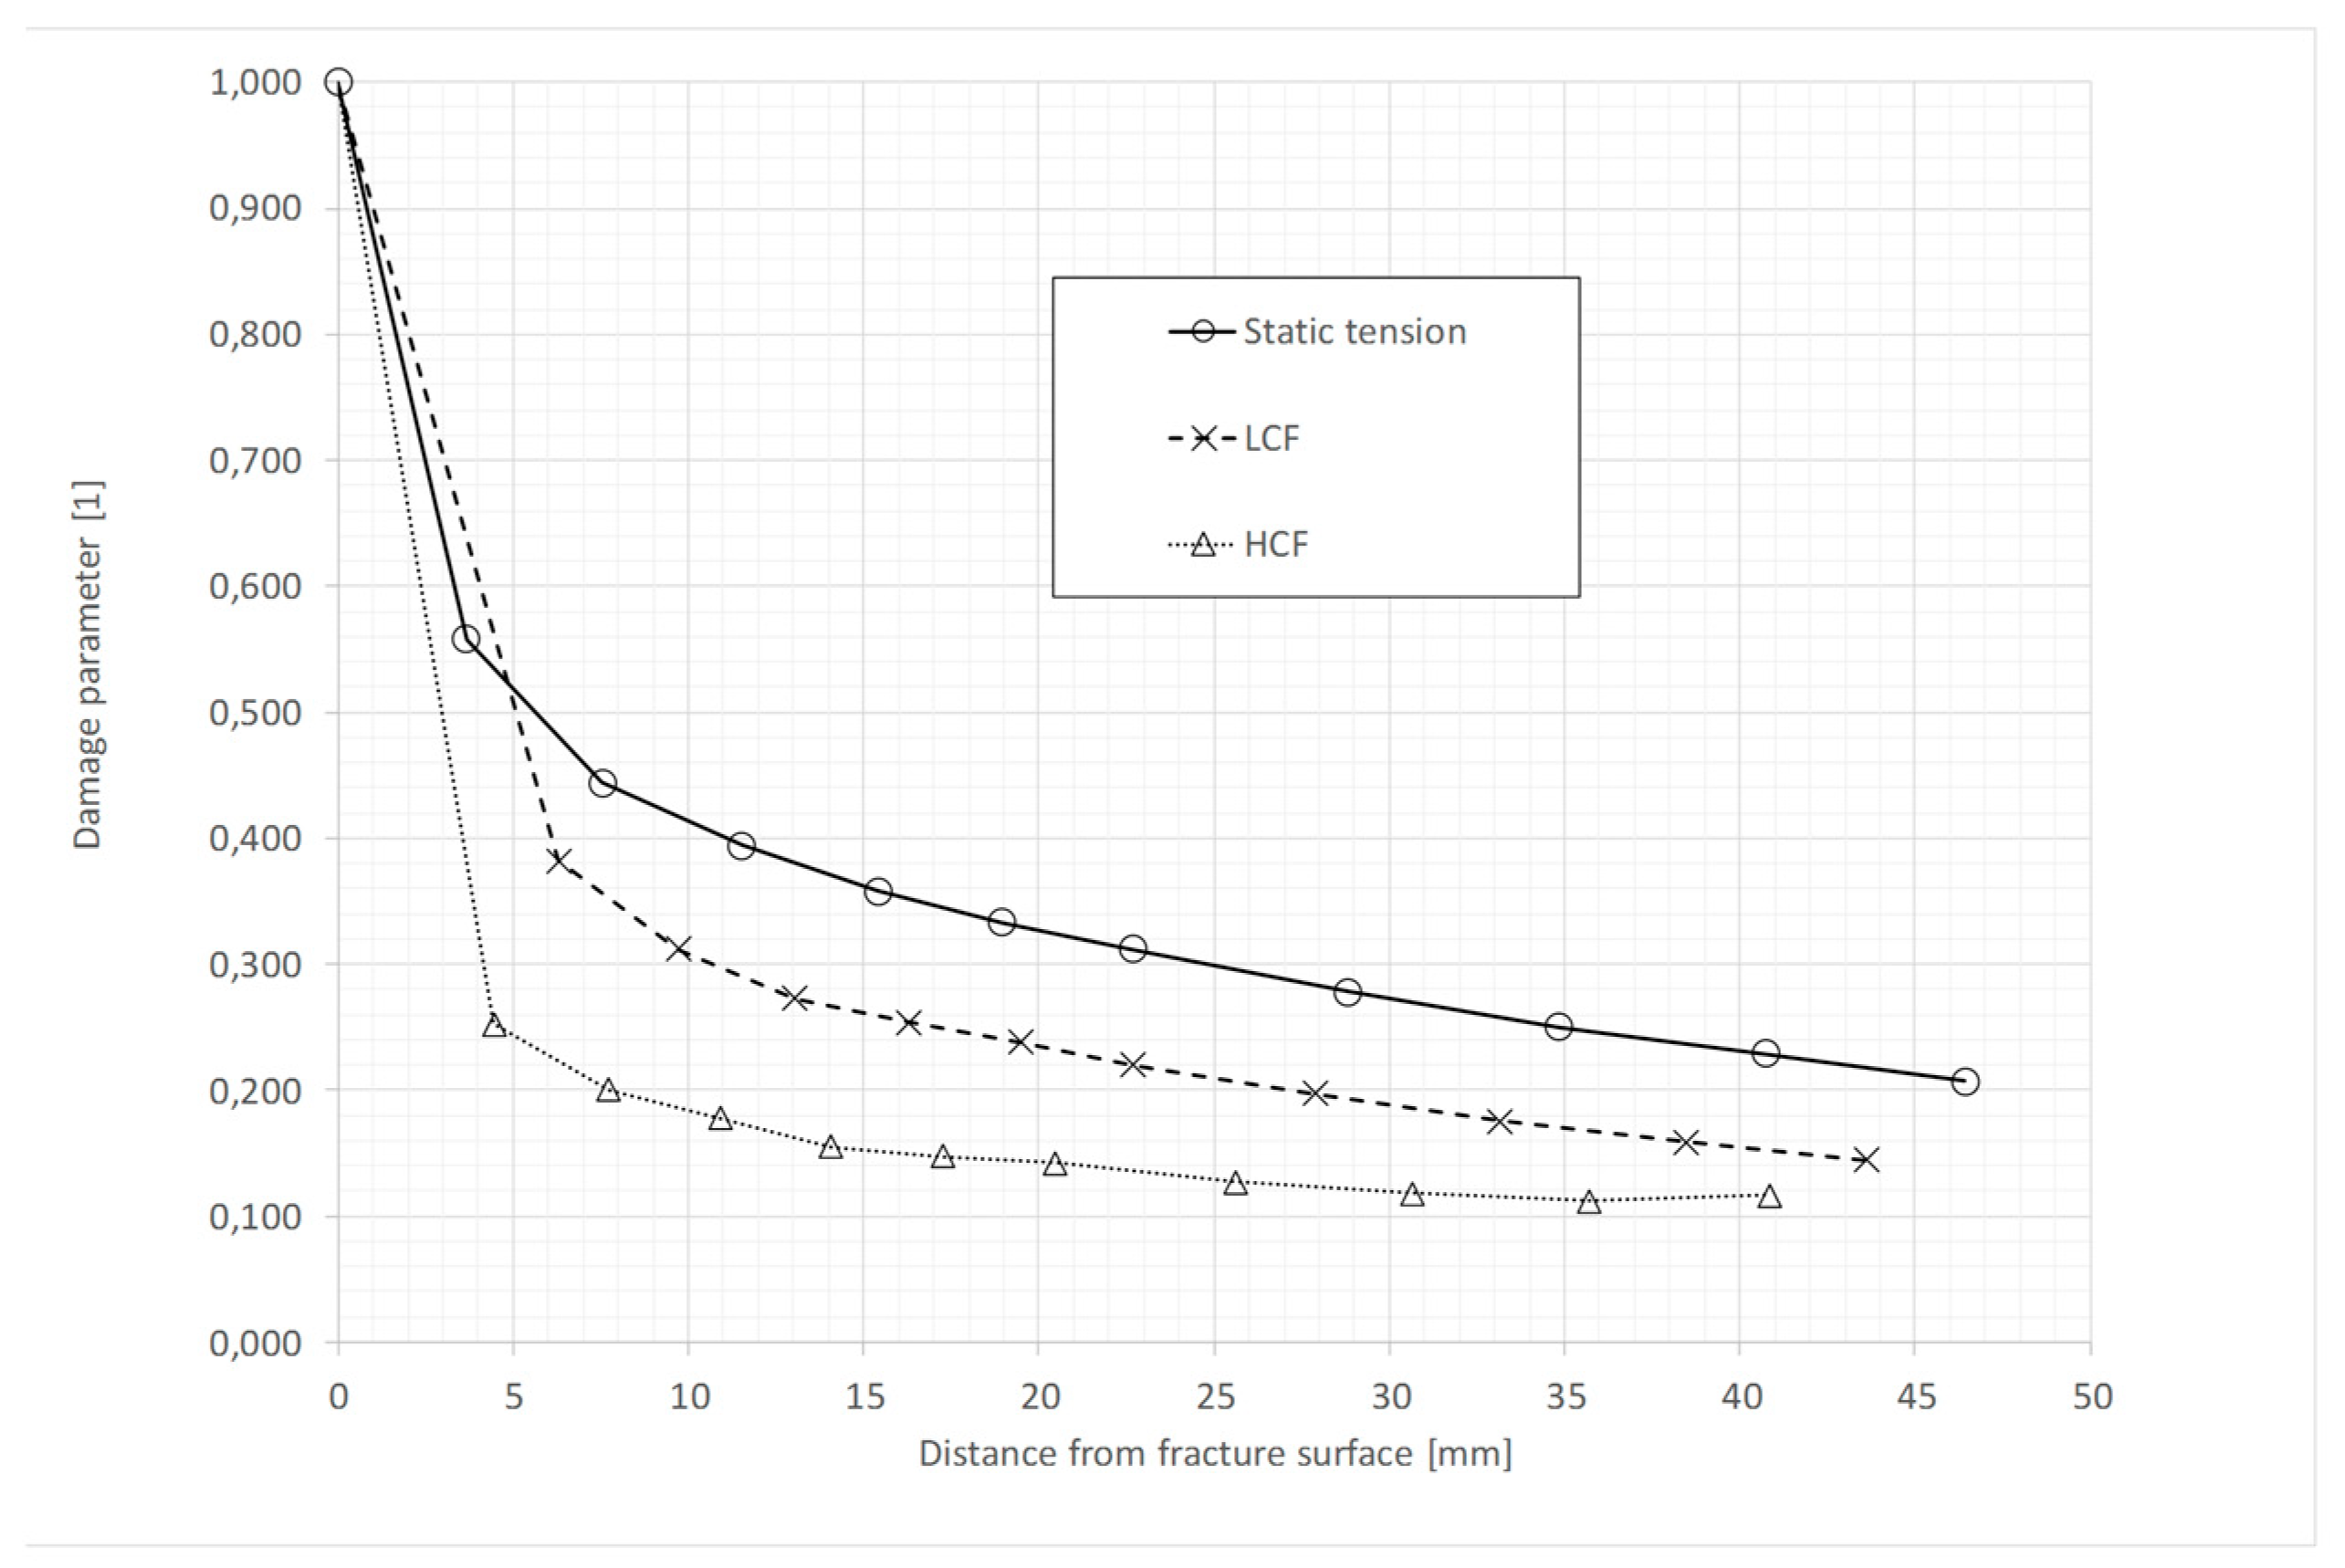
2.2. Damage Indicators and Damage Parameter
3. Materials and Methods
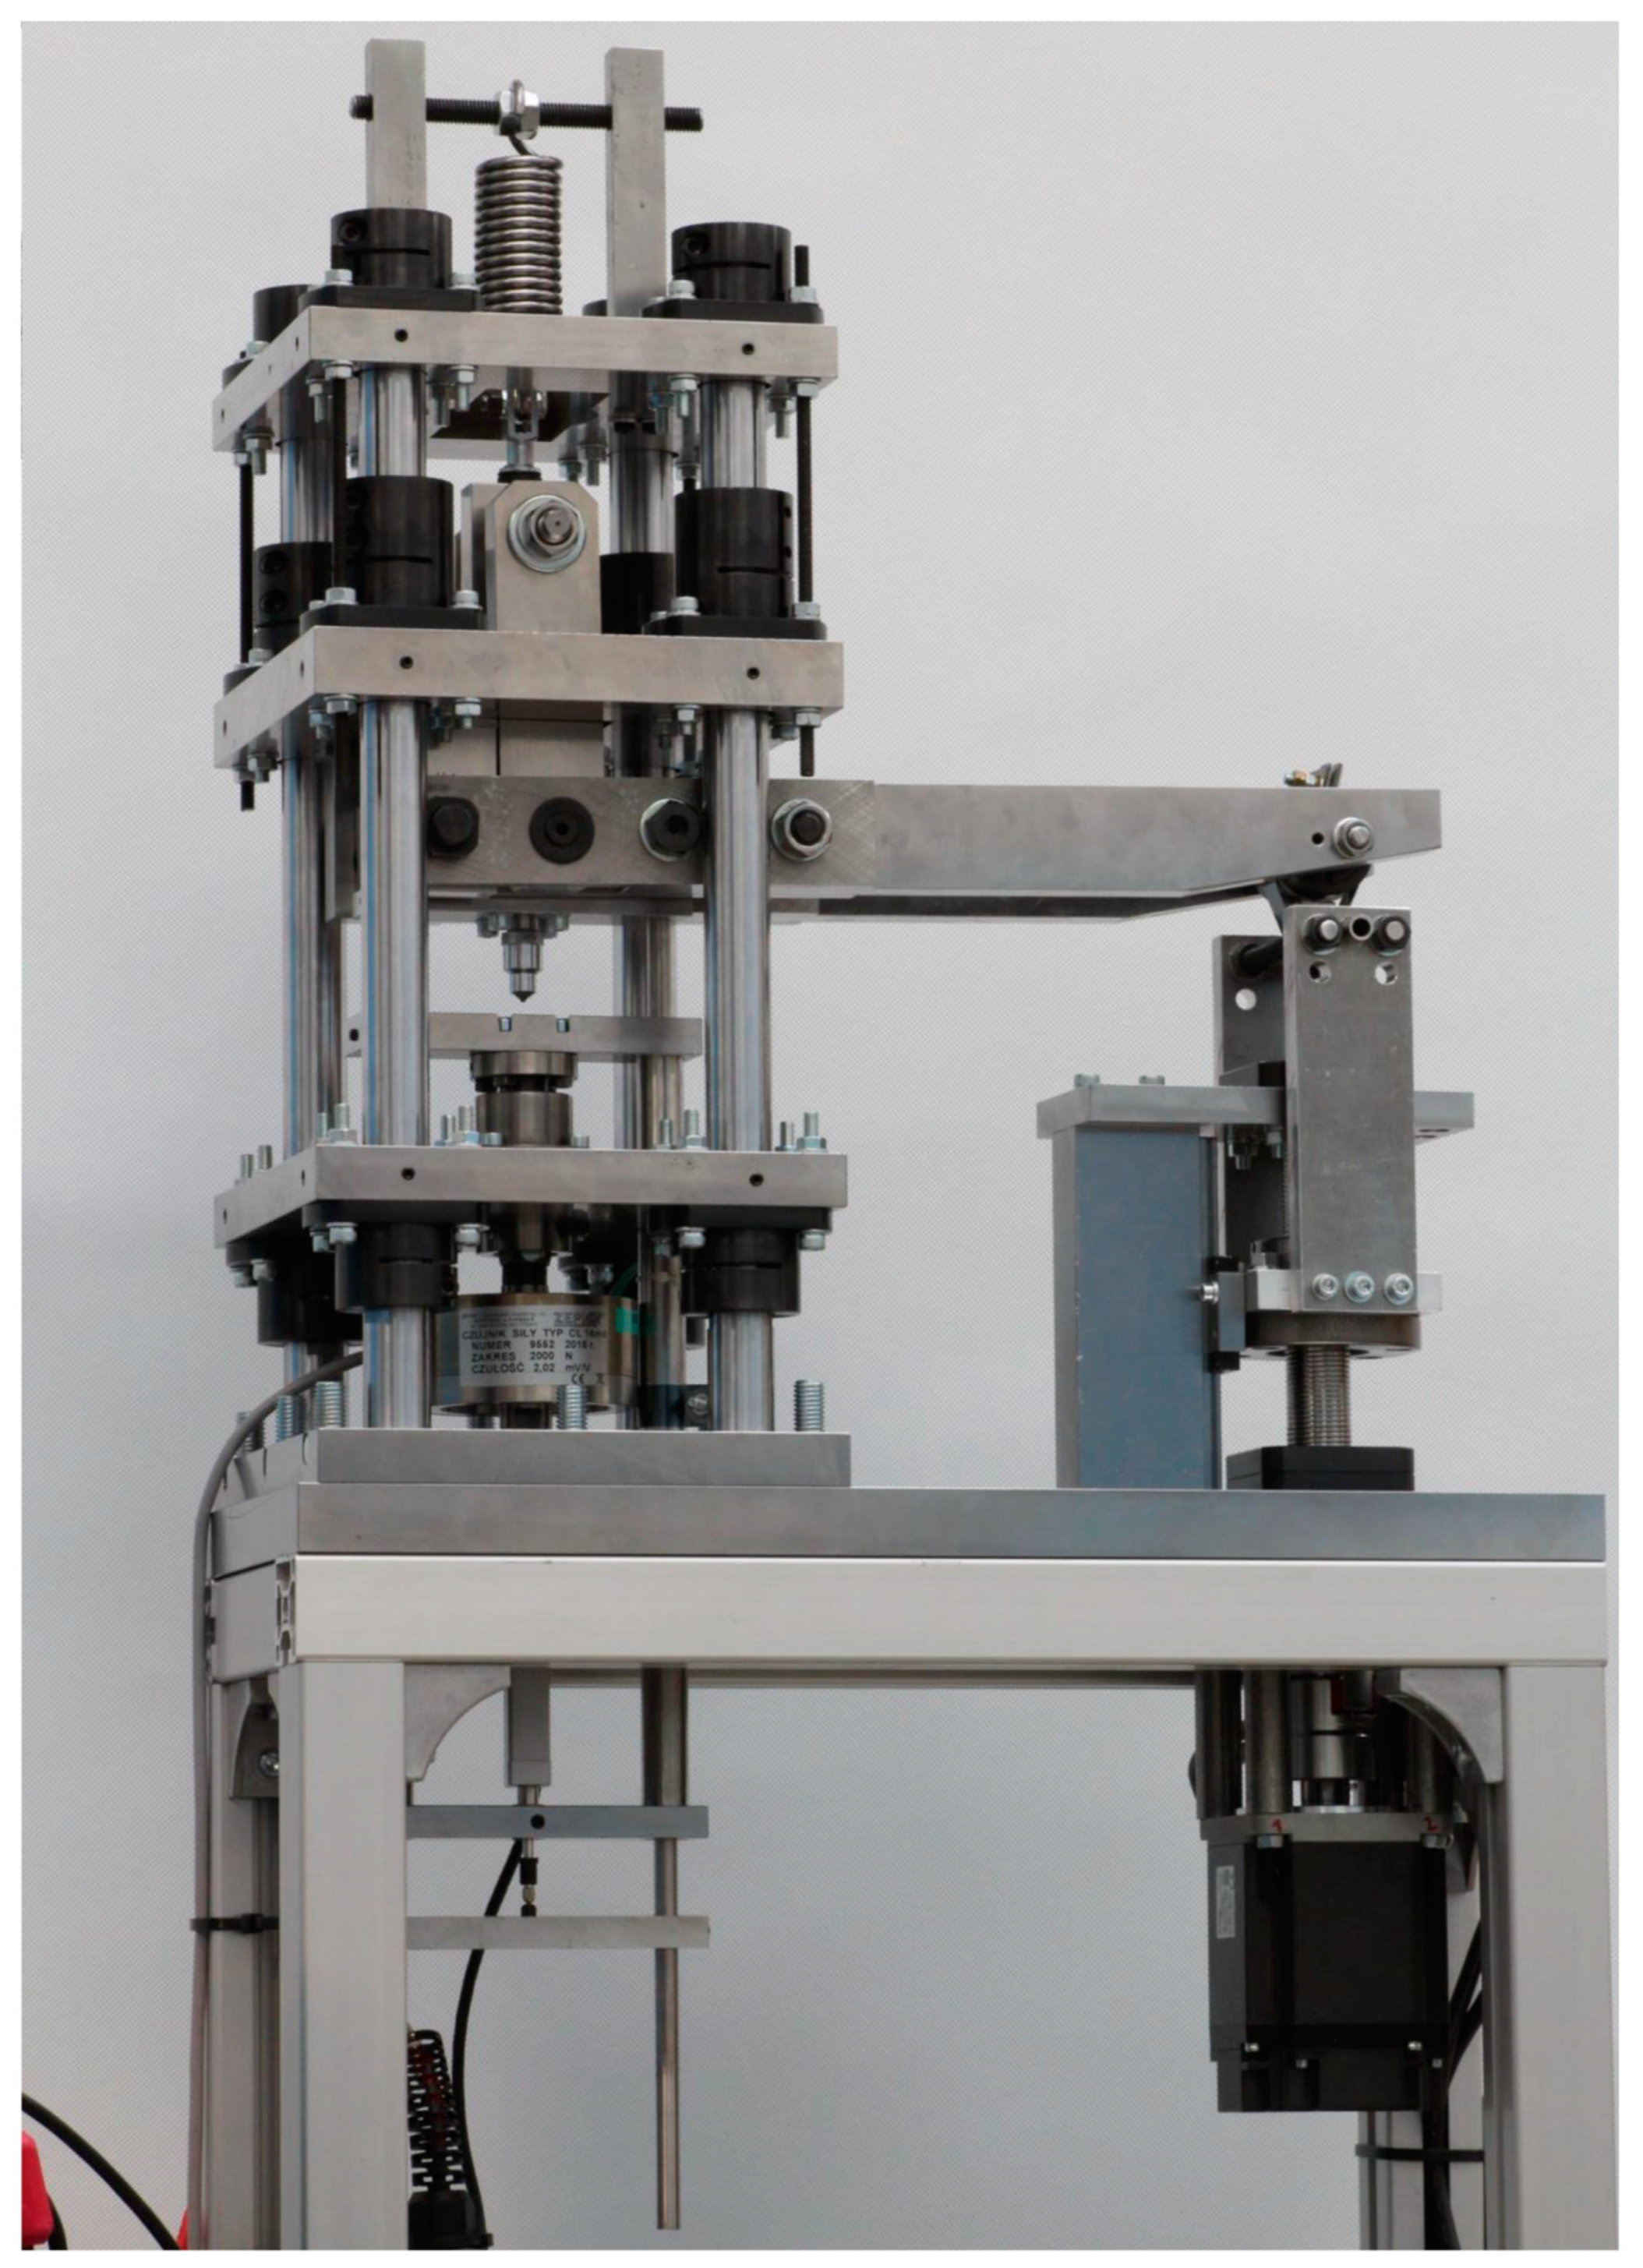
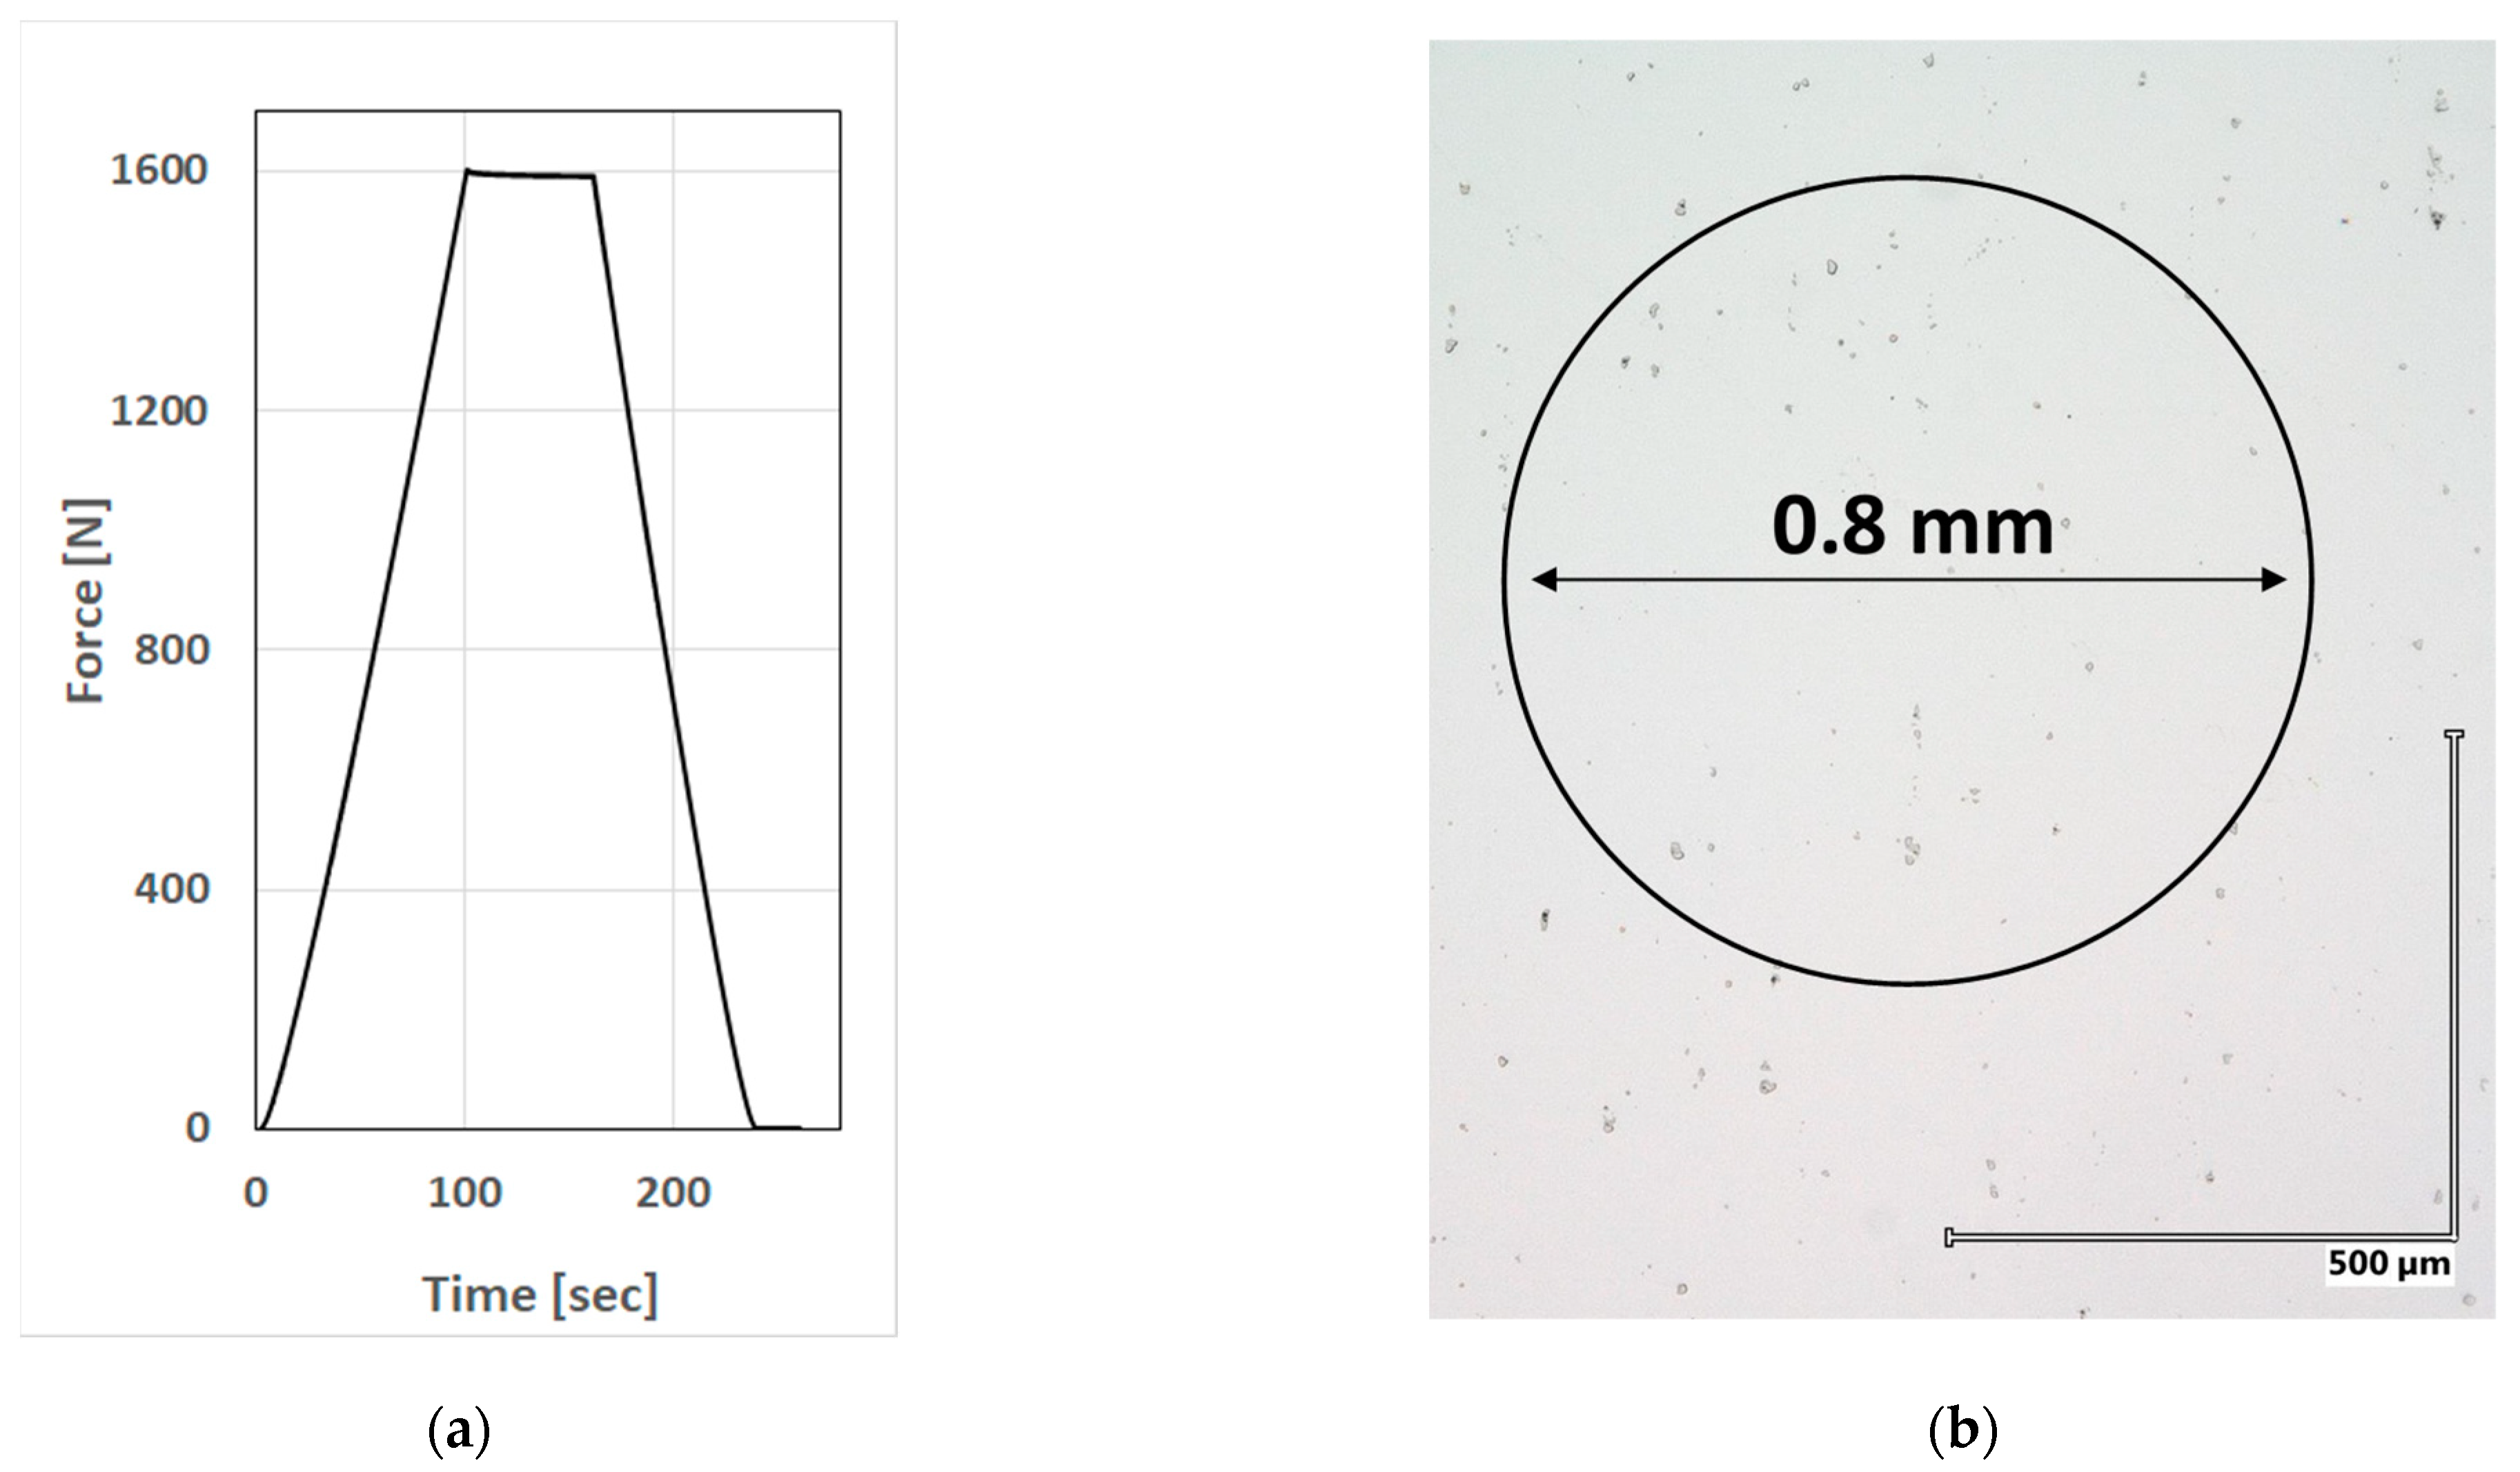
3.1. Equipment Used for Indentation Tests
3.2. Investigated Alloy
3.3. Experimental Program
4. Results and Discussion
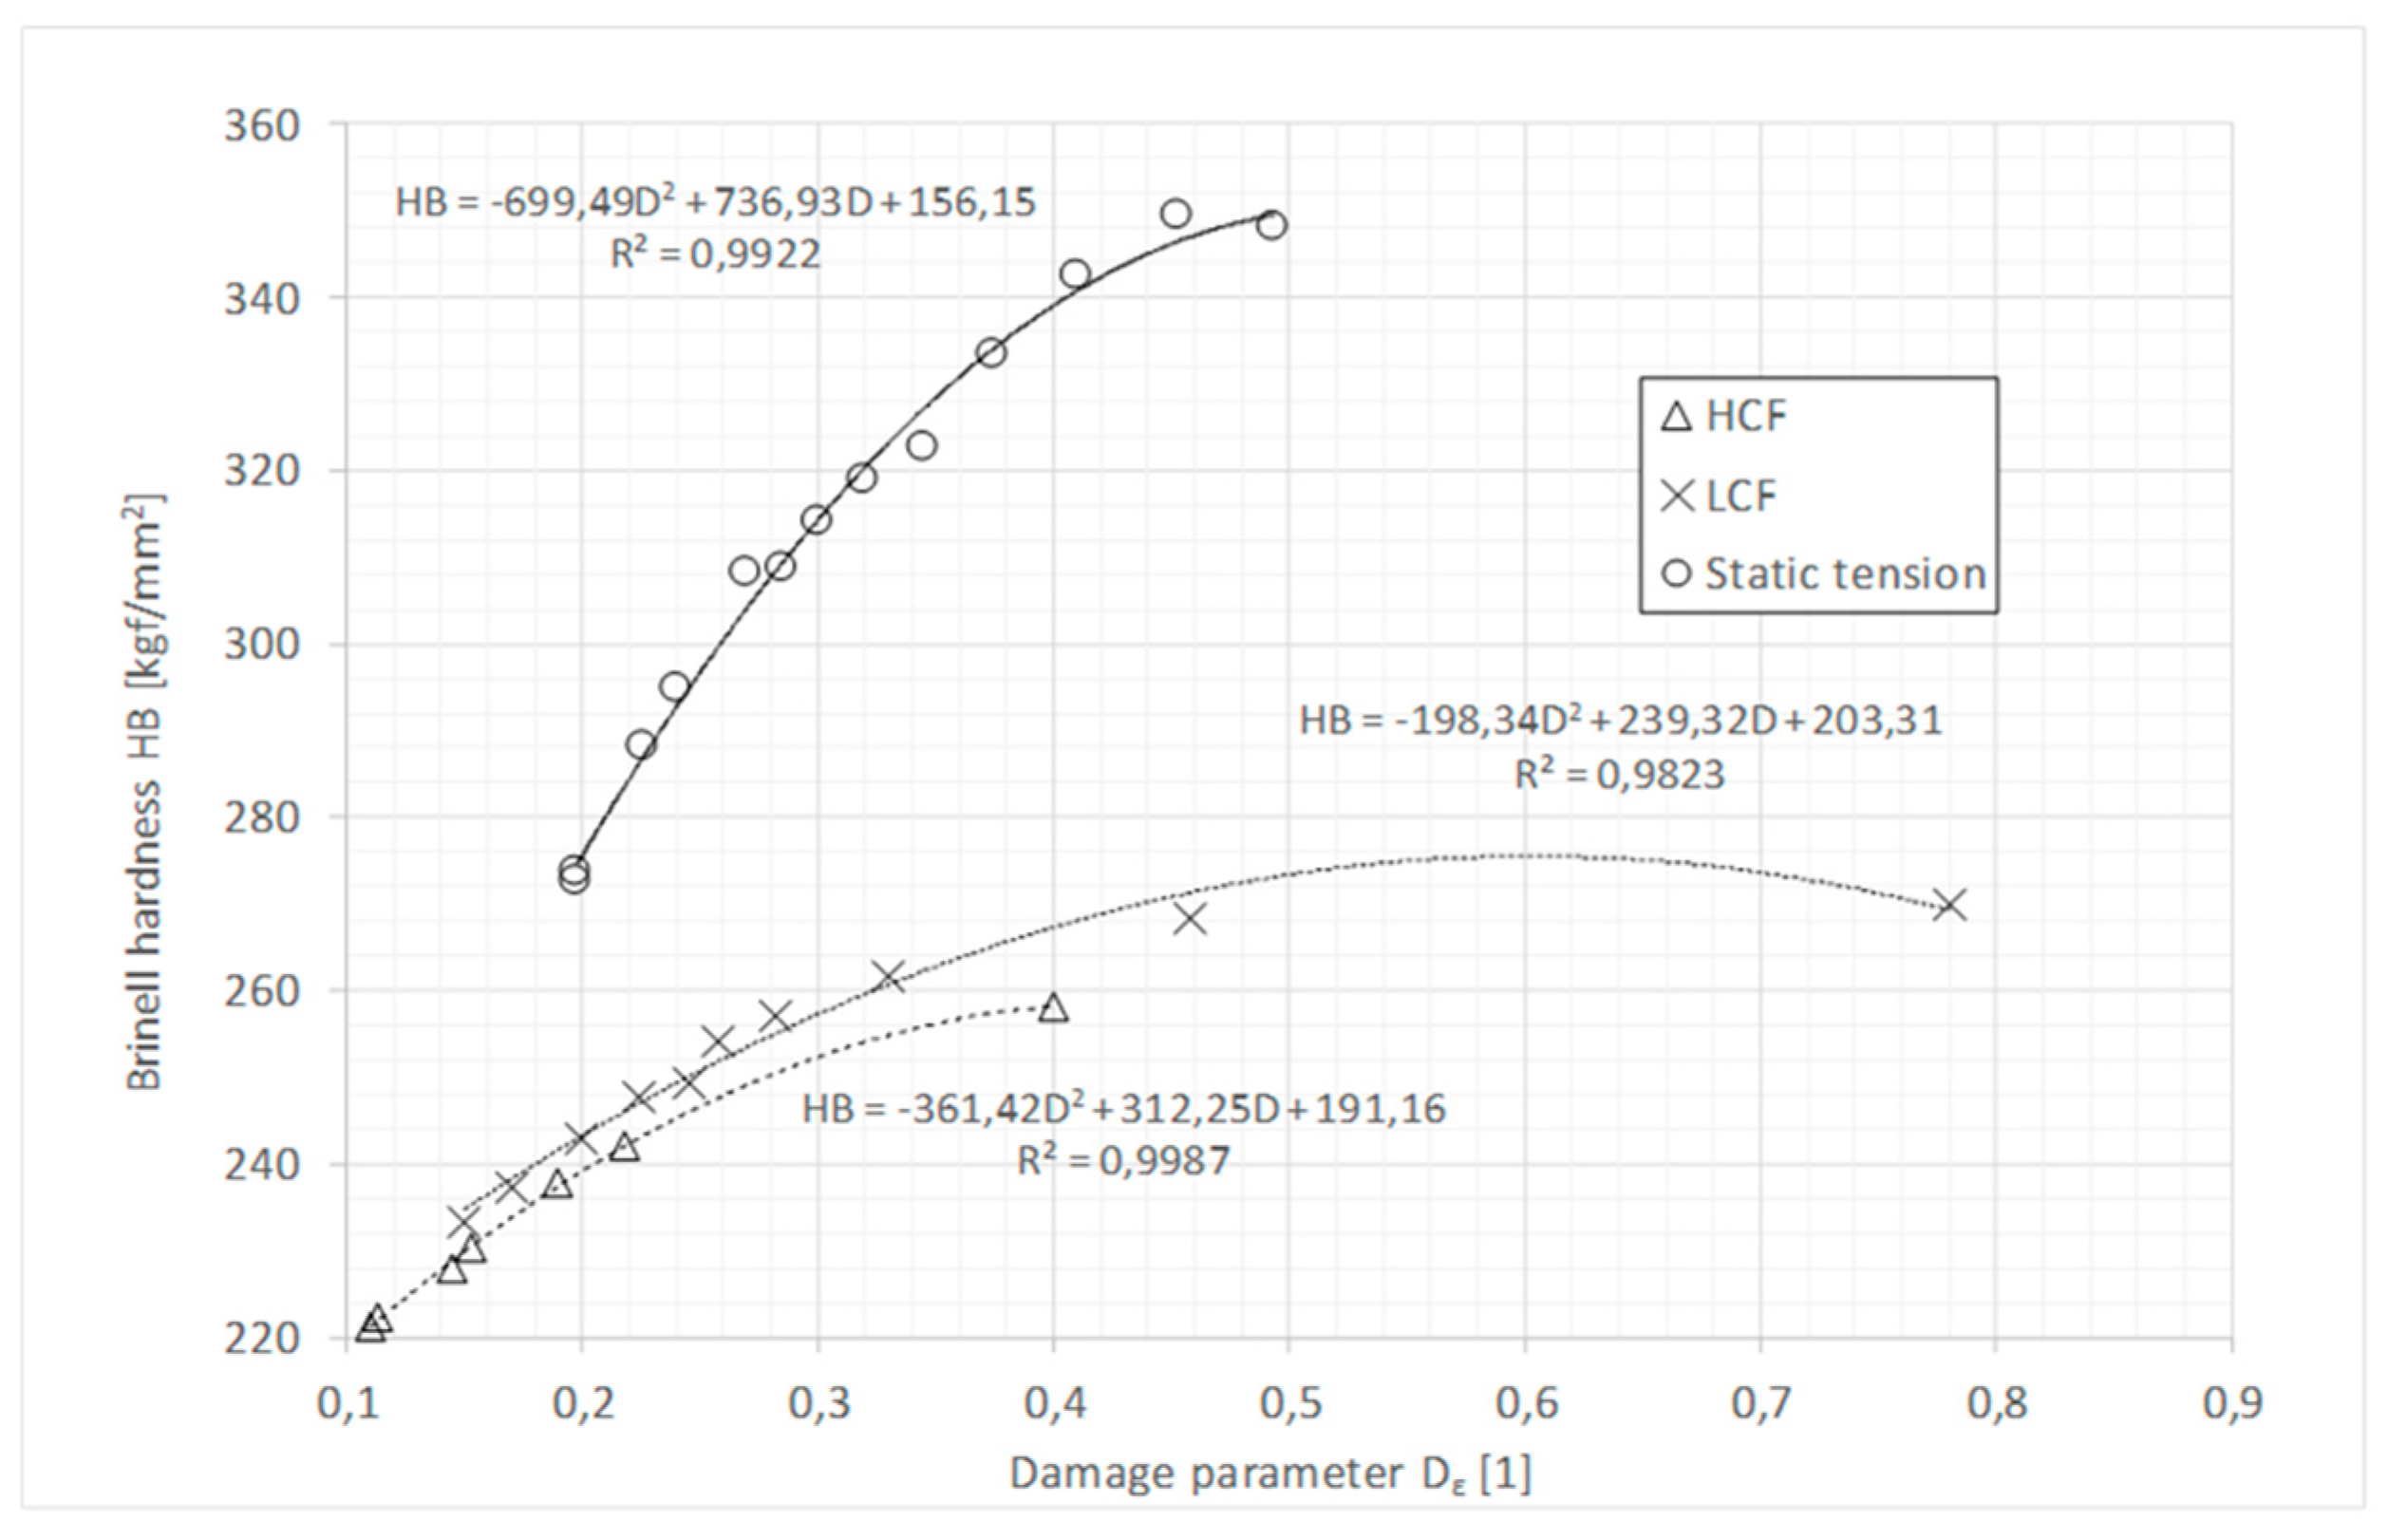
4.1. Hardness
4.2. Indentation Work
5. Conclusions
Author Contributions
Funding
Institutional Review Board Statement
Informed Consent Statement
Conflicts of Interest
References
- Gorkunov, E.S.; Smirnov, S.V.; Rodionowa, S.S. Influence of plastic deformation at hydrostatic pressure on damage and magnetic characteristics of low—Carbon steel 3sp. Phys. Mesomech. 2003, 6, 101–108. [Google Scholar]
- Socha, G. Experimental investigations of fatigue cracks nucleation, growth and coalescence in structural steel. Int. J. Fat. 2003, 25, 139–147. [Google Scholar] [CrossRef]
- Socha, G. Fatigue damage indicators based on plastic deformation. ASTM Spec. Tech. Publ. 2017, 1598, 246–257. [Google Scholar]
- Lemaitre, J. A Course on Damage Mechanics; Springer: Berlin/Heidelberg, Germany, 1996. [Google Scholar]
- Yang, L.; Fatemi, A. Cumulative Fatigue Damage Mechanisms and Quantifying Parameters: A Literature Review. J. Test. Eval. 1998, 26, 89–100. [Google Scholar]
- Krysztofik, J.; Kukla, D.; Manaj, W.; Socha, G. Evaluation of damage degree of Inconel 718 alloy with the use of non-destructive methods. Russ. J. Nondestruct. Test. 2019, 55, 299–307. [Google Scholar] [CrossRef]
- Socha, G.; Madejski, B.; Malicki, M. Study on deformation-induced damage evolution for Inconel718 superalloy with the use of an innovative single-specimen method. J. Theor. Appl. Mech. 2016, 54, 1379–1390. [Google Scholar] [CrossRef]
- Socha, G.; Dietrich, L. Accumulation of damage in A336 GR5 structural steel subject to complex stress loading. Strain 2012, 48, 279–285. [Google Scholar]
- Socha, G.; Dietrich, L. A fatigue damage indicator parameter for P91 chromium-molybdenum alloy steel and fatigue pre-damaged P54T carbon steel. Fatigue Fract. Engng. Mater. Struct. 2014, 37, 195–205. [Google Scholar] [CrossRef]
- Mair, W.M.; Pugh, H. Effect of pre-strain on yield surfaces in copper. J. Mech. Eng. Sci. 1954, 6, 150–163. [Google Scholar] [CrossRef]
- Rogan, J.; Shelton, A. Effect of pre-stress on the yield and flow of En 25 steel. J. Strain Anal. 1969, 4, 138–160. [Google Scholar] [CrossRef]
- Johnson, G.R. Materials Characterization for computations involving severe dynamic loading. In Proceedings of the Army Symposium on Solid Mechanics, Cape Cod, MA, USA, 30 September–2 October 1980; pp. 62–67. [Google Scholar]
- Odqvist, F.K.G. Die Verfestigung von flusseisenaehlichen Koerpern. ZAMM 1933, 13, 360–363. [Google Scholar] [CrossRef]
- Hill, R. The Mathematical Theory of Plasticity; Clarendon Press: Oxford, UK, 1956. [Google Scholar]
- Socha, G.; Madejski, B.; Krysztofik, J.; Czarnewicz, S. Method for testing the damage of material structure caused by permanent deformation of the specimen subjected to tensile test and the specimen for testing the damage of material structure. Patent 409294, 2014. [Google Scholar]
- ASTM E10-15; Standard Test Method for Brinell Hardness of Metallic Materials. ASTM Standards: West Conshohocken, PA, USA, 2019.
- Socha, G. Changes of the yield condition due to accumulation of damage of metal alloys. Eng. Trans. 2008, 56, 227–245. [Google Scholar]
- Hancock, J.W.; Mackenzie, A.C. On the mechanisms of ductile failure in high-strength steels subjected to multi-axial stress-states. J. Mech. Phys. Solids 1976, 24, 147–169. [Google Scholar] [CrossRef]
- Socha, G. Calibration of Failure Criteria for Additively Manufactured Metallic Materials. Materials 2021, 14, 3442. [Google Scholar] [CrossRef] [PubMed]
- EN ISO 14577-1:2015; Metallic materials—Instrumented indentation test for hardness and materials parameters—Part 1: Test method. ISO: Geneva, Switzerland, 2015.
- He, X.; Liu, Z.; Ripley, L.B.; Swensen, V.L.; Kim, S.H. Empirical relationship between interfacial shear stress and contact pressure in micro- and macro-scale friction. Tribol. Int. 2021, 155, 106780. [Google Scholar] [CrossRef]
- Tabor, T. The Hardness of Metals; Department of Physical Chemistry: Cambridge, UK, 1951. [Google Scholar]
- Oliver, W.C.; Pharr, G.M. Measurement of hardness and elastic modulus by instrumented indentation: Advances in understanding and refinements to methodology. J. Mater. Res. 2004, 19, 3–20. [Google Scholar] [CrossRef]


| C | Mn | P | S | Si | Cr | Ni | Al |
| 0.05 | 0.01 | 0.008 | 0.0002 | 0.10 | 17.98 | 52.30 | 0.60 |
| Mo | Cu | Nb | Ta | Ti | Co | B | Fe |
| 2.88 | 0.02 | 4.97 | 0.01 | 1.02 | 0.04 | 0.002 | 19.96 |
Disclaimer/Publisher’s Note: The statements, opinions and data contained in all publications are solely those of the individual author(s) and contributor(s) and not of MDPI and/or the editor(s). MDPI and/or the editor(s) disclaim responsibility for any injury to people or property resulting from any ideas, methods, instructions or products referred to in the content. |
© 2023 by the authors. Licensee MDPI, Basel, Switzerland. This article is an open access article distributed under the terms and conditions of the Creative Commons Attribution (CC BY) license (https://creativecommons.org/licenses/by/4.0/).
Share and Cite
Socha, G.; Malicki, M. Early Detection of Damage of Inconel 718 with the Use of Strain-Hardening Cross-Effect. Crystals 2023, 13, 429. https://doi.org/10.3390/cryst13030429
Socha G, Malicki M. Early Detection of Damage of Inconel 718 with the Use of Strain-Hardening Cross-Effect. Crystals. 2023; 13(3):429. https://doi.org/10.3390/cryst13030429
Chicago/Turabian StyleSocha, Grzegorz, and Maciej Malicki. 2023. "Early Detection of Damage of Inconel 718 with the Use of Strain-Hardening Cross-Effect" Crystals 13, no. 3: 429. https://doi.org/10.3390/cryst13030429
APA StyleSocha, G., & Malicki, M. (2023). Early Detection of Damage of Inconel 718 with the Use of Strain-Hardening Cross-Effect. Crystals, 13(3), 429. https://doi.org/10.3390/cryst13030429