Article

Assessment of Joinability in Additively Manufactured Interlocking Structures

1
Materials Science and Engineering, Pusan National University, Busan 43241, Republic of Korea
2
Department of 3D Printing Materials, Korea Institute of Materials Science, Changwon 51508, Republic of Korea
3
Department of 3D Printing, Korea Institute of Machinery & Materials, Daejeon 34103, Republic of Korea
4
Department of Materials Analysis, Korea Institute of Materials Science, Changwon 51508, Republic of Korea
5
Department of Materials Science and Engineering, Dong-A University, Busan 49315, Republic of Korea
*
Authors to whom correspondence should be addressed.
Crystals 2023, 13(11), 1575; https://doi.org/10.3390/cryst13111575
Submission received: 23 September 2023 / Revised: 28 October 2023 / Accepted: 31 October 2023 / Published: 8 November 2023
(This article belongs to the Special Issue Additive Manufacturing of Alloys via Laser-Based Techniques)

Abstract

:
This study investigates the challenges of additively manufactured interlocking structures, emphasizing joinability issues due to thermal deformation. These challenges become pronounced when fabricating high-density structures without fully interconnected layers, a trait common in soft magnetic materials. Here, a detailed analysis assessing deformation concerning pin thickness and build orientation in a representative interlocking model is performed. Utilizing stress and thermal simulations of the additive manufacturing process, it is shown that a compensated design considerably enhances the joinability of these structures. These findings offer valuable perspectives for advancing the design of additive manufacturing components, particularly in soft magnetic materials such as electric motor stators, which require both insulation and density.

1. Introduction

Additive manufacturing (AM), also known as 3D printing, was initially developed to cater to the intricate fabrication demands posed by 3D design models [1,2,3]. In its early years, the primary application of AM was in the realm of prototyping. However, recent advances and the broader acceptance of the technology have produced a significant shift, with AM increasingly being employed for full-fledged production purposes [4,5,6,7,8]. Concurrently, the “Design for AM” strategy has been gaining momentum, underscoring its potential to minimize the number of parts and expedite the assembly process, leading to increased efficiency [9,10,11].
As the scope of AM continues to expand, there is a growing need for advanced joint structures adept at linking multiple printed components [12,13,14,15,16,17]. These specialized joint structures should manage high aspect ratios of linking parts and seamlessly integrate multiple materials to enhance the materials’ properties. Such versatility is essential for meeting specialized demands, such as enhanced damage tolerance or the mitigation of core losses, ensuring that the assembled structure functions optimally in various applications [18,19].
In contrast to traditional manufacturing methodologies, there remains little research or well-established practices that focus exclusively on the joinability of metal parts produced through AM. Several factors play into this, with surface roughness and thermal distortion being predominant influences on the quality of the resultant joints [12,20]. For example, during the process of fabricating structurally layered soft magnetic Fe-Si components, insufficient air gaps increase the risk of parts unintentionally adhering to each other due to their close proximity [21]. Shape optimization techniques can help overcome these challenges, ensuring minimized core loss and optimizing the final product’s performance [21,22,23]. Nevertheless, constraints related to wall thickness remain a significant hurdle, especially in high-density additive manufacturing. The current wave of research in the field is geared towards enhancing bonding mechanisms, pioneering new material integrations, and pushing the frontiers of AM technologies to counteract these challenges [24].
It is an acknowledged fact in the AM community that the generation of thermal stress and its subsequent relaxation are intrinsically linked to the direction in which the AM process operates. As such, carefully considering the direction of stacking is critical when seeking to fabricate products that exhibit minimal thermal distortion [25,26,27]. A case in point is the finger-joint shape, which is formed by the interlocking of thin plates. This particular joint configuration is particularly vulnerable to thermal distortions [28]. However, the finger-joint shape also dramatically reduces eddy currents when layered within stacks of soft magnetic materials. This inherent quality improves the power efficiency of the electromagnet, making it valuable in specific applications.
This study examines the experimental fabrication of interlocking joints of varying thicknesses using SUS 17-4PH powder( SUS 17-4PH, Koswire Co, Busan, Republic of Korea), a material selected for its high strength, fracture toughness, heat treatment capabilities, outstanding welding characteristics, and corrosion resistance [29,30,31]. The effectiveness and dependability of these joints are assessed via additive-manufacturing simulations.

2. Materials and Methods

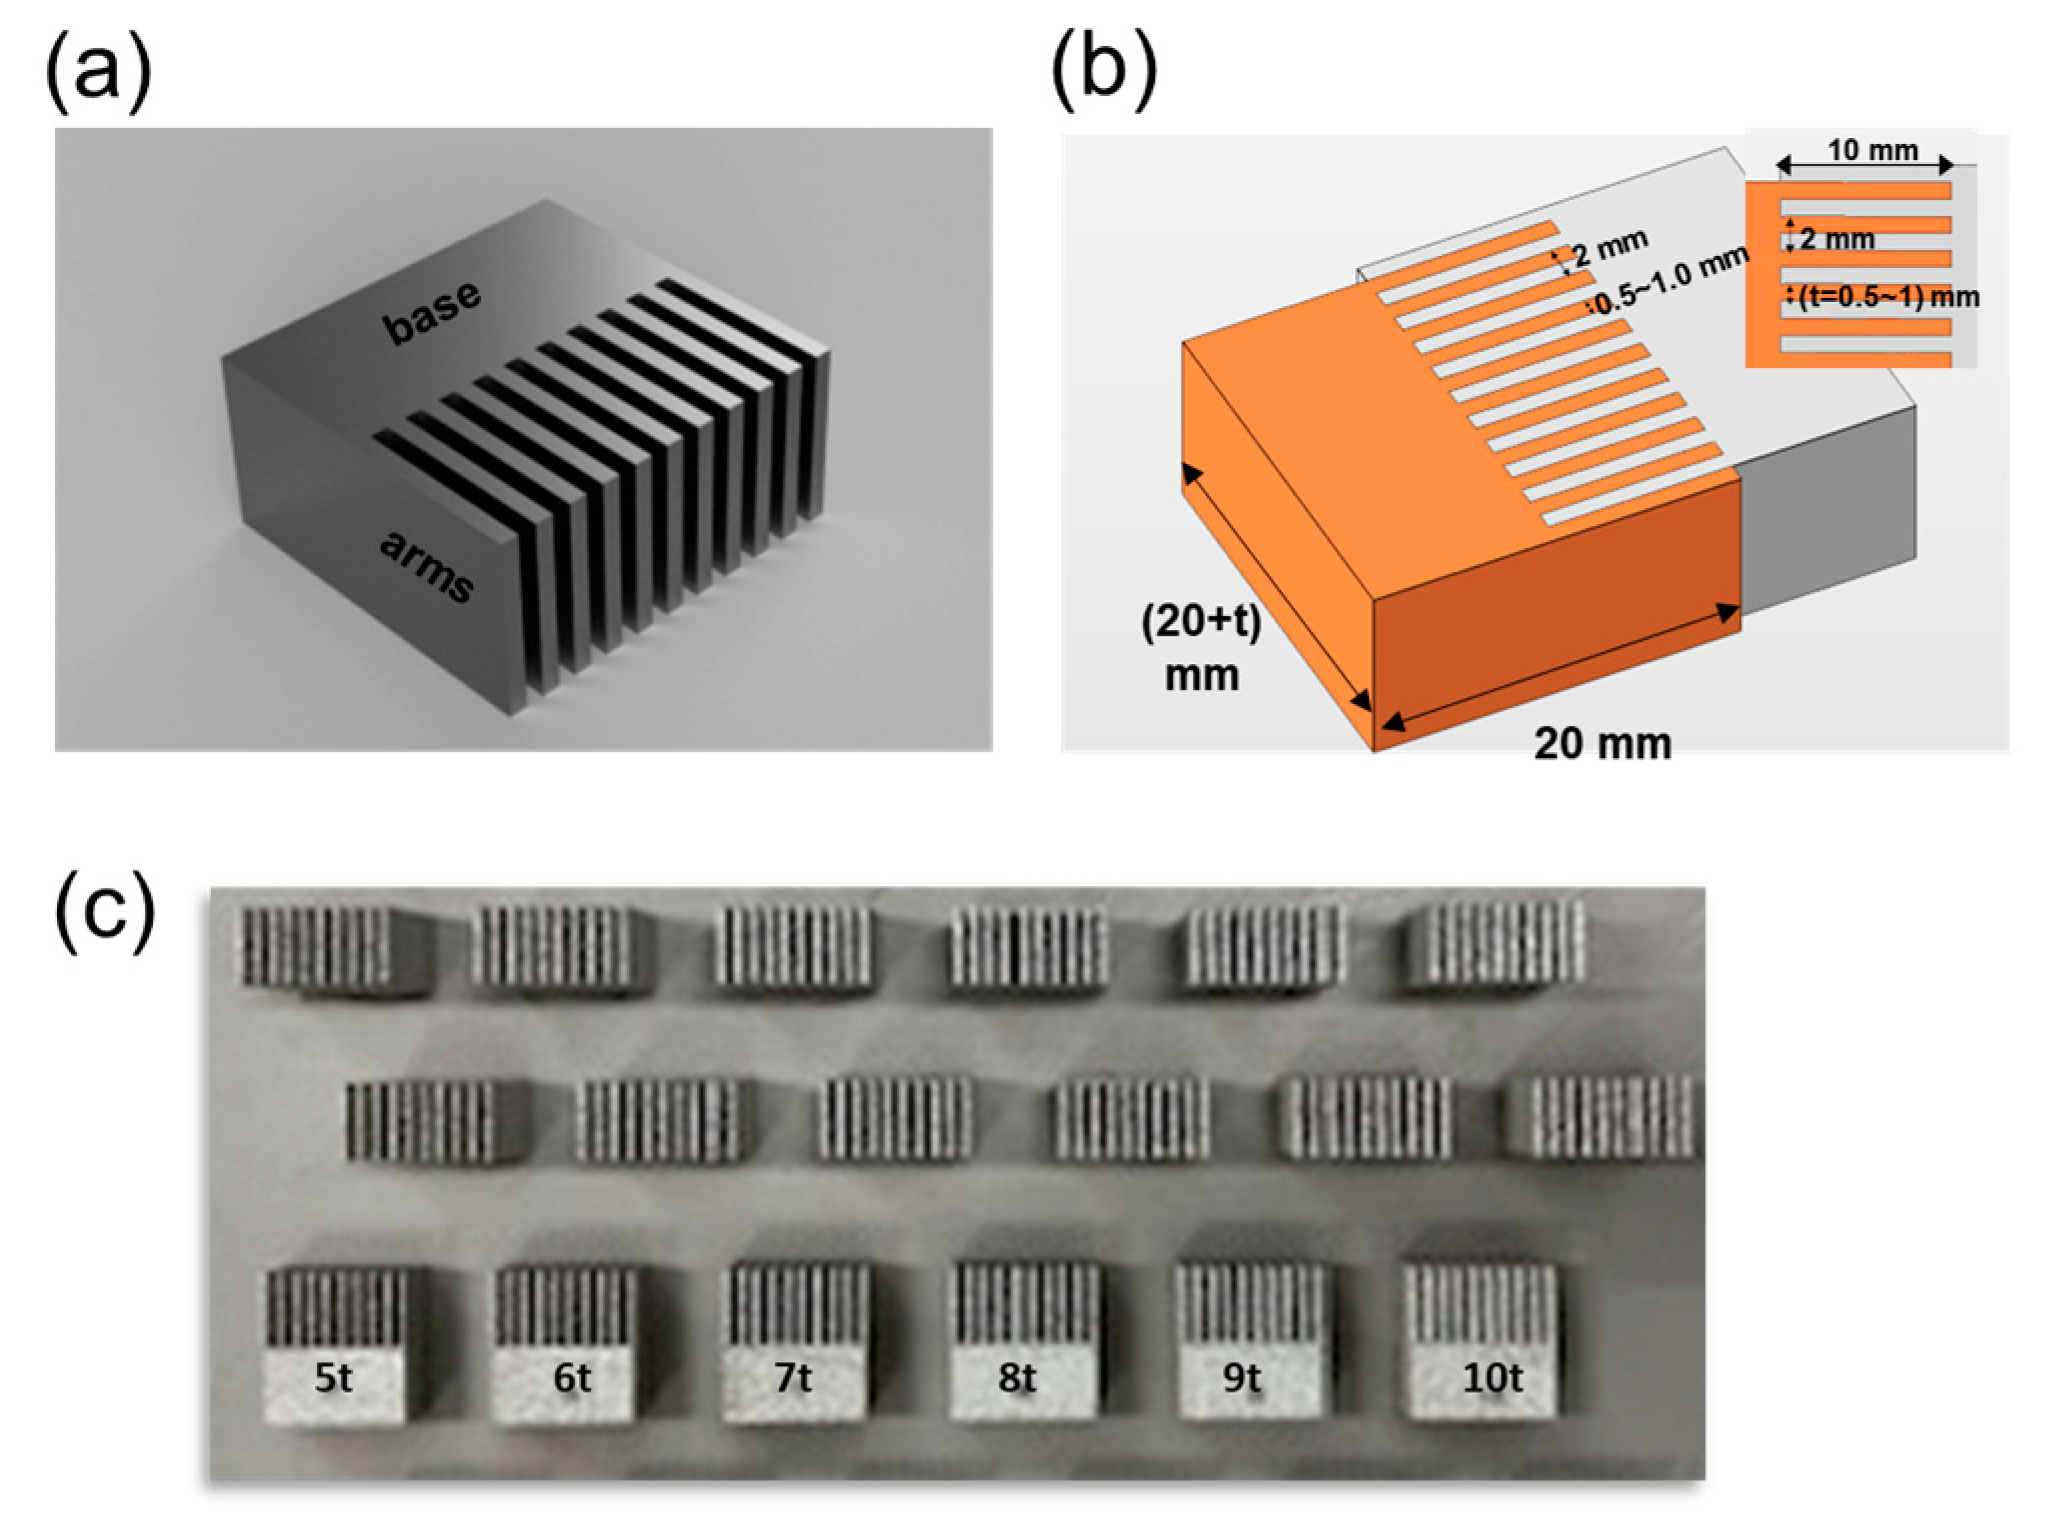
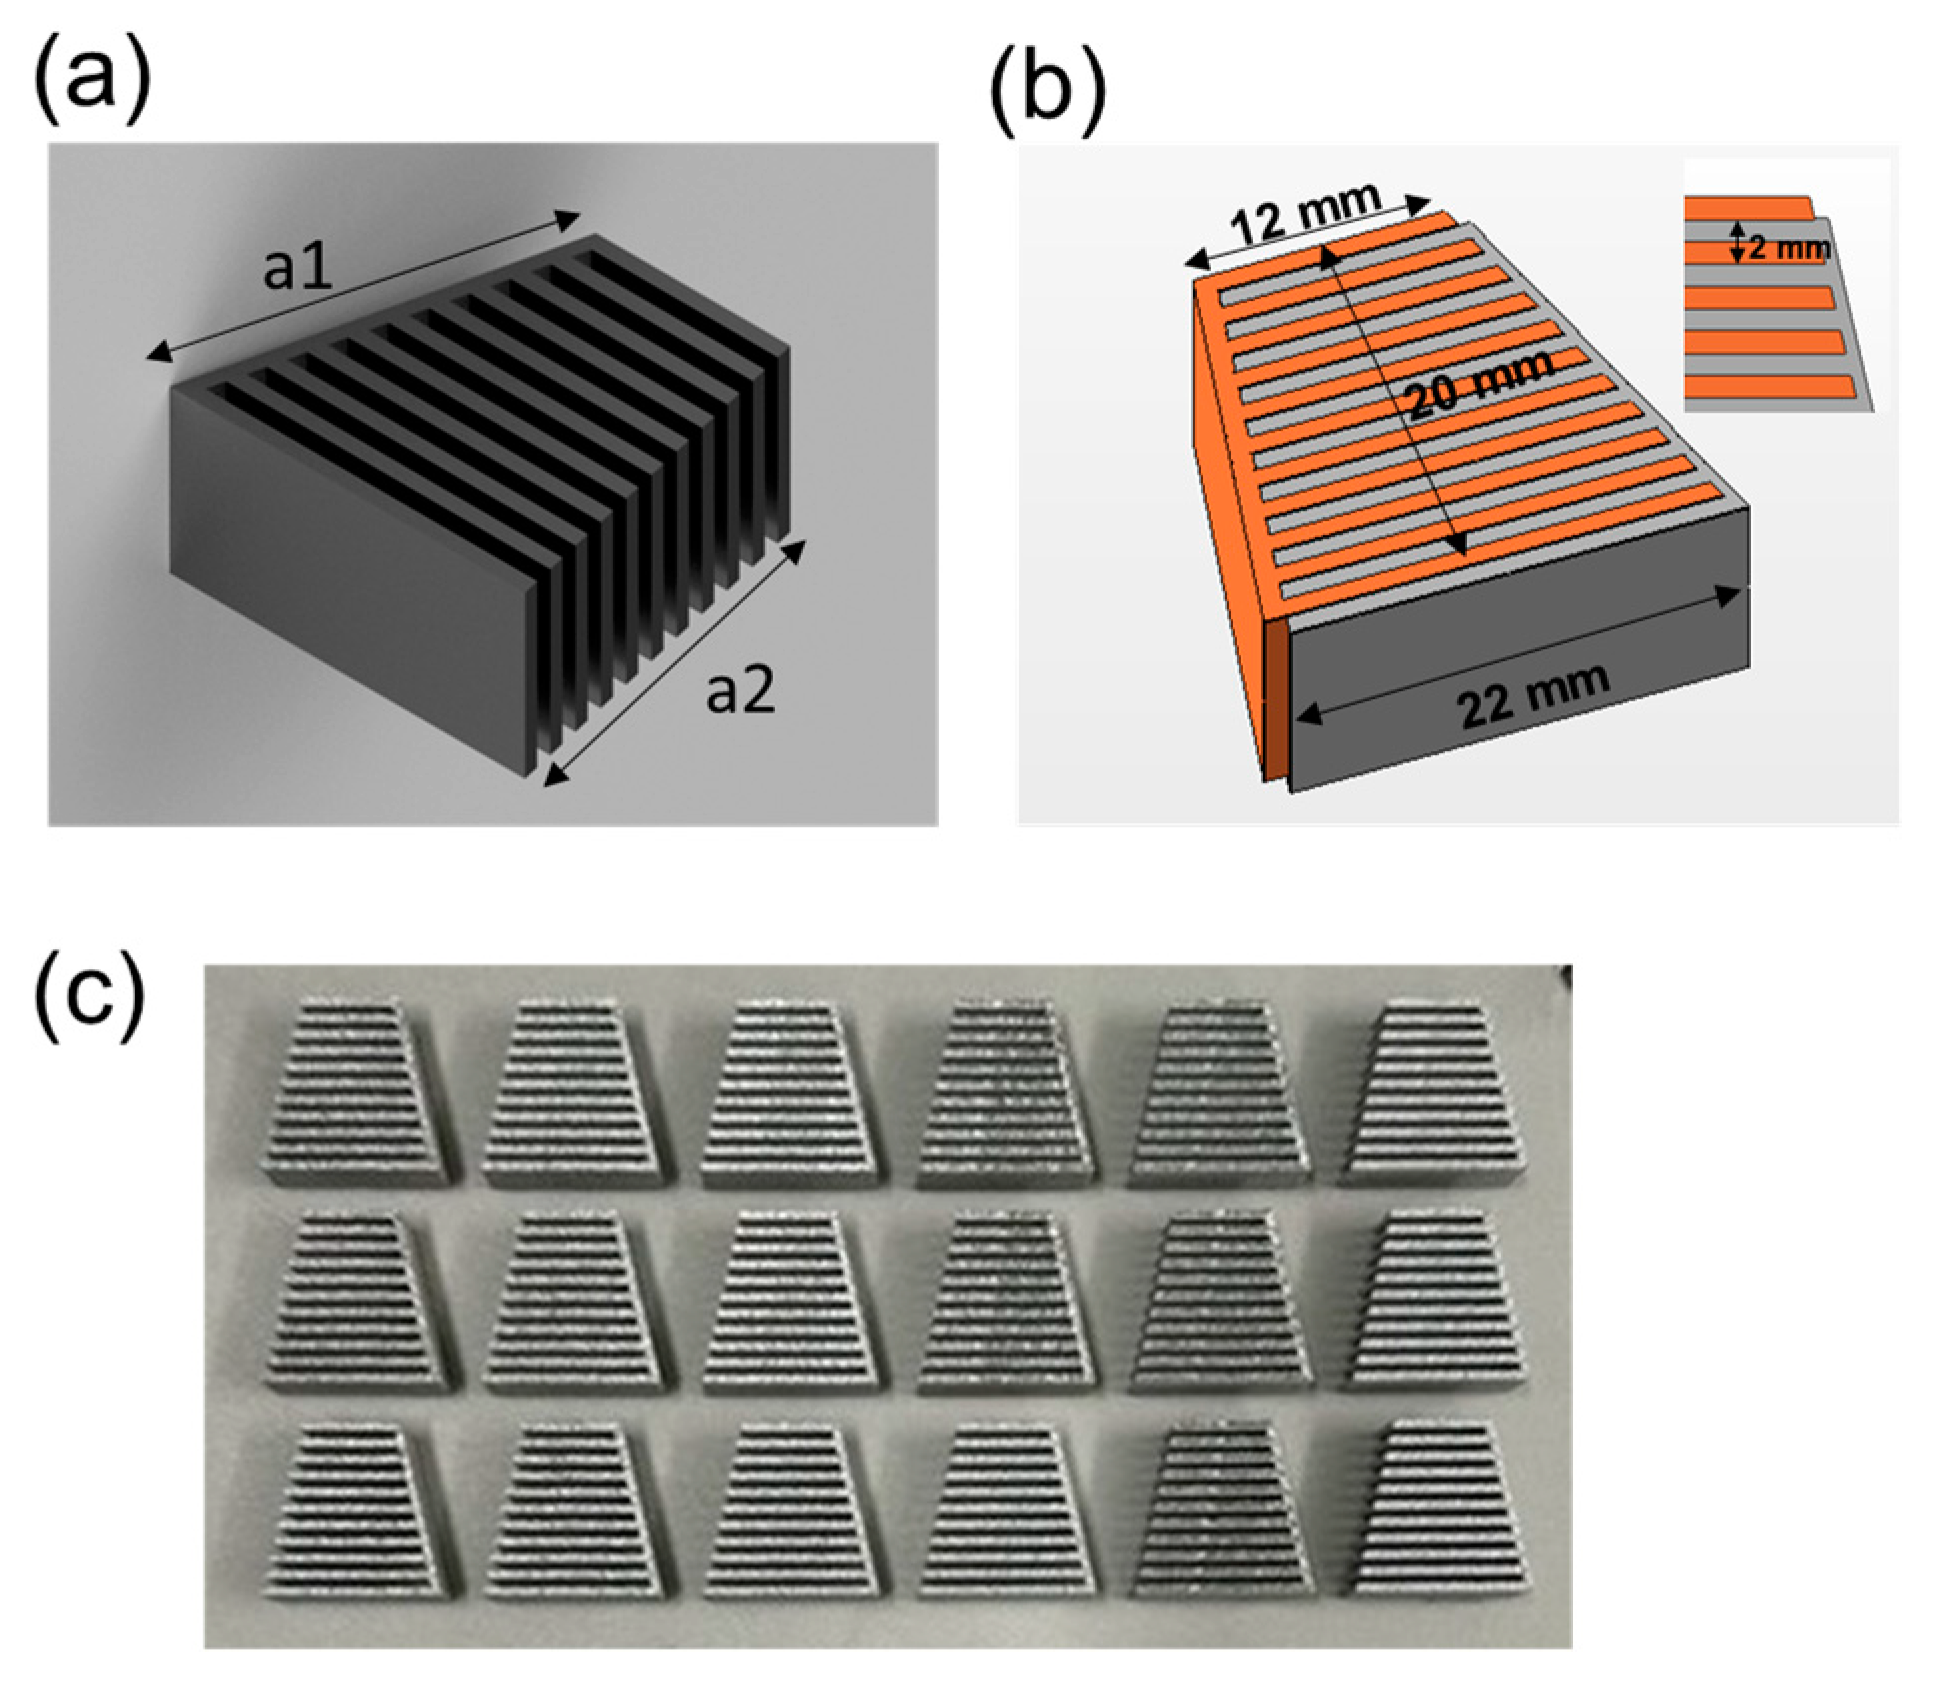
2.1. Design of Interlocking Structures

To investigate the effect of the building direction on the joinability, the model interlocking structure was designed as shown in Figure 1a [22]. The model consists of a thick base and 11 highly elongated fins. The thickness of fins (denoted as “t”) changed from 0.5 to 1.0 mm while the distance between adjacent fins was fixed as 2.0 mm. To avoid the dehiscence in the adjacent fins during sample preparation, a base 10 mm thick was selected. Two interlocking structures can be geometrically joined, as shown in Figure 1b, which makes two overlapped rectangles. The joining margin is necessary because of the precision margin of error and distortion during manufacturing. While the joining of two of the slimmest fins, each 0.5 mm thick, leads to 50% filling up of the spacing, the joining of the thickest fins, each 1.0 mm thick, reaches full density if it connects. Two distinct building directions, one parallel and one perpendicular to the build plate, were considered. Other building directions, such as 45° and 60° to the build plate, were also fabricated but there was no significant difference with the results when the building direction was perpendicular to the build plate. The additively manufactured structures are shown in Figure 1c.
Inclined interlocking structures, which led to an overall trapezoidal shape, were designed as shown in Figure 2a to estimate the dehiscence, one of major reasons of failure in the interlocking structures. Two identical interlocking structures can be geometrically joined, as shown in Figure 2b. While consisting of 11 fins with 2 mm spacing, only a 1 mm thick base structure was applied to investigate the distortion of fins with additive manufacturing conditions such as laser power and scan speed. If the distortion is bigger than the margin, the interlocking structures cannot be joined. The dehiscence in the inclined structure is essential for joinability. The spacing between the outer fins (a2) was measured in comparison to the connected part (a1), as shown in Figure 2a. The same structures but with distinct processing parameters were manufactured as shown in Figure 2c.

2.2. Additive Manufacturing of Interlocking Structures

The interlocking structures were made with commercially available 17-4PH stainless steel (SUS 17-4PH; Koswire Co, Busan, Republic of Korea). SUS 17-4PH is a good candidate model for predicting the distortion during processing and releasing from the build plate as the material parameters for simulation were available in Netfabb Local Simulation. Using a laser powder bed fusion (LPBF) machine (Concept Laser M2; General Electric, Boston, MA, USA), interlocking structures to investigate the effect of building direction were prepared with a laser power of 370 W and a scan speed of 1350 mm/s for structures built both perpendicular and parallel to the build plate, as shown in Figure 3a. Figure 3b,c show that the laser-exposed area, which is the same as the cross-section area, is different between the two building directions. It is noteworthy that the laser-exposed area of the structure built parallel to the build plate is larger than that built perpendicular to the build plate.
The SUS 17-4PH powder exhibited a flowability of 3.22(s) for 50g, an apparent density of 4.23 g/cm3, and a tap density of 4.92 g/cm3 when measured. When this powder was used in additive manufacturing, the theoretical density was 7.75 g/cm3, and under the process conditions employed in this study, namely 1350 mm/s and 370 W, it resulted in a relative density of 99.5%. The manufacturing accuracy depends on the laser beam diameter and powder size. In this experiment, the beam diameter was 0.13 mm, which is larger than the size of the metal powder, which determines the accuracy of additive manufacturing.
The inclined structures were prepared under 14 distinct processing conditions to assess the impact of laser power density on dehiscence. The laser power was varied between 200W and 370 W while the laser scan speed ranged from 600 mm/s to 1500 mm/s. Comprehensive details of these processing conditions are given in Table 1.

2.3. Joinability Test and X-ray Computed Tomography (CT) Analysis

Two interlocking structures of varying fin thicknesses were placed on a plate. They were then subjected to a pressure of 0.1 MPa to evaluate joinability by measuring the gap between their base sections. A successfully joined pair would have a separation of approximately 10 mm at the base, whereas a gap approaching 20 mm would signify incomplete joining. Each setup was tested at least five times, with results classified as fully joined ("O", less than 11 mm), partially joined ("∆", between 11 mm and 19 mm), or not joined ("X", more than 19 mm). To gain a more detailed understanding of the joint structures, X-ray CT was employed to closely examine the contact area.
For structures with an inclination, distortions were evaluated using computer vision techniques. Scanned images of the sample, at a resolution of 1,200 dpi, were utilized to carefully measure variations in the lengths of both the base and fin components by counting pixels.

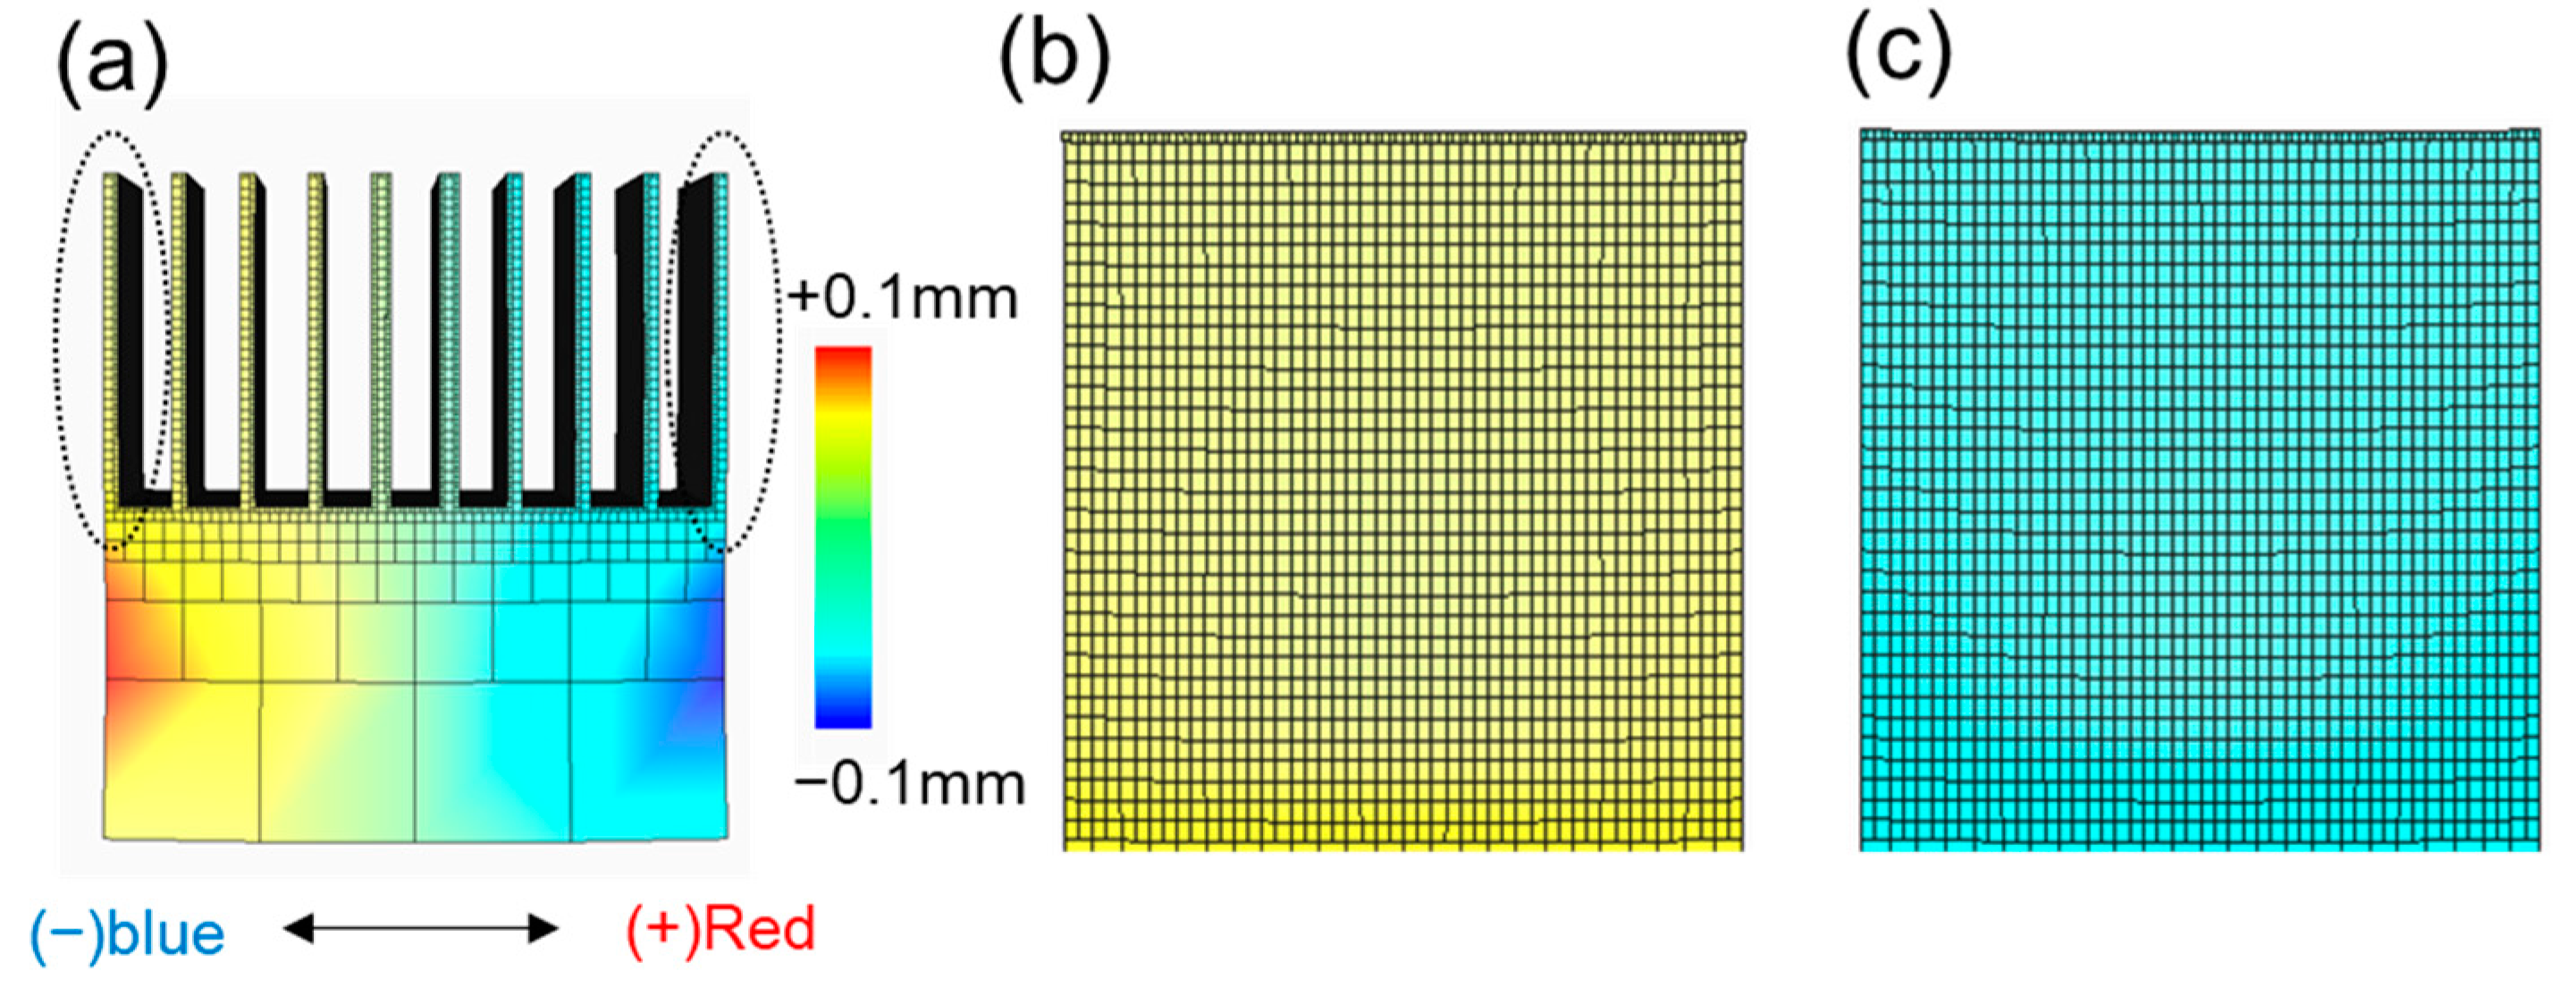
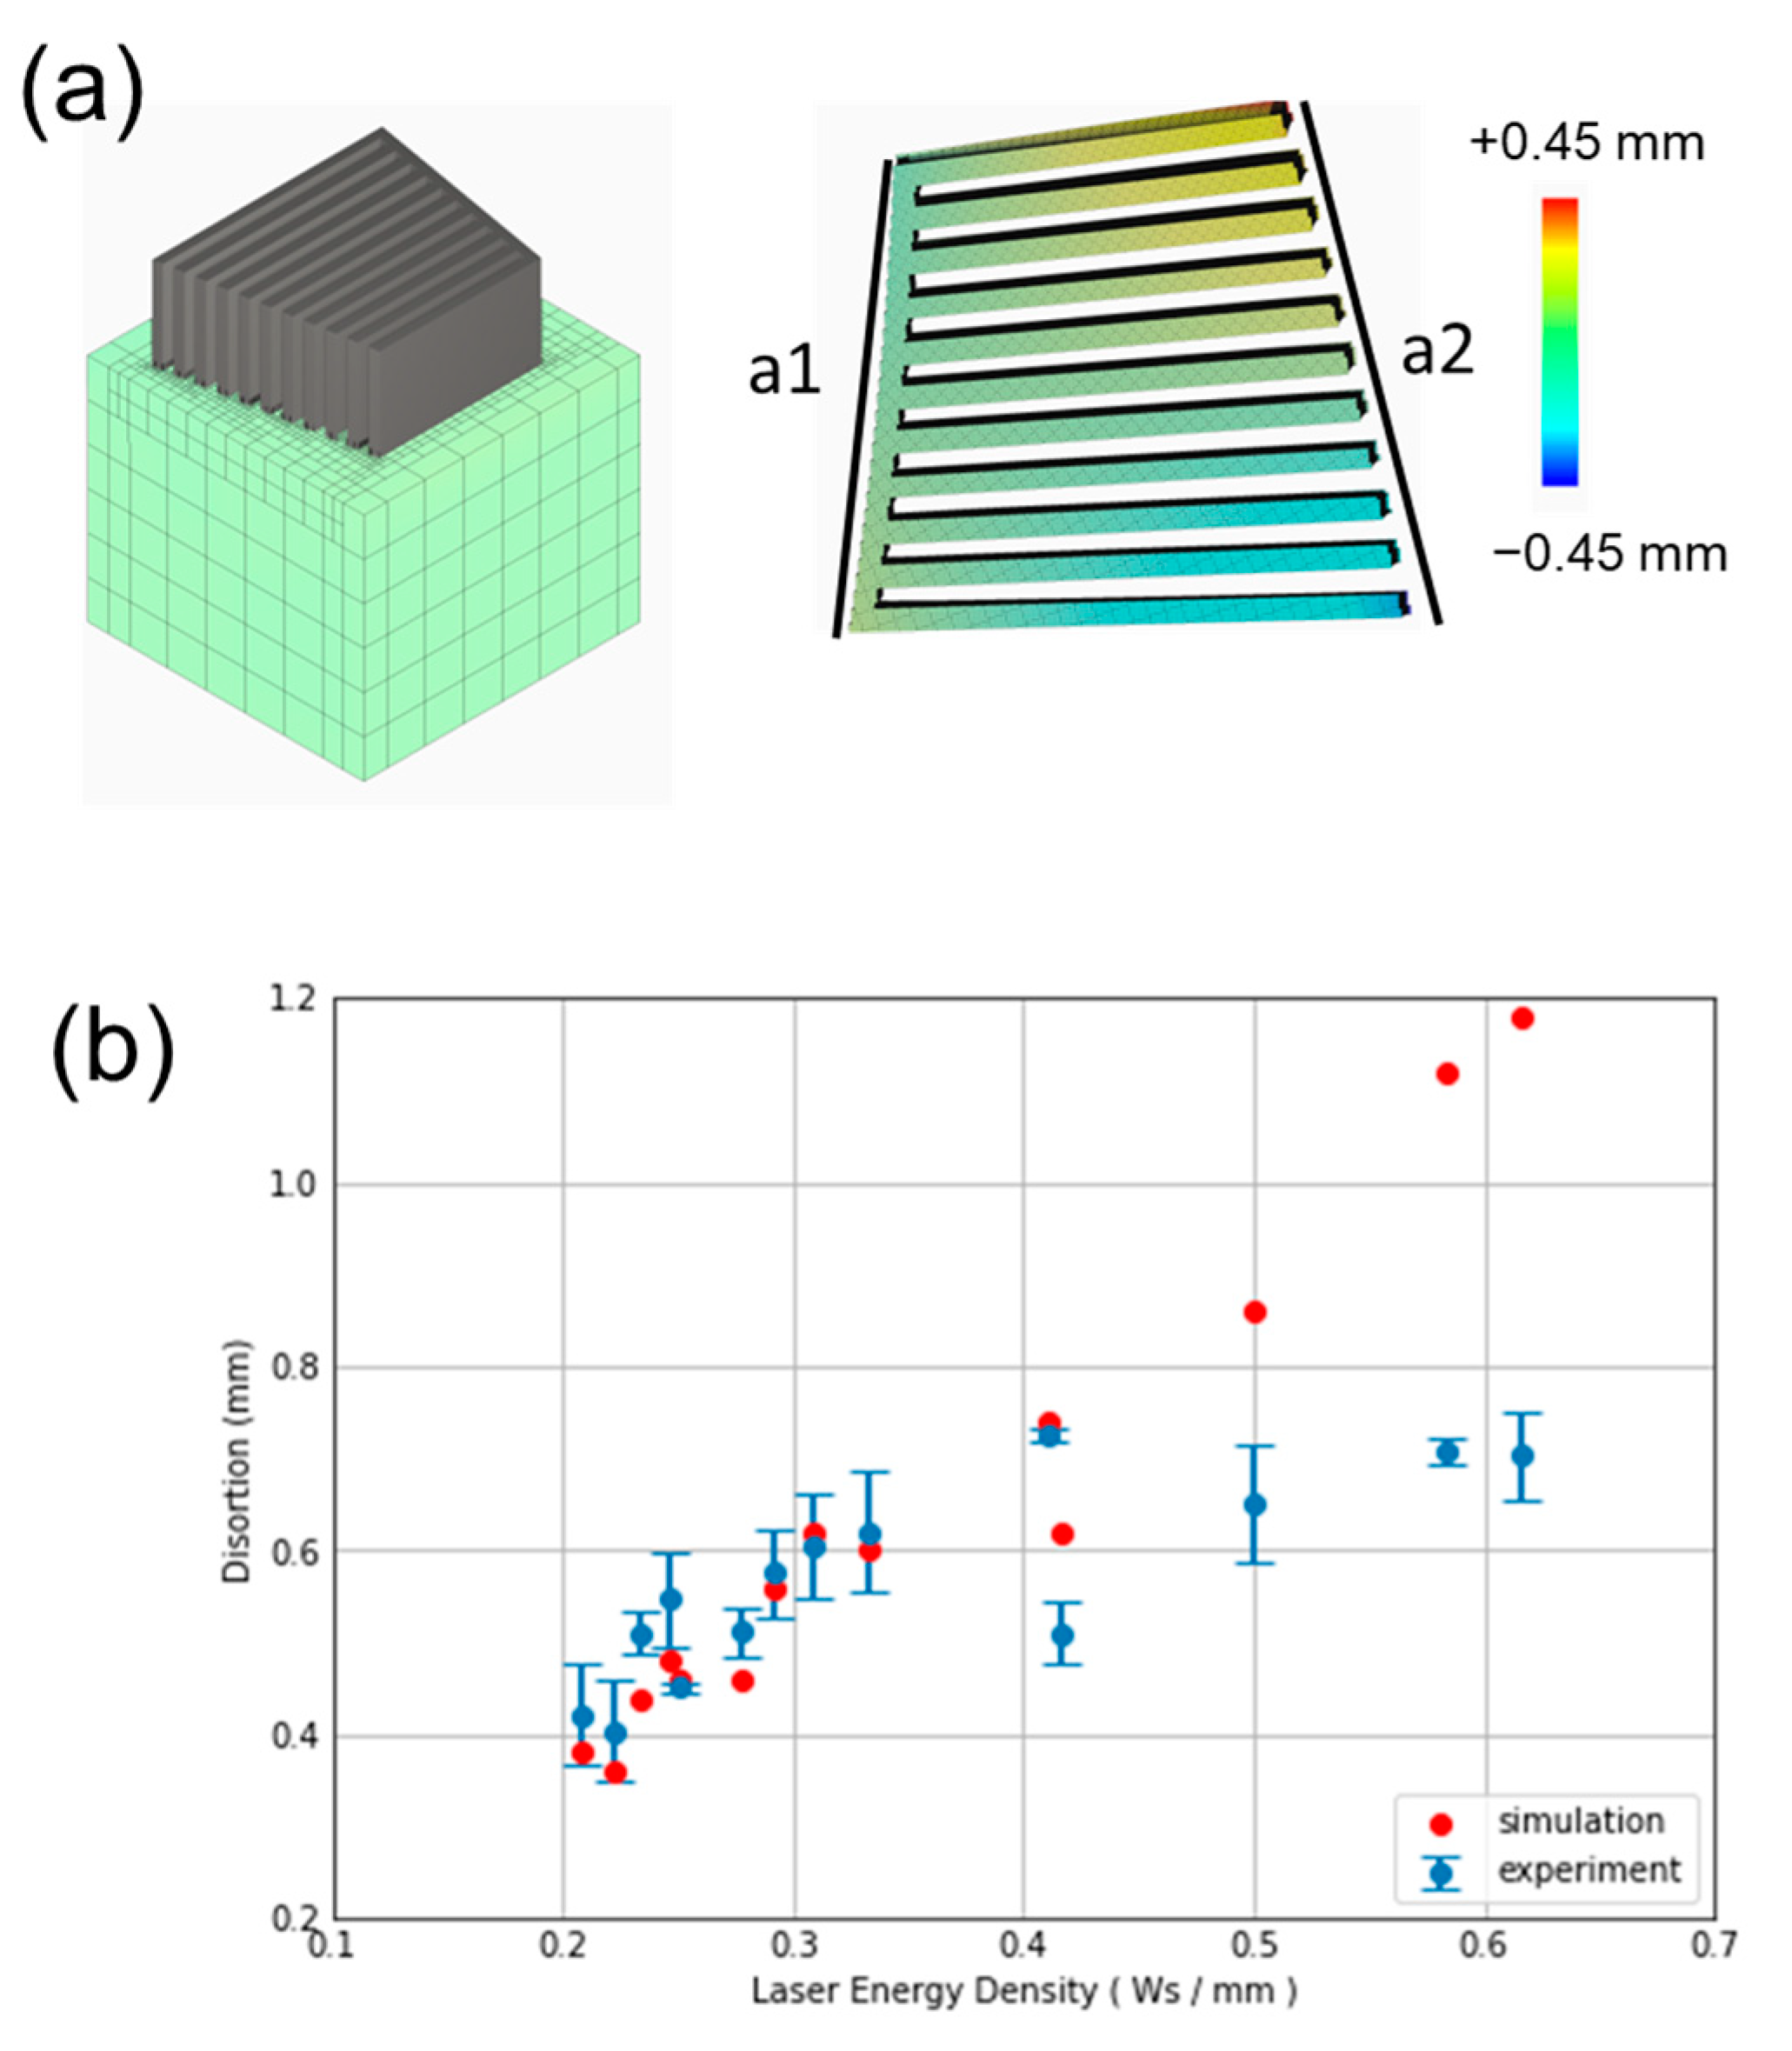
2.4. Simulation of the Distortion in Additive Manufacturing

Netfabb Local Simulation (Autodesk Inc, California, USA) was applied to predict the amount of thermal strain as a function of building direction. The simulation parameters for laser power, scan speed, thickness, and scanning strategy were set to be identical with those used in the experiment. The amount of deformation in the direction perpendicular to the joint fin is essential to estimate joinability. Considerations were made to ensure accurate meshing and simulation results. The voxel mesh size was set to be at least twice the minimum wall thickness and was maintained at half the size of the slit. Preserving symmetry during the meshing process was crucial to avoid artifacts and inaccuracies in the simulation. Thus, careful attention was given to meshing operations to maintain reliability. A predominantly vertical structure was utilized to mitigate artifacts arising from the cube mesh application. For precise representation of the deforming fin’s thickness, mesh sizes of 0.25 mm and 0.5 mm were adopted. Mesh sizes smaller than 0.25 mm were not considered in this study.
With the consideration of distortion, the compensated design could be obtained in Netfabb Local Simulation. The displacement of each mesh was individually calculated, and the negative movement was applied. Finally, the compensated structures for interlocking models were prepared.

3. Results

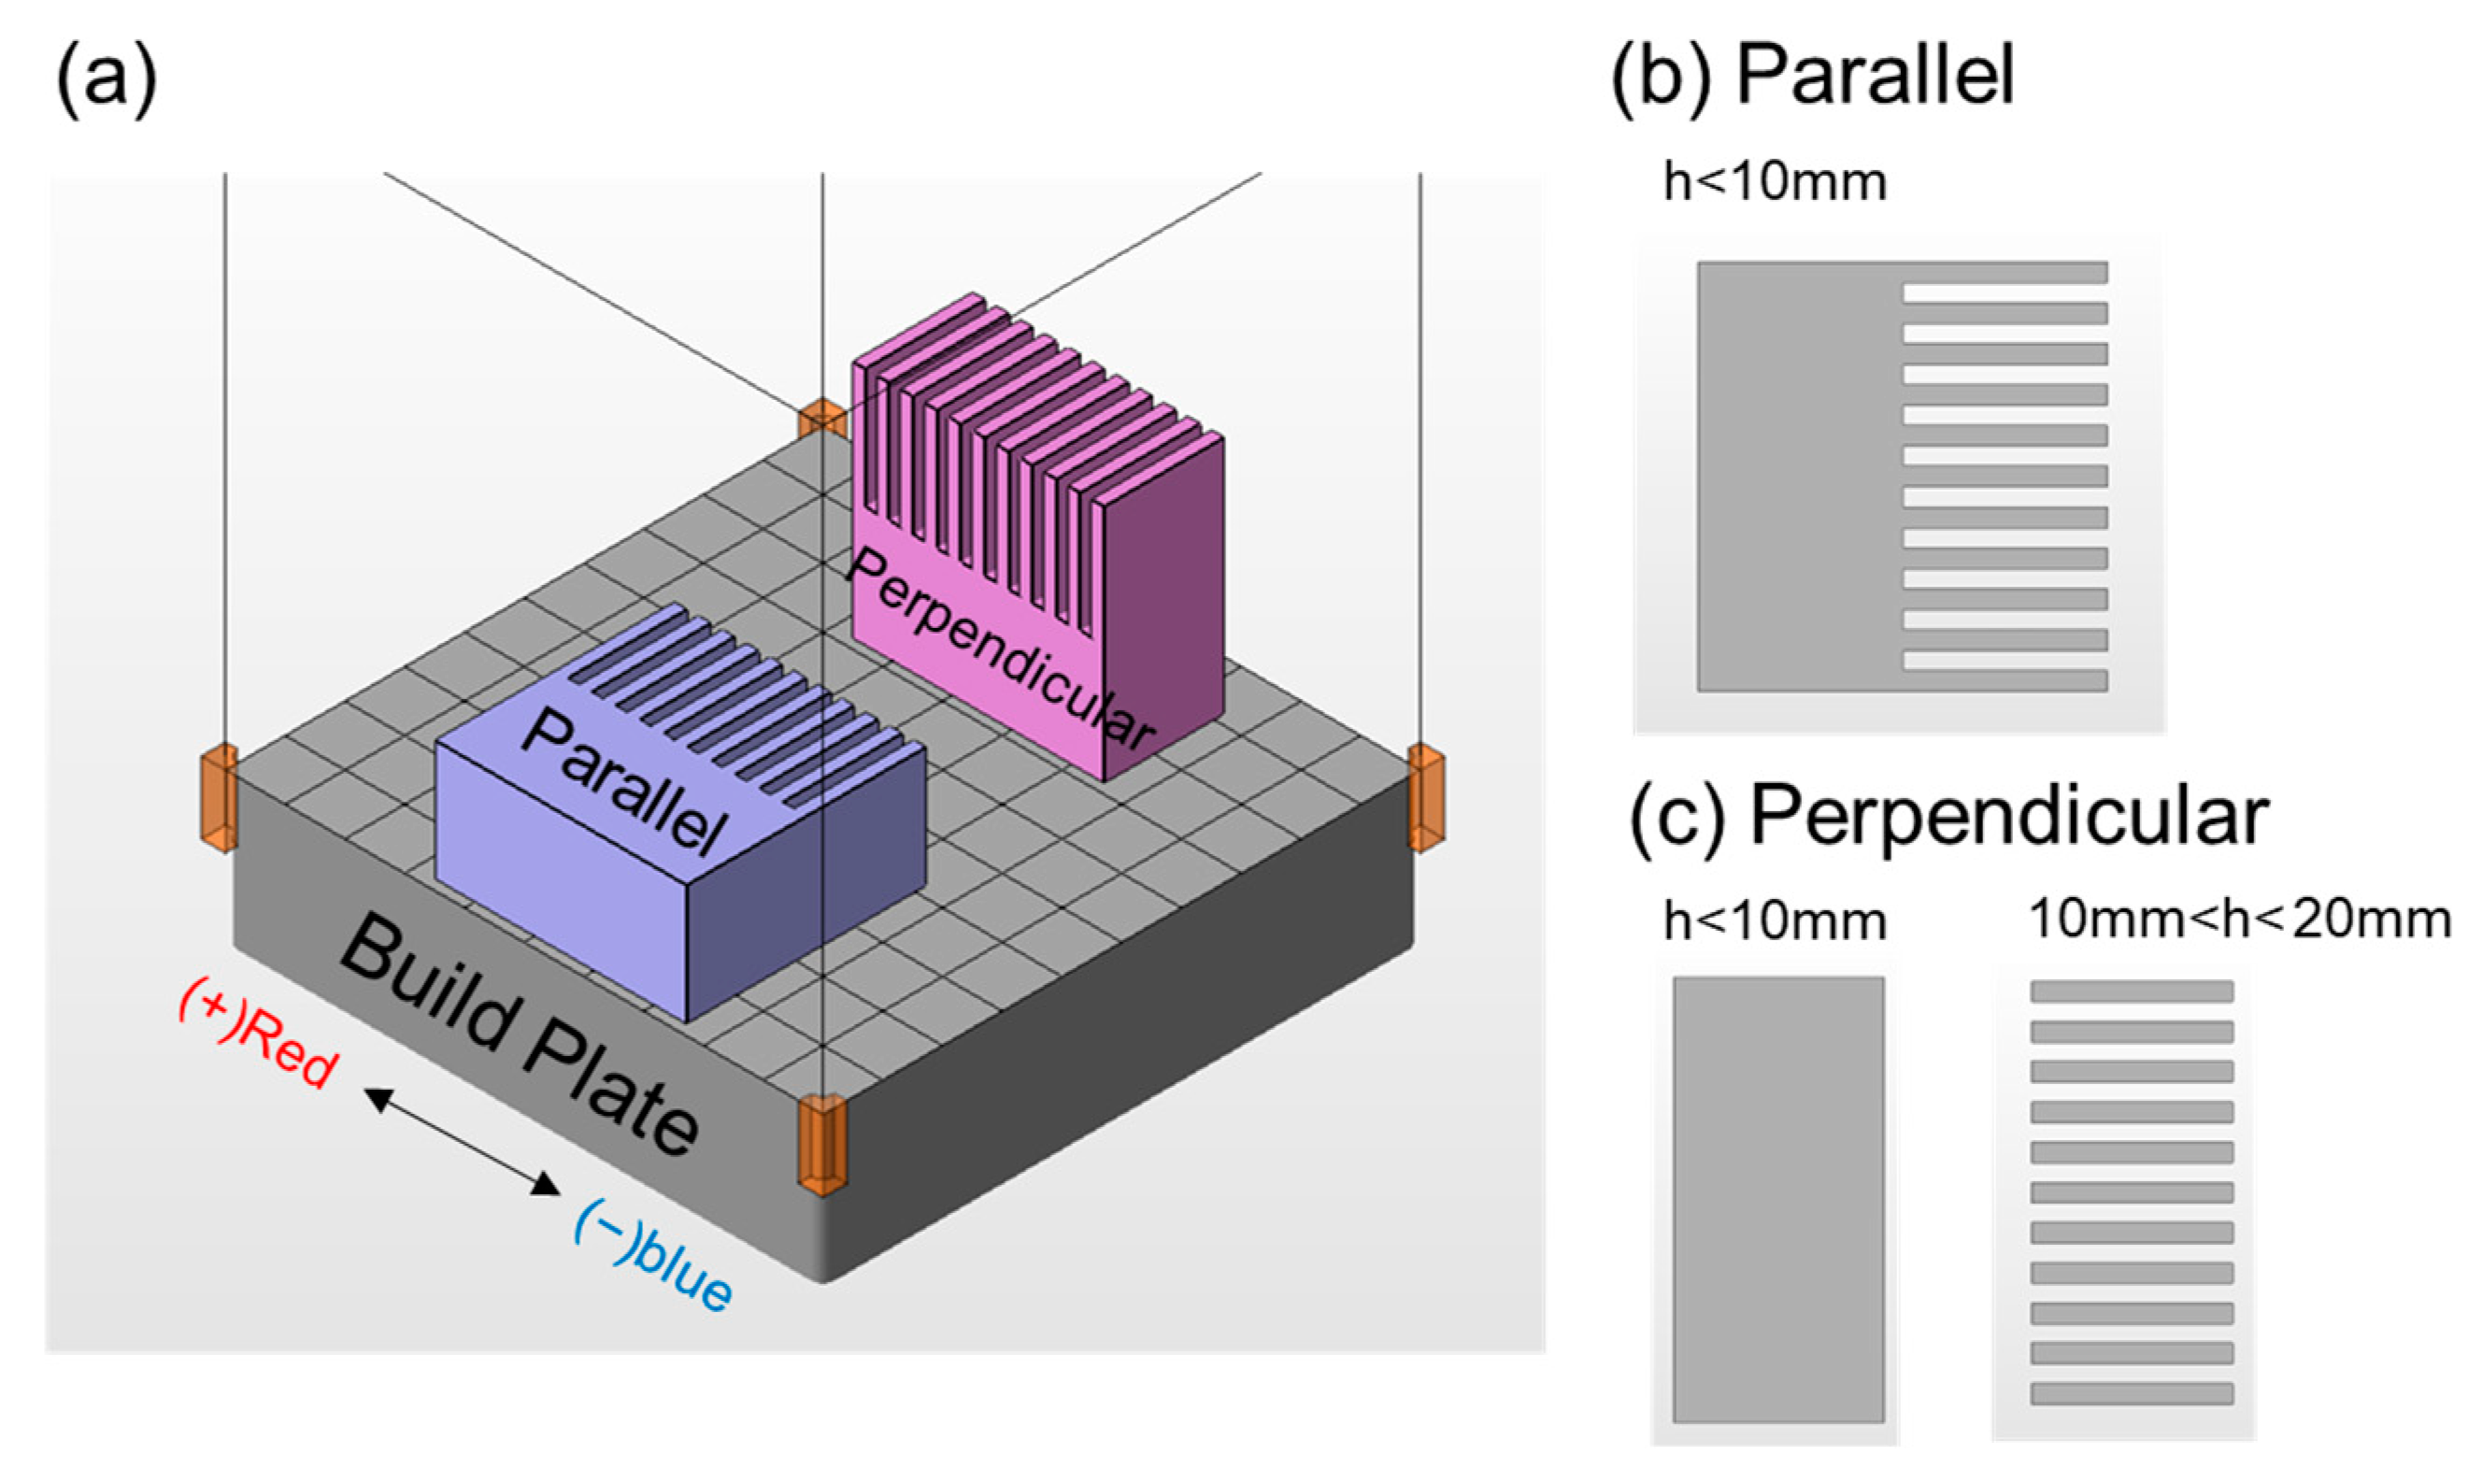
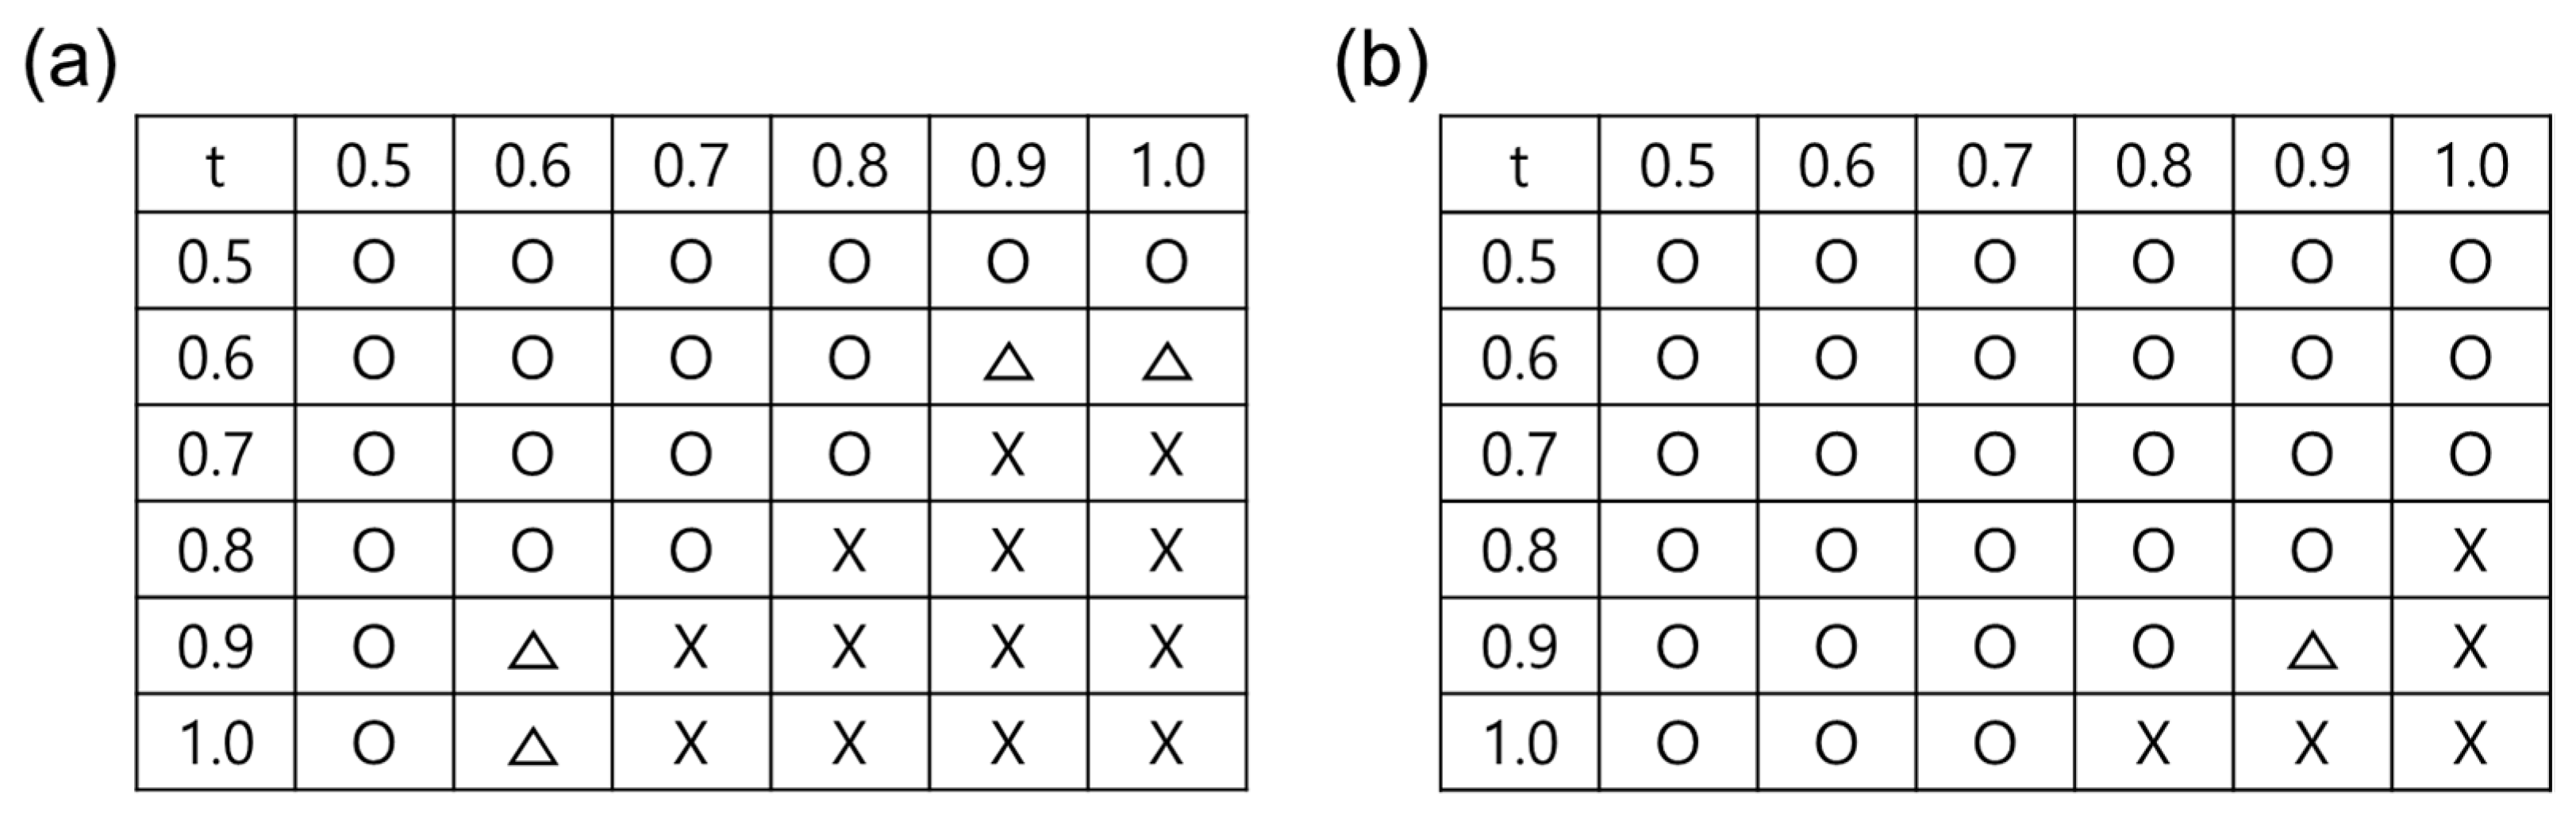
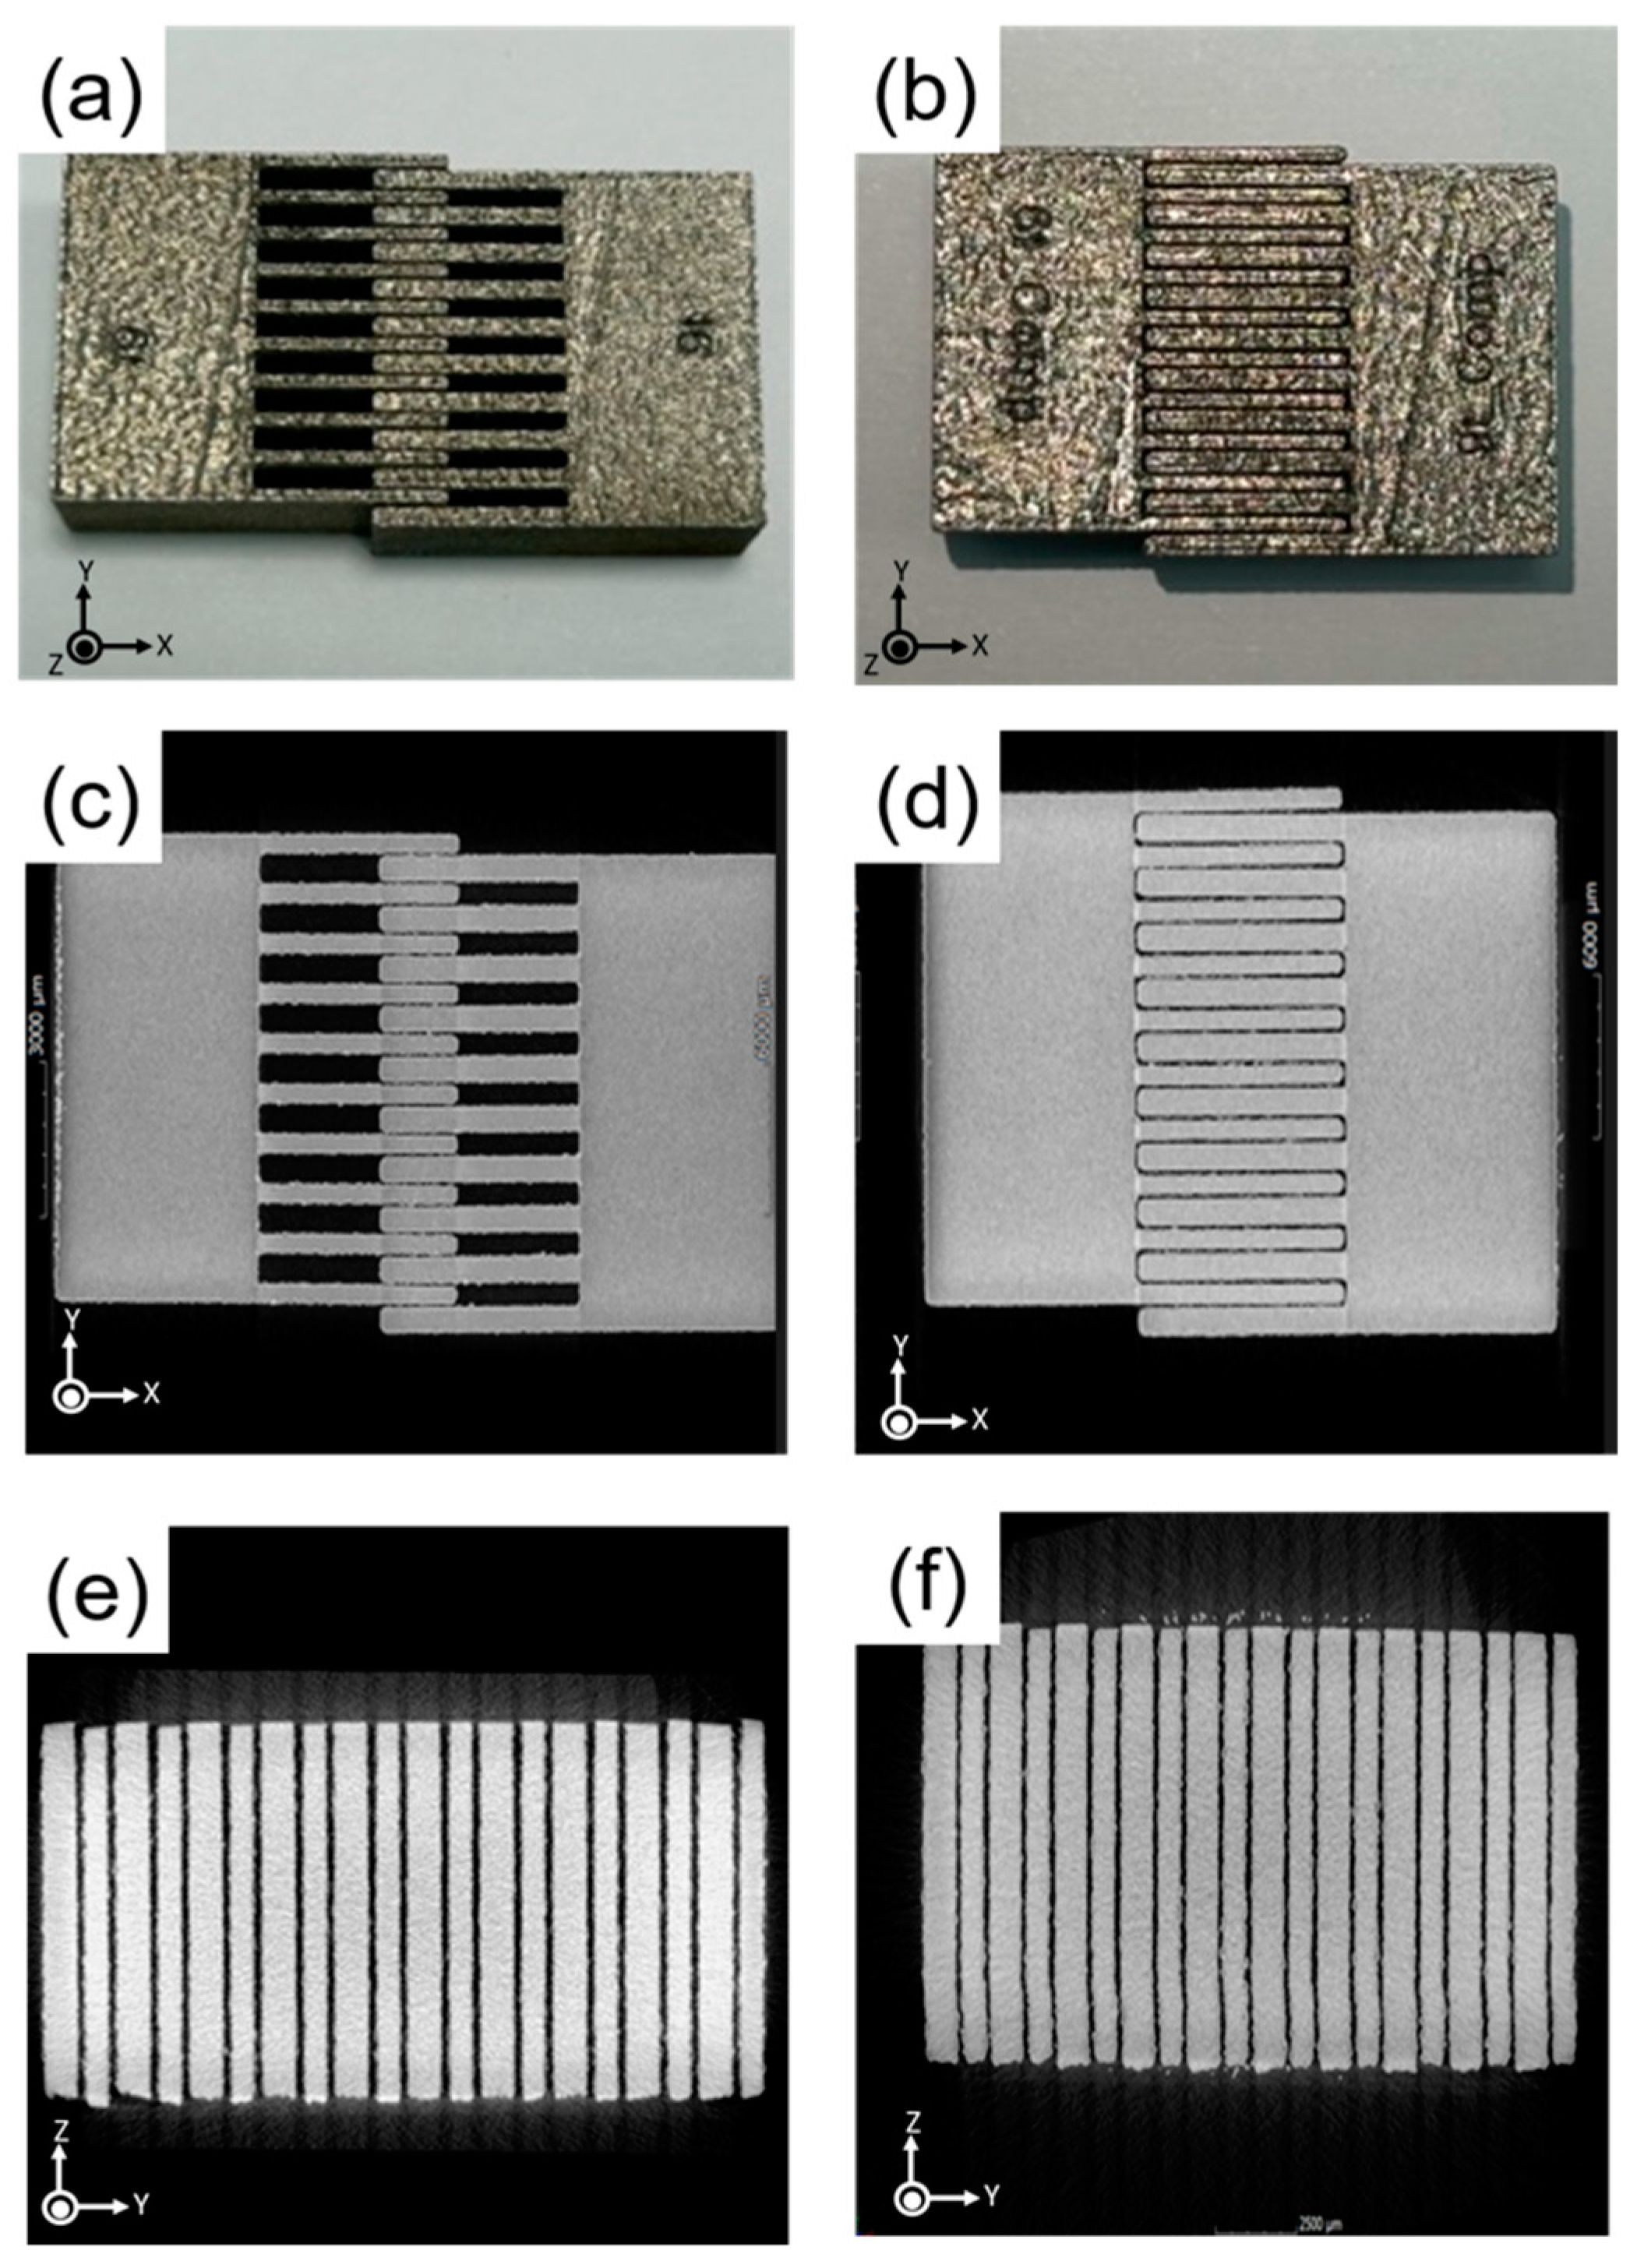
3.1. The Effect of Building Direction on Joinability of Interlocking Structures

The assembly experiments on joint specimens manufactured by LPBF processes were conducted with different thicknesses and orientations with respect to the build plate. The results are summarized in Figure 4.
Figure 4a shows the results for specimens printed parallel to the build plate. The assembly success varied depending on the thickness of the joint fin (denoted “t”). For a joint fin thickness of 0.5 mm, all dimensions were successfully assembled. However, as the joint fin thickness increased to 0.6 mm, the assembly with 0.9 mm and 1.0 mm specimens was not perfect. Further, at a joint fin thickness of 0.7 mm, the 0.9 mm and 1.0 mm specimens failed to assemble, and for 0.8 mm joint fin thickness, assembly failures occurred from 0.8 mm to 1.0 mm specimens. In the case of joint fin thicknesses of 0.9 mm and 1.0 mm, the 0.5 mm specimen was completely assembled, while the 0.6 mm specimen only achieved partial assembly, and the remaining dimensions were not assembled.
Figure 4b presents the results for specimens printed perpendicular to the build plate. Here, the assembly success was generally better than those printed parallel to the build plate. For joint fin thicknesses ranging from 0.5 mm to 0.7 mm, all dimensions were successfully assembled. At a joint fin thickness of 0.8 mm, only the 1.0 mm specimen failed to assemble. With a joint fin thickness of 0.9 mm, partial assembly was achieved for the 0.9 mm specimen, while the 1.0 mm specimen was not assembled. Finally, for a joint fin thickness of 1.0 mm, assembly was made up to the dimensions of 0.7 mm, and specimens from 0.8 mm to 1.0 mm were not assembled.
It was observed that parallel printing exhibited more assembly failures and required a sufficient margin for successful assembly. In contrast, perpendicular printing showed minimal thermal deformation and achieved successful assembly for most dimensions. This result can be understood given that the printing area of fins printed in the perpendicular direction are smaller than those printed in the parallel direction at the given layer. This demonstrates that building policy can significant affect the joinability in the interlocking structure.
To analyze quantitively the thermal stress and residual stress, additive manufacturing simulations were performed using Netfabb Local Simulation [28]. In Figure 3a, two distinct building directions relative to the build plate are shown. Figure 5 displays the simulation results for a specimen printed with the additive manufacturing direction parallel to the build plate. The red areas indicate inward deformation of the fin, while the blue areas represent outward deformation. It is evident that the fins experienced significant deformation inward due to thermal and residual stress. In contrast, Figure 6 shows only the uniform displacement in joint fins printed perpendicular to the build plate. The differences become evident when comparing the slicing areas of the two structures. When oriented perpendicular to the build plate, the base and fins are constructed independently. This method reduces the thermal stress exerted on the fins, particularly in a perpendicular orientation. In doing so, the assembly properties are improved, largely due to the reduced influence of both thermal and residual stresses on the fins. The findings from these simulations align with the experimental observations.
One of the major reasons for the failure to join in the additive manufactured interlocking structures is the dehiscence of fins when the original structure is not symmetrical. In Figure 7a, the simulation result of the inclined models with 370 W laser power and 900 mm/s scan speed shows the maximum dehiscence of joint fins to be 0.41 mm after releasing the build plate. The dehiscence can be measured by the difference between base length (a1) and total fin spacing (a2) shown in Figure 7a. The expected opening up of the joint fins due to the thermal stress is evident.
Figure 7b shows the experimental and calculated dehiscence as a function of laser energy density, i.e., laser power per scan speed. As the laser energy density increases, the calculated distortions, represented as red dots, increase. The thermal distortion tends to increase when the laser power is higher and scan speed is slower. The experimental measurements of the dehiscence in the lower laser energy density, 0.35 W∙s/mm, are reasonably consistent with the calculations. It indicates that the material parameters for the simulation are well calibrated within the suitable processing conditions. It is worth mentioning that one of the commonly recommended sets of values for laser power and scan speed in SUS 17-4PH are 370 W and 1350 mm/s. Therefore, dehiscence of joint fins is predicted by simulations to occur under that commonly recommended processing condition.
As laser energy intensity increases, the distortions noted in experiments are markedly lower than those predicted in simulation. This variation can be linked to the reduced density observed under elevated laser energy conditions during testing. Because the simulation does not factor in this density reduction, the estimated thermal stress is substantially higher than the experimentally observed values.
Through the combination of calculations and model experiments, these investigations into the dehiscence in the interlocking structures show it to be strongly related to the laser energy density within the processing conditions and that it can be calculated via simulation [32].

3.2. Compensated Structure to Improve Joinability

These results show that the design and control of thermal distortions are essential to improve the joinability of interlocking structures. One of the practical approaches to reduce the distortion is to design a compensated structure using simulation [33]. Calculating the displacement of each mesh, a compensated structure could be built with the negative movement in each position.
Here, experimental tests demonstrated that specimens with compensated design achieved better assembly compared to those manufactured in the previous parallel direction. The outward deformation of the fins in the specimen by implementing compensated design were applied based on predicted deformation amounts. Through simulation, it was determined that the largest deformation occurred with a joint-fin thickness of 0.6 mm. Figure 8a depicts the assembly of normal 0.6 mm and 0.9 mm specimens manufactured in the conventional parallel direction, while Figure 8b shows the assembly of compensated 0.6 mm and 0.9 mm specimens manufactured with compensated design. The conventional parallel assembly achieved only about 1/4 of the case whereas the specimens with compensated design were perfectly assembled. The complex shapes of parts manufactured through metal AM often result in non-uniform stress distribution at the assembly sites. Therefore, the compensating of assembly parts can lead to increased stability and durability.
To further evaluate the assembly quality and deformation in relation to the compensated design, X-ray (CT) was utilized. X-ray CT scans were performed on the assembly tests of 0.6 mm and 0.9 mm specimens manufactured in the parallel direction (Figure 8c,e). Additionally, X-ray CT scans were conducted on the assembly tests of 0.6 mm and 0.9 mm specimens with the compensated design applied (Figure 8d,f).
The X-ray CT measurements revealed that, when comparing joint tests with the same thickness, the assembly of specimens with compensated design exhibited superior results compared to those manufactured in the previous parallel direction. This finding, obtained through X-ray CT analysis, provides further evidence of the improved assembly quality achieved by implementing compensated design. The X-ray CT image reveals potential defects in the two interlocking structures, showing a gap of about 0.15 mm at the connection points. This imagery suggests the feasibility of fabricating a structure suitable for magnetic AM, given its high density, and an insulating layer.

4. Discussion

This study focuses on achieving a high-density coupling structure in metal joints for product assembly. Additive manufacturing techniques were employed to predict and analyze thermal deformation during the manufacturing process, as well as the maximum deformation of the joint arm after cutting, using simulation. The results indicate that additive manufacturing in a perpendicular direction to the build plate leads to improved assembly properties due to reduced deformation caused by thermal strain during cutting, as compared to the parallel direction. Furthermore, incorporating simulation predictions into the design stage resulted in enhanced assembly for the compensated product, surpassing the parallel output. The specimens measuring 0.6 mm and 0.7 mm displayed the most noticeable twisting deformation, as seen in Figure 5c,d. In Figure 4a, it is noteworthy that while the pairing of 0.7 mm + 0.8 mm with consistent thickness margins is effective, the combination of 0.9 mm + 0.6 mm is not. Simulations indicate that a specimen aligned parallel to the build plate exhibits a deformation range between -0.1 mm and +0.1 mm. In contrast, another specimen’s deformation was verified to be less than 0.03 mm. The maximal combined thickness for two interlocking specimens set perpendicular to the build plate is 1.7 mm (1.0 mm + 0.7 mm). For those set parallel, it is 1.5 mm. This suggests the 0.2 mm variance might be attributed to a deformation magnitude of 0.2 mm. While joint suitability is influenced by surface roughness, arm thickness, and size, anticipating the twist in the fins enables us to allocate an additional 0.2 mm margin for joining under these specific design and processing conditions.
The required margin for joint creation is subject to notable variation based on additive manufacturing conditions. As the laser’s energy density rises, deformation tends to increase correspondingly. For specimens with a tilt and a density exceeding 99% in stable conditions, there is a congruence of over 85% between the experimental and computed deformation values, as depicted in Figure 7b. Should a joint prove effective based on design allowances, there may be a reduction in density during the joining process. However, this potential decrease can be mitigated using compensatory design strategies, as showcased in Figure 8. Although X-ray CT scans can determine the joint condition of metal samples, pinpointing the precise areas of contact remains problematic, largely because of edge effects. This issue probably stems from scattering artifacts created by the irregular surface of the fabricated specimen. Upcoming studies are set to precisely measure deformation using automated image analysis and other techniques.
Challenges arise when perpendicular manufacturing is not feasible or when the height of the printed object increases, resulting in the accumulation of thermal stress within the printed structure. In such cases, optimizing the printing height becomes crucial, and exploring the possibility of assembly by adjusting the angle towards the parallel direction becomes significant. Obtaining quantified values and results in this regard is vital to ensure reliability and stability in additive manufacturing, save time, and enhance the precision of printed objects.
Additionally, the study highlights the importance of magnetic AM, which enables the production of parts with unique properties and functions not achievable with traditional AM materials. Magnetic AM offers the advantage of creating objects with magnetic properties, finding applications in various fields such as robotics, sensors, and electronics. It also allows for the production of parts capable of changing shape or behavior in response to a magnetic field, facilitating the development of adaptable components and sensors. The ability to produce complex geometries that are not feasible with conventional manufacturing methods leads to cost savings, improved efficiency, and customization of parts for specific applications. Hence, research and development in magnetic AM are crucial as AM has the potential to revolutionize the manufacturing industry by enabling the production of objects with unique properties and functions [34,35].

5. Conclusions

This study revealed that the incorporation of interlocking structures in additive manufacturing is considerably affected by thermal deformations. Through simulations, deformations were predicted, allowing for adjustments in the additive deformation or the introduction of design margins. Such compensatory designs significantly increased the likelihood of successful joining.
Distortions in interlocking fins during the fabrication process underscore the need for a design margin. By integrating both simulations and experiments, it was clear that aspects like building direction and laser energy density play crucial roles in determining joinability. This investigation highlights that, for materials such as SUS 17-4PH, distortions associated with the area produced in each layer and processing parameters like laser power and scan speed can be effectively estimated using simulations. This approach is essential for the precise design of margins in interlocking structures.
Nevertheless, a divergence exists between the distortion predicted in simulations and the observed experimental results, particularly when the laser energy density is increased to reduce the component’s density. Leveraging distortion data from simulations, the quality of the interlocking was enhanced with a compensated model. Ensuring the joinability of interlocking designs underscores the importance of a thoughtful building strategy and precise simulations in fabricating interlocking structures using additive manufacturing techniques.

Author Contributions

Y.-r.K. and E.-a.K. performed all of the experiments; H.-s.L. carried out the additive-manufacturing simulations; S.W. performed X-ray CT analysis; J.P.C., T.H. and J.B.J. provided deep and fruitful discussions; S.-h.K. and H.-s.L. planned the research. All authors have read and agreed to the published version of the manuscript.

Funding

This work was partly supported by the National Research Foundation of Korea (NRF) funded by Ministry of Science and ICT [2021M3D1A2047724] and the Technology development Program of MSS [S3311509].

Data Availability Statement

No appliable.

Acknowledgments

The authors specially thank Autodesk Korea and VAXE for sharing their software and knowledge.

Conflicts of Interest

The authors declare no conflict of interest.

References

  1. Bandyopadhyay, A.; Heer, B. Additive manufacturing of multi-material structures. Mater. Sci. Eng. R Rep. 2018, 129, 1–16. [Google Scholar] [CrossRef]
  2. Lu, B.; Li, D.; Tian, X. Development trends in additive manufacturing and 3D printing. Engineering 2015, 1, 085–089. [Google Scholar] [CrossRef]
  3. Ngo, T.D.; Kashani, A.; Imbalzano, G.; Nguyen, K.T.; Hui, D. Additive manufacturing (3D printing): A review of materials, methods, applications and challenges. Compos. Part B Eng. 2018, 143, 172–196. [Google Scholar]
  4. DebRoy, T.; Wei, H.; Zuback, J.; Mukherjee, T.; Elmer, J.; Milewski, J.; Beese, A.M.; Wilson-Heid, A.d.; De, A.; Zhang, W. Additive manufacturing of metallic components–process, structure and properties. Prog. Mater. Sci. 2018, 92, 112–224. [Google Scholar]
  5. DebRoy, T.; Mukherjee, T.; Milewski, J.; Elmer, J.; Ribic, B.; Blecher, J.; Zhang, W. Scientific, technological and economic issues in metal printing and their solutions. Nat. Mater. 2019, 18, 1026–1032. [Google Scholar] [CrossRef]
  6. Madhavadas, V.; Srivastava, D.; Chadha, U.; Raj, S.A.; Sultan, M.T.H.; Shahar, F.S.; Shah, A.U.M. A review on metal additive manufacturing for intricately shaped aerospace components. CIRP J. Manuf. Sci. Technol. 2022, 39, 18–36. [Google Scholar]
  7. Guo, N.; Leu, M.C. Additive manufacturing: Technology, applications and research needs. Front. Mech. Eng. 2013, 8, 215–243. [Google Scholar]
  8. Tofail, S.A.; Koumoulos, E.P.; Bandyopadhyay, A.; Bose, S.; O’Donoghue, L.; Charitidis, C. Additive manufacturing: Scientific and technological challenges, market uptake and opportunities. Mater. Today 2018, 21, 22–37. [Google Scholar] [CrossRef]
  9. Vaneker, T.; Bernard, A.; Moroni, G.; Gibson, I.; Zhang, Y. Design for additive manufacturing: Framework and methodology. CIRP Ann. 2020, 69, 578–599. [Google Scholar]
  10. Thompson, M.K.; Moroni, G.; Vaneker, T.; Fadel, G.; Campbell, R.I.; Gibson, I.; Bernard, A.; Schulz, J.; Graf, P.; Ahuja, B. Design for Additive Manufacturing: Trends, opportunities, considerations, and constraints. CIRP Ann. 2016, 65, 737–760. [Google Scholar]
  11. Dilberoglu, U.M.; Gharehpapagh, B.; Yaman, U.; Dolen, M. The role of additive manufacturing in the era of industry 4.0. Procedia Manuf. 2017, 11, 545–554. [Google Scholar] [CrossRef]
  12. Peralta Marino, G.; De la Pierre, S.; Salvo, M.; Díaz Lantada, A.; Ferraris, M. Modelling, additive layer manufacturing and testing of interlocking structures for joined components. Sci. Rep. 2022, 12, 2526. [Google Scholar] [CrossRef] [PubMed]
  13. Zocca, A.; Colombo, P.; Gomes, C.M.; Günster, J. Additive manufacturing of ceramics: Issues, potentialities, and opportunities. J. Am. Ceram. Soc. 2015, 98, 1983–2001. [Google Scholar] [CrossRef]
  14. Song, P.; Fu, Z.; Liu, L.; Fu, C.-W. Printing 3D objects with interlocking parts. Comput. Aided Geom. Des. 2015, 35, 137–148. [Google Scholar] [CrossRef]
  15. Zareiyan, B.; Khoshnevis, B. Effects of interlocking on interlayer adhesion and strength of structures in 3D printing of concrete. Autom. Constr. 2017, 83, 212–221. [Google Scholar] [CrossRef]
  16. Li, Z.; Tsavdaridis, K.D. Limited-damage 3D-printed interlocking connection for timber volumetric structures: Experimental validation and computational modelling. J. Build. Eng. 2023, 63, 105373. [Google Scholar] [CrossRef]
  17. Mirkhalaf, M.; Barthelat, F. Design, 3D printing and testing of architectured materials with bistable interlocks. Extrem. Mech. Lett. 2017, 11, 1–7. [Google Scholar] [CrossRef]
  18. Tiismus, H.; Kallaste, A.; Belahcen, A.; Tarraste, M.; Vaimann, T.; Rassõlkin, A.; Asad, B.; Shams Ghahfarokhi, P. AC magnetic loss reduction of SLM processed Fe-Si for additive manufacturing of electrical machines. Energies 2021, 14, 1241. [Google Scholar] [CrossRef]
  19. Isa, M.; Kadir, M.; Gomes, C.; Azis, N.; Izadi, M.; Alyozbaky, O. Analysis on magnetic flux density and core loss for hexagonal and butt-lap core joint transformers. In Proceedings of the 2016 IEEE 2nd Annual Southern Power Electronics Conference (SPEC), Auckland, New Zealand, 5–8 December 2016; pp. 1–4. [Google Scholar]
  20. Koo, B.; Jang, M.-S.; Nam, Y.G.; Yang, S.; Yu, J.; Park, Y.H.; Jeong, J.W. Structurally-layered soft magnetic Fe-Si components with surface insulation prepared by shell-shaping selective laser melting. Appl. Surf. Sci. 2021, 553, 149510. [Google Scholar] [CrossRef]
  21. Manninen, A.; Pippuri-Mäkeläinen, J.; Riipinen, T.; Lindroos, T.; Metsä-Kortelainen, S.; Antikainen, A. The Mitigation of Eddy-Current Losses in Ferromagnetic Samples Produced by Laser Powder Bed Fusion. IEEE Access 2022, 10, 115571–115582. [Google Scholar] [CrossRef]
  22. Chowdhury, S.; Mhapsekar, K.; Anand, S. Part build orientation optimization and neural network-based geometry compensation for additive manufacturing process. J. Manuf. Sci. Eng. 2018, 140, 031009. [Google Scholar] [CrossRef]
  23. Hamilton, A.; Xu, Y.; Kartal, M.E.; Kumar, S.; Gadegaard, N.; Mulvihill, D.M. Optimisation of interlocking microstructured adhesive joints via finite element modelling, design of experiments and 3D printing. Int. J. Adhes. Adhes. 2023, 120, 103292. [Google Scholar] [CrossRef]
  24. Chaudhary, V.; Mantri, S.; Ramanujan, R.; Banerjee, R. Additive manufacturing of magnetic materials. Prog. Mater. Sci. 2020, 114, 100688. [Google Scholar] [CrossRef]
  25. Li, S.; Yuan, S.; Zhu, J.; Wang, C.; Li, J.; Zhang, W. Additive manufacturing-driven design optimization: Building direction and structural topology. Addit. Manuf. 2020, 36, 101406. [Google Scholar] [CrossRef]
  26. Sanaei, N.; Fatemi, A.; Phan, N. Defect characteristics and analysis of their variability in metal L-PBF additive manufacturing. Mater. Des. 2019, 182, 108091. [Google Scholar] [CrossRef]
  27. Di Angelo, L.; Di Stefano, P.; Guardiani, E. Search for the optimal build direction in additive manufacturing technologies: A review. J. Manuf. Mater. Process. 2020, 4, 71. [Google Scholar] [CrossRef]
  28. Pal, D.; Patil, N.; Zeng, K.; Stucker, B. An integrated approach to additive manufacturing simulations using physics based, coupled multiscale process modeling. J. Manuf. Sci. Eng. 2014, 136, 061022. [Google Scholar] [CrossRef]
  29. Rashid, R.; Masood, S.H.; Ruan, D.; Palanisamy, S.; Rashid, R.R.; Brandt, M. Effect of scan strategy on density and metallurgical properties of 17-4PH parts printed by Selective Laser Melting (SLM). J. Mater. Process. Technol. 2017, 249, 502–511. [Google Scholar] [CrossRef]
  30. Zhang, Q.; Hu, Z.; Su, W.; Zhou, H.; Liu, C.; Yang, Y.; Qi, X. Microstructure and surface properties of 17-4PH stainless steel by ultrasonic surface rolling technology. Surf. Coat. Technol. 2017, 321, 64–73. [Google Scholar] [CrossRef]
  31. Giganto, S.; Martínez-Pellitero, S.; Barreiro, J.; Leo, P.; Castro-Sastre, M.Á. Impact of the laser scanning strategy on the quality of 17-4PH stainless steel parts manufactured by selective laser melting. J. Mater. Res. Technol. 2022, 20, 2734–2747. [Google Scholar] [CrossRef]
  32. Jhabvala, J.; Boillat, E.; Antignac, T.; Glardon, R. On the effect of scanning strategies in the selective laser melting process. Virtual Phys. Prototyp. 2010, 5, 99–109. [Google Scholar] [CrossRef]
  33. Afazov, S.; Okioga, A.; Holloway, A.; Denmark, W.; Triantaphyllou, A.; Smith, S.-A.; Bradley-Smith, L. A methodology for precision additive manufacturing through compensation. Precis. Eng. 2017, 50, 269–274. [Google Scholar] [CrossRef]
  34. Wrobel, R.; Mecrow, B. A comprehensive review of additive manufacturing in construction of electrical machines. IEEE Trans. Energy Convers. 2020, 35, 1054–1064. [Google Scholar] [CrossRef]
  35. Wei, X.; Jin, M.-L.; Yang, H.; Wang, X.-X.; Long, Y.-Z.; Chen, Z. Advances in 3D printing of magnetic materials: Fabrication, properties, and their applications. J. Adv. Ceram. 2022, 11, 665–701. [Google Scholar] [CrossRef]
Figure 1. (a) Design of interlocking model structures consisting of 11 fins with 2.0 mm spacing, (b) schematic figure of the connected structure, and (c) six additively manufactured interlocking structures with thickness changing from 0.6 mm to 1.0 mm.
Crystals 13 01575 g001
Figure 2. (a) Design of inclined interlocking structures consisting of 11 fins with 2.0 mm spacing and 1.0 mm thick connecting base, (b) schematic of the connected structure, and (c) additively manufactured interlocking structures with 14 distinct processing conditions.
Crystals 13 01575 g002
Figure 3. (a) Schematic of the interlocking model showing the two different possible building directions: parallel and perpendicular to the build plate. The cross section is shown in (b) the parallel and (c) the perpendicular building direction.
Crystals 13 01575 g003
Figure 4. Joint test for printed parts of distinct thickness for a build direction (a) parallel to the build plate and (b) perpendicular to the build plate. (O: fully jointed, △: partially jointed, X: not jointed).
Crystals 13 01575 g004
Figure 5. (a) Simulation of deformation with 0.6 mm thick fins built parallel to the build plate. The deformations of fins of thickness (b) 0.5 mm, (c) 0.6 mm, (d) 0.7 mm, and (e) 0.8 mm are depicted.
Crystals 13 01575 g005
Figure 6. (a) Simulation of deformation for fins built perpendicular to the build plate. The deformation of the left and right outer fins are shown in (b) and (c), respectively.
Crystals 13 01575 g006
Figure 7. (a) Distortion of inclined interlocking structures and (b) the relationship between laser energy density and estimated distortion of calculations and experiments.
Crystals 13 01575 g007
Figure 8. Joint tests of two distinct arm structures with arm thickness of 0.6 mm and 0.9 mm, respectively. (a) Arm structures without and (b) with compensation design. X-ray tomography results are shown in x-y direction (c,d) and y-z direction (e,f).
Crystals 13 01575 g008
Table 1. LPBF printing process variables for SUS 17-4PH.
Laser Power
(W)
Laser Scan Speed
(mm/s)
Hatch Distance
(µm)
Laser Spot
Size (µm)
Layer Thickness
(µm)
3706009013050
3709009013050
37012009013050
37015009013050
3506009013050
35012009013050
35015009013050
3006009013050
3009009013050
30012009013050
2506009013050
2509009013050
25012009013050
2009009013050
Disclaimer/Publisher’s Note: The statements, opinions and data contained in all publications are solely those of the individual author(s) and contributor(s) and not of MDPI and/or the editor(s). MDPI and/or the editor(s) disclaim responsibility for any injury to people or property resulting from any ideas, methods, instructions or products referred to in the content.

