
Structural, Electrical, and Electrochemical Properties of a Na2O-V2O5 Ceramic Nanocomposite as an Active Cathode Material for a Na-Ion Battery

 ,
,  ,
,  ,
,
Abstract
:1. Introduction
2. Materials and Methods
2.1. Preparation
2.1.1. xNV Ceramics
2.1.2. Na-Ion Battery
2.2. Material Characterization
3. Results and Discussion
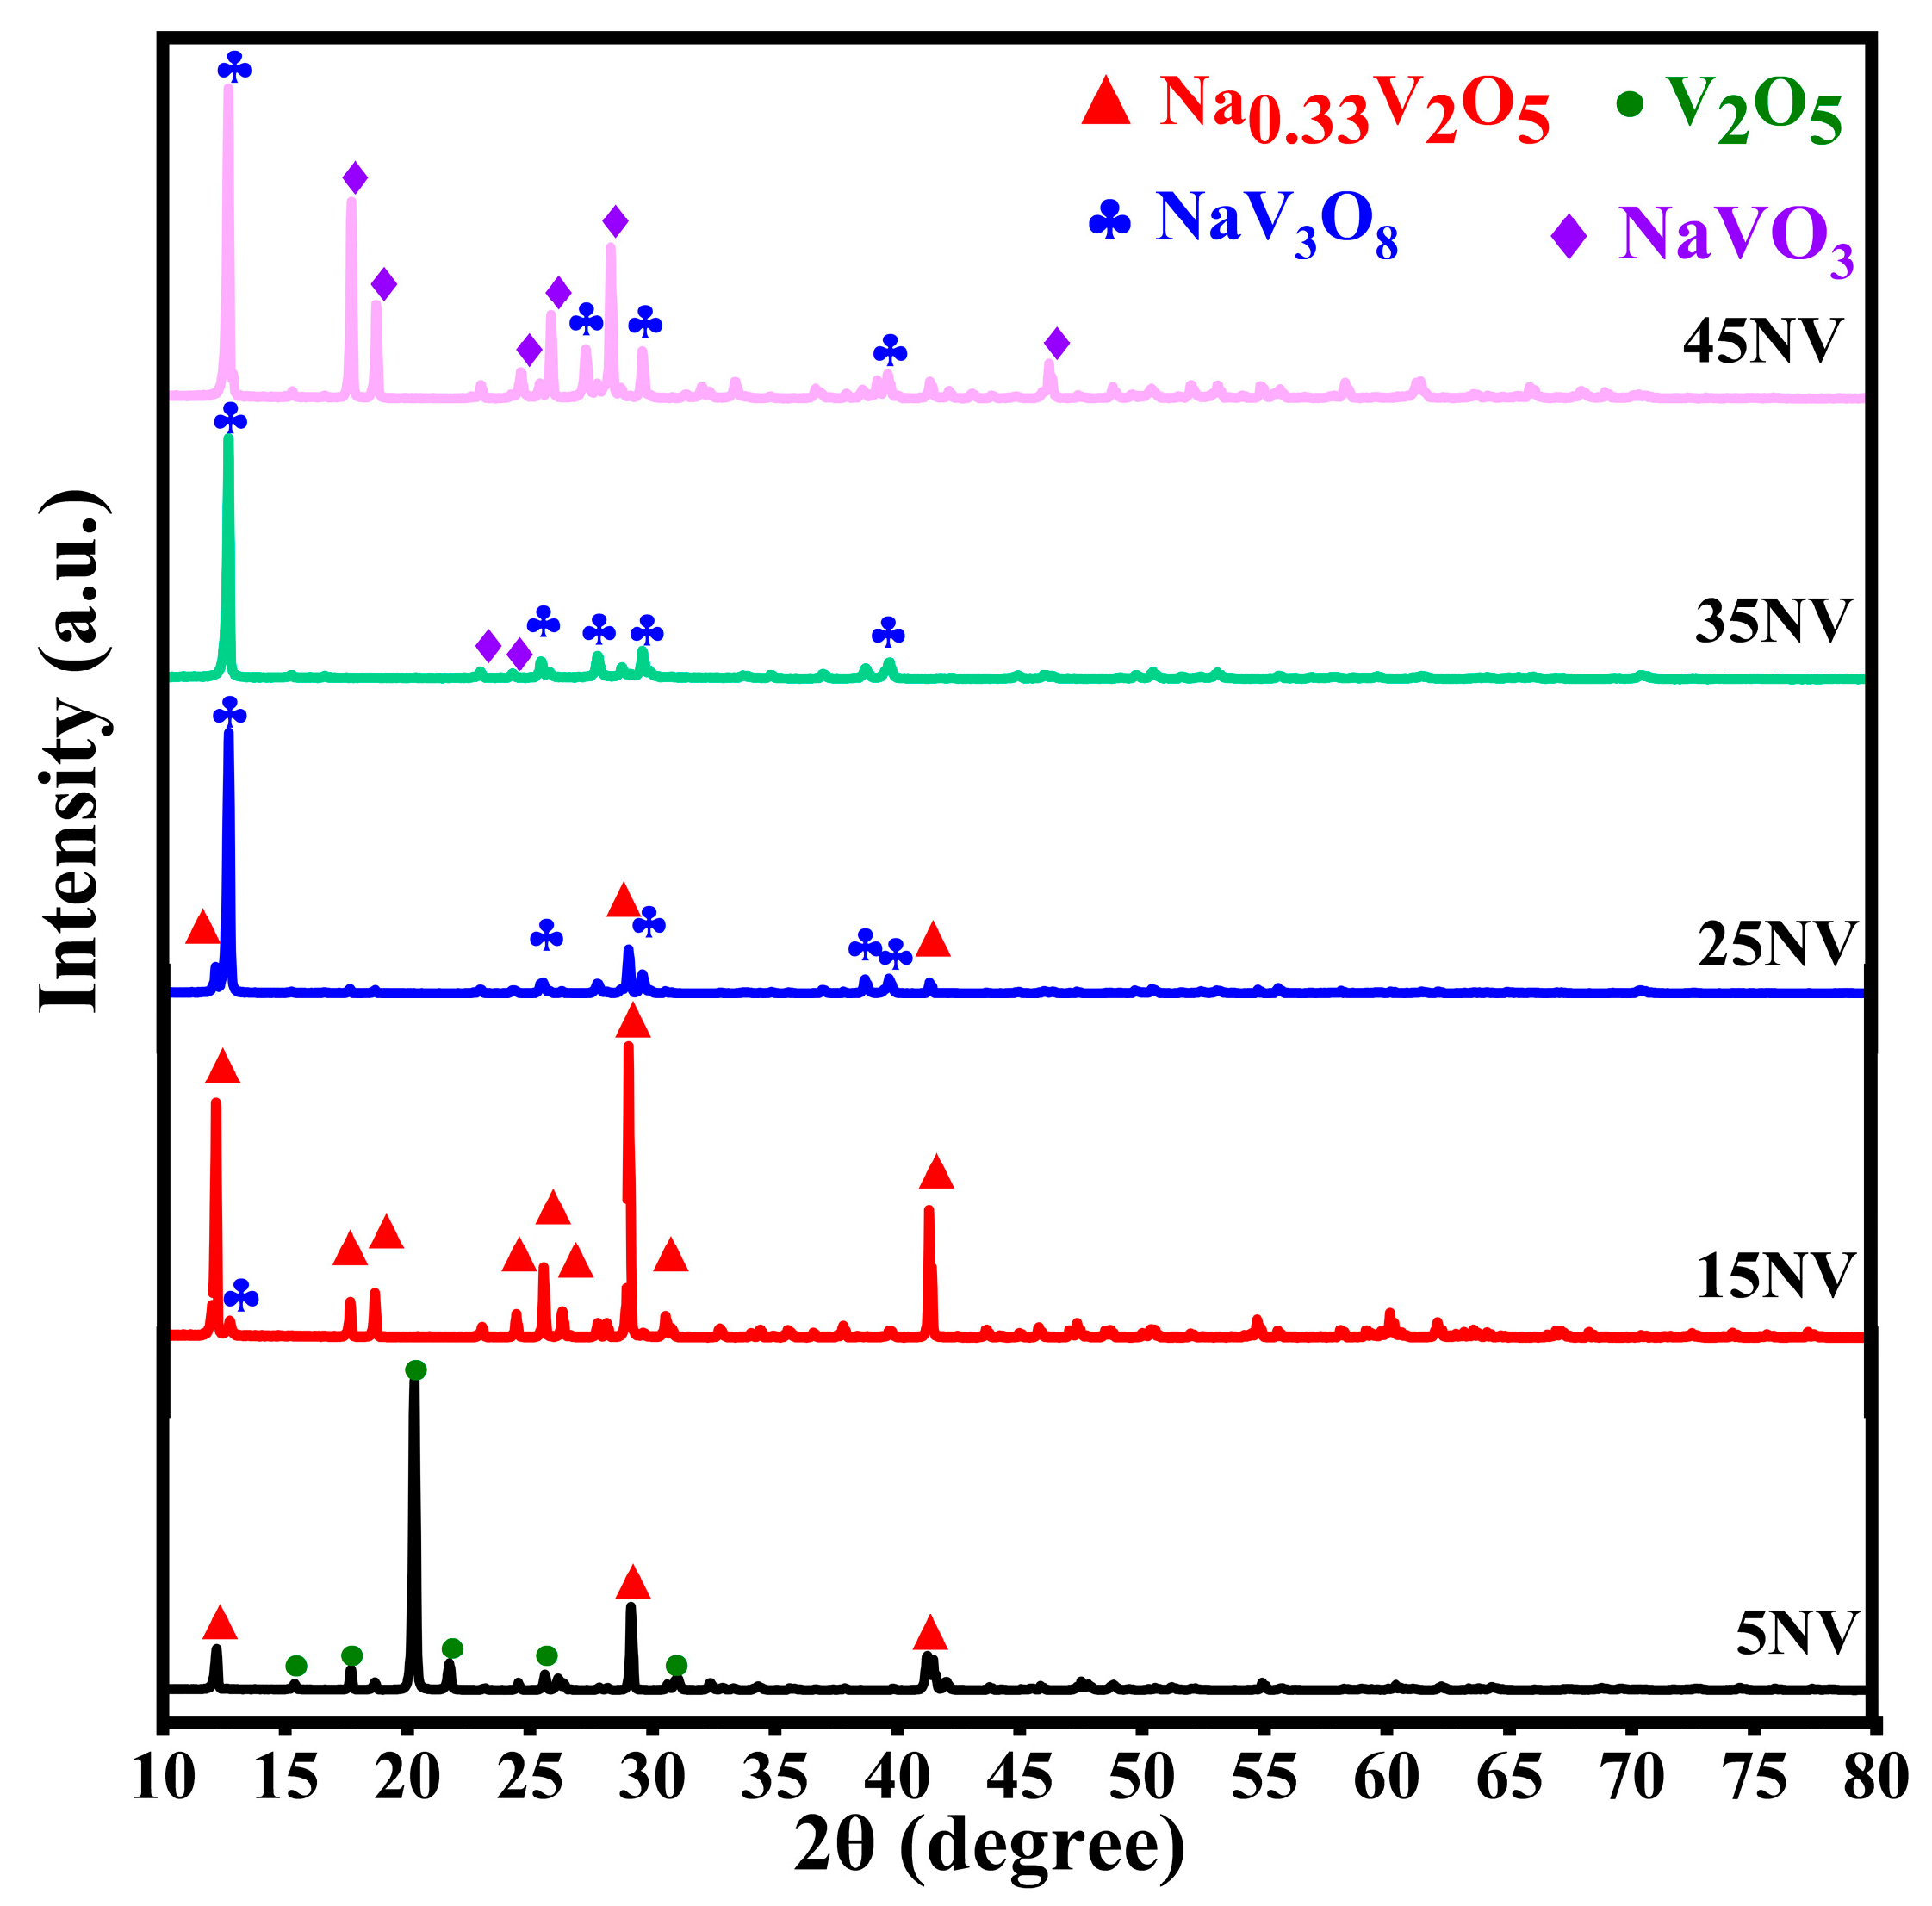
3.1. XRD Patterns of xNV Ceramics
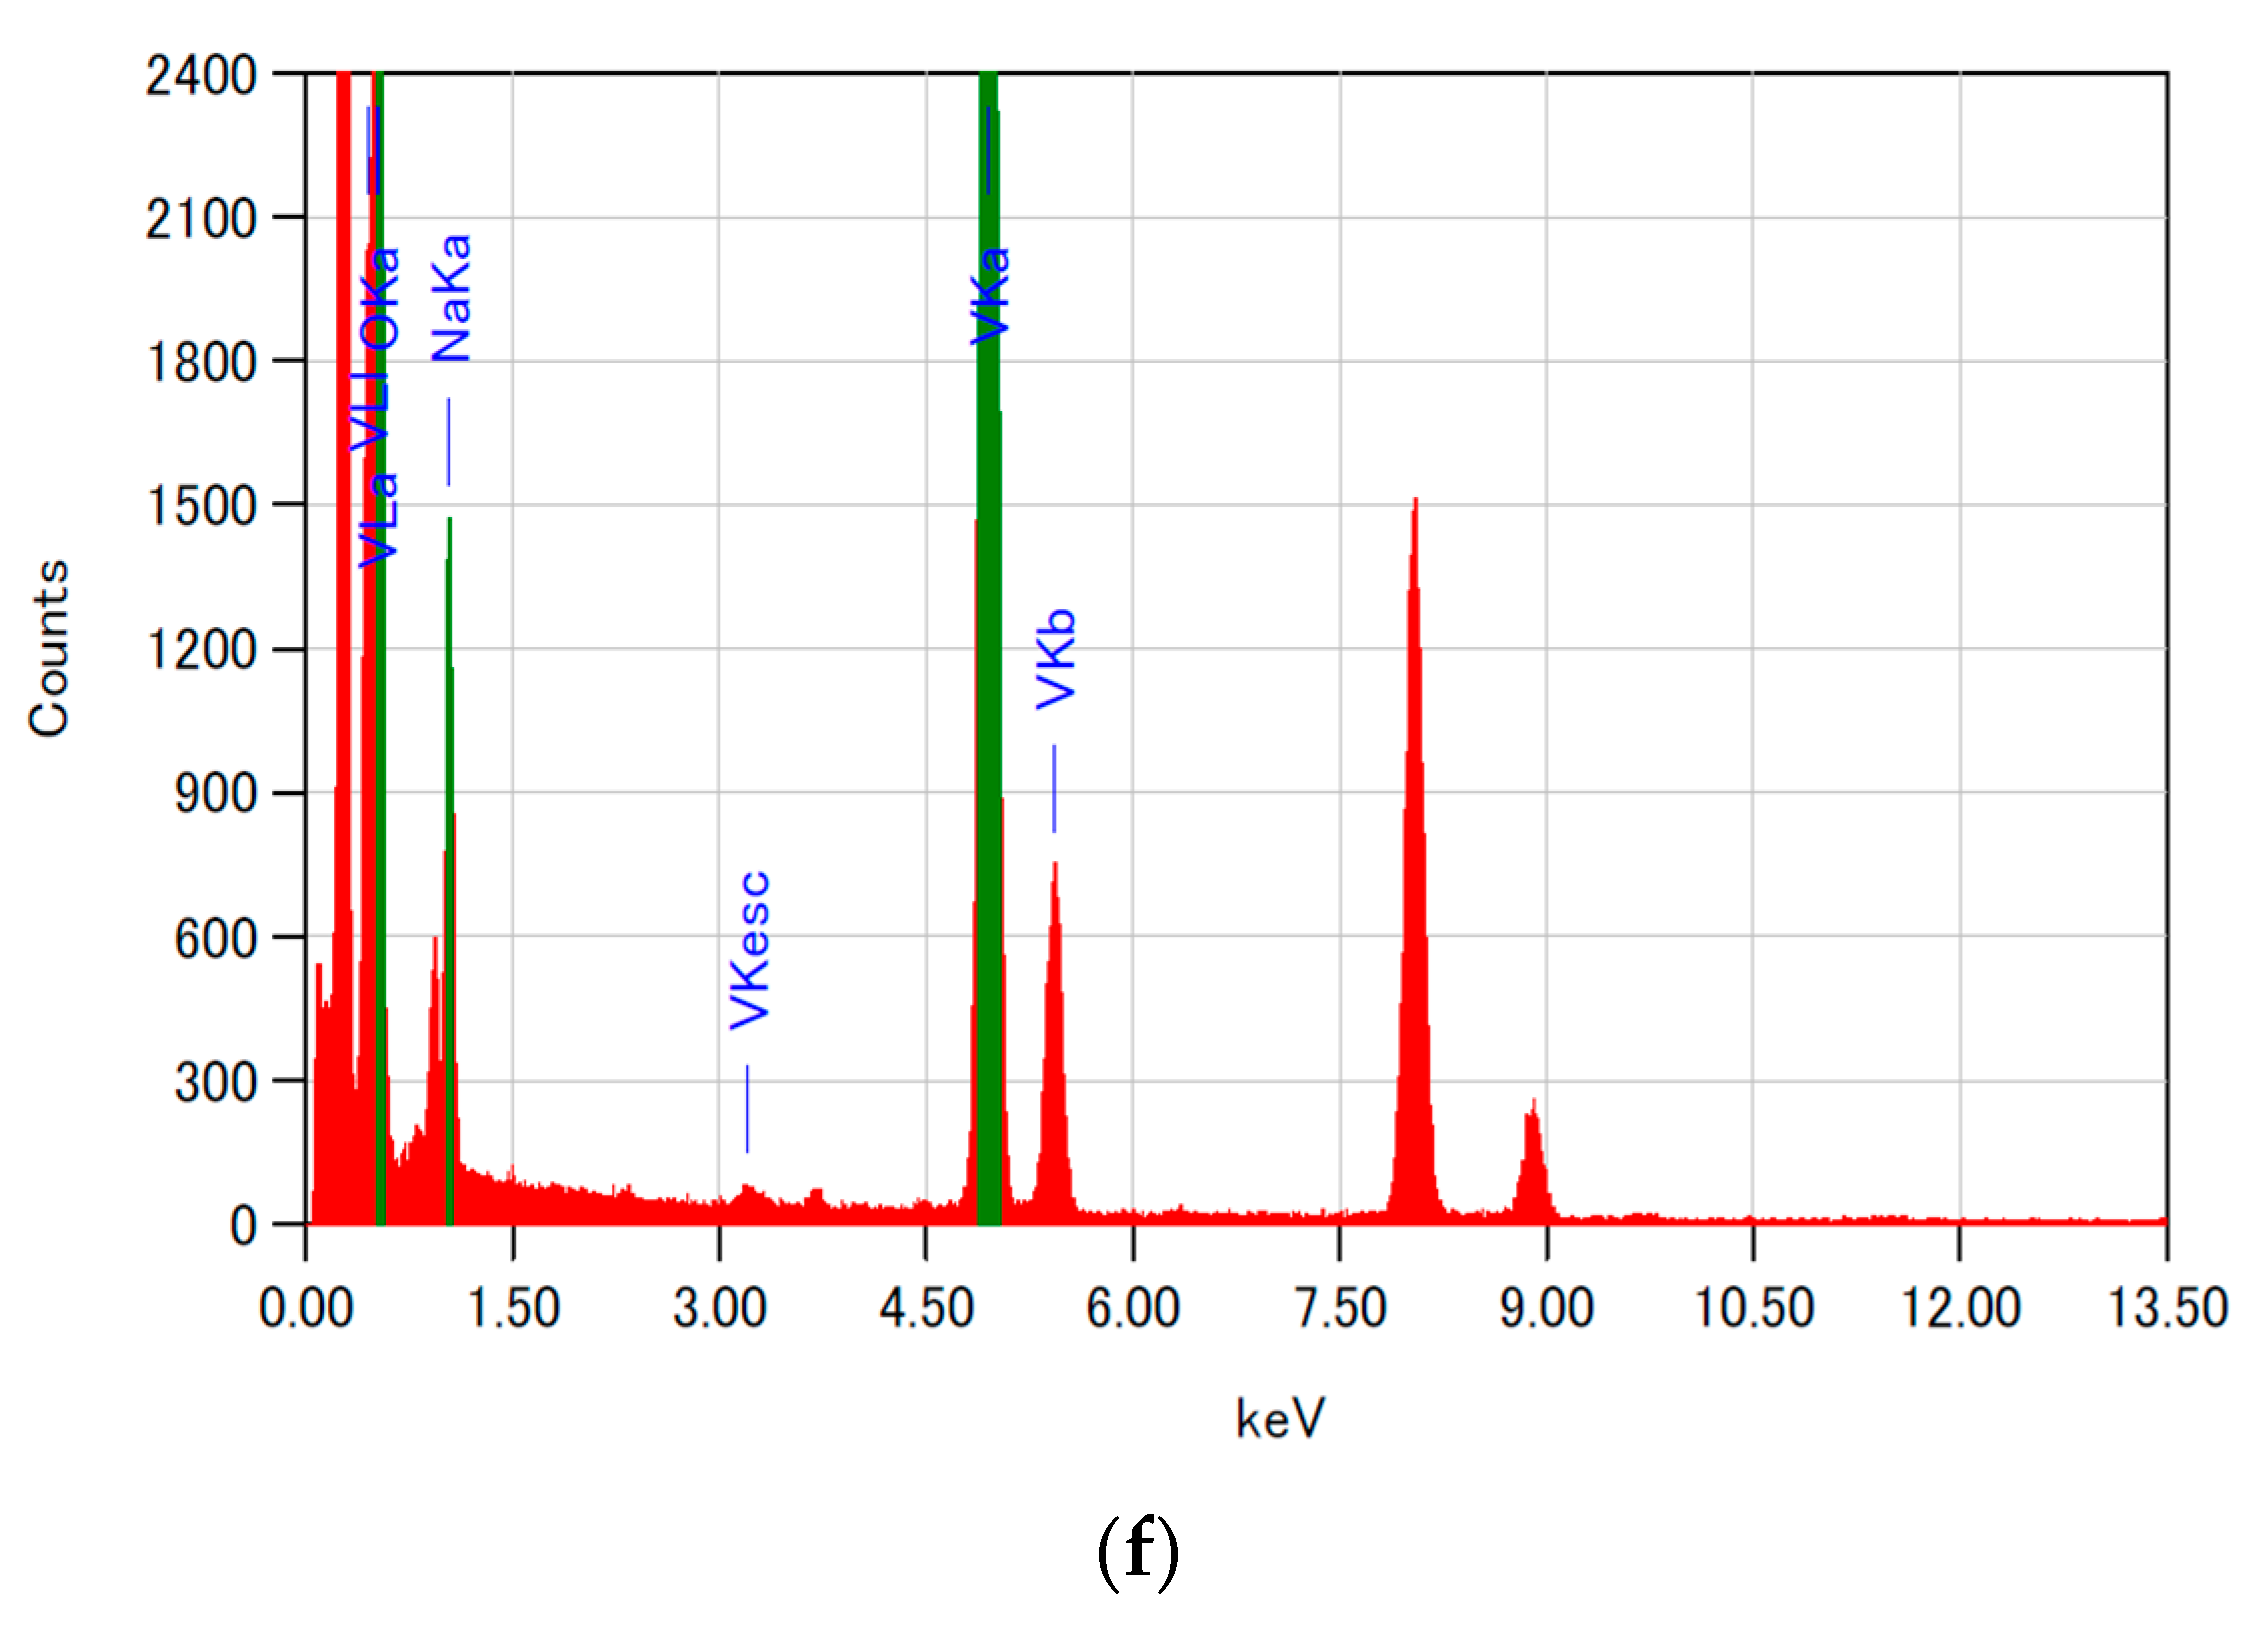
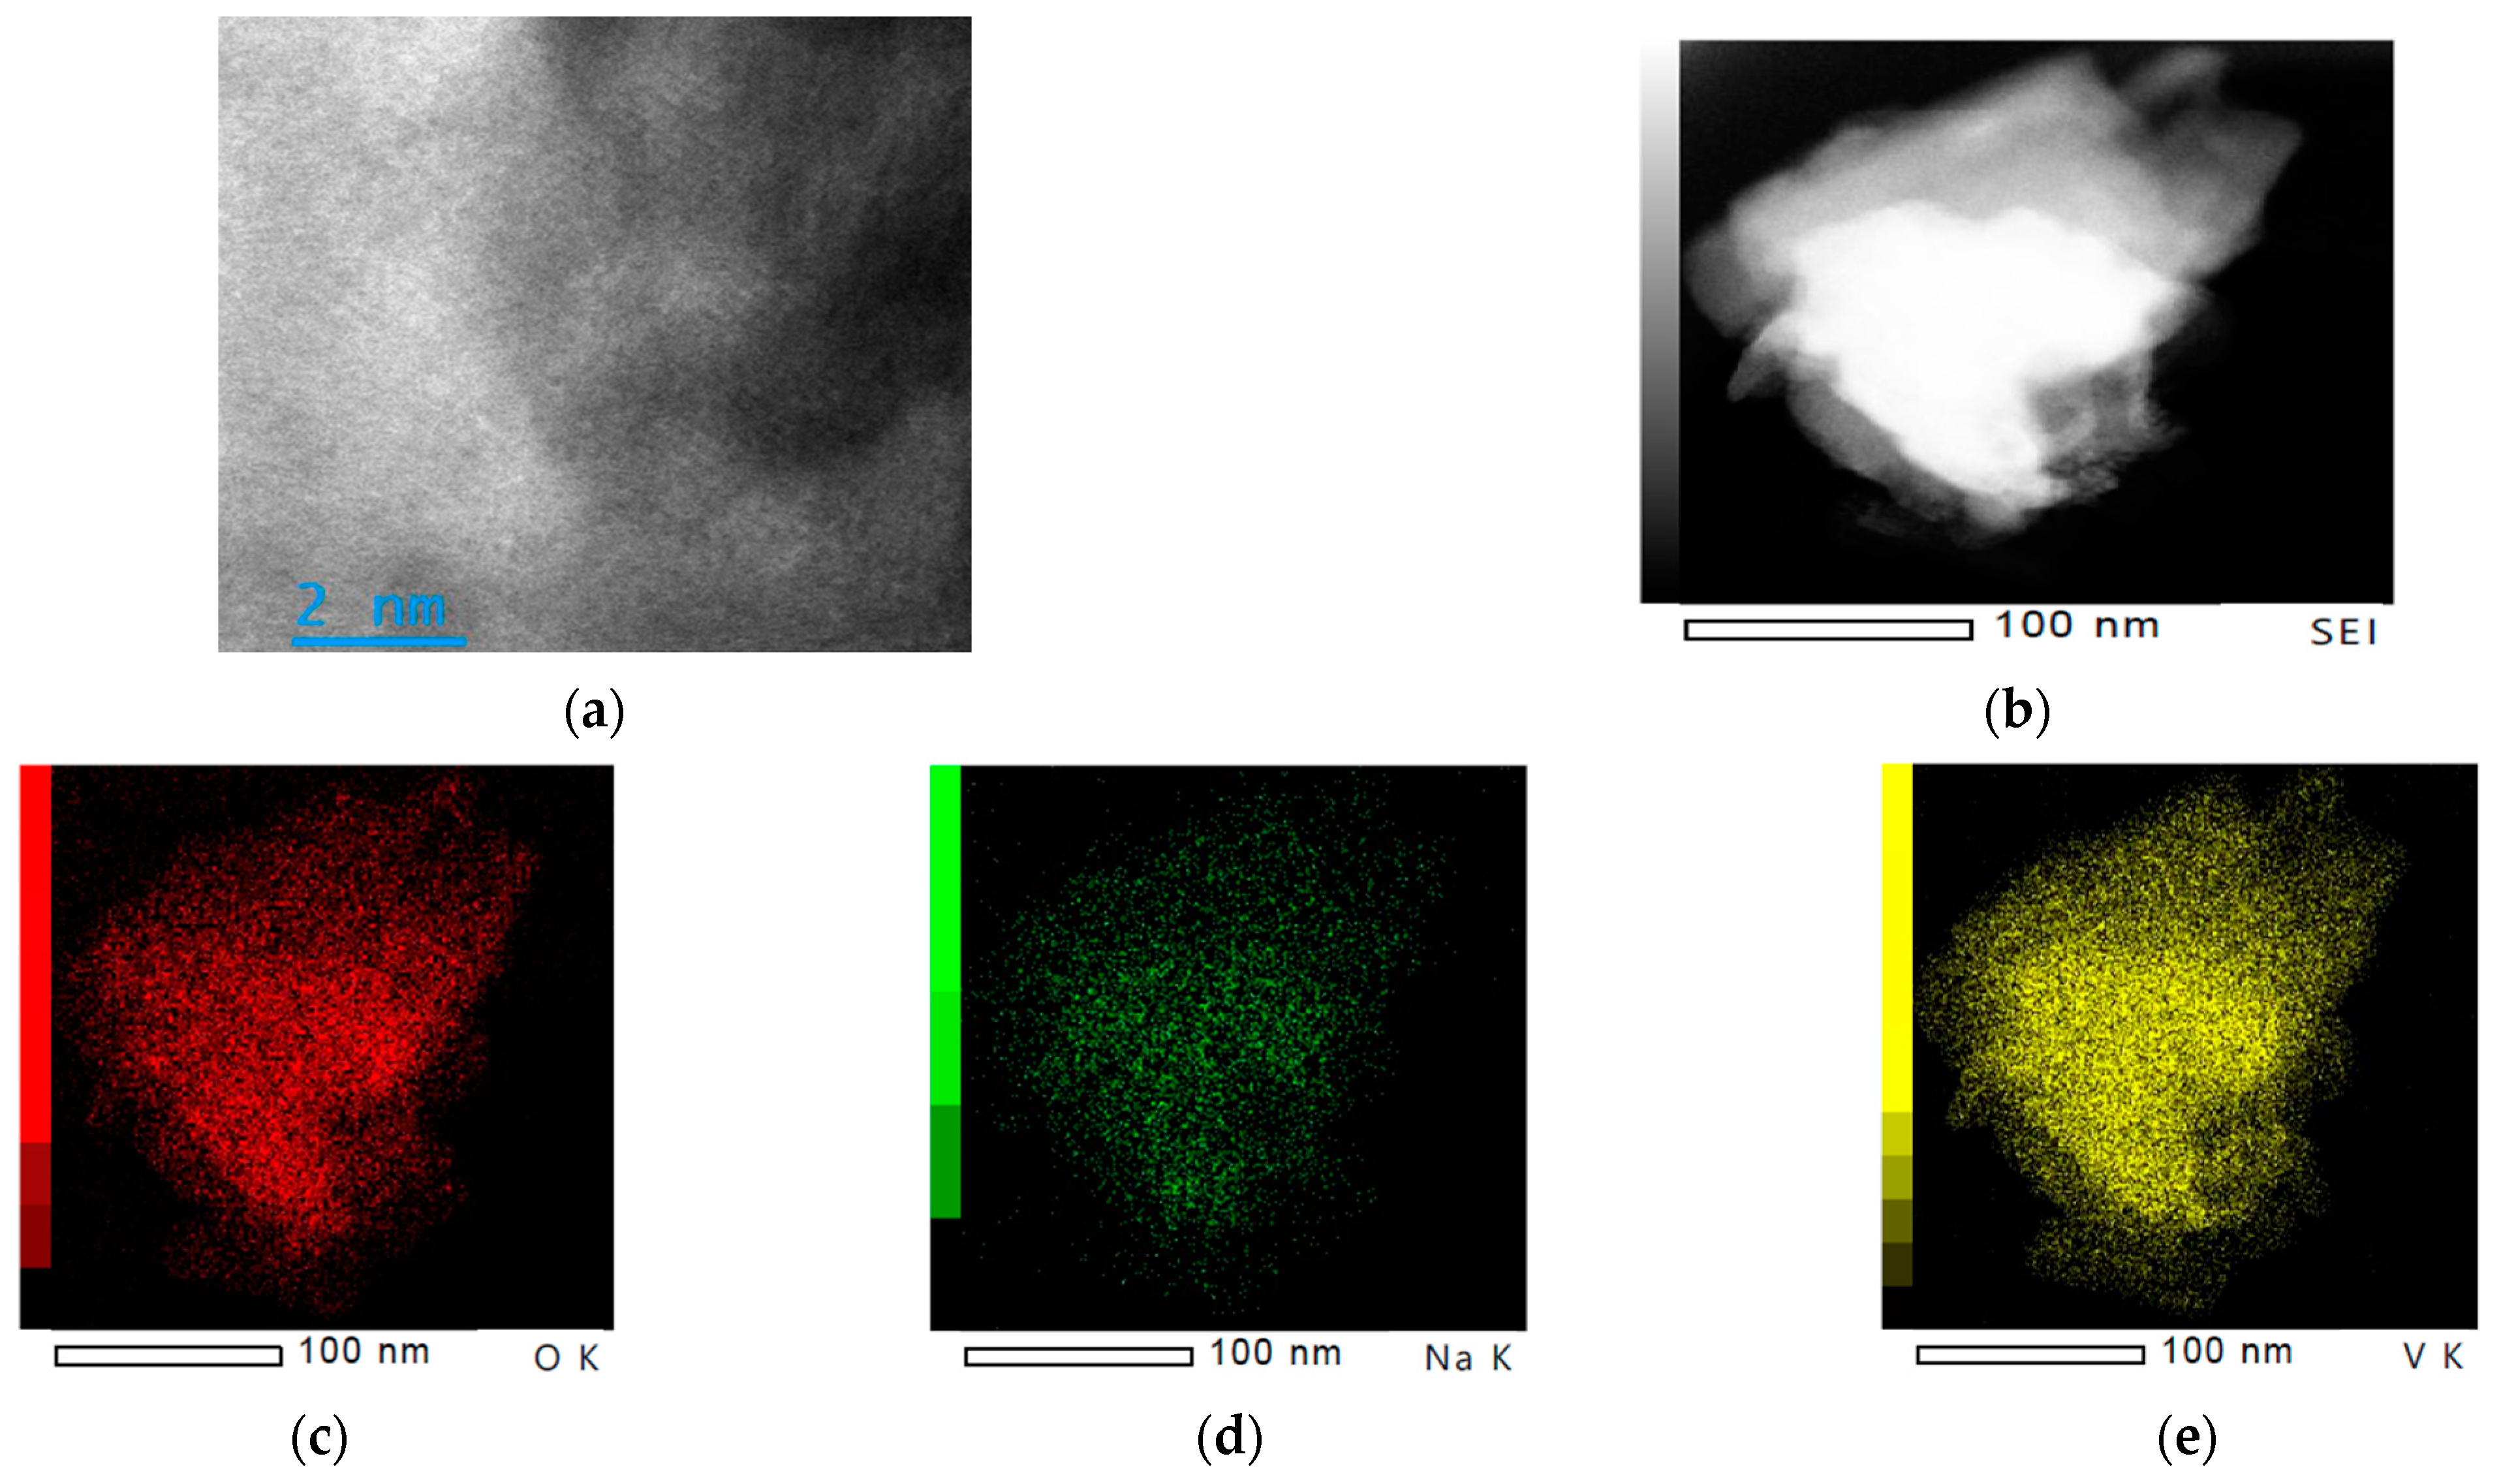
3.2. Morphological Features of 15NV
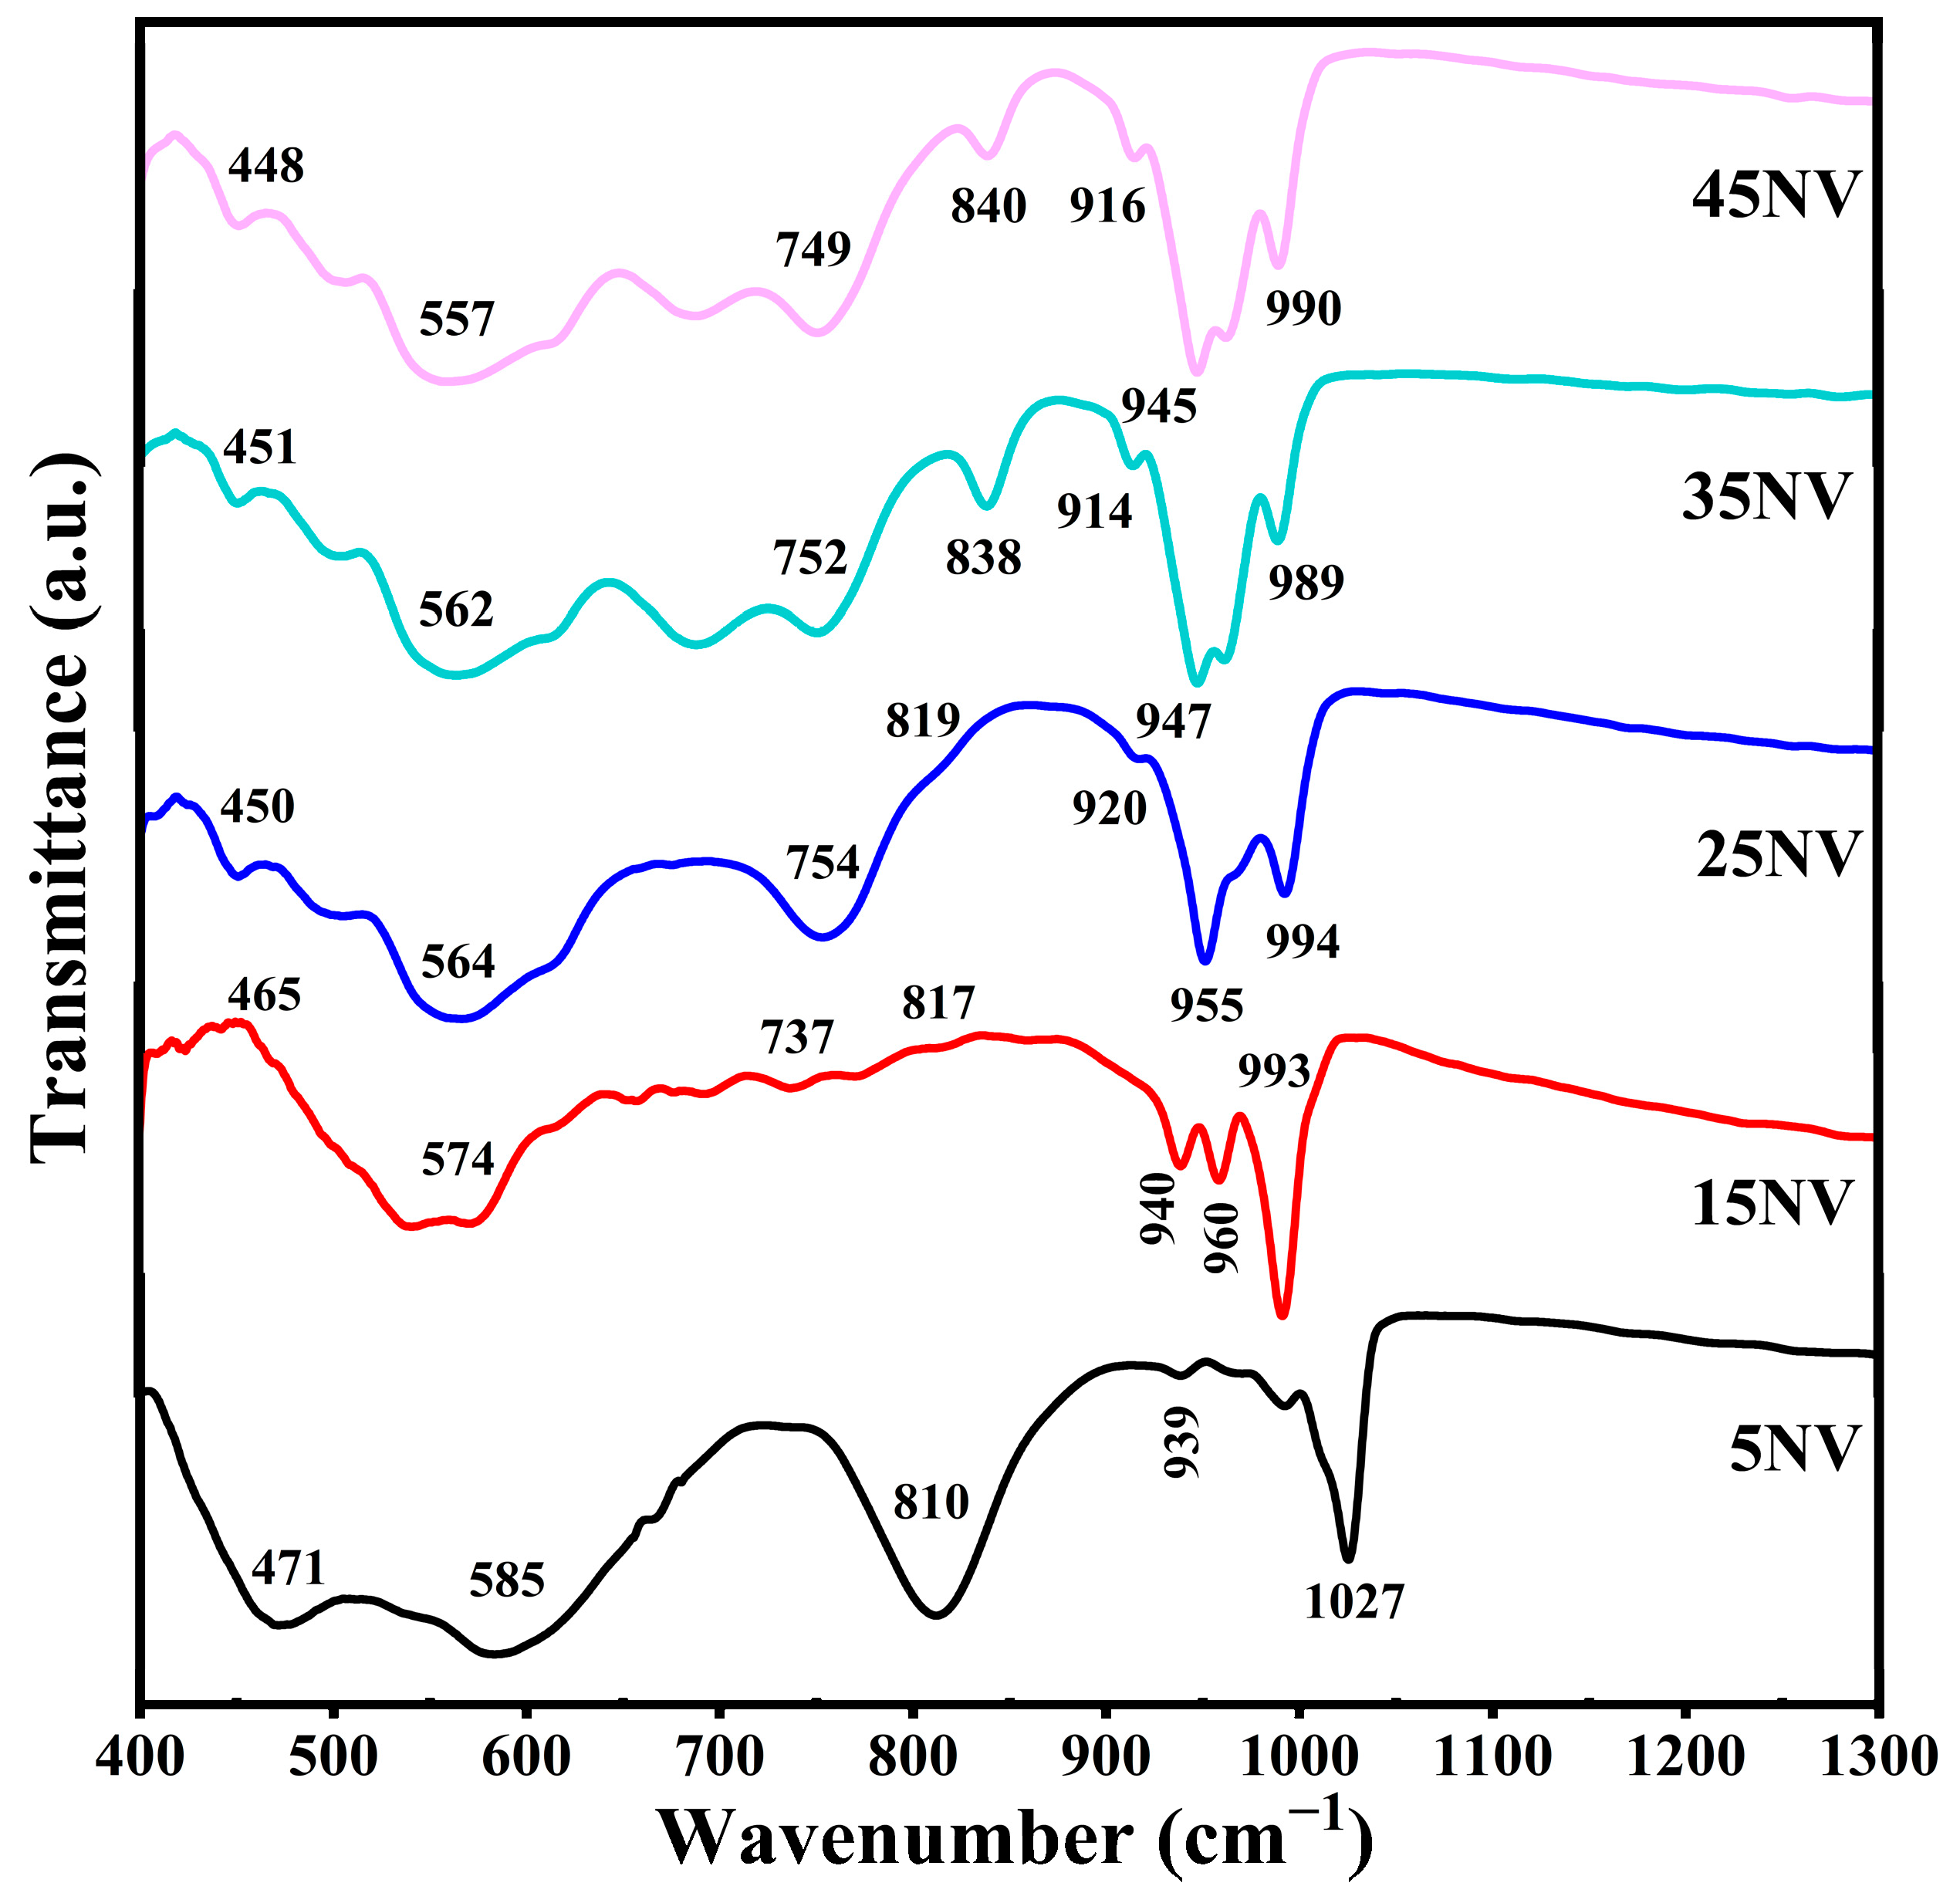
3.3. FTIR Spectra of xNV
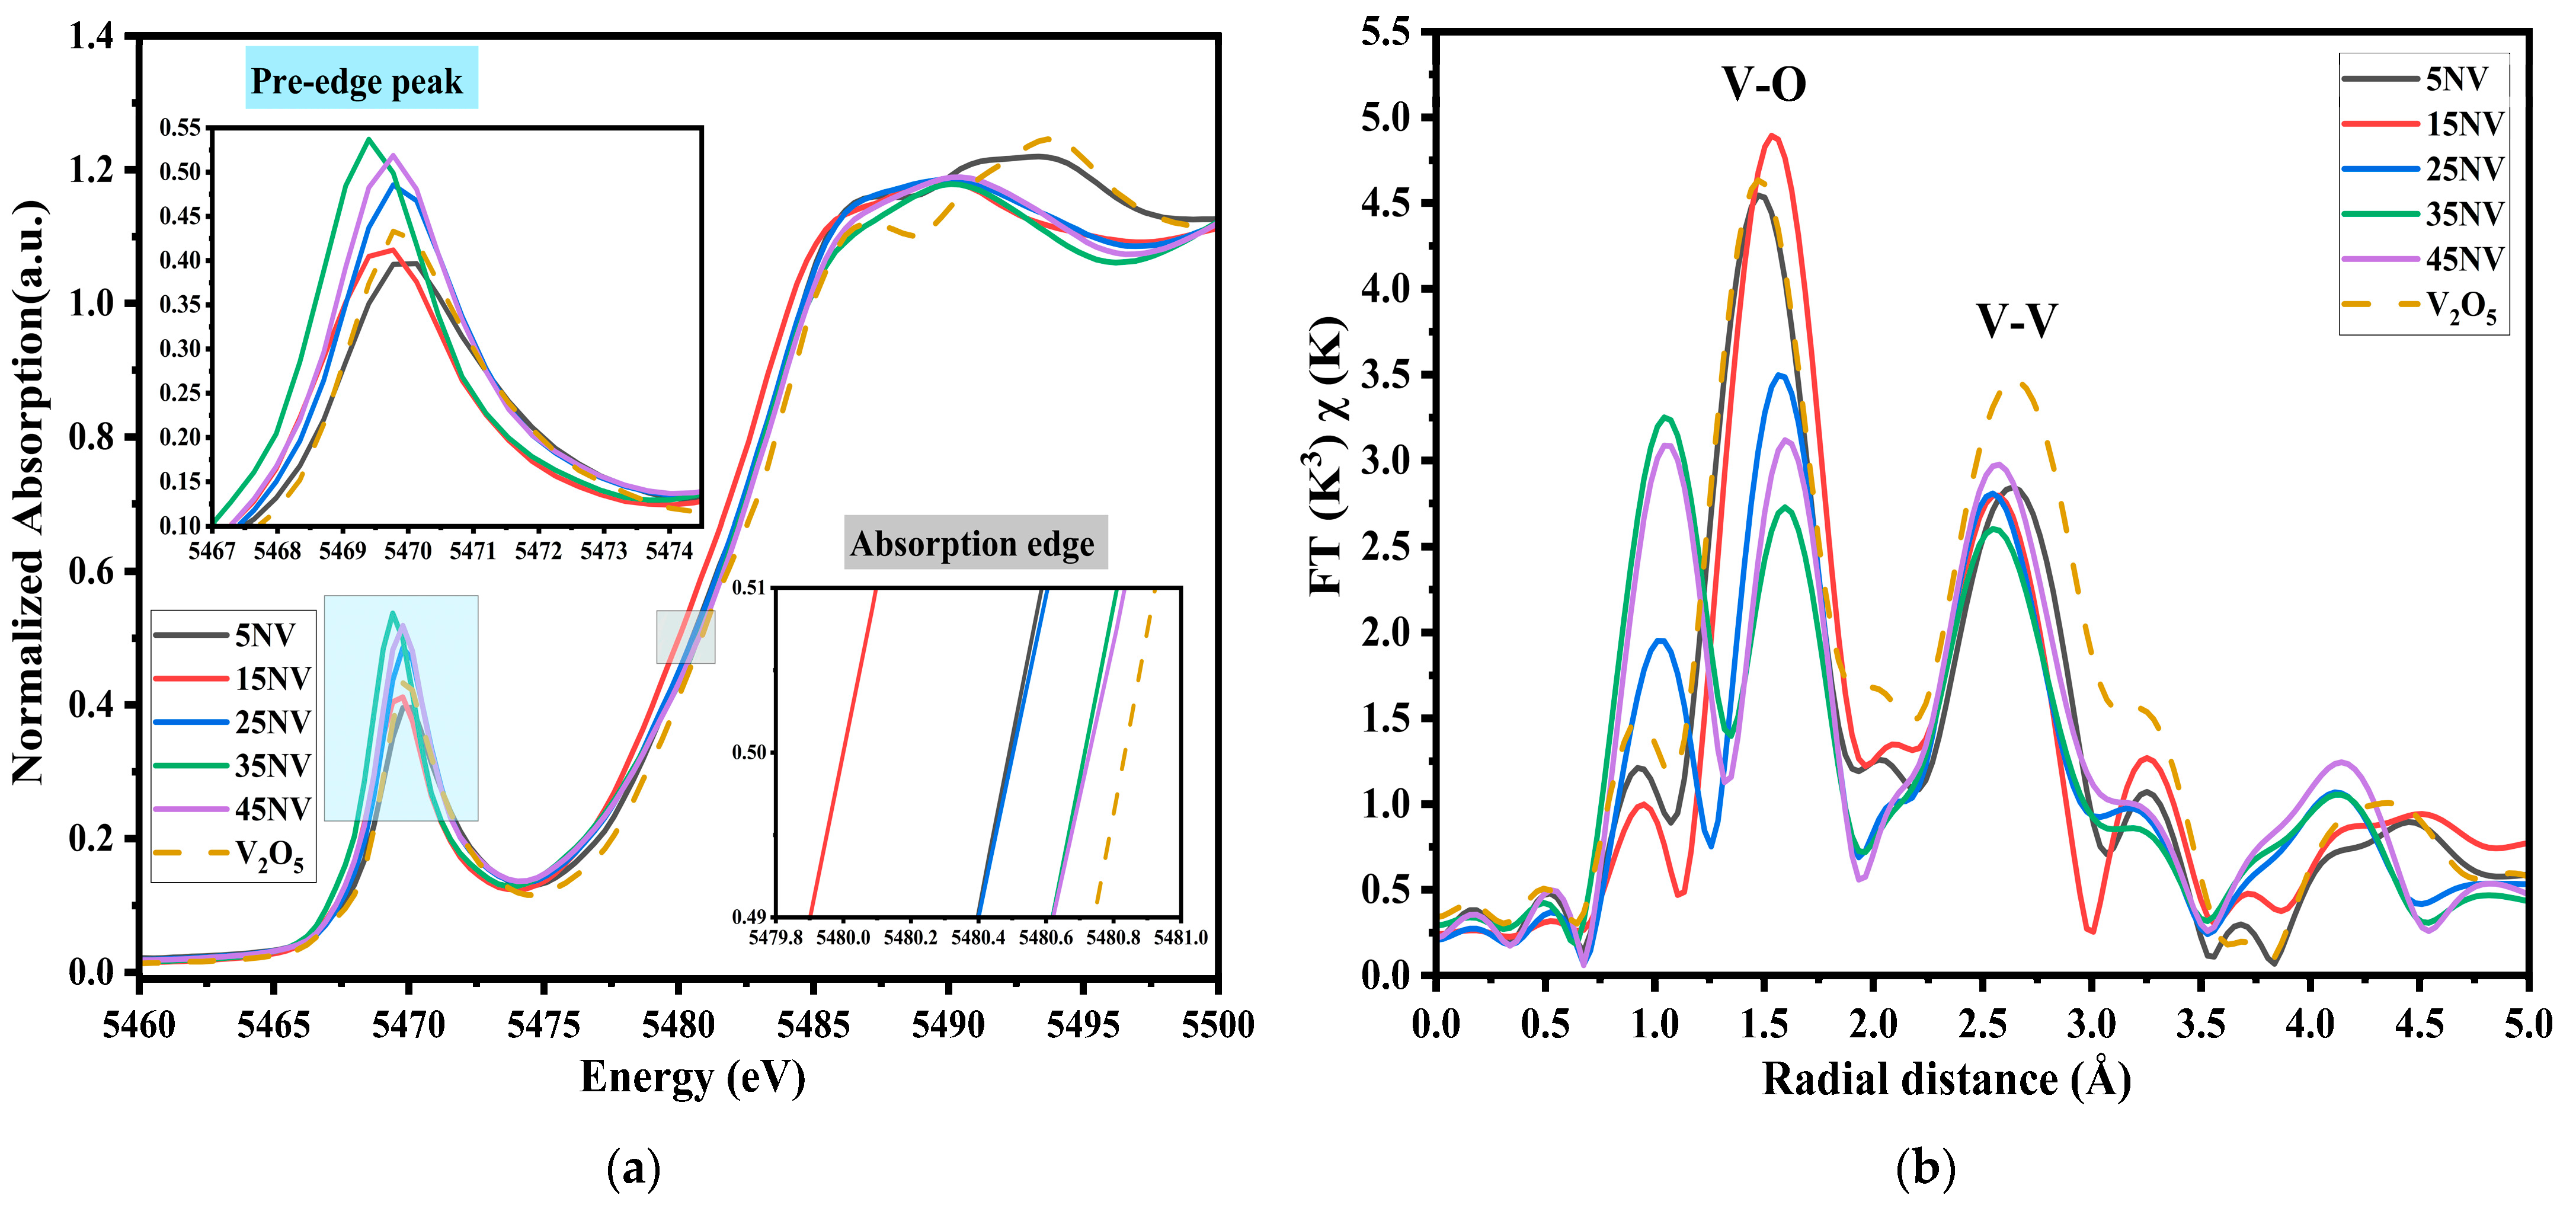
3.4. XAS of xNV
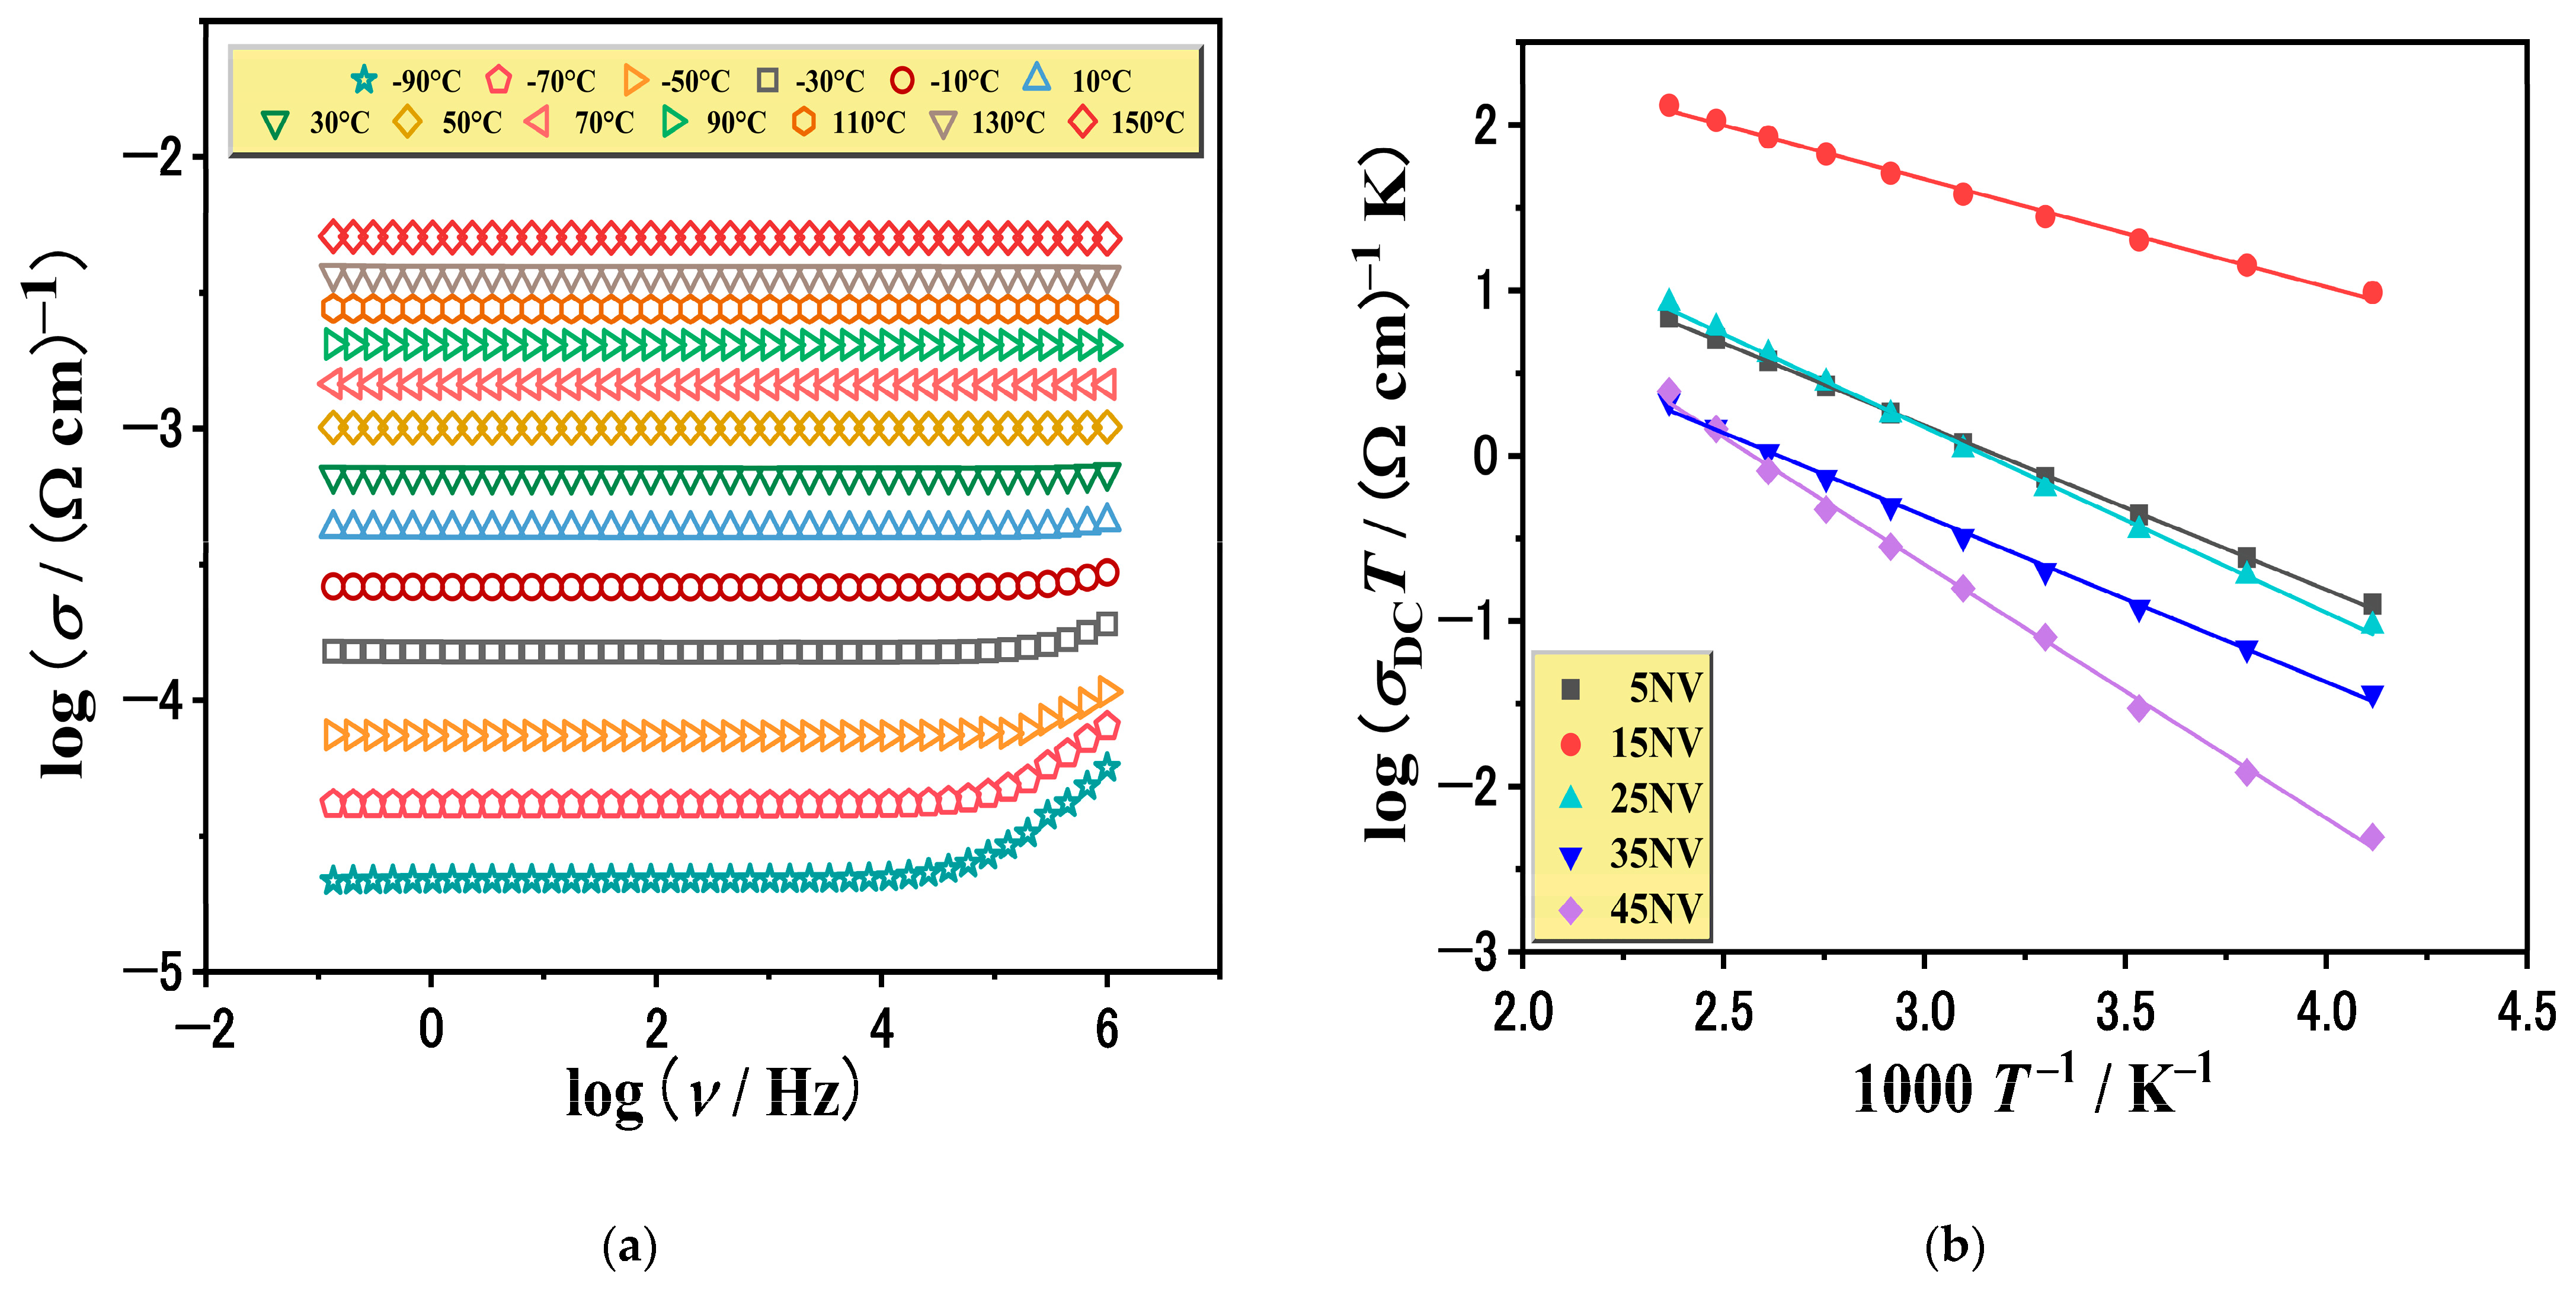
3.5. Electrical Properties of xNV
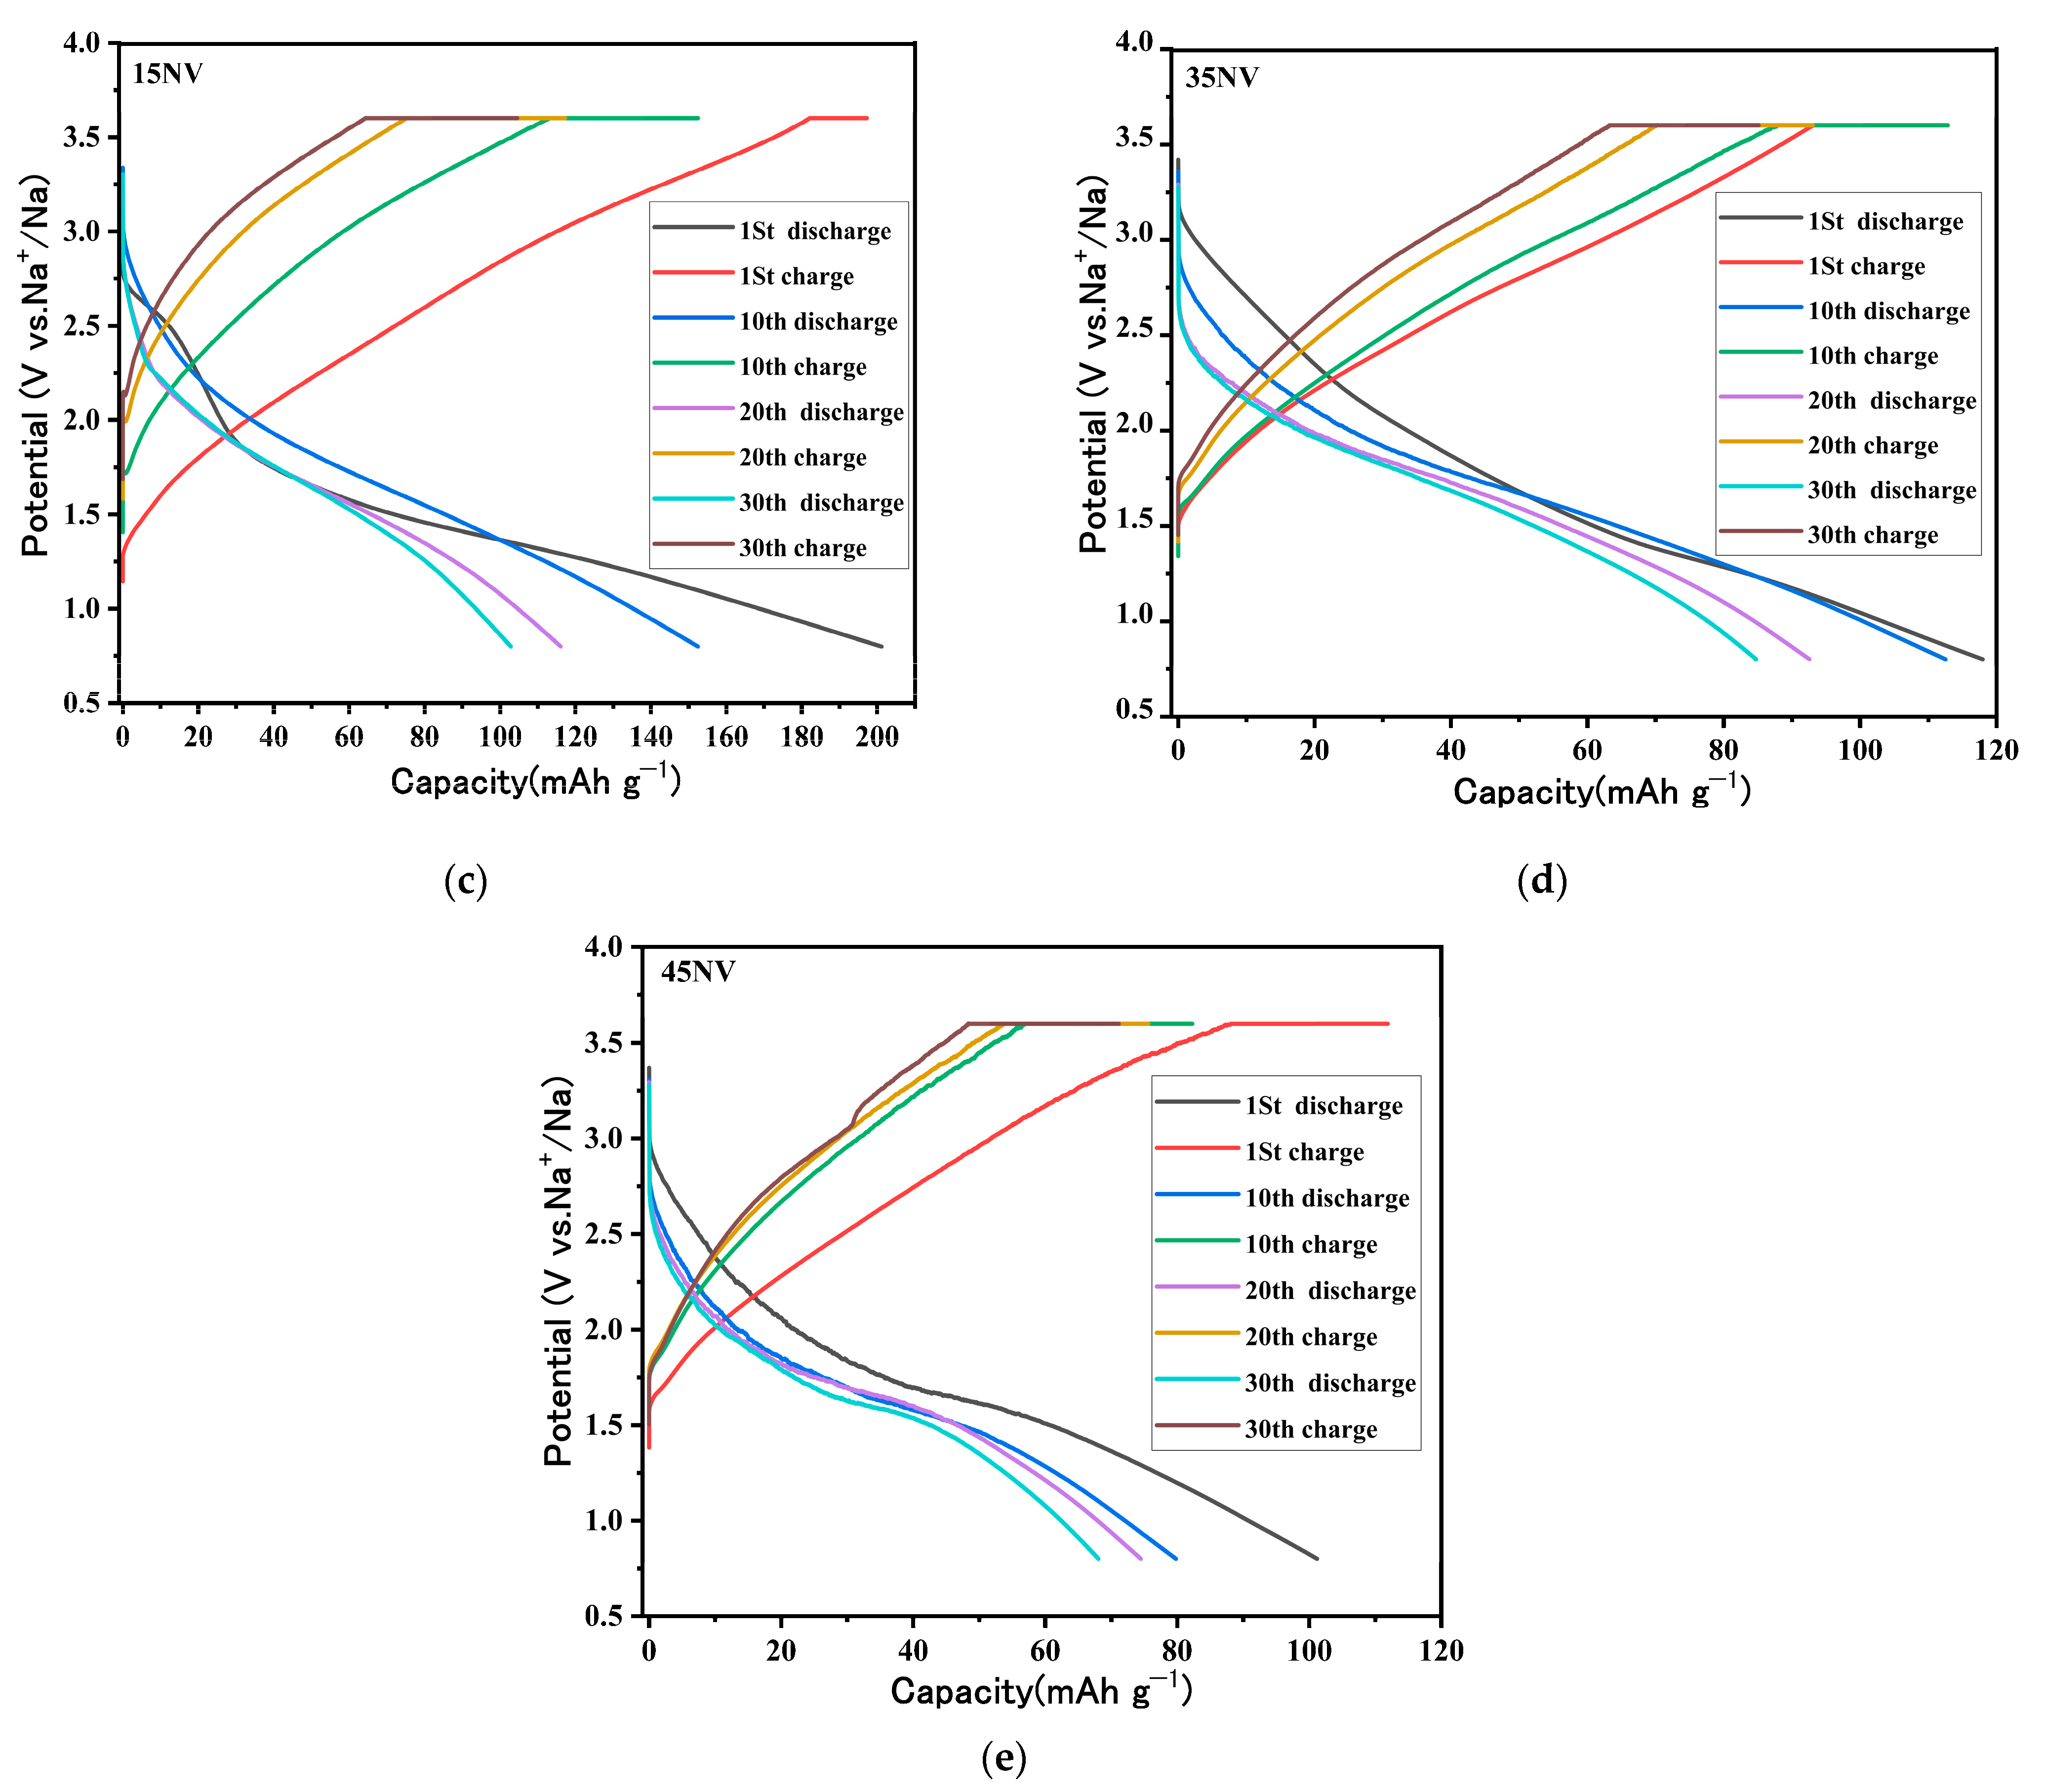
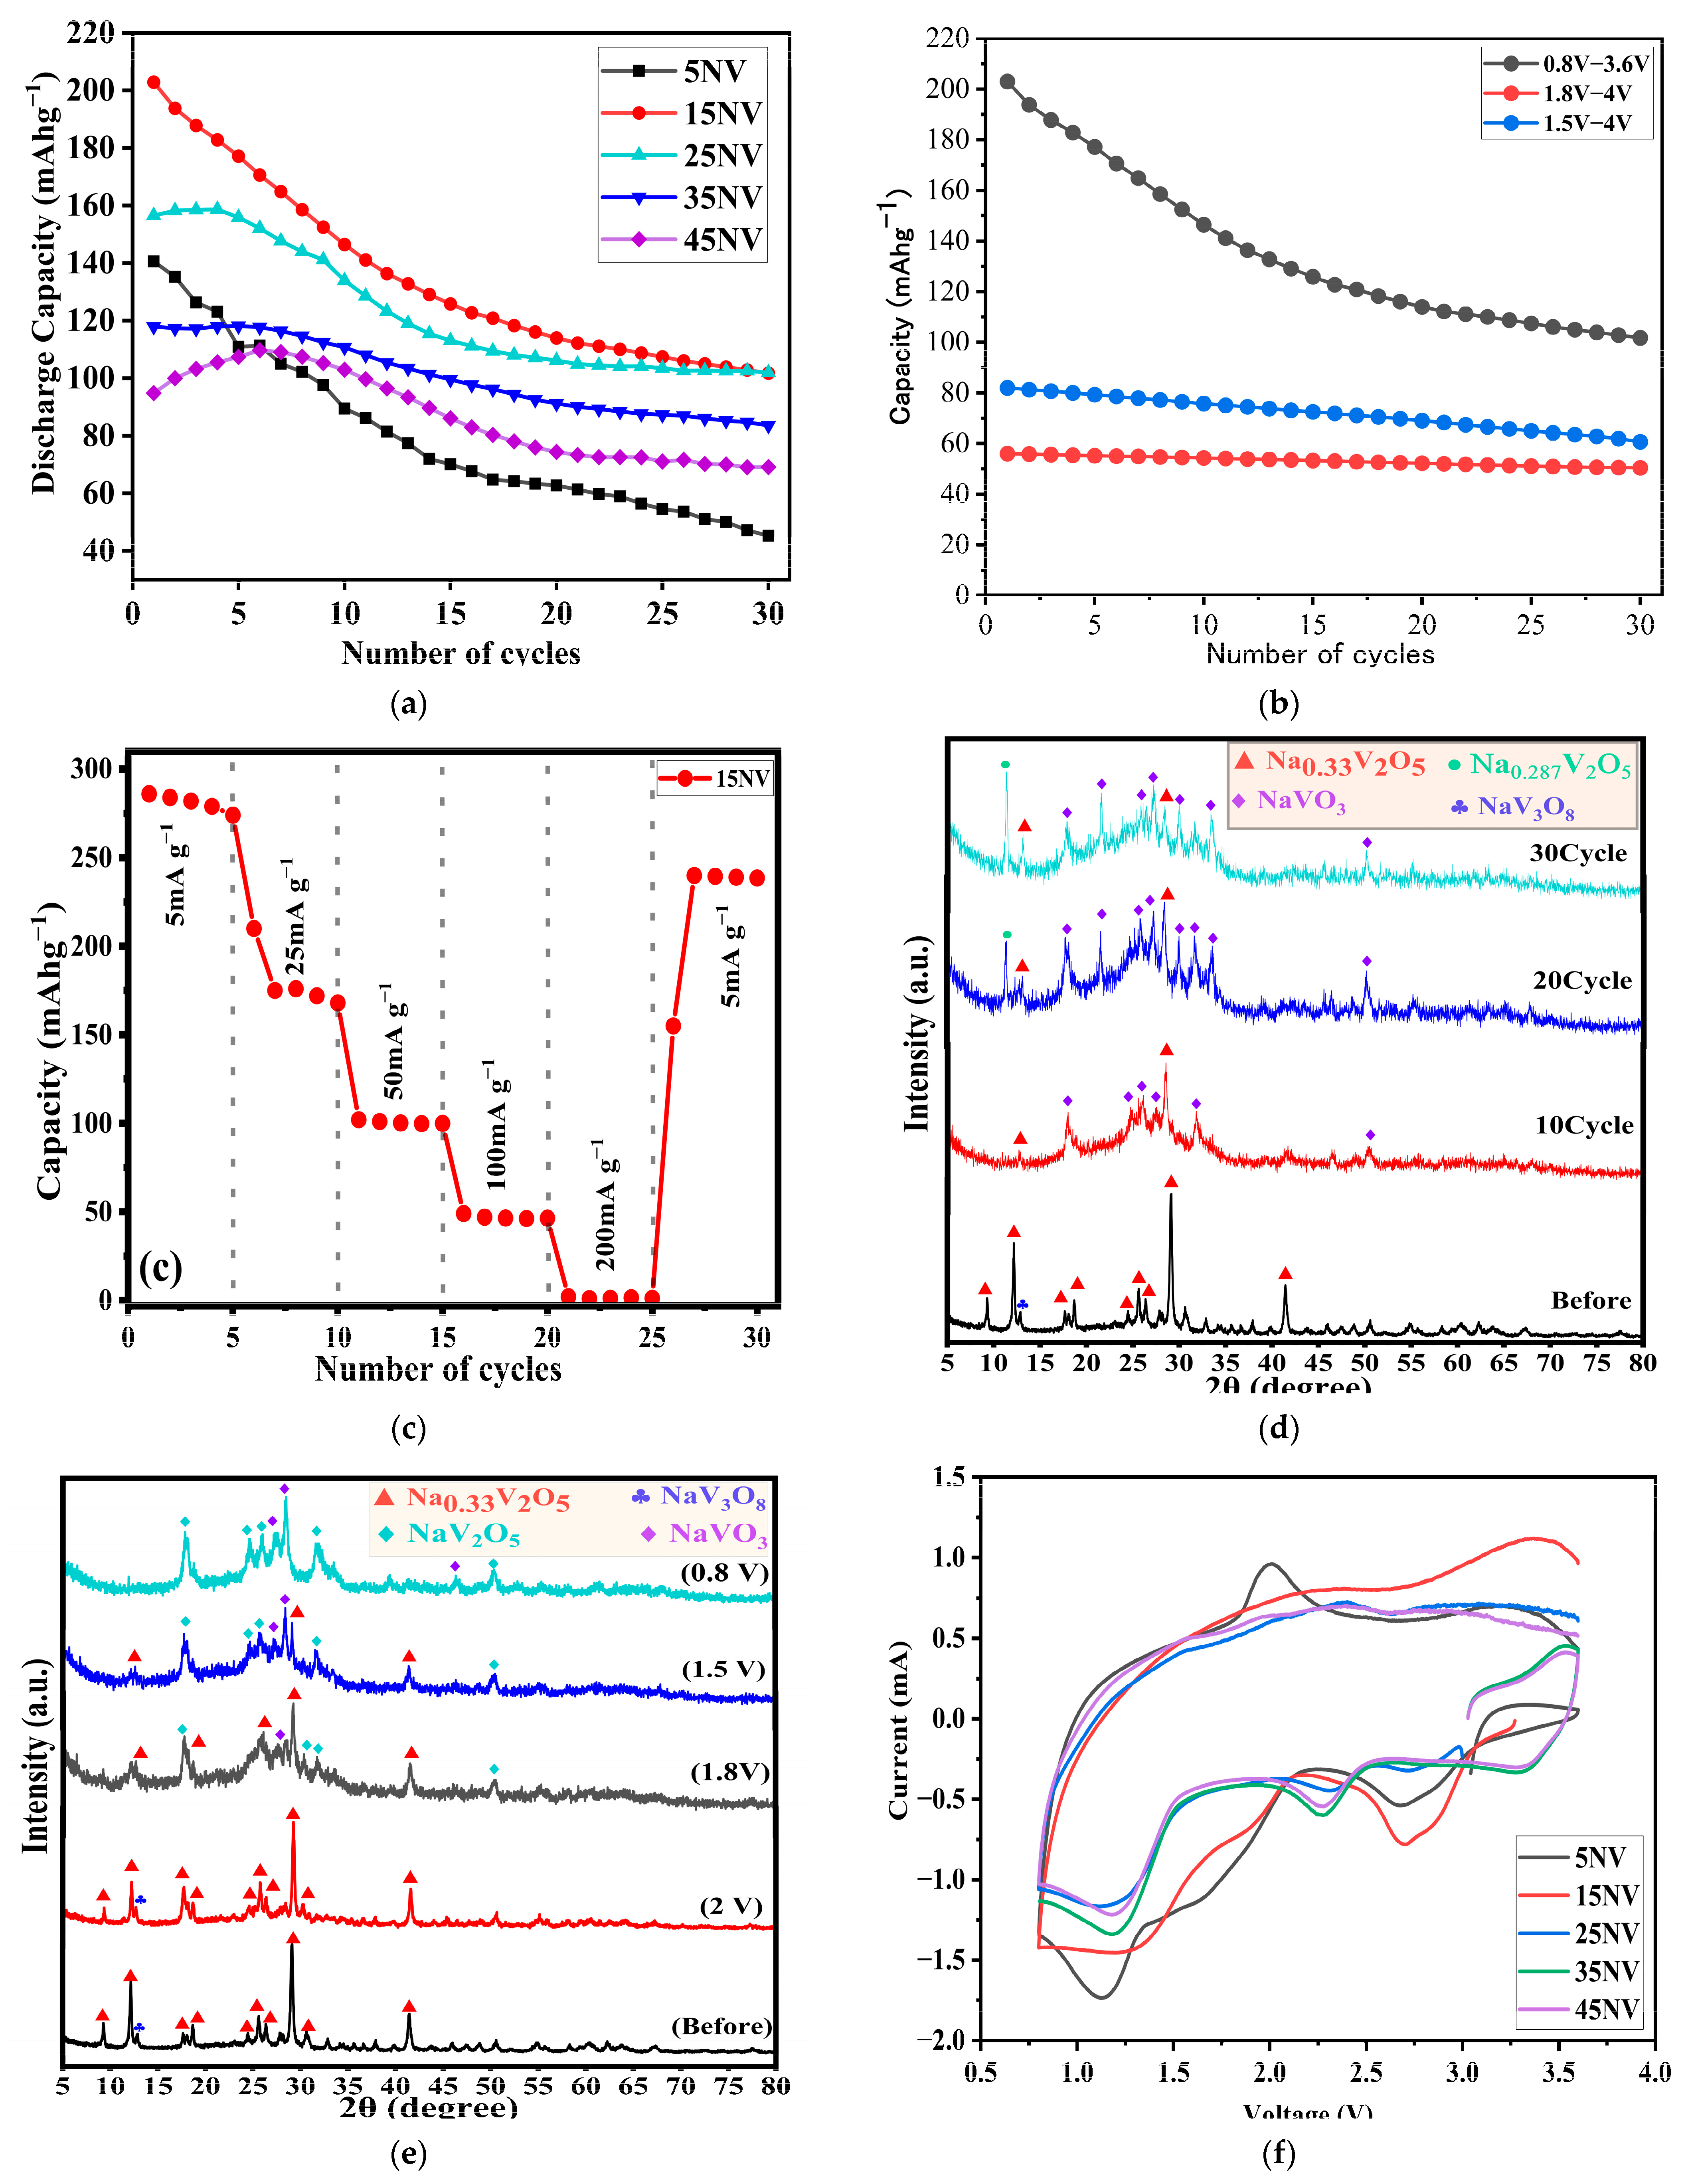
3.6. Electrochemical Properties of xNV
4. Conclusions
Author Contributions
Funding
Data Availability Statement
Conflicts of Interest
References
- Kim, T.; Song, W.; Son, D.-Y.; Ono, L.K.; Qi, Y. Lithium-ion batteries: Outlook on present, future, and hybridized technologies. J. Mater. Chem. A 2019, 7, 2942–2964. [Google Scholar] [CrossRef]
- Li, S.; Dong, Y.; Xu, L.; Xu, X.; He, L.; Mai, L. Effect of carbon matrix dimensions on the electrochemical properties of Na3V2(PO4)3 nanograins for high-performance symmetric sodium-ion batteries. Adv. Mater. 2014, 26, 3545–3553. [Google Scholar] [CrossRef] [PubMed]
- Dong, Y.; Xu, J.; Chen, M.; Guo, Y.; Zhou, G.; Li, N.; Zhou, S.; Wong, C.-P. Self-assembled NaV6O15 flower-like microstructures for high-capacity and long-life sodium-ion battery cathode. Nano Energy 2020, 68, 104357. [Google Scholar] [CrossRef]
- Arroyo-de Dompablo, M.E.; Ponrouch, A.; Johansson, P.; Palacín, M.R. Achievements, challenges, and prospects of calcium batteries. Chem. Rev. 2020, 120, 6331–6357. [Google Scholar] [CrossRef]
- Liu, Y.; Sun, Z.; Tan, K.; Denis, D.K.; Sun, J.; Liang, L.; Hou, L.; Yuan, C. Recent progress in flexible non-lithium based rechargeable batteries. J. Mater. Chem. A 2019, 7, 4353–4382. [Google Scholar] [CrossRef]
- Aurbach, D.; Lu, Z.; Schechter, A.; Gofer, Y.; Gizbar, H.; Turgeman, R.; Cohen, Y.; Moshkovich, M.; Levi, E. Prototype systems for rechargeable magnesium batteries. Nature 2000, 407, 724–727. [Google Scholar] [CrossRef]
- Kim, K.S.; Lee, S.; Ting, T.O.; Yang, X.-S. Atomic scheduling of appliance energy consumption in residential smart grids. Energies 2019, 12, 3666. [Google Scholar] [CrossRef]
- Yabuuchi, N.; Kubota, K.; Dahbi, M.; Komaba, S. Research development on sodium-ion batteries. Chem. Rev. 2014, 114, 11636–11682. [Google Scholar] [CrossRef]
- Jin, T.; Li, H.; Zhu, K.; Wang, P.-F.; Liu, P.; Jiao, L. Polyanion-type cathode materials for sodium-ion batteries. Chem. Soc. Rev. 2020, 49, 2342–2377. [Google Scholar] [CrossRef]
- Slater, M.D.; Kim, D.; Lee, E.; Johnson, C.S. Sodium-ion batteries. Adv. Funct. Mater. 2013, 23, 947–958. [Google Scholar] [CrossRef]
- Wei, T.; Tang, Z.; Yu, Q.; Chen, H. Smart antibacterial surfaces with switchable bacteria-killing and bacteria-releasing capabilities. ACS Appl. Mater. Interfaces 2017, 9, 37511–37523. [Google Scholar] [CrossRef] [PubMed]
- Wang, T.; Su, D.; Shanmukaraj, D.; Rojo, T.; Armand, M.; Wang, G. Electrode materials for sodium-ion batteries: Considerations on crystal structures and sodium storage mechanisms. Electrochem. Energy Rev. 2018, 1, 200–237. [Google Scholar] [CrossRef]
- Ibrahim, A.; Shiraishi, M.; Homonnay, Z.; Krehula, S.; Marciuš, M.; Bafti, A.; Pavić, L.; Kubuki, S. Photocatalytic and Cathode Active Abilities of Ni-Substituted α-FeOOH Nanoparticles. Int. J. Mol. Sci. 2023, 24, 14300. [Google Scholar] [CrossRef]
- Yabuuchi, N.; Yoshida, H.; Komaba, S. Crystal structures and electrode performance of alpha-NaFeO2 for rechargeable sodium batteries. Electrochemistry 2012, 80, 716–719. [Google Scholar] [CrossRef]
- Sun, S.; Chen, Y.; Cheng, J.; Tian, Z.; Wang, C.; Wu, G.; Liu, C.; Wang, Y.; Guo, L. Constructing dimensional gradient structure of Na3V2(PO4)3/C@CNTs-WC by wolfram substitution for superior sodium storage. Chem. Eng. J. 2021, 420, 130453. [Google Scholar] [CrossRef]
- Tepavcevic, S.; Xiong, H.; Stamenkovic, V.R.; Zuo, X.; Balasubramanian, M.; Prakapenka, V.B.; Johnson, C.S.; Rajh, T. Nanostructured bilayered vanadium oxide electrodes for rechargeable sodium-ion batteries. ACS Nano 2011, 6, 530–538. [Google Scholar] [CrossRef]
- Raju, V.; Rains, J.; Gates, C.; Luo, W.; Wang, X.; Stickle, W.F.; Stucky, G.D.; Ji, X. Superior Cathode of Sodium-Ion Batteries: Orthorhombic V2O5 Nanoparticles Generated in Nanoporous Carbon by Ambient Hydrolysis Deposition. Nano Lett. 2014, 14, 4119–4124. [Google Scholar] [CrossRef]
- Yuan, S.; Liu, Y.-B.; Xu, D.; Ma, D.-L.; Wang, S.; Yang, X.-H.; Cao, Z.-Y.; Zhang, X.-B. Pure Single-Crystalline Na1.1V3O7.9 Nanobelts as Superior Cathode Materials for Rechargeable Sodium-Ion Batteries. Adv. Sci. 2015, 2, 1400018. [Google Scholar] [CrossRef]
- Liu, H.; Wang, Y.; Li, L.; Wang, K.; Hosonoa, V.; Zhou, V. Facile synthesis of NaV6O15 nanorods and its electrochemical behavior as cathode material in rechargeable lithium batteries. J. Mater. Chem. 2009, 19, 7885–7891. [Google Scholar] [CrossRef]
- Bach, S.; Baffier, N.; Pereira-Ramos, J.P.; Messina, R. Electrochemical sodium intercalation in Na0.33V2O5 bronze synthesized by a sol-gel process. Solid State Ionics 1989, 37, 41–49. [Google Scholar] [CrossRef]
- Liu, H.; Zhou, H.; Chen, L.; Tang, Z.; Yang, W. Electrochemical insertion/deinsertion of sodium on NaV6O15 nanorods as cathode material of rechargeable sodium-based batteries. J. Power Sources 2011, 196, 814–819. [Google Scholar] [CrossRef]
- Liu, J.; Tang, S.; Lu, Y.; Cai, G.; Liang, S.; Wang, W.; Chen, X. Synthesis of Mo2N nanolayer coated MoO2 hollow nanostructures as high-performance anode materials for lithium-ion batteries. Energy Environ. Sci. 2013, 6, 2691–2697. [Google Scholar] [CrossRef]
- Liu, J.; Lu, P.-J.; Liang, S.; Liu, J.; Wang, W.; Lei, M.; Tang, S.; Yang, Q. Ultrathin Li3VO4 nanoribbon/graphene sandwich-like nanostructures with ultrahigh lithium ion storage properties. Nano Energy 2015, 12, 709–724. [Google Scholar] [CrossRef]
- Yamada, H.; Ueda, Y. Magnetic, electric and structural properties of β-AxV2O5 (A = Na, Ag). J. Phys. Soc. Jpn. 1999, 68, 2735–2740. [Google Scholar] [CrossRef]
- Qin, M.-L.; Liu, W.-M.; Xiang, Y.-J.; Wang, W.-G.; Shen, B. Synthesis and electrochemical performance of V2O5/NaV6O15 nanocomposites as cathode materials for sodium-ion batteries. Trans. Nonferrous Met. Soc. China 2020, 30, 2200–2206. [Google Scholar] [CrossRef]
- Kawada, K.; Yamashita, K.; Okura, T. Crystallization and sodium-ion conduction properties of glass-ceramic solid solutions of Na5FeSi4O12 and Na4ZrSi4O12. Funct. Mater. Lett. 2021, 14, 2141001. [Google Scholar] [CrossRef]
- Gandi, S.S.; Gandi, S.; Madduluri, V.R.; Katari, N.K.; Dutta, D.P.; Ravuri, B.R. Na3+x[CrxTi2-x(PO4)3] glass-ceramic electrolyte: Ionic conductivity and structural correlations for different heat treating temperatures and time schedules. Ionics 2019, 25, 4179–4188. [Google Scholar] [CrossRef]
- Zhu, Y.; Li, L.; Li, C.; Zhou, L.; Wu, Y. Na1+xAlxGe2−xP3O12 (x = 0.5) glass–ceramic as a solid ionic conductor for sodium ion. Solid State Ionics 2016, 289, 113–117. [Google Scholar] [CrossRef]
- Kubuki, S.; Osouda, K.; Ali, A.S.; Khan, I.; Zhang, B.; Kitajou, A.; Okada, S.; Okabayashi, J.; Homonnay, Z.; Kuzmann, E.; et al. 57Fe-Mössbauer and XAFS studies of conductive sodium phospho-vanadate glass as a cathode active material for Na-ion batteries with large capacity. J. Non-Cryst. Solids 2021, 570, 120998. [Google Scholar] [CrossRef]
- Khan, I.; Zhang, B.; Matsuda, K.; Bingham, P.A.; Kitajou, A.; Inoishi, A.; Okada, S.; Yoshioka, S.; Nishida, T.; Homonnay, Z.; et al. Development of electrically conductive ZrO2-CaO-Fe2O3-V2O5 glass and glass-ceramics as a new cathode active material for Na-ion batteries with high performance. J. Alloys Compd. 2022, 899, 163309. [Google Scholar] [CrossRef]
- Li, R.; Guan, C.; Bian, X.; Yu, X.; Hu, F. NaV6O15 microflowers as a stable cathode material for high-performance aqueous zinc-ion batteries. RSC Adv. 2020, 10, 6807–6813. [Google Scholar] [CrossRef] [PubMed]
- Hu, F.; Jiang, W.; Dong, Y.; Lai, X.; Xiao, L.; Wu, X. Synthesis and electrochemical performance of NaV6O15 microflowers for lithium and sodium ion batteries. RSC Adv. 2017, 7, 29481–29488. [Google Scholar] [CrossRef]
- Wei, D.; Wang, H.; Feng, X.; Chueh, W.-T.; Ravikovitch, P.; Lyubovsky, M.; Li, C.; Takeguchi, T.; Haller, G.L. Synthesis and characterization of vanadium-substituted mesoporous molecular sieves. J. Phys. Chem. B 1999, 103, 2113–2121. [Google Scholar] [CrossRef]
- Kong, F.; Sun, D.; Rao, Y.; Zhang, R.; Chen, Z.; Wang, D.; Yu, X.; Jiang, H.; Li, C. Order-disorder transition in amorphous Vanadium-Phosphorus-Lithium cathode of lithium ion battery. Appl. Surf. Sci. 2022, 573, 151490. [Google Scholar] [CrossRef]
- Ibrahim, A.; Kubo, K.; Watanabe, S.; Shiba, S.; Khan, I.; Zhang, B.; Homonnay, Z.; Kuzmann, E.; Pavić, L.; Santić, A.; et al. Enhancement of electrical conductivity and thermal stability of Iron- or Tin- substituted vanadate glass and glass-ceramics nanocomposite to be applied as a high-performance cathode active material in sodium-ion batteries. J. Alloys Compd. 2023, 930, 167366. [Google Scholar] [CrossRef]
- Nagaraju, G.; Chandrappa, G.T. Solution phase synthesis of Na0.28V2O5 nanobelts into nanorings and the electrochemical performance in Li battery. Mater. Res. Bull. 2012, 47, 3216–3223. [Google Scholar] [CrossRef]
- Ibrahim, A.; Arita, Y.; Ali, A.S.; Khan, I.; Zhang, B.; Razum, M.; Pavić, L.; Santić, A.; Homonnay, Z.; Kuzmann, E.; et al. Impact of adding Fe ions on the local structure and electrochemical performance of P2O5–V2O5 glass and glass ceramics used as a cathode in LIBs. J. Phys. Chem. Solids 2023, 179, 111391. [Google Scholar] [CrossRef]
- Douvartzides, S.L.; Charisiou, N.D.; Papageridis, K.N.; Goula, M.A. Green diesel: Biomass feedstocks, production technologies, catalytic research, fuel properties and performance in compression ignition internal combustion engines. Energies 2019, 12, 809. [Google Scholar] [CrossRef]
- Tanaka, T.; Yamashita, H.; Tsuchitani, R.; Funabiki, T.; Yoshida, S. X-ray absorption (EXAFS/XANES) study of supported vanadium oxide catalysts. Structure of surface vanadium oxide species on silica and γ-alumina at a low level of vanadium loading. J. Chem. Soc. Faraday Trans. 1988, 84, 2987–2999. [Google Scholar] [CrossRef]
- Wong, J.; Lytle, F.W.; Messmer, R.P.; Maylotte, D.H. K-edge absorption spectra of selected vanadium compounds. Phys. Rev. B 1984, 30, 5596–5610. [Google Scholar] [CrossRef]
- Renka, S.; Pavić, L.; Tricot, G.; Mošner, P.; Koudelka, L.; Moguš-Milanković, A.; Šantić, A. A significant enhancement of sodium ion conductivity in phosphate glasses by addition of WO3 and MoO3: The effect of mixed conventional–conditional glass-forming oxides. Phys. Chem. Chem. Phys. 2021, 23, 9761–9772. [Google Scholar] [CrossRef]
- Pavić, L.; Šantić, A.; Nikolić, J.; Mošner, P.; Koudelka, L.; Pajić, D.; Moguš-Milanković, A. Nature of mixed electrical transport in Ag2O–ZnO–P2O5 glasses containing WO3 and MoO3. Electrochim. Acta 2018, 276, 434–445. [Google Scholar] [CrossRef]
- Marijan, S.; Razum, M.; Klaser, T.; Mošner, P.; Koudelka, L.; Skoko, Ž.; Pisk, J.; Pavić, L. Tailoring structure for improved sodium mobility and electrical properties in V2O5–Nb2O5–P2O5 Glass(es)-(Ceramics). J. Phys. Chem. Solids 2023, 181, 111461. [Google Scholar] [CrossRef]
- Mansour, A.N.; Smith, P.H.; Baker, W.M.; Balasubramanian, M.; McBreen, J. In situ XAS investigation of the oxidation state and local structure of vanadium in discharged and charged V2O5 aerogel cathodes. Electrochim. Acta 2002, 47, 3151–3161. [Google Scholar] [CrossRef]
- Aoyagi, T.; Fujieda, T.; Toyama, T.; Kono, K.; Takamatsu, D.; Hirano, T.; Naito, T.; Hayashi, Y.; Takizawa, H. Electrochemical properties and in-situ XAFS observation of Li2O-V2O5-P2O5-Fe2O3 quaternary-glass and crystallized-glass cathodes. J. Non-Cryst. Solids 2016, 453, 28–35. [Google Scholar] [CrossRef]
- Baddour-Hadjean, R.; Huynh, L.T.N.; Emery, N.; Pereira-Ramos, J. Lithium insertion in α′-NaV2O5: Na-pillaring effect on the structural and electrochemical properties. Electrochim. Acta 2018, 270, 224–235. [Google Scholar] [CrossRef]
- Baddour-Hadjean, R.; Bach, S.; Emery, N.; Pereira-Ramos, J.P. The peculiar structural behaviour of β-Na0.33V2O5 upon electrochemical lithium insertion. J. Mater. Chem. 2011, 21, 11296–11305. [Google Scholar] [CrossRef]
- Wang, X.; Liu, Q.; Wang, H.; Jiang, D.; Chang, Y.; Zhang, T.; Zhang, B.; Mou, H.; Jiang, Y. PVP-modulated synthesis of NaV6O15 nanorods as cathode materials for high-capacity sodium-ion batteries. J. Mater. Sci. 2016, 51, 8986–8994. [Google Scholar] [CrossRef]
- Cai, Y.; Zhou, J.; Fang, G.; Cai, G.; Pan, A.; Liang, S. Na0.282V2O5: A high-performance cathode material for rechargeable lithium batteries and sodium batteries. J. Power Sources 2016, 328, 241–249. [Google Scholar] [CrossRef]
- Rai, A.K.; Anh, L.T.; Gim, J.; Mathew, V.; Kim, J. Electrochemical properties of NaxCoO2 (x~0.71) cathode for rechargeable sodium-ion batteries. Ceram. Int. 2014, 40, 2411–2417. [Google Scholar] [CrossRef]
- He, H.; Jin, G.; Wang, H.; Huang, X.; Chen, Z.; Sun, D.; Tang, Y. Annealed NaV3O8 nanowires with good cycling stability as a novel cathode for Na-ion batteries. J. Mater. Chem. A 2014, 2, 3563–3570. [Google Scholar] [CrossRef]
- Köhler, J.; Makihara, H.; Uegaito, H.; Inoue, H.; Toki, M. LiV3O8: Characterization as anode material for an aqueous rechargeable Li-ion battery system. Electrochim. Acta 2000, 46, 59–65. [Google Scholar] [CrossRef]
- Gourier, D.; Tranchant, A.; Baffier, N.; Messina, R. EPR study of electrochemical lithium intercalation in V2O5 cathodes. Electrochim. Acta 1992, 37, 2755–2764. [Google Scholar] [CrossRef]
- Kang, H.; Liu, Y.; Shang, M.; Lu, T.; Wang, Y.; Jiao, L. NaV3O8 nanosheet@polypyrrole core–shell composites with good electrochemical performance as cathodes for Na-ion batteries. Nanoscale 2015, 7, 9261–9267. [Google Scholar] [CrossRef]
- Zhu, L.; Li, W.; Xie, L.; Yang, Q.; Cao, X. Rod-like NaV3O8 as cathode materials with high capacity and stability for sodium storage. Chem. Eng. J. 2019, 372, 1056–1065. [Google Scholar] [CrossRef]
- Zhu, L.; Li, W.; Yu, Z.; Xie, L.; Cao, X. Synthesis and electrochemical performances of LiV3O8/poly (3, 4-ethylenedioxythiophene) composites as cathode materials for rechargeable lithium batteries. Solid State Ion. 2017, 310, 30–37. [Google Scholar] [CrossRef]


| xNN | Crystalline Phase | Lattice Parameters | V (Å3) | FWHM (deg.) | d (Å) | Particle Size (Å) | Space Group | Phase Fraction (%) | |||||
|---|---|---|---|---|---|---|---|---|---|---|---|---|---|
| (Å) | (Degree) | ||||||||||||
| a | b | c | A | β | γ | ||||||||
| 5 | V2O5 | 4.373 | 11.516 | 3.655 | 90 | 90 | 90 | 184 (2) | 0.572 (8) | 4.198 (5) | 184 (22) | Pbnm | 75.1 |
| β-Na0.33V2O5 | 15.439 | 3.615 | 10.068 | 90 | 109.550 | 90 | 534 (4) | 0.0977 (13) | 7.256 (3) | 992 (42) | C12/m1 | 24.9 | |
| 15 | β-Na0.33V2O5 | 15.425 | 3.609 | 10.067 | 90 | 109.550 | 90 | 531 (49) | 0.077 (3) | 7.286 (5) | 984 (64) | C12/m1 | 95.2 |
| NaV3O8 | 7.373 | 3.617 | 12.172 | 90 | 106.910 | 90 | 312 (53) | 0.116 (9) | 6.964 (2) | 719 (2) | P121/m1 | 4.8 | |
| 25 | β-Na0.33V2O5 | 15.424 | 3.609 | 10.066 | 90 | 109.550 | 90 | 529 (44) | 0.100 (5) | 7.264 (4) | 834 (44) | C12/m1 | 17.6 |
| NaV3O8 | 7.315 | 3.608 | 12.160 | 90 | 107.750 | 90 | 309 (13) | 0.104 (18) | 6.970 (7) | 796 (28) | P121/m1 | 82.4 | |
| 35 | NaV3O8 | 7.339 | 3.611 | 12.152 | 90 | 107.368 | 90 | 313 (27) | 0.084 (2) | 6.991 (8) | 997 (27) | P121/m1 | 93.8 |
| α-NaVO3 | 10.326 | 9.467 | 5.874 | 90 | 104.200 | 90 | 593 (56) | 0.144 (14) | 3.105 (11) | 593 (56) | I12/a1 | 6.2 | |
| 45 | NaV3O8 | 7.349 | 3.615 | 12.168 | 90 | 107.368 | 90 | 315 (25) | 0.092 (3) | 6.982 (9) | 905 (26) | P121/m1 | 38.1 |
| α-NaVO3 | 10.551 | 9.484 | 5.876 | 90 | 104.210 | 90 | 571 (81) | 0.150 (2) | 3.104 (10) | 582 (67) | I12/a1 | 61.9 | |
| Element | Mass Ratio of Atoms (%) | Theoretical Value (%) (Na0.33V2O5) |
|---|---|---|
| Na | 5.79 | 4.00 |
| V | 64.08 | 53.80 |
| O | 30.13 | 42.20 |
| Peaks | 5NV | 15NV | 25NV | 35NV | 45NV | Peak Assignment |
|---|---|---|---|---|---|---|
| 1 | 471 | 465 | 450 | 451 | 448 | Bending modes of the V2O5 network consisting of [VO5] polyhedra |
| 2 | 585 | 574 | 564 | 562 | 557 | V-O-V symmetric stretching vibrations |
| 3 | - | 737 | 754 | 752 | 749 | V-O-V asymmetric stretching vibrations |
| 4 | 810 | 817 | 819 | 838 | 840 | V-O-V deformation modes |
| 5 | 939 | 940 | 920 | 914 | 916 | Stretching vibration of distorted octahedra (VO6) |
| 6 | - | 960 | 955 | 947 | 945 | V=O stretching vibration |
| 7 | 1027 | 993 | 994 | 989 | 990 | V=O stretching vibration of distorted square pyramids |
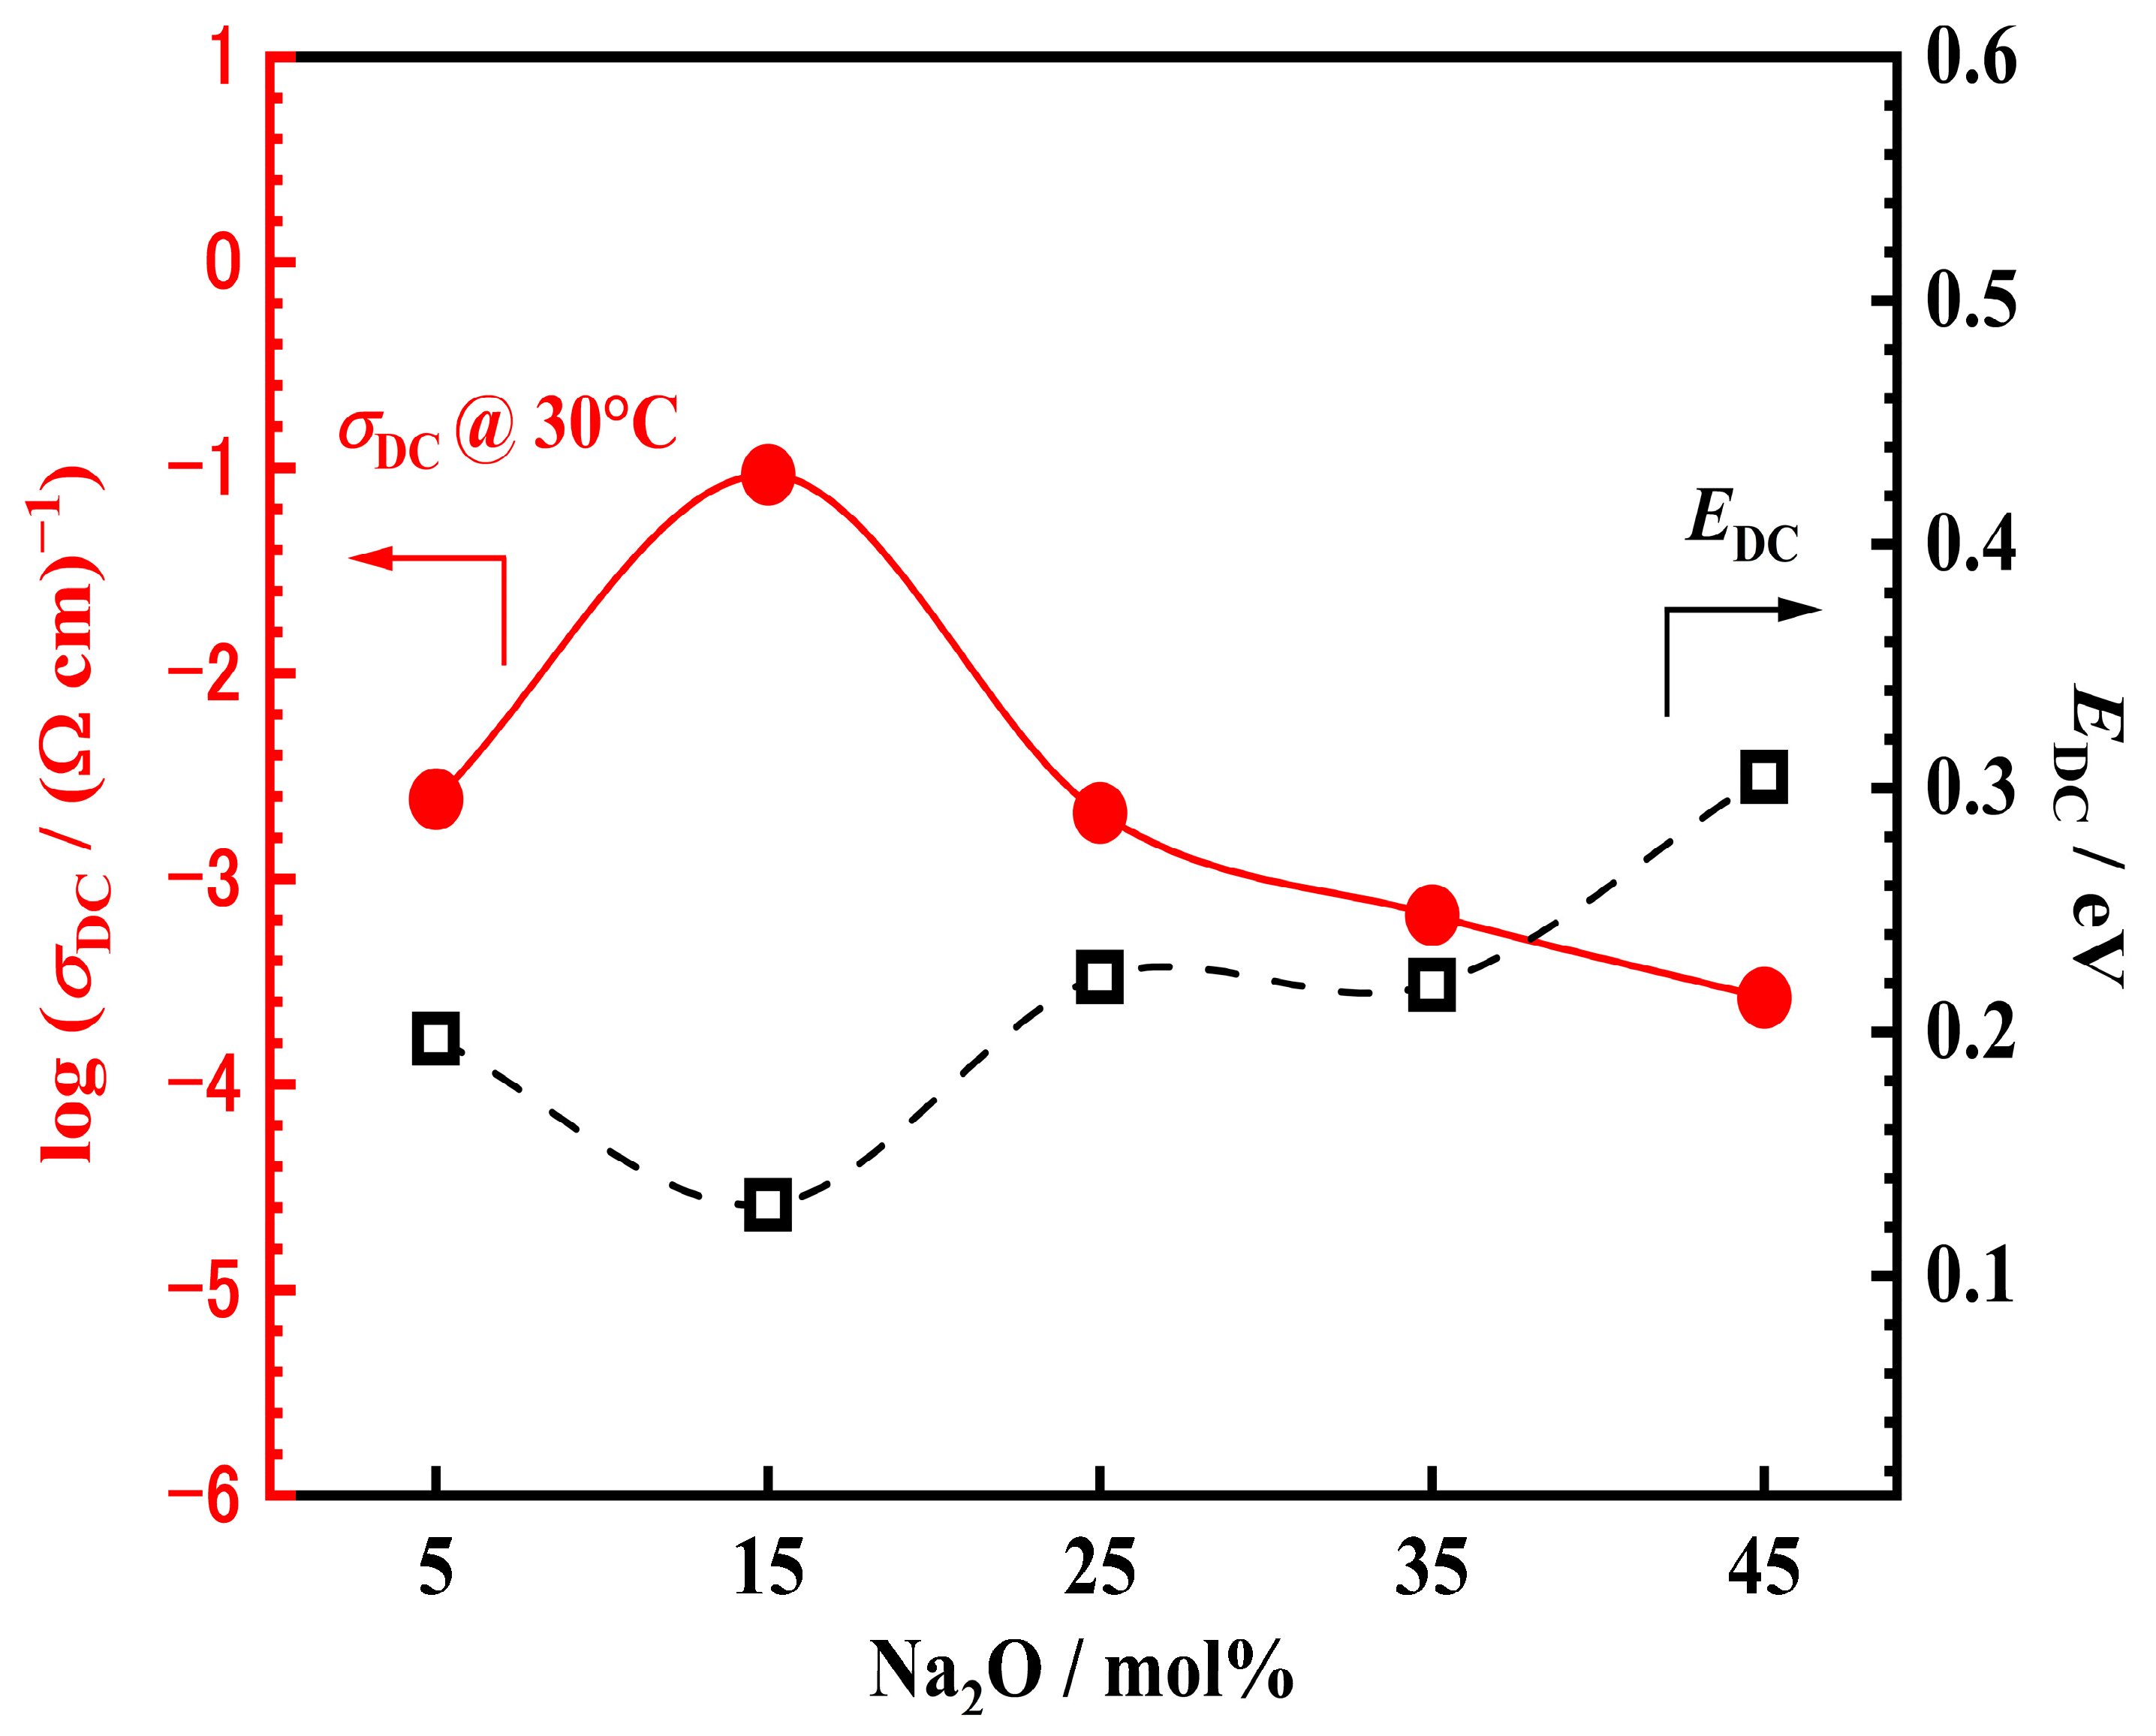
| Ceramics Sample | σDC ((Ωcm)−1) * | EDC (eV) |
|---|---|---|
| 5NV | 0.0024 | 0.197 |
| 15NV | 0.0925 | 0.129 |
| 25NV | 0.0021 | 0.223 |
| 35NV | 6.67 10−4 | 0.216 |
| 45NV | 2.65 10−4 | 0.305 |
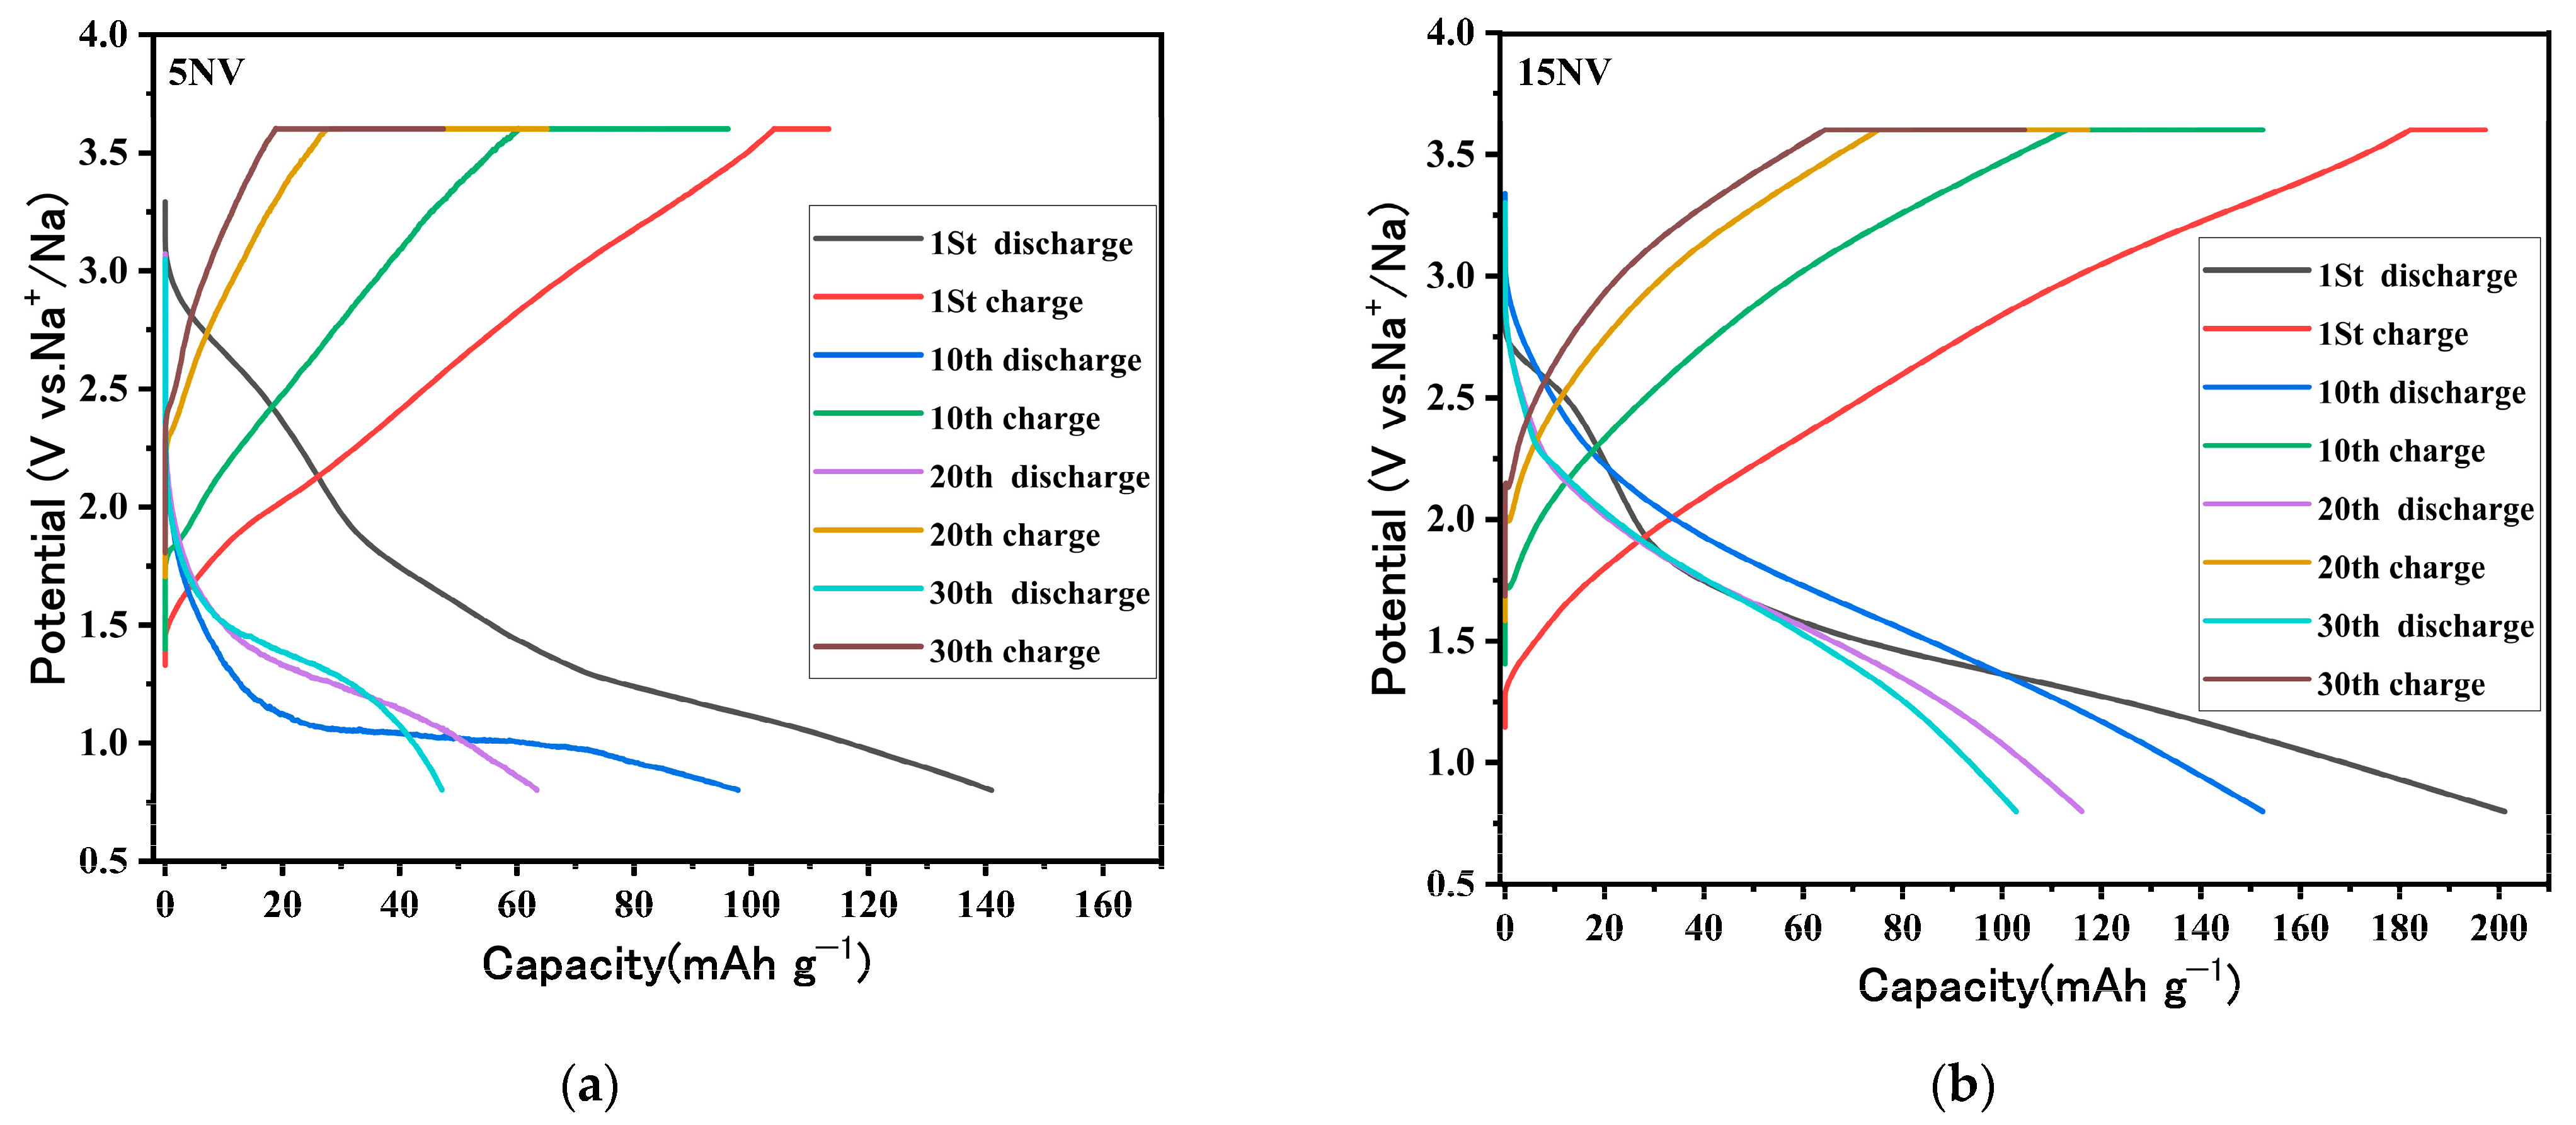
| Ceramics Sample | Initial Discharge Capacity (mAh g−1) | Capacity Retention (%) |
|---|---|---|
| 5NV | 141 | 32.2 |
| 15NV | 203 | 50.1 |
| 25NV | 157 | 65.1 |
| 35NV | 118 | 71.2 |
| 45NV | 101 | 66.3 |
| Cycles | Crystalline Phase | Lattice Parameters | V (Å3) | FWHM (deg.) | d (Å) | Particle Size (Å) | Space Group | Phase Fraction (%) | |||||
|---|---|---|---|---|---|---|---|---|---|---|---|---|---|
| (Å) | (Degree) | ||||||||||||
| a | b | c | α | β | γ | ||||||||
| before | β-Na0.33V2O5 | 15.425 | 3.609 | 10.067 | 90 | 109.550 | 90 | 531 (49) | 0.077 (3) | 7.286 (5) | 984 (64) | C12/m1 | 95.2 |
| NaV3O8 | 7.373 | 3.617 | 12.172 | 90 | 106.910 | 90 | 312 (53) | 0.116 (9) | 6.964 (2) | 719 (27) | P121/m1 | 4.8 | |
| 10 | α-NaVO3 | 10.492 | 9.432 | 5.862 | 90 | 108.800 | 90 | 558 (22) | 0.572 (8) | 3.225 (5) | 149 (24) | C12/c1 | 76.26 |
| β-Na0.33V2O5 | 14.883 | 3.602 | 9.884 | 90 | 109.900 | 90 | 502 (16) | 0.360 (2) | 7.124 (2) | 235 (16) | C12/m1 | 23.74 | |
| 20 | α-NaVO3 | 10.335 | 9.475 | 5.881 | 90 | 104.200 | 90 | 512 (47) | 0.440 (11) | 3.442 (9) | 193 (47) | I12/a1 | 78.35 |
| Na0.287V2O5 | 10.096 | 3.615 | 10.096 | 90 | 109.549 | 90 | 388 (30) | 0.210 (16) | 7.756 (3) | 398 (31) | C12/m1 | 6.07 | |
| β-Na0.33V2O5 | 15.028 | 3.636 | 9.979 | 90 | 109.900 | 90 | 528 (35) | 0.350 (5) | 7.272 (3) | 244 (35) | C12/m1 | 15.58 | |
| 30 | α-NaVO3 | 10.563 | 9.474 | 5.883 | 90 | 108.430 | 90 | 568 (21) | 0.394 (13) | 3.452 (7) | 173 (42) | C12/c1 | 80.20 |
| Na0.287V2O5 | 10.116 | 3.622 | 10.484 | 90 | 109.610 | 90 | 420 (38) | 0.199 (18) | 7.806 (10) | 420 (38) | C12/m1 | 10.68 | |
| β-Na0.33V2O5 | 14.370 | 3.563 | 9.626 | 90 | 109.980 | 90 | 505 (35) | 0.372 (5) | 7.292 (3) | 212 (36) | C12/m1 | 9.12 | |
| Compound | Capacity [mAh g−1] | Capacity Retention Rate [%]/(cycle) | Current Density [mA g−1] | Voltage Range (V) | Ref. |
|---|---|---|---|---|---|
| NaV6O15 | 157 | 73.8 (50) | 20 | 1.5–3.8 | [48] |
| Na0.282V2O5 | 130 | 91.5 (70) | 1000 | 1.8–3.8 | [49] |
| NaV3O8 | 145.8 | 91.1 (50) | 10 | 1.5–4.0 | [51] |
| Na0.44MnO2 | 128 | 97 (100) | 100 | 2.0–4.0 | [10] |
| Na0.71CoO2 | 75.2 | 93 (100) | 40 | 2.0–3.9 | [50] |
| 15NV | 203 | 50.1 (30) | 50 | 0.8–3.6 | This work |
| 15NV | 82 | 78 (30) | 50 | 1.5–4.0 | This work |
| 15NV | 56 | 90 (30) | 50 | 1.8–4.0 | This work |
| 35NV | 118 | 71.2 (30) | 50 | 0.8–3.6 | This work |
| Voltage | Crystalline Phase | Lattice Parameters | V (Å3) | FWHM (deg.) | d (Å) | Particle size (Å) | Space Group | Phase Fraction (%) | |||||
|---|---|---|---|---|---|---|---|---|---|---|---|---|---|
| (Å) | (Degree) | ||||||||||||
| a | b | c | α | β | γ | ||||||||
| Before | β-Na0.33V2O5 | 15.425 | 3.609 | 10.067 | 90 | 109.550 | 90 | 531 (49) | 0.077 (3) | 7.286 (5) | 984 (64) | C12/m1 | 95.2 |
| NaV3O8 | 7.373 | 3.617 | 12.172 | 90 | 106.910 | 90 | 312 (53) | 0.116 (9) | 6.964 (2) | 719 (27) | P121/m1 | 4.8 | |
| 2 V | β-Na0.33V2O5 | 15.349 | 3.608 | 10.048 | 90 | 109.200 | 90 | 522 (16) | 0.215 (9) | 7.226 (5) | 389 (16) | A12/m1 | 94.8 |
| NaV3O8 | 7.361 | 3.642 | 12.165 | 90 | 106.840 | 90 | 329 (34) | 0.250 (3) | 6.958 (6) | 329 (34) | P12/m1 | 5.2 | |
| 1.8 V | NaVO3 | 10.542 | 9.456 | 5.872 | 90 | 108.430 | 90 | 567 (107) | 0.282 (19) | 3.052 (6) | 304 (56) | C1/c1 | 4.6 |
| NaV2O5 | 11.029 | 3.623 | 4.934 | 90 | 90 | 90 | 197 (30) | 0.250 (8) | 2.943 (3) | 398 (30) | Pmmn | 34.8 | |
| β-Na0.33V2O5 | 15.406 | 3.614 | 10.109 | 90 | 109.411 | 90 | 528 (16) | 1.100 (2) | 7.660 (6) | 177 (22) | P12/m1 | 60.6 | |
| 1.5 V | NaVO3 | 10.338 | 9.478 | 5.883 | 90 | 104.200 | 90 | 559 (290) | 0.080 (2) | 3.064 (6) | 1011 (165) | I12/a1 | 20.4 |
| NaV2O5 | 11.489 | 3.615 | 4.869 | 90 | 90 | 90 | 202 (32) | 0.280 (7) | 2.843 (4) | 320 (32) | P21mn | 50.6 | |
| β-Na0.33V2O5 | 15.288 | 3.701 | 10.153 | 90 | 109.900 | 90 | 515 (10) | 1.3 (2) | 7.09 (10) | 67 (10) | C12/m1 | 29 | |
| 0.8 V | NaVO3 | 10.507 | 9.446 | 5.870 | 90 | 108.800 | 90 | 545 (18) | 0.57 (7) | 3.435 (3) | 148 (18) | C1/c1 | 31.9 |
| NaV2O5 | 11.394 | 3.607 | 4.553 | 90 | 90 | 90 | 187 (60) | 0.38 (10) | 2.281 (6) | 234 (47) | Pmmn | 68.1 | |
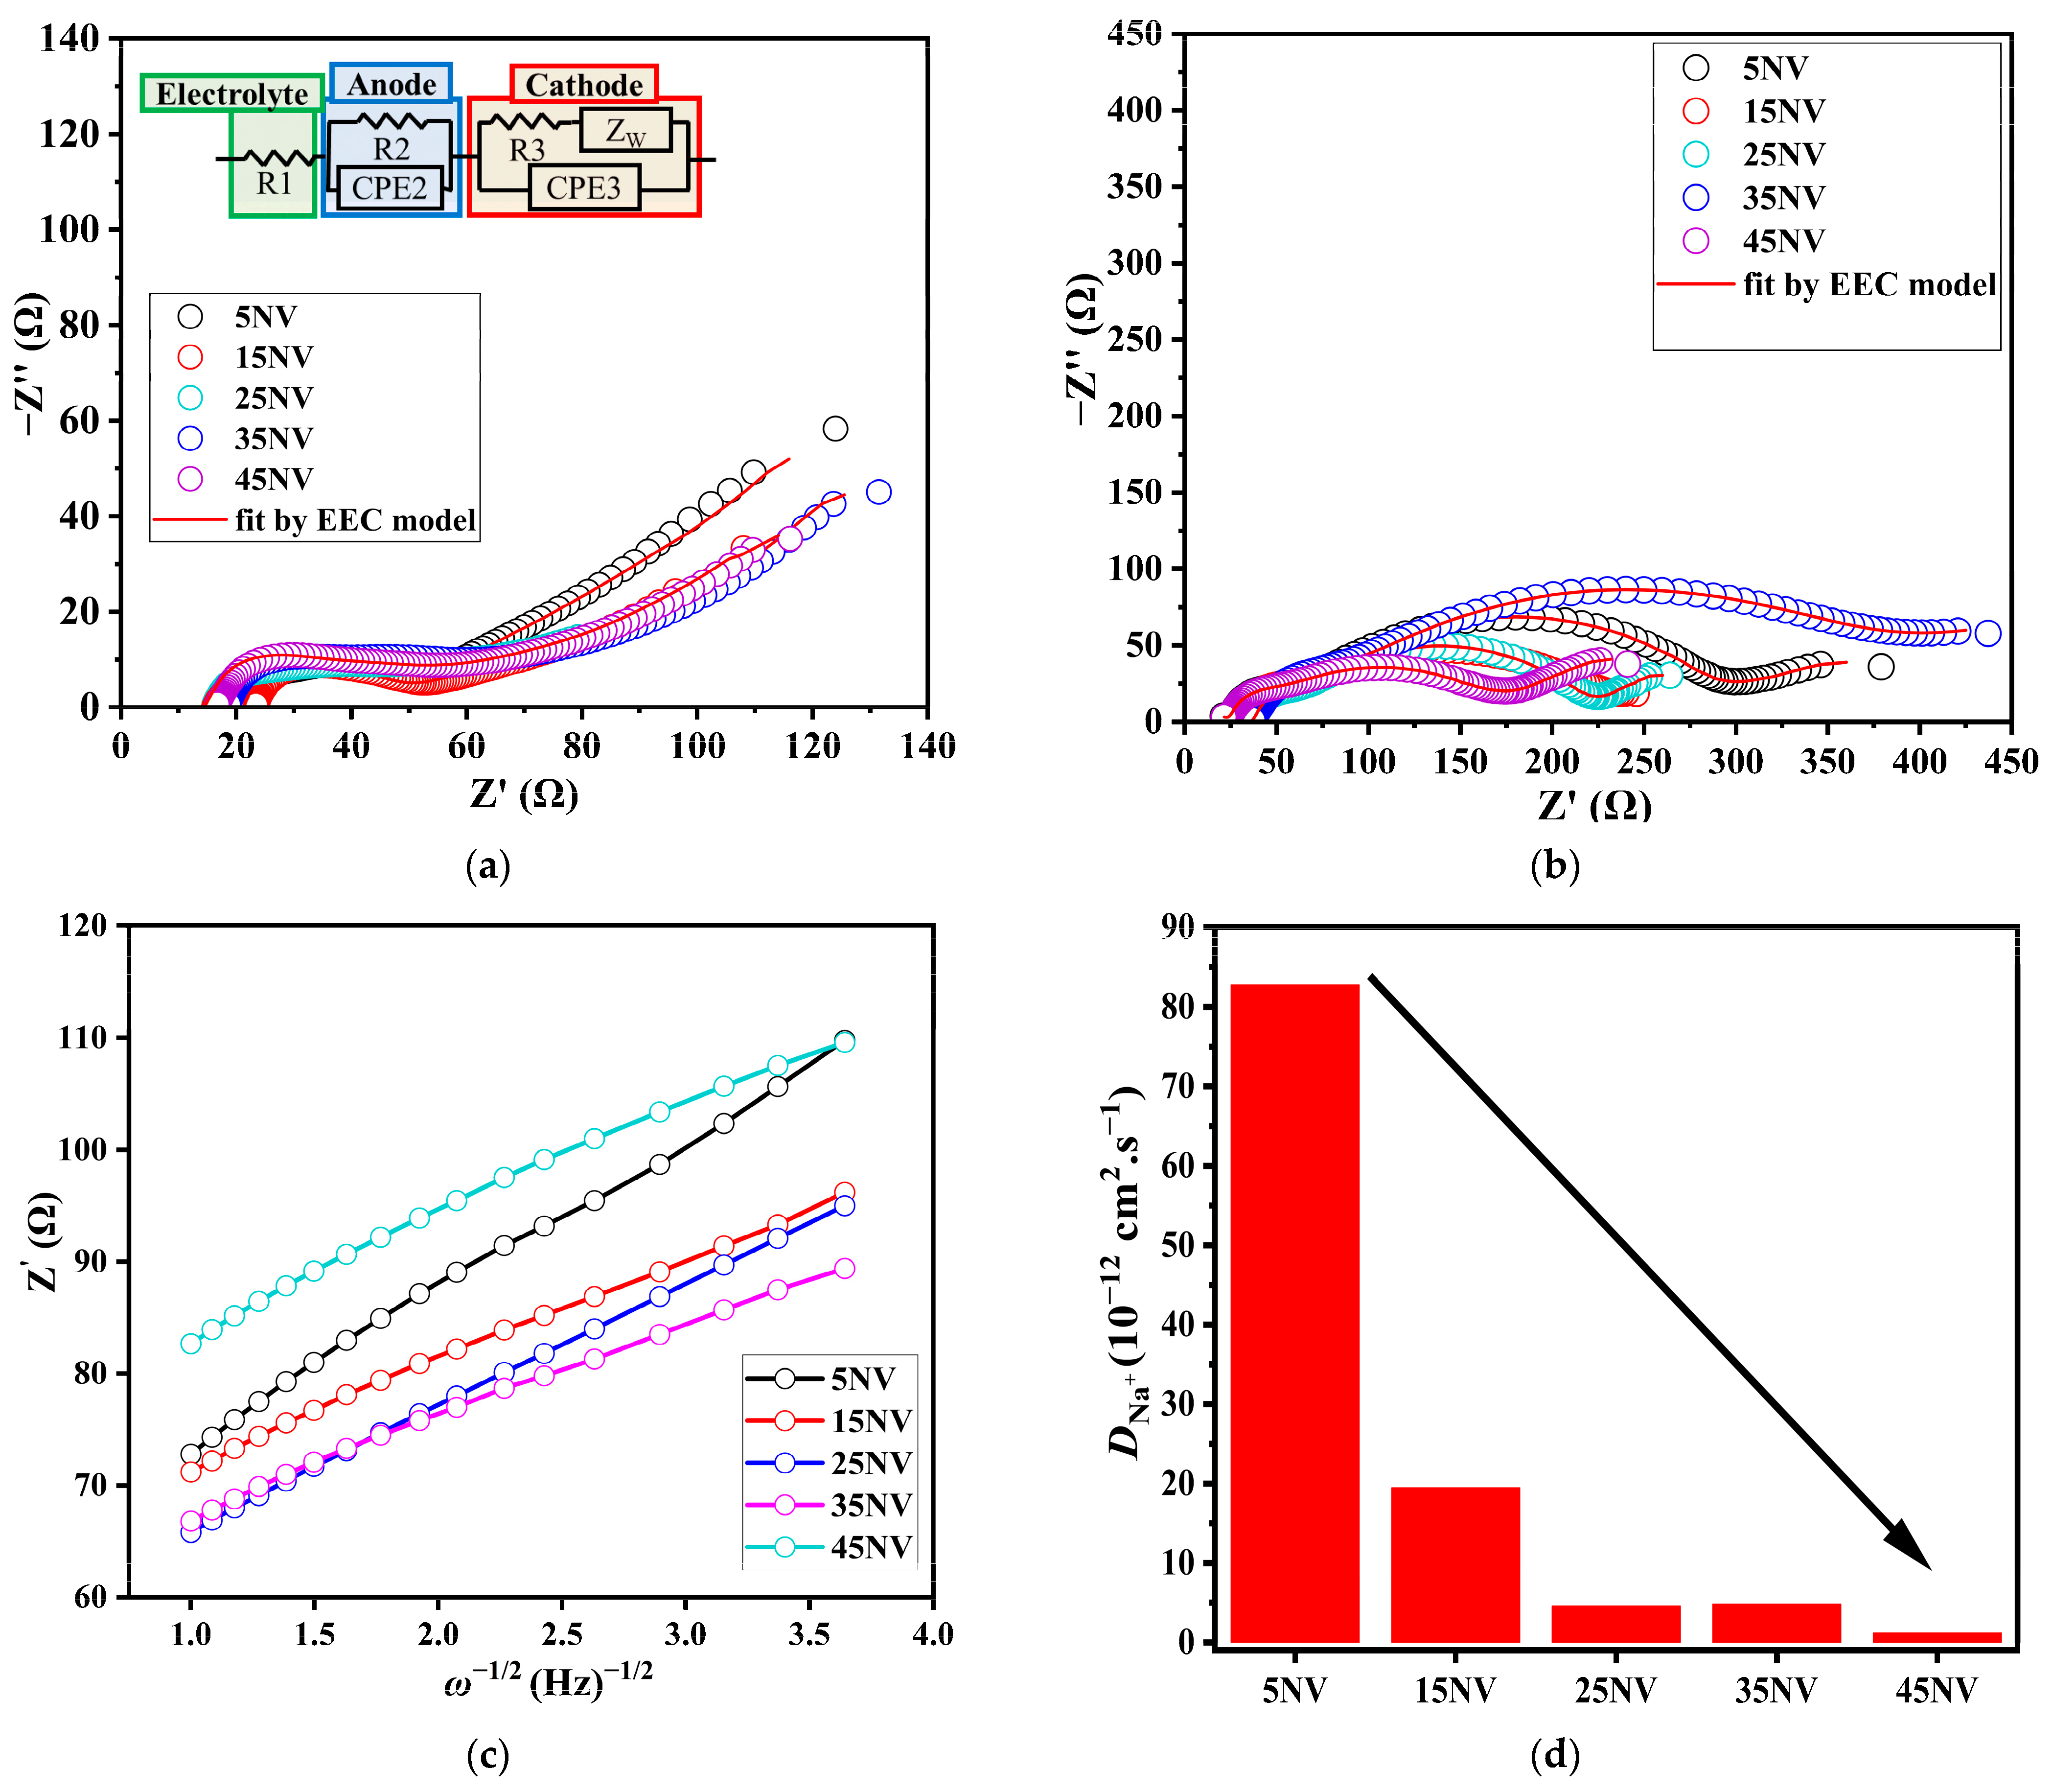
| Sample | Before | After | ||||
|---|---|---|---|---|---|---|
| R1 (Ω) | R2 (Ω) | R3 (Ω) | R1 (Ω) | R2 (Ω) | R3 (Ω) | |
| 5NV | 17.2 | 34.5 | 27.0 | 22.5 | 34.6 | 241 |
| 15NV | 29.8 | 30.2 | 50.3 | 11.7 | 15.3 | 196 |
| 25NV | 15.2 | 12.5 | 43.3 | 30.5 | 34.9 | 155 |
| 35NV | 17.7 | 17.0 | 34.8 | 14.1 | 10.0 | 120 |
| 45NV | 15.7 | 19.4 | 50.8 | 21.6 | 12.4 | 148 |
Disclaimer/Publisher’s Note: The statements, opinions and data contained in all publications are solely those of the individual author(s) and contributor(s) and not of MDPI and/or the editor(s). MDPI and/or the editor(s) disclaim responsibility for any injury to people or property resulting from any ideas, methods, instructions or products referred to in the content. |
© 2023 by the authors. Licensee MDPI, Basel, Switzerland. This article is an open access article distributed under the terms and conditions of the Creative Commons Attribution (CC BY) license (https://creativecommons.org/licenses/by/4.0/).
Share and Cite
Ibrahim, A.; Watanabe, S.; Razum, M.; Pavić, L.; Homonnay, Z.; Kuzmann, E.; Hassaan, M.Y.; Kubuki, S. Structural, Electrical, and Electrochemical Properties of a Na2O-V2O5 Ceramic Nanocomposite as an Active Cathode Material for a Na-Ion Battery. Crystals 2023, 13, 1521. https://doi.org/10.3390/cryst13101521
Ibrahim A, Watanabe S, Razum M, Pavić L, Homonnay Z, Kuzmann E, Hassaan MY, Kubuki S. Structural, Electrical, and Electrochemical Properties of a Na2O-V2O5 Ceramic Nanocomposite as an Active Cathode Material for a Na-Ion Battery. Crystals. 2023; 13(10):1521. https://doi.org/10.3390/cryst13101521
Chicago/Turabian StyleIbrahim, Ahmed, Satoshi Watanabe, Marta Razum, Luka Pavić, Zoltán Homonnay, Ernő Kuzmann, Mohamed Yousry Hassaan, and Shiro Kubuki. 2023. "Structural, Electrical, and Electrochemical Properties of a Na2O-V2O5 Ceramic Nanocomposite as an Active Cathode Material for a Na-Ion Battery" Crystals 13, no. 10: 1521. https://doi.org/10.3390/cryst13101521
APA StyleIbrahim, A., Watanabe, S., Razum, M., Pavić, L., Homonnay, Z., Kuzmann, E., Hassaan, M. Y., & Kubuki, S. (2023). Structural, Electrical, and Electrochemical Properties of a Na2O-V2O5 Ceramic Nanocomposite as an Active Cathode Material for a Na-Ion Battery. Crystals, 13(10), 1521. https://doi.org/10.3390/cryst13101521