

Camphor Sulfonimine Compounds: Bottom-Up Design of MOFs from Organic Frameworks Based on X-rays and DFT-D3

 ,
,  and
and
Abstract
:1. Introduction
2. Results and Discussion
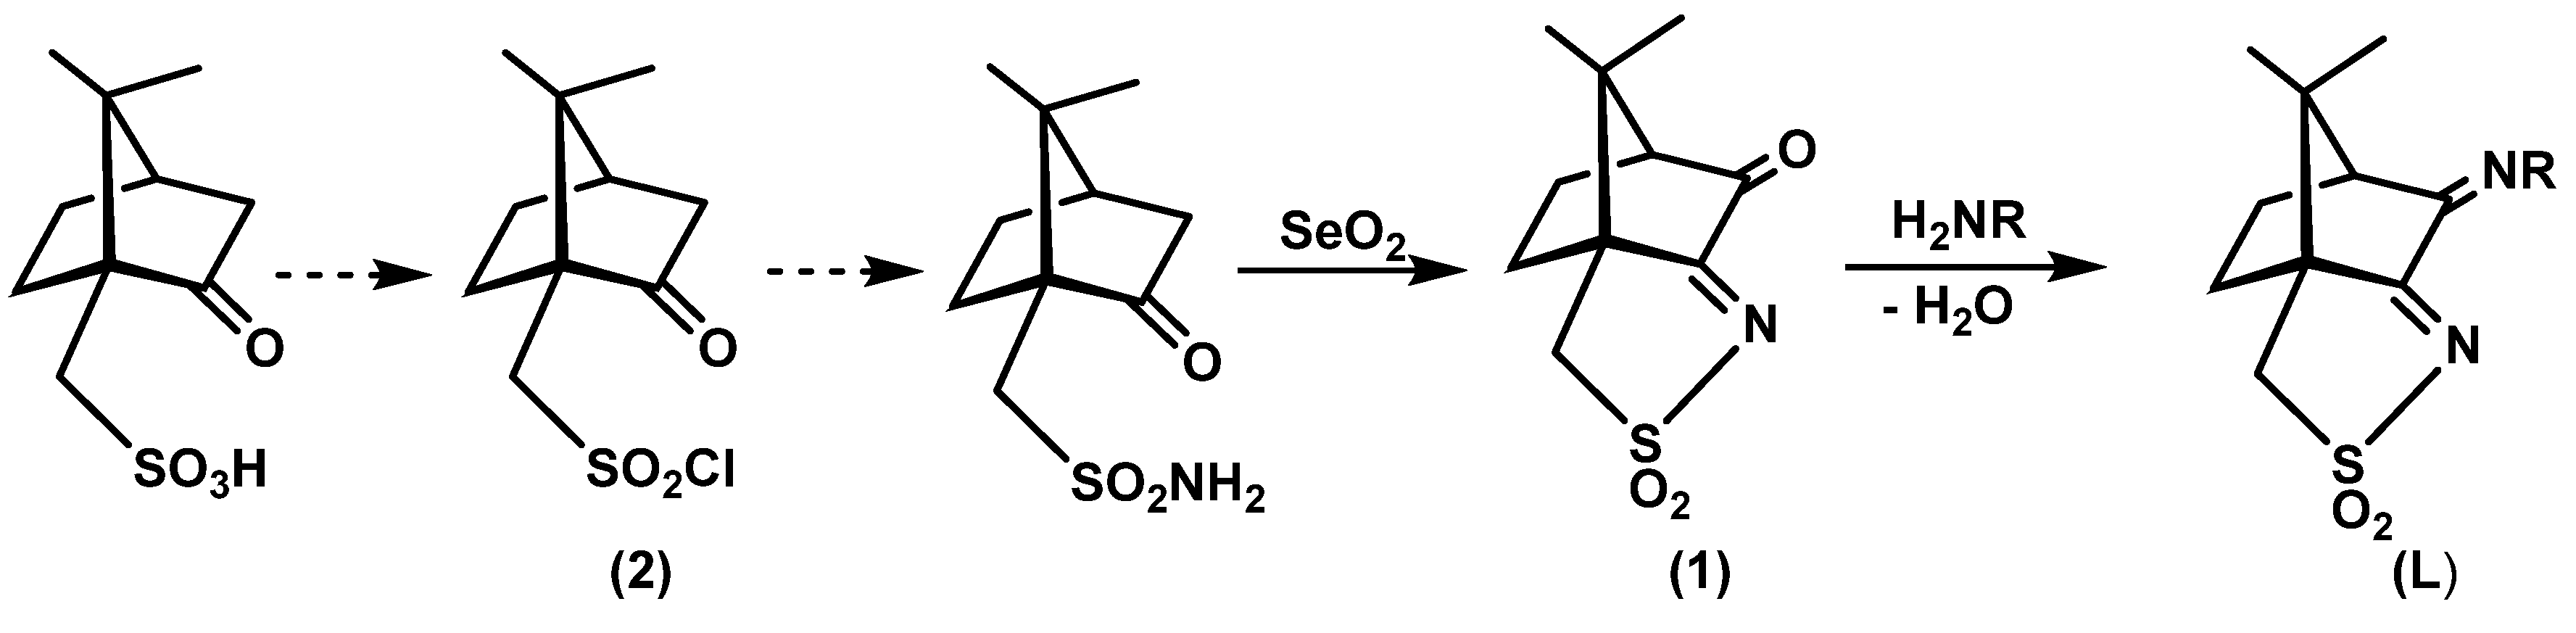
2.1. Synthesis of Camphor Sulfonimines
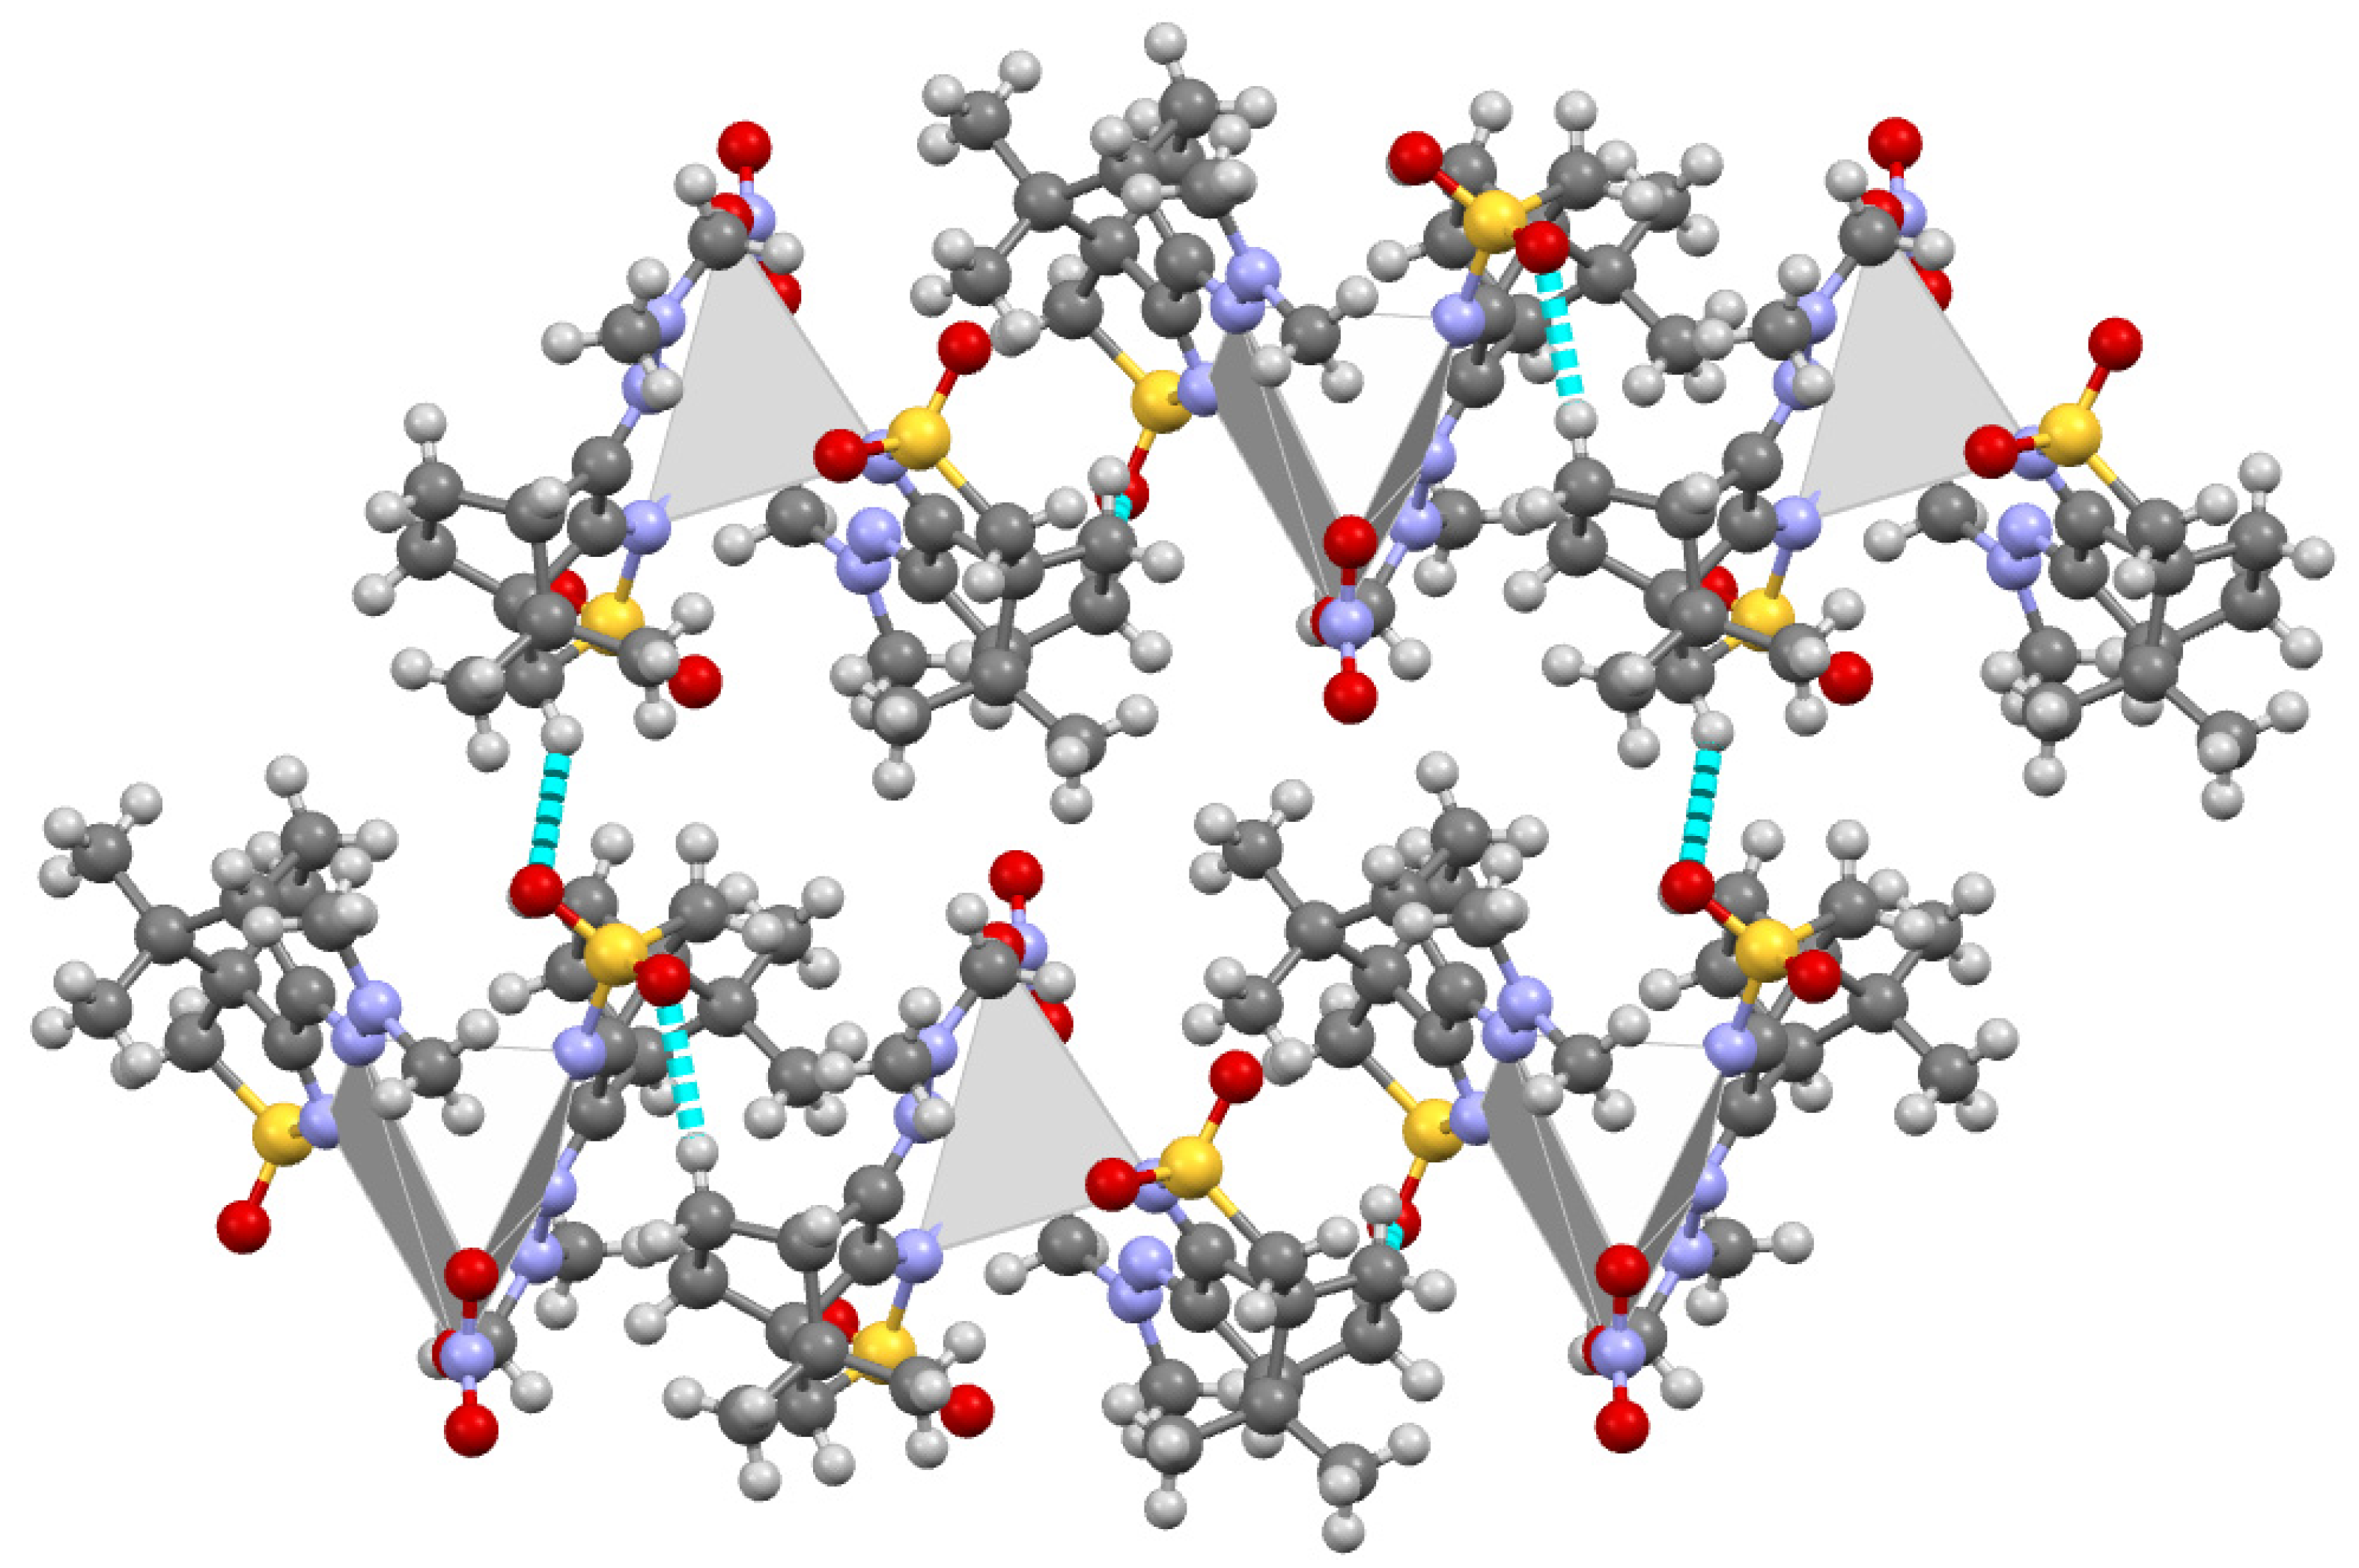
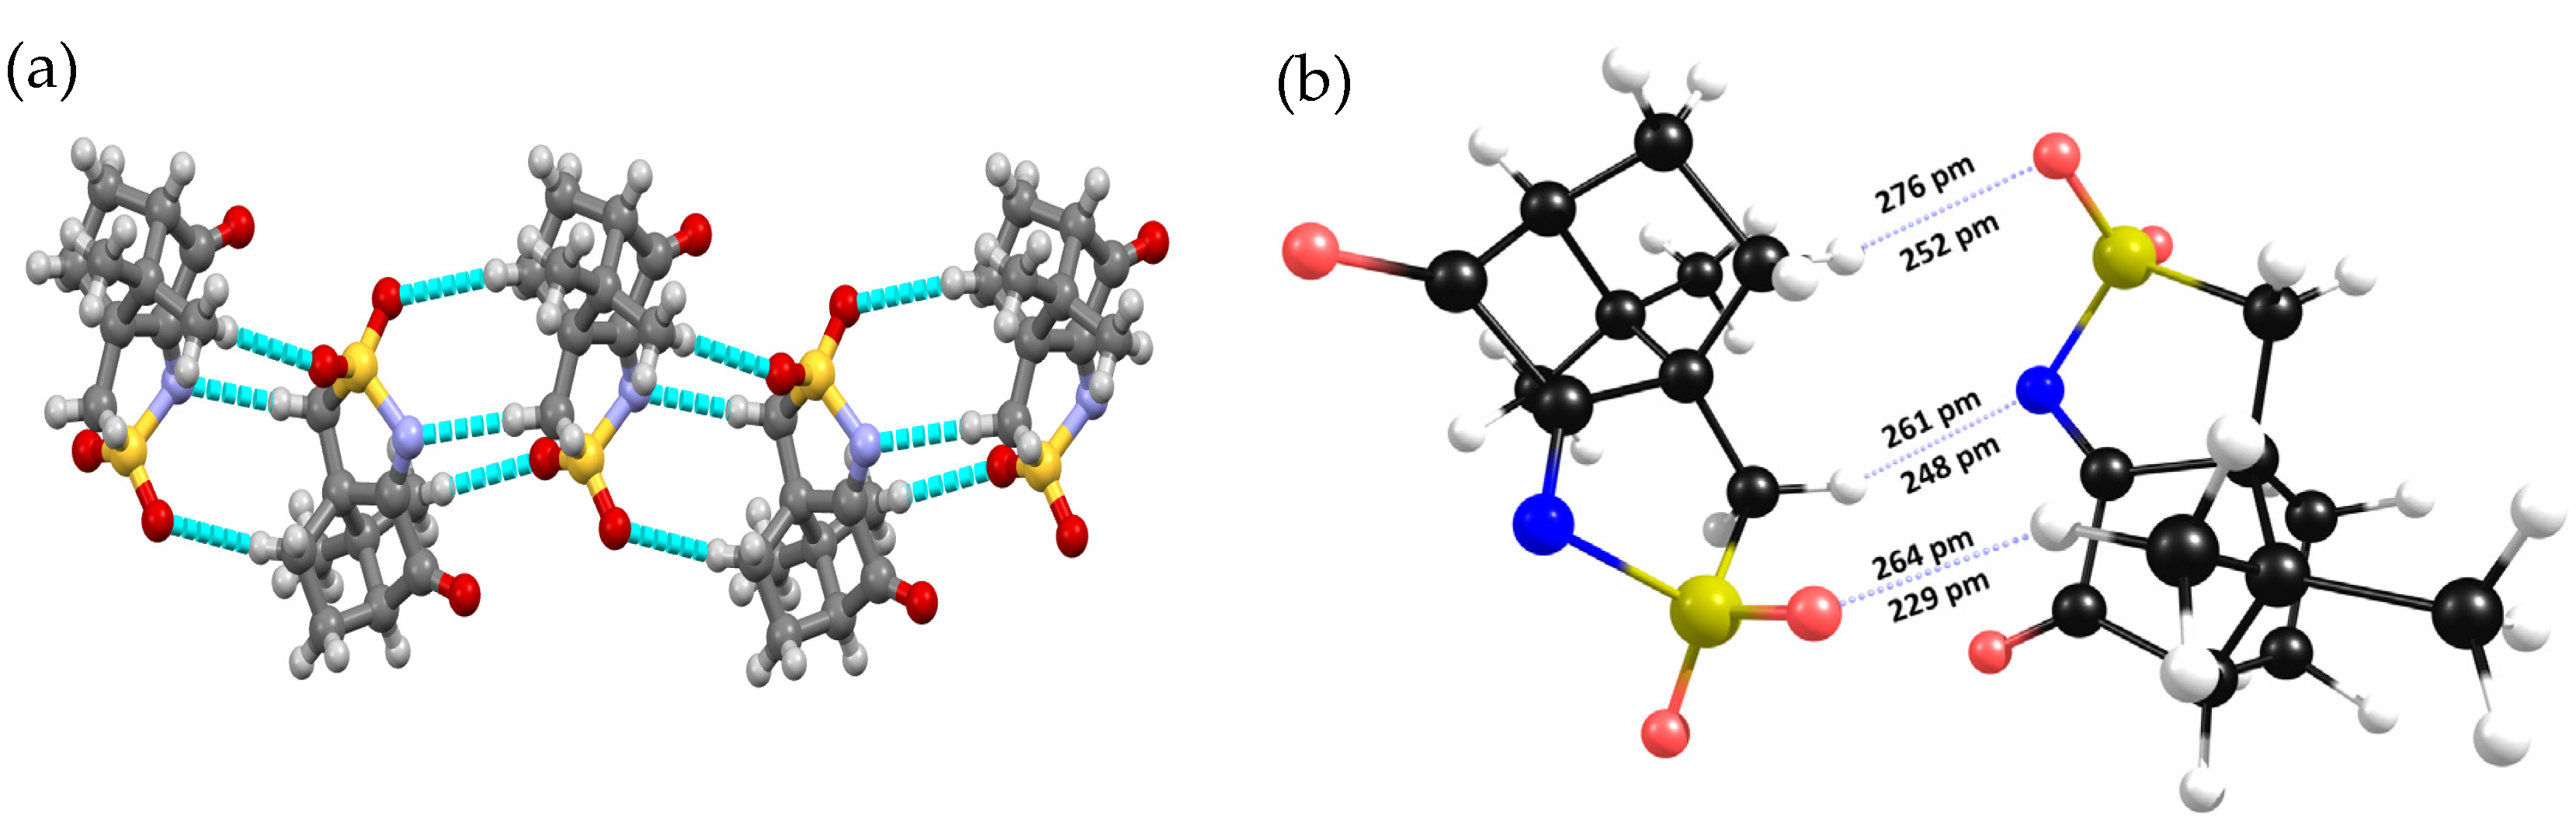
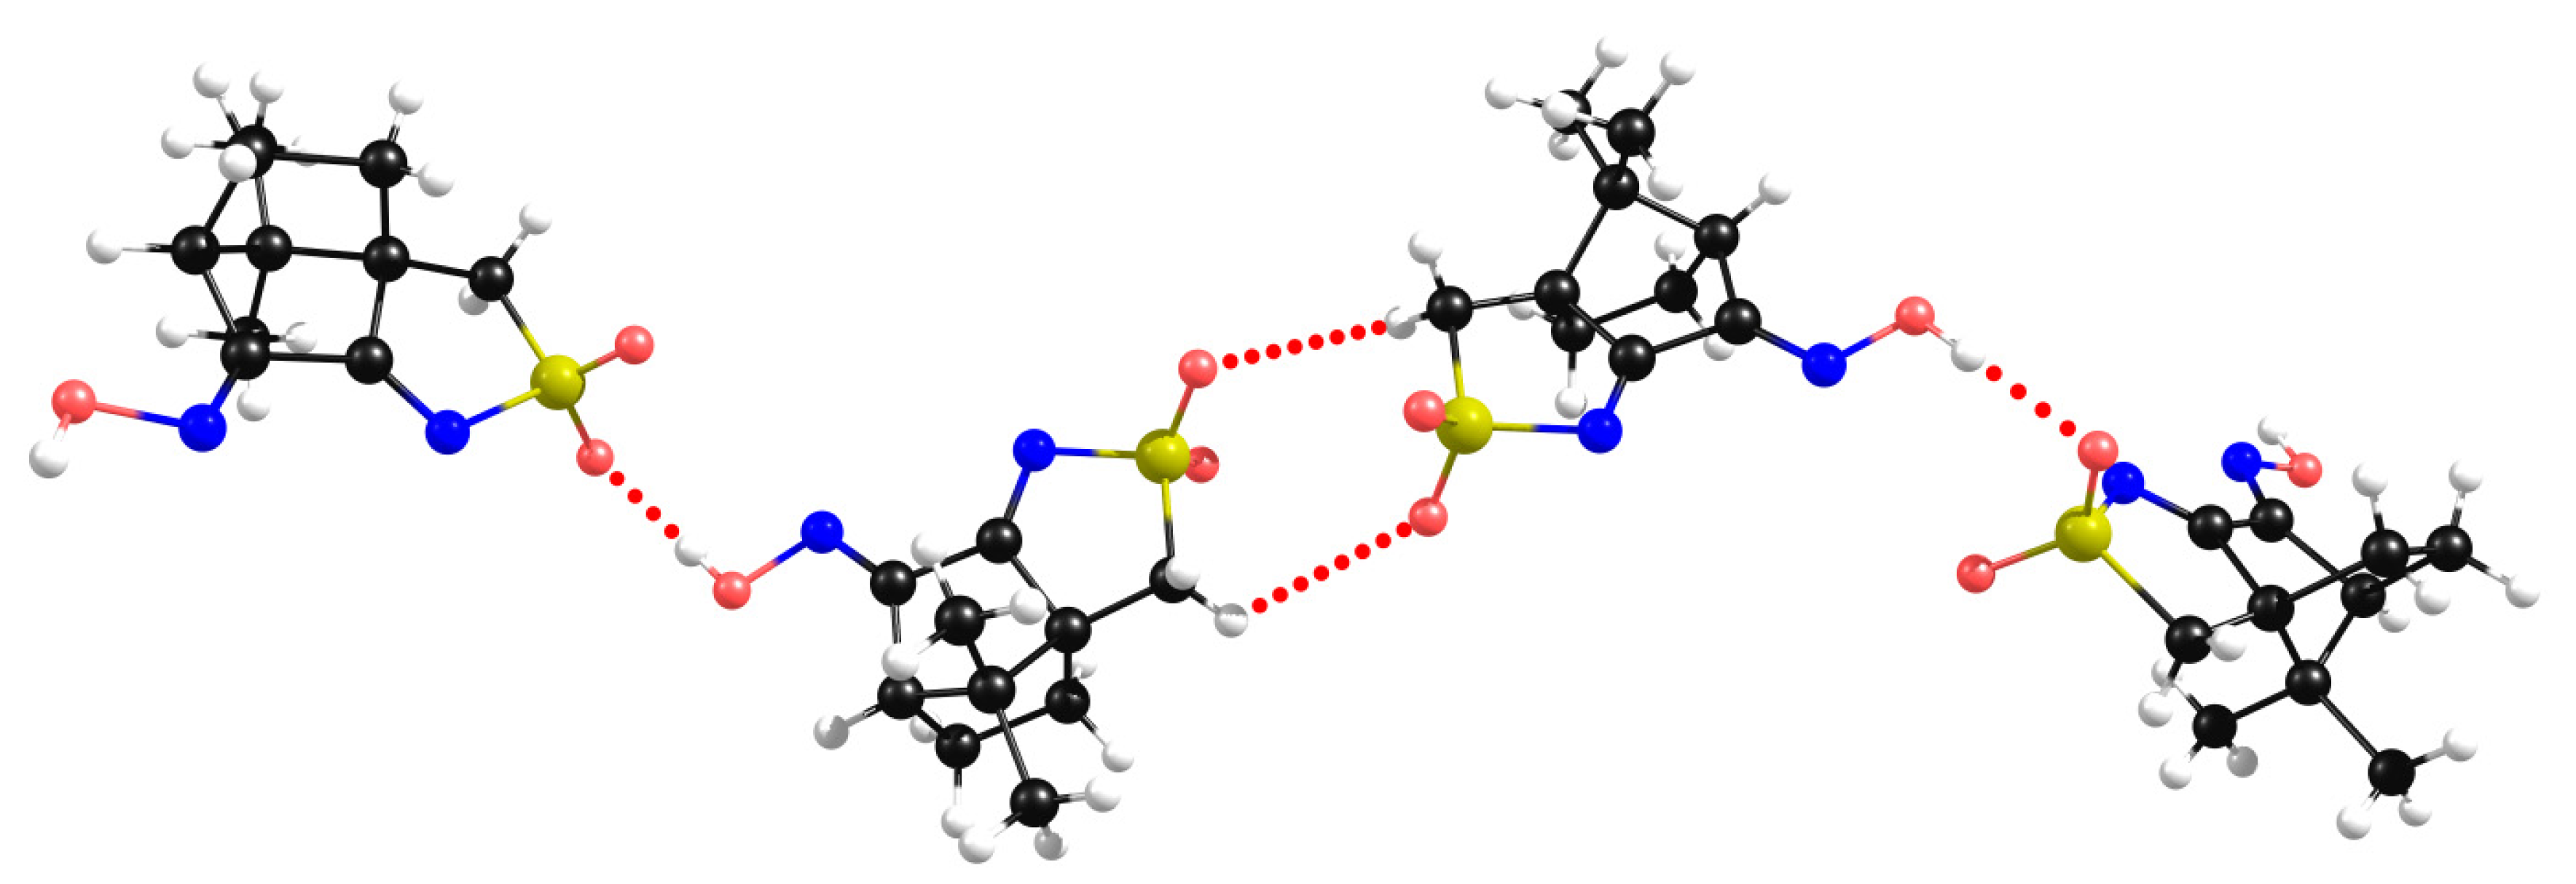
2.2. Structural Arrangement Predicted via DFT-D3
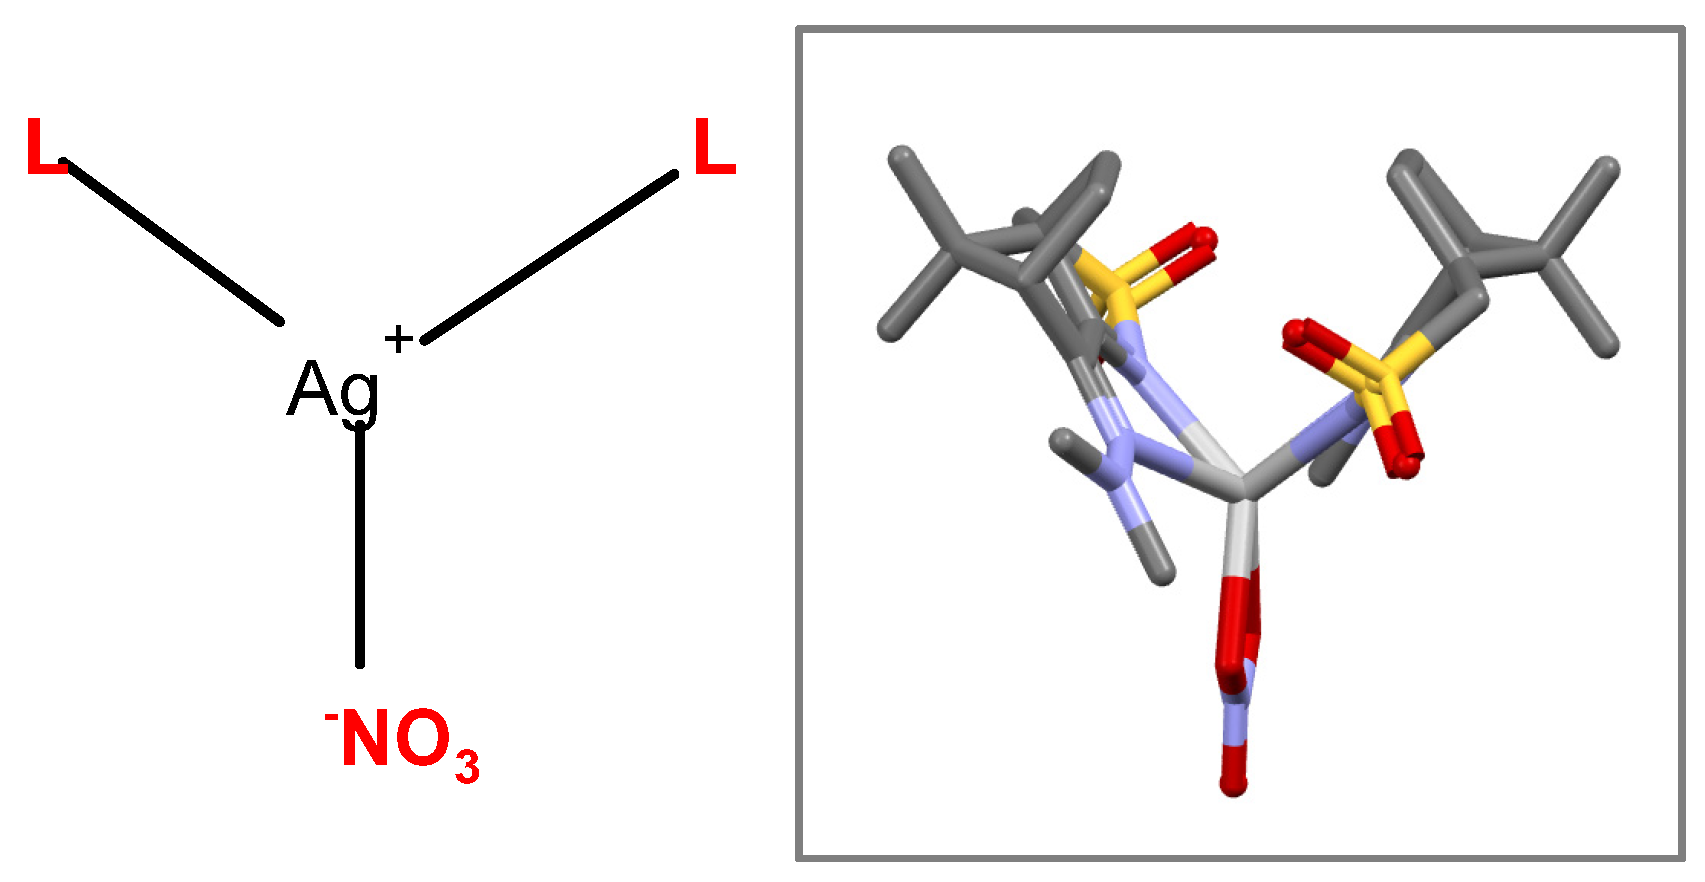
Compounds 1 and 2
2.3. Camphor Sulfonimines (L1−L7)
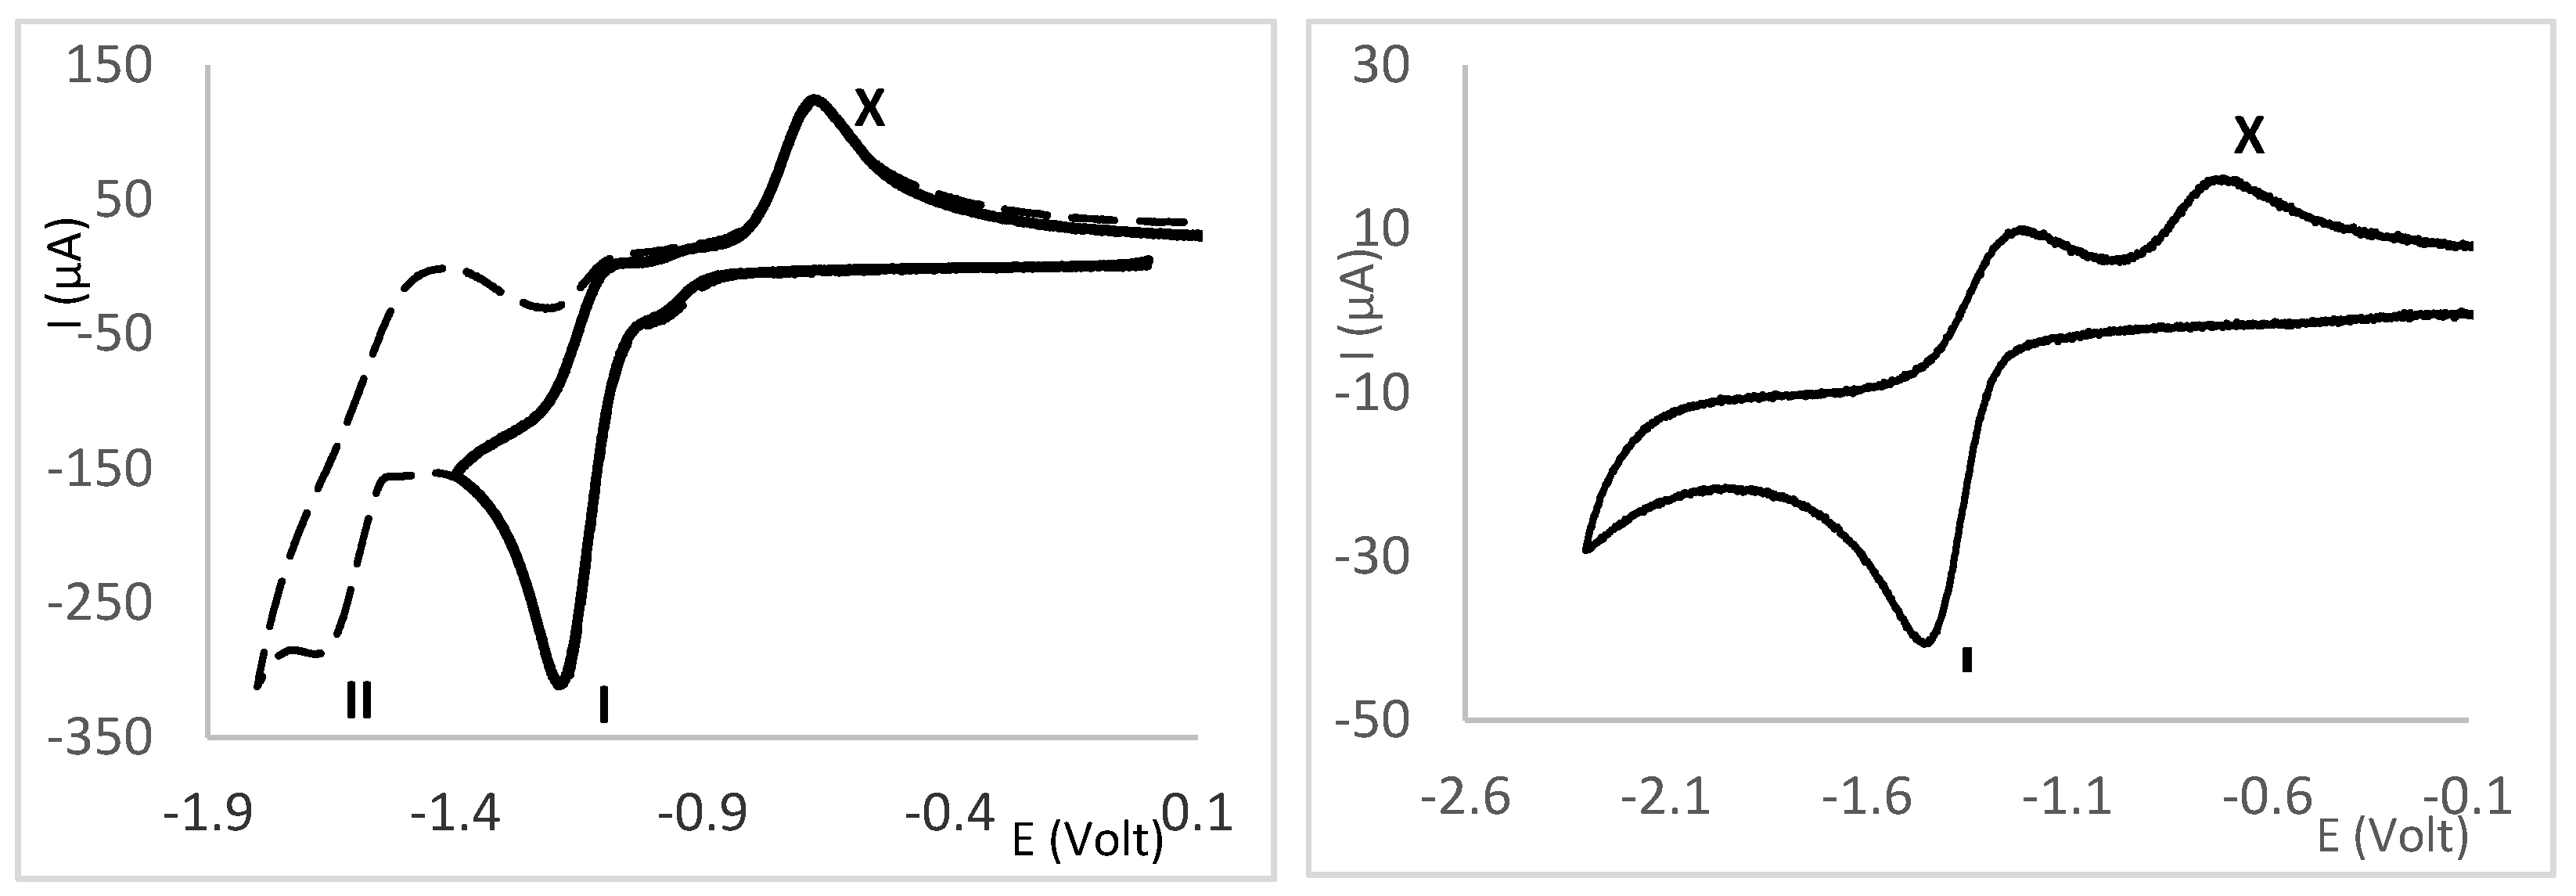
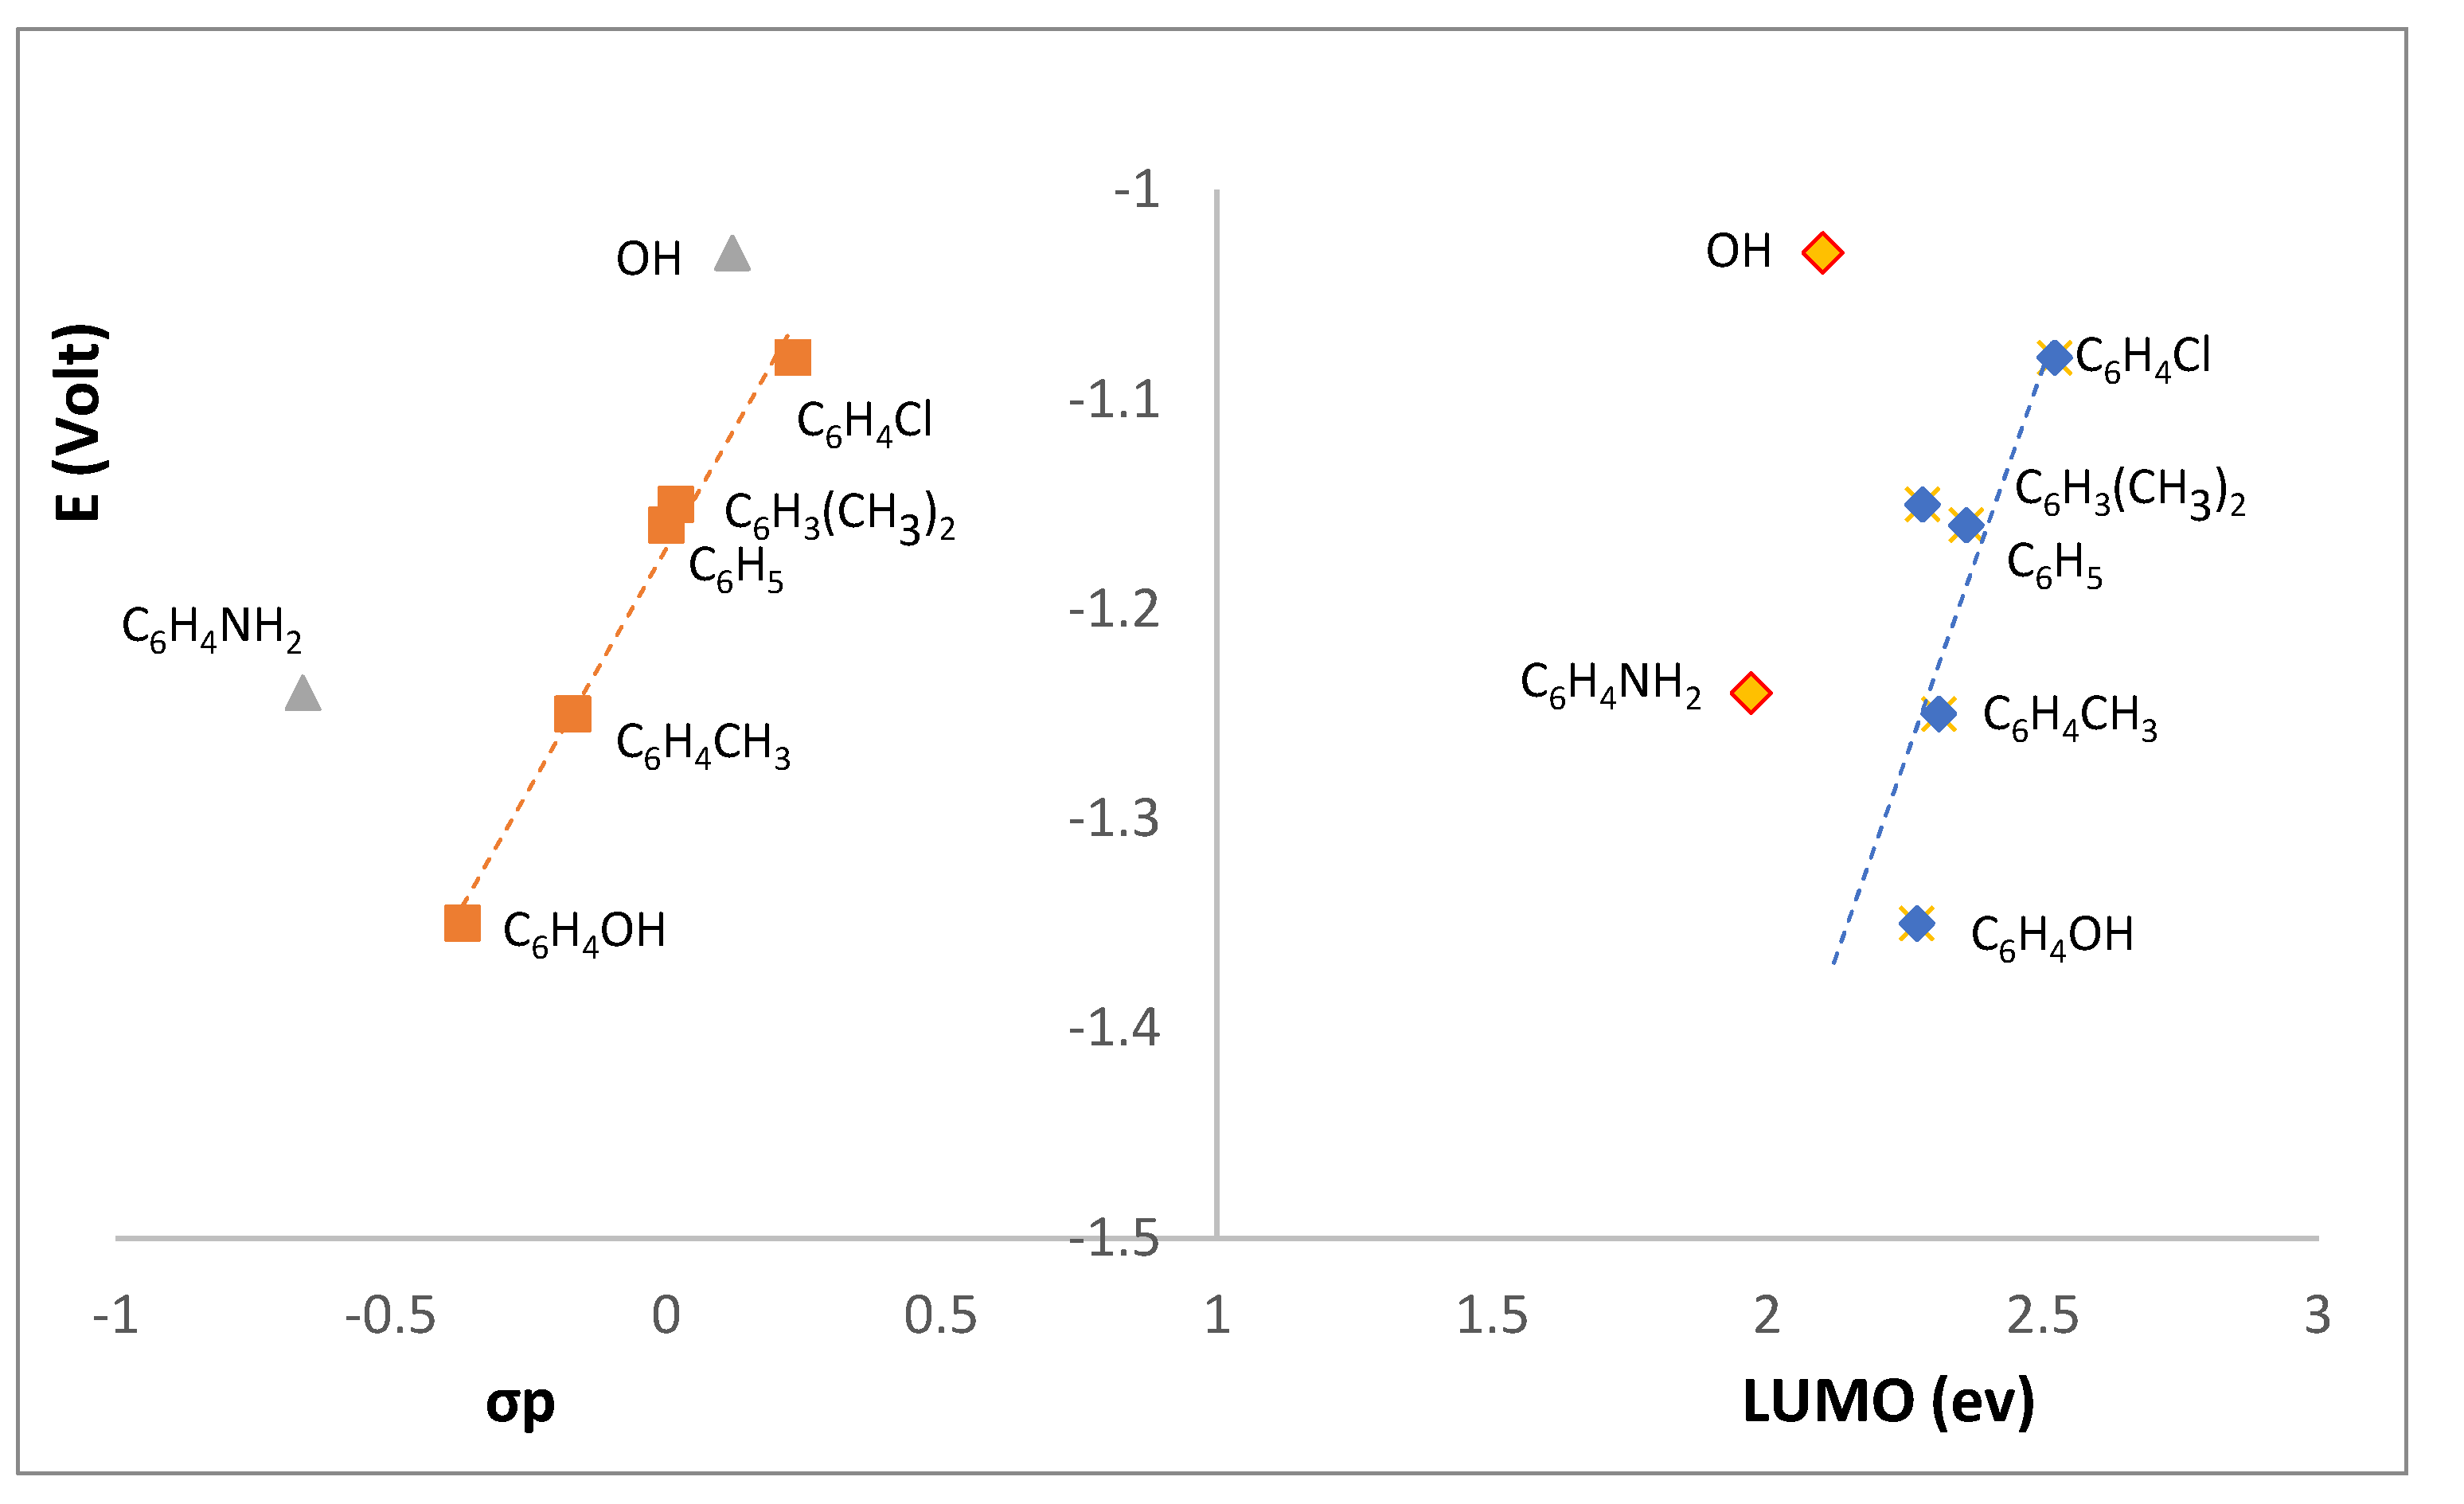
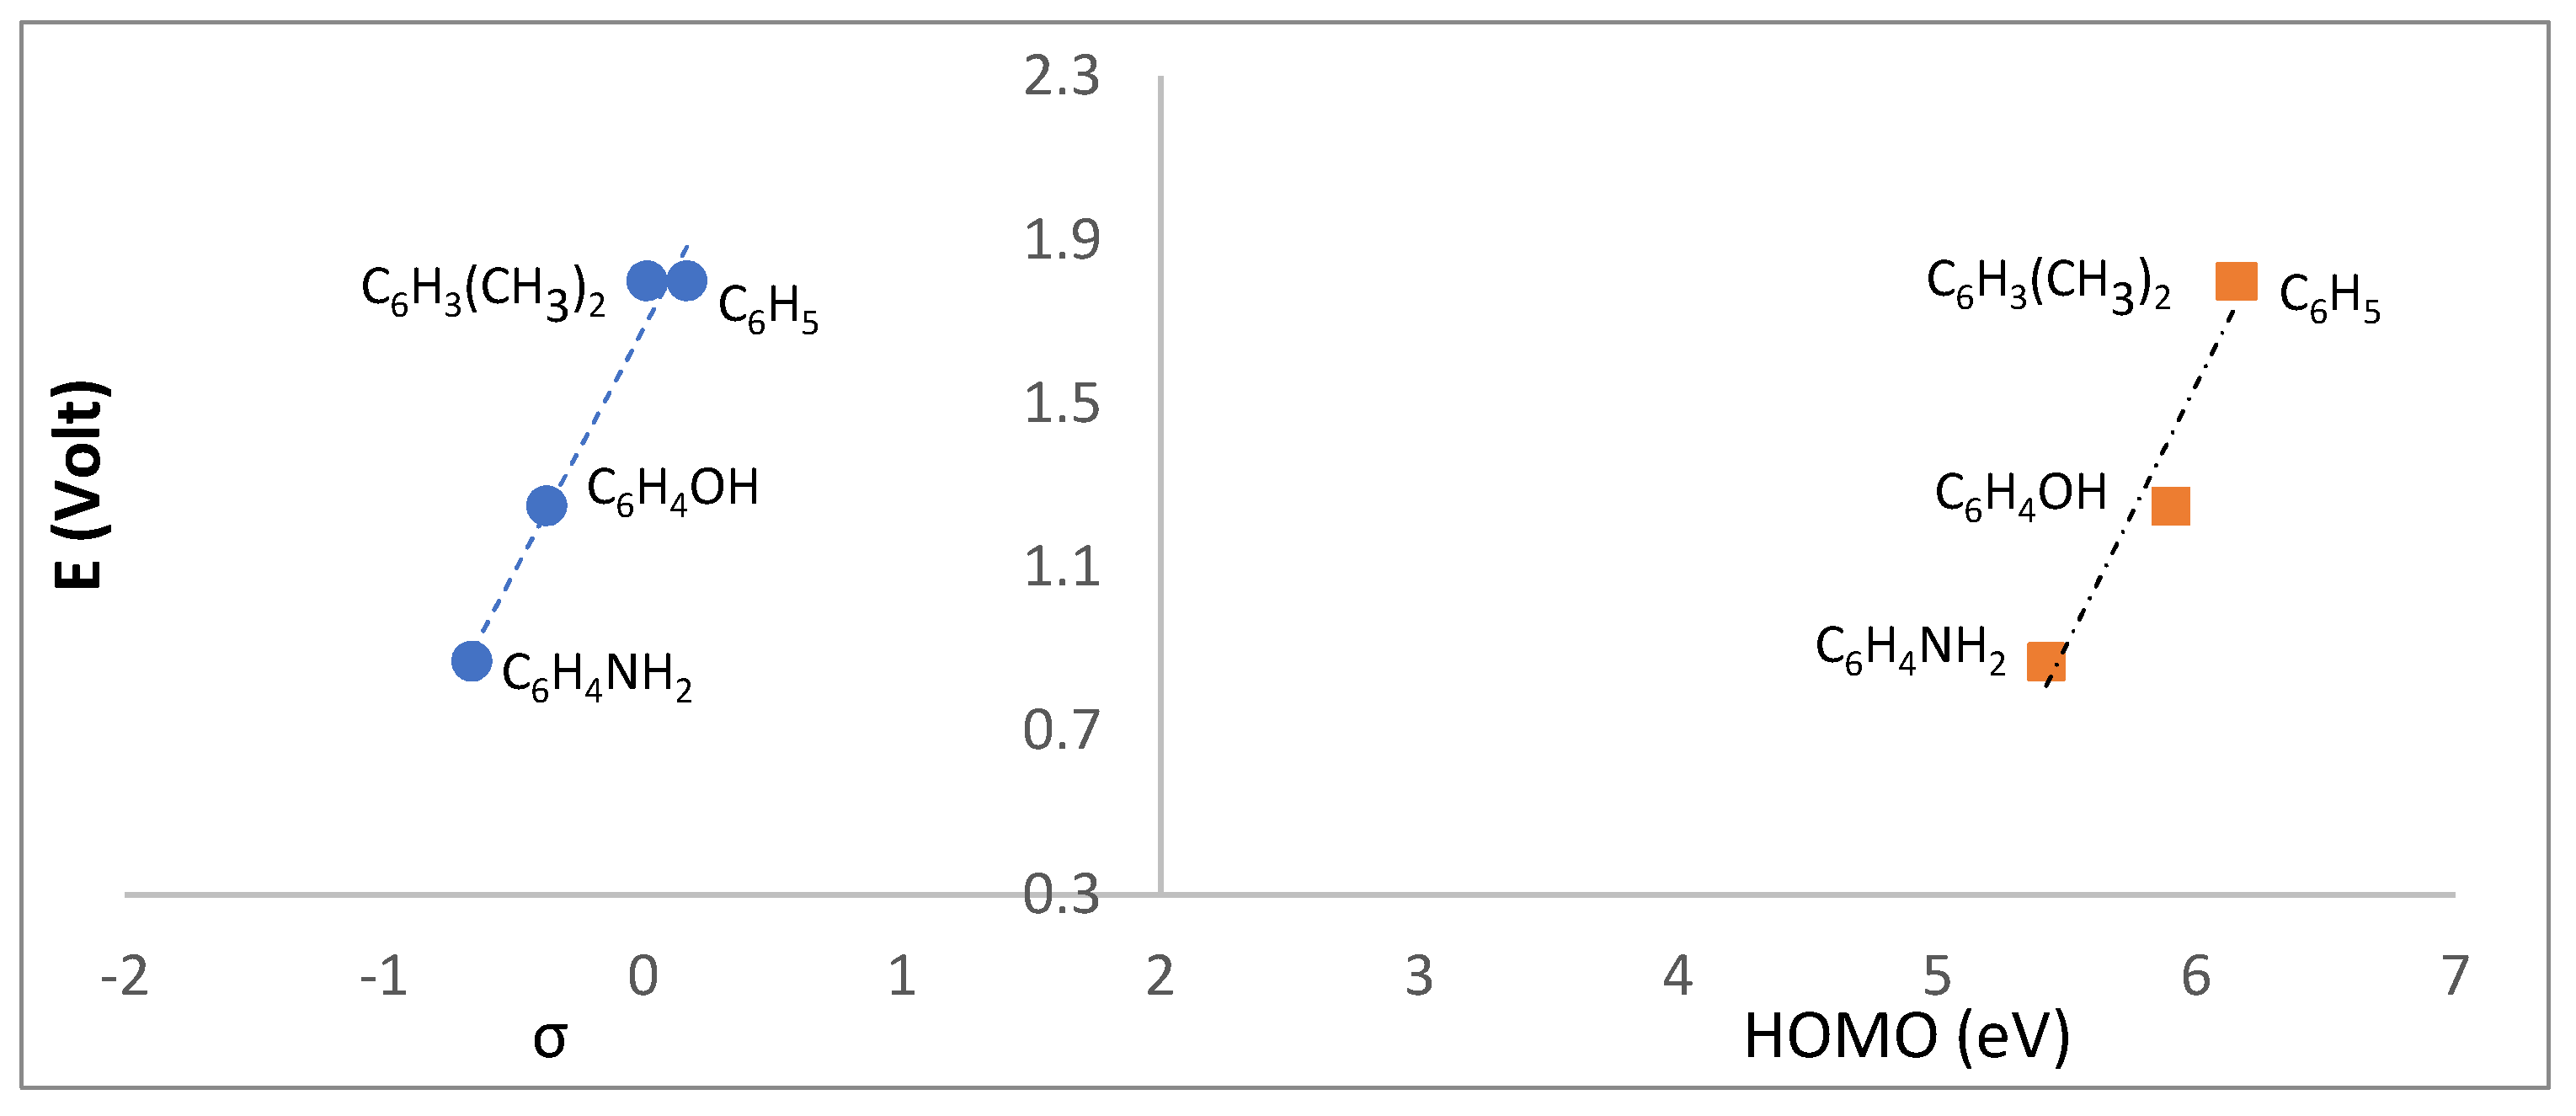
2.4. Redox Properties
3. Conclusions
4. Experimental Section
4.1. Synthesis
4.1.1. Camphor Sulfonimines
4.1.2. Complexes (See Supplementary Material for FTIR and 1H and 13C NMR Spectra)
4.2. Computational Methods
4.3. X-ray Diffraction Analysis
Supplementary Materials
Author Contributions
Funding
Acknowledgments
Conflicts of Interest
References
- Carvalho, M.F.N.N.; Consiglieri, A.C.; Duarte, M.T.; Galvão, A.M.; Pombeiro, A.J.L.; Herrmann, R. Transition metal complexes of (1S,2S,3S)-3-hidroxy-camphorsultam. Inorg. Chem. 1993, 32, 5160–5164. [Google Scholar] [CrossRef]
- Carvalho, M.F.N.N.; Costa, L.M.G.; Pombeiro, A.J.L.; Schier, A.; Scherer, W.; Harbi, S.K.; Verfürth, U.; Herrmann, R. Synthesis, structure and electrochemistry of palladium complexes with camphor-derived chiral ligands. Inorg. Chem. 1994, 33, 6270–6277. [Google Scholar] [CrossRef]
- Cardoso, J.M.S.; Correia, I.; Galvão, A.M.; Marques, F.; Carvalho, M.F.N.N. Synthesis and assessment of the cytotoxic and DNA binding properties of Ag(I) camphor sulphonylimine complexes. J. Inorg. Biochem. 2017, 166, 55–63. [Google Scholar] [CrossRef] [PubMed]
- Wang, Y.-N.; Lu, L.-Q.; Xiao, W.-J. Non-Bonding Interactions Enable the Selective Formation of Branched Products in Palladium-Catalyzed Allylic Substitution Reactions. Chem. Asian J. 2018, 13, 2174–2183. [Google Scholar] [CrossRef] [PubMed]
- Wang, L.; Gou, S.; Chen, Y.; Liu, Y. Potential new antitumor agents from an innovative combination of camphorato, a ramification of traditional Chinese medicine, with a platinum moiety. Bioorg. Med. Chem. Lett. 2005, 15, 3417–3422. [Google Scholar] [CrossRef] [PubMed]
- Rashidi, V.; Coyle, E.J.; Sebeck, K.; Kieffer, J.; Pipe, K.P. Thermal Conductance in Cross-linked Polymers: Effects of Non-Bonding Interactions. J. Phys. Chem. B 2017, 121, 4600–4609. [Google Scholar] [CrossRef] [PubMed]
- Carvalho, M.F.N.N.; Leite, S.; Costa, J.P.; Galvão, A.M.; Leitão, J.H. Ag(I) camphor complexes: Antimicrobial activity by design. J. Inorg. Biochem. 2019, 199, 110791. [Google Scholar] [CrossRef] [PubMed]
- Fernandes, T.A.; Mendes, F.; Roseiro, A.P.S.; Santos, I.; Carvalho, M.F.N.N. Insight into the cytotoxic activity of polynuclear Cu(I) camphor complexes. Polyhedron 2015, 87, 215–219. [Google Scholar] [CrossRef]
- Fernandes, T.A.; Ferraria, A.M.; Galvão, A.M.; Rego, A.M.B.D.; Suárez, A.C.M.; Carvalho, M.F.N.N. Synthesis, characterization and study of properties of Zn(II) camphor derived complexes. J. Organometal. Chem. 2014, 760, 186–196. [Google Scholar] [CrossRef]
- Goerigk, L. A comprehensive overview of the DFT-D3 London-dispersion correction. Non-Covalent Interact. Quantum Chem. Phys. 2017, 195–219. [Google Scholar] [CrossRef]
- Leitão, J.H.; Sousa, S.A.; Leite, S.A.; Carvalho, M.F.N.N. Silver camphorimine complexes: Novel antibacterial compounds from old medicines. Antibiotics 2018, 7, 65. [Google Scholar] [CrossRef]
- Armstrong, H.E.; Lowry, T.M. Studies of the terpenes and allied compounds. The sulphonation of camphor. I. Camphorsulphonic acid (reychler): The formation of anhydramides. J. Chem. Soc. 1902, 81, 1441. [Google Scholar] [CrossRef]
- Liu, X.; McMillen, C.D.; Thrasher, J.S. Cooperative intermolecular S–Cl⋯O and F⋯F associations in the crystal packing of α,ω-di(sulfonyl chloride) perfluoroalkanes, ClSO2(CF2)nSO2Cl, where n = 4, 6. New J. Chem. 2018, 42, 10484–10488. [Google Scholar] [CrossRef]
- Mukherjee, A.; Desiraju, S.T.G.R. Halogen Bonds in Crystal Engineering: Like Hydrogen Bonds yet Different. Acc. Chem. Res. 2014, 47, 2514–2524. [Google Scholar] [CrossRef] [PubMed]
- Hansch, C.; Leo, A.; Taft, R.W. A Survey of Hammett Substituent Constants and Resonance and Field Parameters. Chem. Rev. 1991, 97, 165–195. [Google Scholar] [CrossRef]
- Costa, J.P.; Sousa, S.A.; Galvão, A.M.; Mata, J.M.; Leitão, J.H.; Carvalho, M.F.N.N. Key Parameters on the Antibacterial Activity of Silver Camphor Complexes. Antibiotics 2021, 10, 135. [Google Scholar] [CrossRef] [PubMed]
- Schmidt, M.W.; Baldridge, K.K.; Boatz, J.A.; Elbert, S.T.; Gordon, M.S.; Jensen, J.H.; Koseki, S.; Matsunaga, N.; Nguyen, K.A.; Su, S.; et al. General atomic and molecular electronic structure system. J. Comput. Chem. 1993, 14, 1347–1363. [Google Scholar] [CrossRef]
- Grimme, S.; Antony, J.; Ehrlich, S.; Krieg, H.J. A consistent and accurate ab initio parametrization of density functional dispersion correction (DFT-D) for the 94 elements H-Pu. Chem. Phys. 2010, 132, 154104. [Google Scholar] [CrossRef] [PubMed]
- Sheldrick, G.M. SHELX-97- Programs for Crystal Structure Analysis (Release 97-2); Tammanstrasse 4, D-3400; Institüt für Anorganische Chemie der Universität: Göttingen, Germany, 1998. [Google Scholar]
- Farrugia, L.J. WINGX. J. Appl. Crystallogr. 1999, 32, 837. [Google Scholar] [CrossRef]
- Chemcraft-Graphical Software for Visualization of Quantum Chemistry Computations. Available online: https://www.chemcraftprog.com (accessed on 1 September 2023).
- Macrae, C.F.; Sovago, I.; Cottrell, S.J.; Galek, P.T.A.; McCabe, P.; Pidcock, E.; Platings, M.; Shields, G.P.; Stevens, J.S.; Towler, M.; et al. Mercury 4.0: From visualization to analysis, design and prediction. Wood J. Appl. Cryst. 2020, 53, 226–235. [Google Scholar] [CrossRef] [PubMed]


| Parameter | X-ray | DFT-D3 | |
|---|---|---|---|
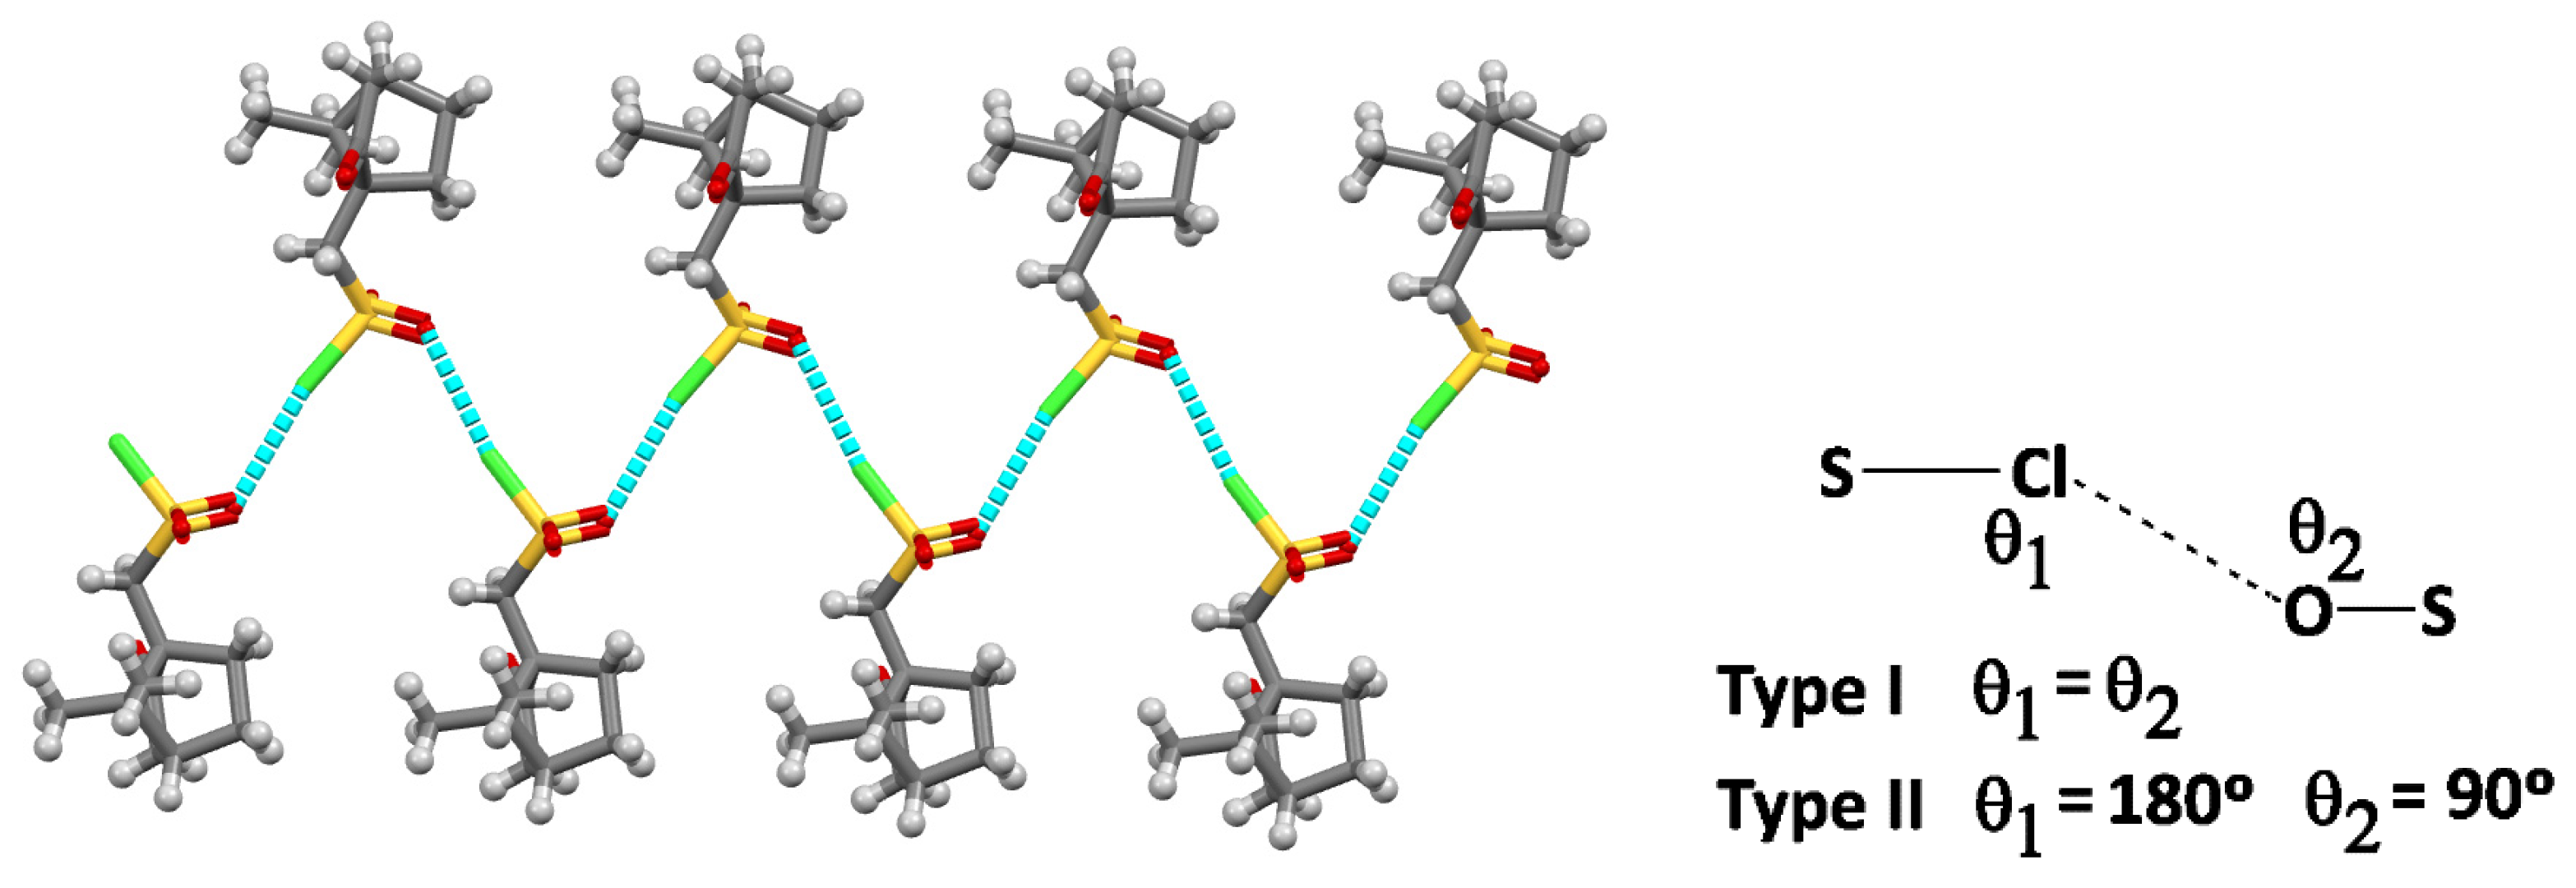
| Cl∙∙∙O | 300 | 311 | |
| S-Cl∙∙∙O | 169.4 | 176.4 | NBIs quasi-Type II |
| S-O∙∙∙Cl | 131.5 | 128.2 |
| R | σpb | |||||
|---|---|---|---|---|---|---|
| Volt | ||||||
 | OH | L1 | −1.03 | — | — | 0.12 |
| 4-OHC6H4 | L2 | −1.35 | — | 1.25 | −0.37 | |
| 4-NH2C6H4 | L3 | −1.24 | −1.69 | 0.87 | −0.66 | |
| 4-ClC6H4 | L4 | −1.08 | −1.61 | — | 0.23 | |
| 4-CH3C6H4 | L5 | −1.25 | — | 1.80 | −0.17 | |
| 3,5-(CH3)2C6H3 | L6 | −1.15 | — | 1.80 | 0.017 | |
| C6H5 | L7 | −1.16 | — | — | 0 | |
| 1. | L1 | L4 | L6 | L7 | |
|---|---|---|---|---|---|
| Emp. formula | C10H13NO3S | C20H28N4O6S2 | C16H17ClN2O2S | C18H22N2O2S | C16H18N2O2S |
| Formula weight | 227.27 | 484.58 | 336.83 | 330.43 | 302.38 |
| Crystal system | Tetragonal | Monoclinic | Orthorhombic | Orthorhombic | Orthorhombic |
| Space group | P43212 | P21 | P212121 | P212121 | P212121 |
| Unit cell dim. | |||||
| a/Å | 7.6255(5) | 6.9975(4) | 8.8877(6) | 9.121(2) | 9.375(1) |
| b/Å | 7.6255(5) | 13.9378(9) | 12.0522(7) | 11.174(2) | 11.724(1) |
| c/Å | 36.400(2) | 11.3550(7) | 14.9100(6) | 35.256(6) | 14.130(2) |
| β/deg | 90 | 95.520(3) | 90 | 90 | 90 |
| Volume (Å−3) | 2116.6(2) | 1102.3(1) | 1597.1(2) | 3593(1) | 1553.1(3) |
| Z, Dcal (g/cm3) | 8, 1.426 | 2, 1.460 | 4, 1.401 | 8, 1.222 | 4, 1.293 |
| Abs. coeff. (mm−1) | 0.292 | 0.288 | 0.378 | 0.191 | 0.214 |
| F(000) | 960 | 512 | 704 | 1408 | 640 |
| Crystal size (mm) | 0.3 × 0.3 × 0.3 | 0.3 × 0.3 × 0.3 | 0.2 × 0.1 × 0.1 | 0.4 × 0.3 × 0.2 | 0.2 × 0.2 × 0.3 |
| θ range (deg) | 2.2 to 29.9 | 2.3 to 32.7 | 2.2 to 26.4 | 1.9 to 32.0 | 2.3 to 32.2 |
| Refl. Collect./uni. | 12,072/3022 | 16,791/7667 | 7174/3253 | 220,676/12,299 | 12,152/5275 |
| [R(int) = 0.0486] | [R(int) = 0.0347] | [R(int) = 0.0349] | [R(int) = 0.5558] | [R(int) = 0.0361] | |
| 3022/0/138 | 7667/1/301 | 3253/0/199 | 12,299/0/423 | 5275/0/192 | |
| Data/restr./par. | R1 = 0.0342, | R1 = 0.0334, | R1 = 0.0409, | R1 = 0.0756, | R1 = 0.0438, |
| Final R (obs.) | wR2 = 0.0896 | wR2 = 0.0865 | wR2 = 0.1026 | wR2 = 0.155 | wR2 = 0.1055 |
Disclaimer/Publisher’s Note: The statements, opinions and data contained in all publications are solely those of the individual author(s) and contributor(s) and not of MDPI and/or the editor(s). MDPI and/or the editor(s) disclaim responsibility for any injury to people or property resulting from any ideas, methods, instructions or products referred to in the content. |
© 2023 by the authors. Licensee MDPI, Basel, Switzerland. This article is an open access article distributed under the terms and conditions of the Creative Commons Attribution (CC BY) license (https://creativecommons.org/licenses/by/4.0/).
Share and Cite
da Costa, J.P.; de Carvalho, M.F.N.N.; Galvão, A.M. Camphor Sulfonimine Compounds: Bottom-Up Design of MOFs from Organic Frameworks Based on X-rays and DFT-D3. Crystals 2023, 13, 1499. https://doi.org/10.3390/cryst13101499
da Costa JP, de Carvalho MFNN, Galvão AM. Camphor Sulfonimine Compounds: Bottom-Up Design of MOFs from Organic Frameworks Based on X-rays and DFT-D3. Crystals. 2023; 13(10):1499. https://doi.org/10.3390/cryst13101499
Chicago/Turabian Styleda Costa, Joana Pais, Maria Fernanda Nascimento Neves de Carvalho, and Adelino Moura Galvão. 2023. "Camphor Sulfonimine Compounds: Bottom-Up Design of MOFs from Organic Frameworks Based on X-rays and DFT-D3" Crystals 13, no. 10: 1499. https://doi.org/10.3390/cryst13101499
APA Styleda Costa, J. P., de Carvalho, M. F. N. N., & Galvão, A. M. (2023). Camphor Sulfonimine Compounds: Bottom-Up Design of MOFs from Organic Frameworks Based on X-rays and DFT-D3. Crystals, 13(10), 1499. https://doi.org/10.3390/cryst13101499