1. Introduction
Currently, ultrafine-grained (UFG) and nanocrystalline (NC) metals and alloys possess attractive mechanical properties. Their categorization by size was spurred by their unusual mechanical behavior, occurring once the grain size (GS) reaches a critical value ranging from 15 nm to 30 nm [
1,
2,
3,
4,
5,
6,
7,
8,
9,
10,
11]. The effect of GS on their mechanical behavior can be broadly grouped into two categories. UFG materials can be defined by their grain size (GS) range, with some researchers citing a range of 100–1000 nm [
5], while others propose a range of 250–1000 nm [
6]. Additionally, other studies suggest that the lower limit of UFG size can extend down to 10 nm [
3,
4].
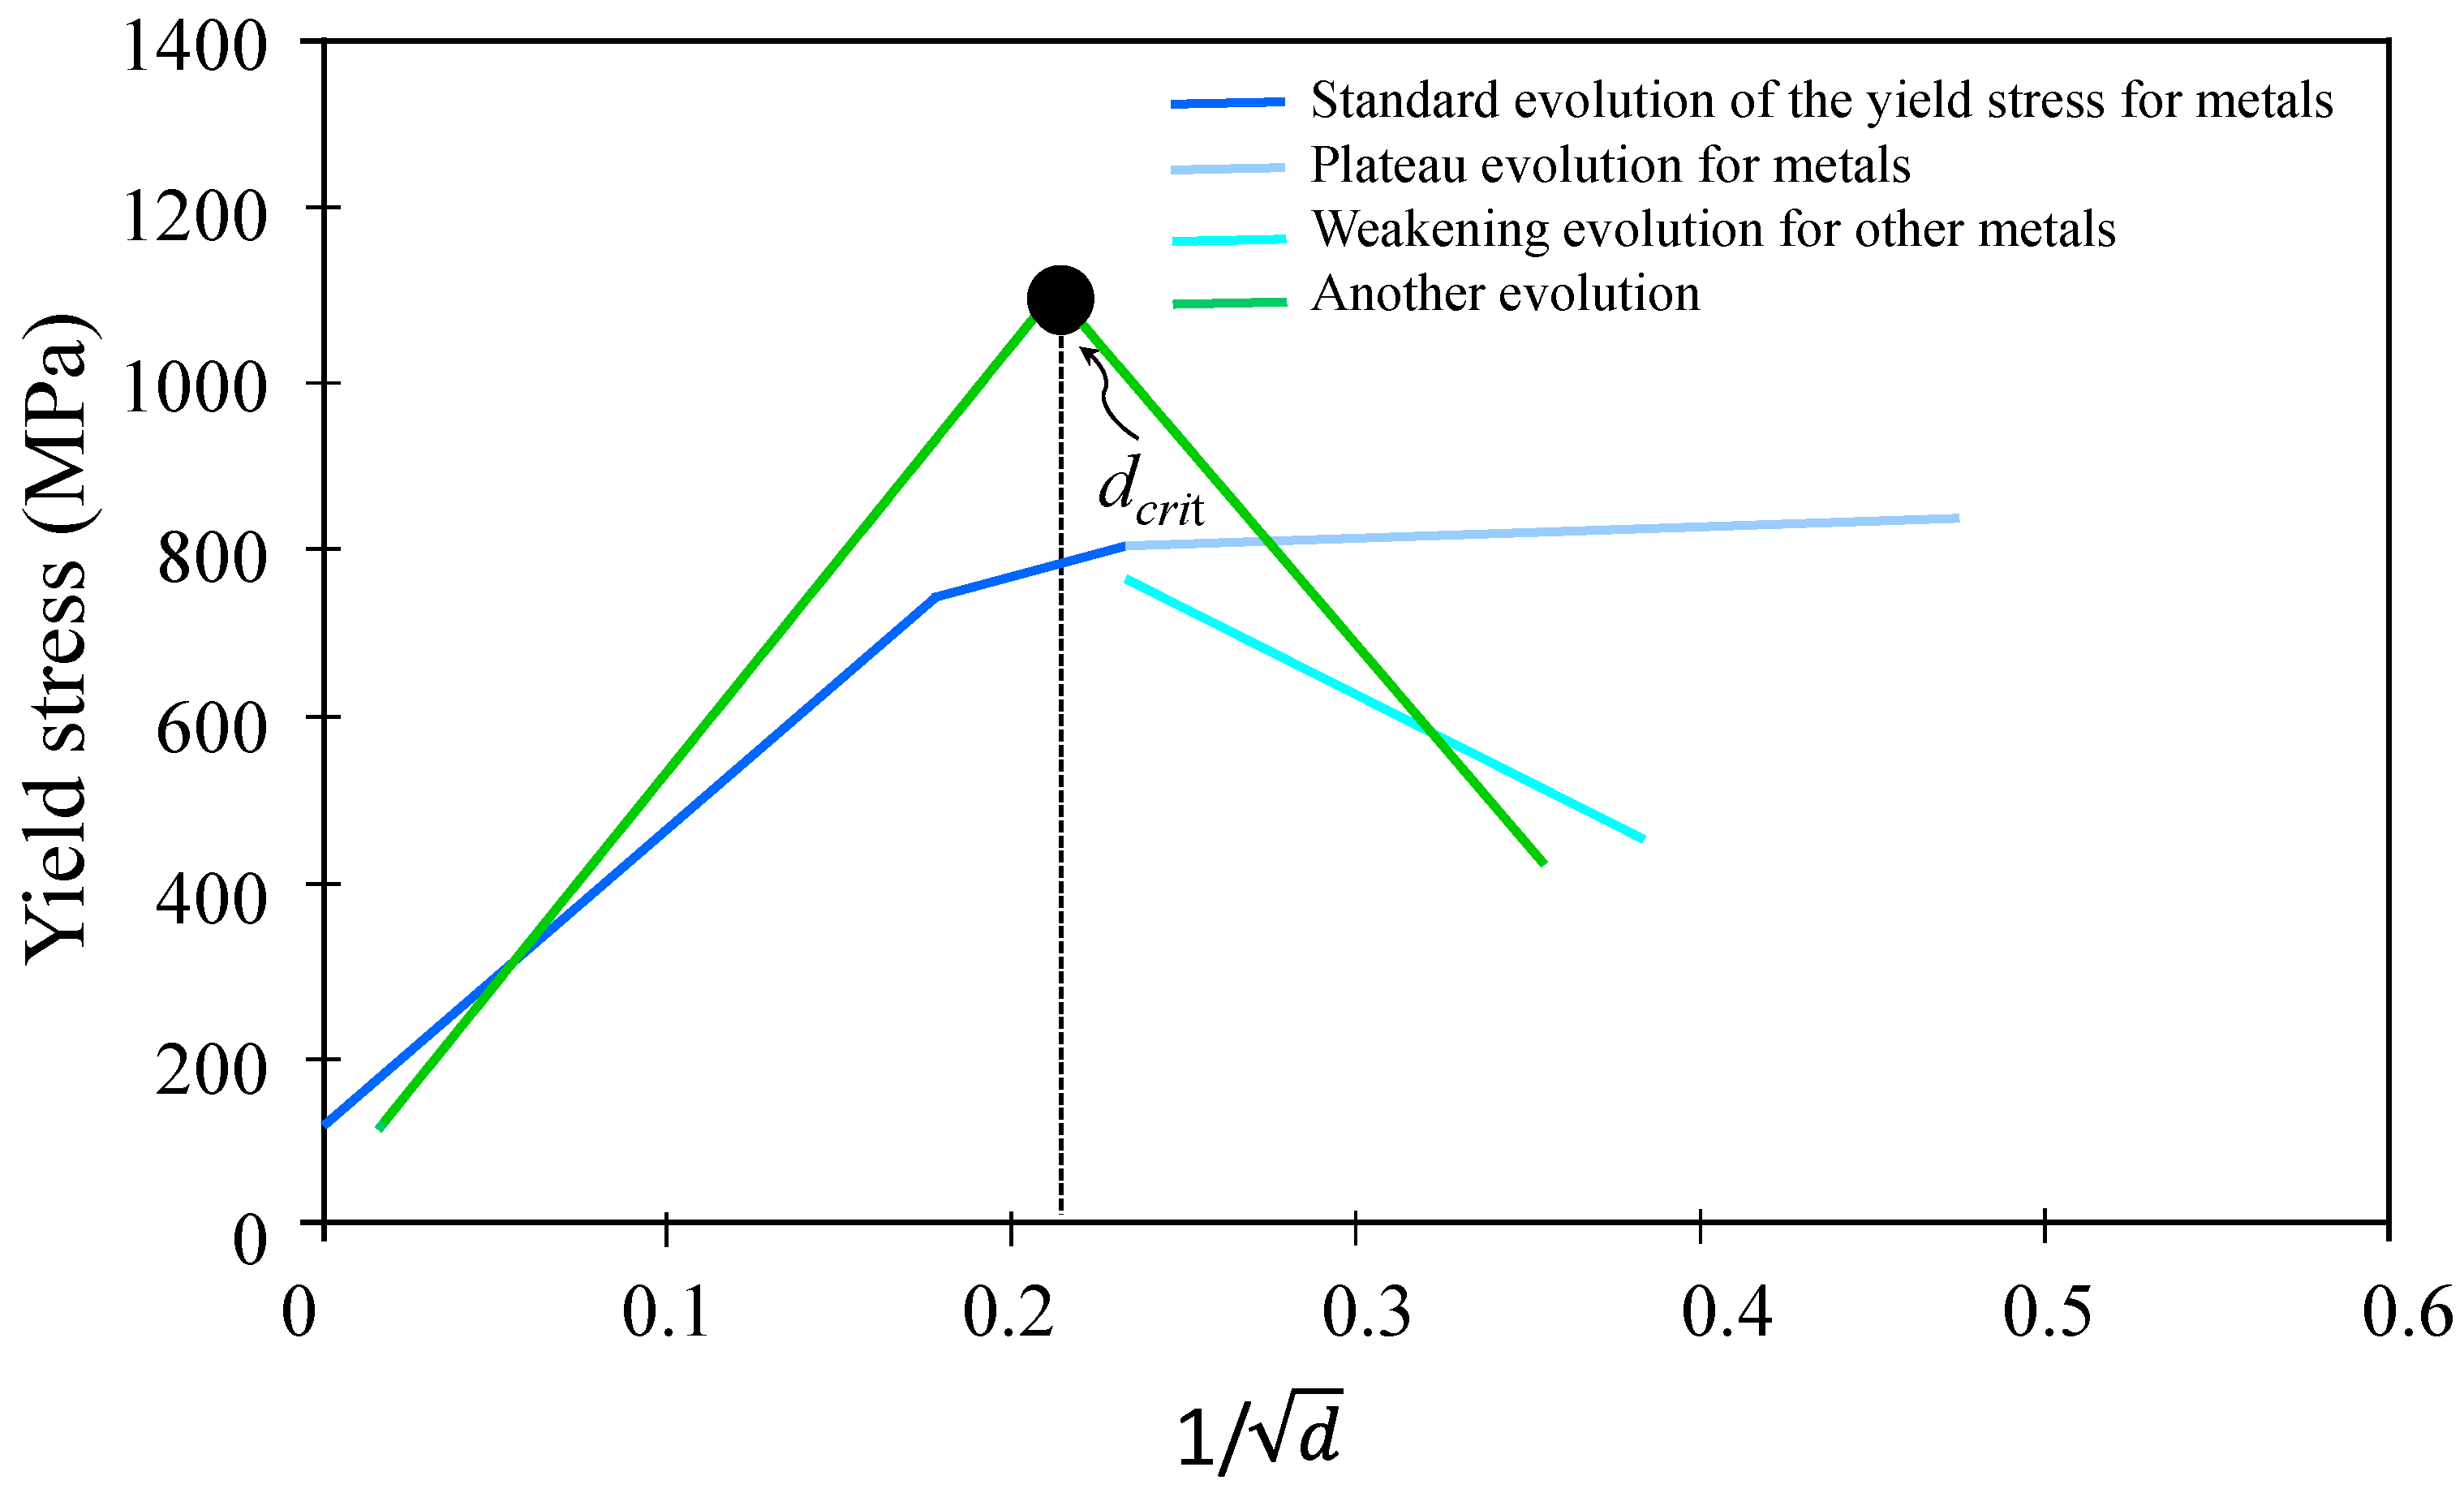
Figure 1 shows that the highest yield strength occurs when GS is 25 nm [
3,
4]. It is noteworthy that the critical value of GS (
dcrit) varies between 15 and 30 nm, depending on the material, and when it falls below
dcrit, a weakening or plateau stage in the metals can be observed.
The negatively sloped Hall–Petch law, which is a significant concern, is noticeable due to grain boundaries (GSs) when the diameter is less than 25 nm (
Figure 1). This conduct may stem from the Coble creep caused by intergranular diffusion [
12,
13] or intergranular slip [
14]. When the diameter is less than 50 nm, the primary deformation mechanism is grain boundary sliding [
15], in which grains slide past each other [
16]. The more extensive the tension level at room temperature, the more grain boundary sliding becomes the dominant deformation mechanism. With a smaller grain size, the predominant mechanism for grain boundary diffusion creep increases. Consequently, a significant volume fraction of the grain boundary describes the nanocrystalline metals, resulting in noteworthy mechanical properties compared to conventional coarse-grained polycrystalline metals [
17,
18]. In deformed nanocrystalline metals, there is a competition between the creation of dislocations and their annihilation during recovery that indicates a state of density saturation. Although the generation of dislocations at grain boundaries acting as sinks is still debated, it has been shown that the non-equilibrium state of grain boundaries in NC metals possesses a higher dislocation density than the equilibrium boundaries [
19]. In the case of FCC metals, twinning necessitates low temperatures or high strain rates. Nevertheless, aluminum with small grain sizes could not generate twinning even under these severe conditions [
20]. Therefore, twinning is difficult to achieve with decreasing GS.
The strength increase in UFG materials often results in reduced ductility due to the rise in high-angle grain boundary fraction and reduced total dislocation density during plastic deformation [
3]. To address ductility deficiencies, one can implement techniques such as stress relaxation and reduction in dislocation density [
21,
22,
23]. The work-hardening and its rate in UFG have also been analyzed [
24]. It has been noted that rapid saturation occurs for plastic strains of less than 3%. However, contrary behavior is exhibited by coarse-grained polycrystalline metals (10 μm < d < 300 μm), as seen in [
25,
26]. Understanding the hardening response of such materials, as well as the strengthening of GBs [
27], requires consideration of the accumulation of dislocations.
In UFG metals, dislocations are inhomogeneous, resulting in a non-equilibrium GB configuration. This enhances their diffusivity and static recovery [
28,
29]. The spread of GBs, thereby, influences the overall mechanical characteristics of UFG metals [
21]. The strength and ductility of UFG metals seem to be controlled by the interaction of dislocations/GS.
In summary, various local mechanisms, including the break-up of dislocation pile-ups, core-and-mantle structure, grain-boundary sliding, grain-boundary diffusion, grain-boundary dislocation emission, and annihilation, serve as driving forces for the response of UFG and NC metals [
8].
Various approaches have been developed for modeling this type of material, including the following: (1) Geometrically necessary dislocations (GNDs) [
30]; (2) Micro–macro based on Hall–Petch at the microscale [
8,
31,
32,
33]; (3) Two-phase mixture approach [
34,
35,
36,
37]; and (4) Dislocation kinematics of boundary diffusion mechanism approach [
7,
38,
39,
40].
This study comprises two primary parts. The first section discusses the modeling aspects and highlights the essential features of the two models used: Model-1, previously developed by [
8], and Model-2, proposed by [
7]. Specifically, Model-1 models the impact of GS on metal behavior at two different length scales, slip system and granular level. The reduction in GS, particularly in NC metals, increases the importance of grain boundary in their overall behavior. This is the result of various local deformation mechanisms that are explained by the model coefficient (Θ
o). Conversely, a new Model-2 has been created by leveraging dislocation kinematics and the thermal diffusion concept at the microscale.
The second part showcases separate applications, with calibrated coefficients for each model and metal (copper and nickel). Subsequently, a comparative study emphasizes their ability to predict the experimental databases that accurately support these different metals with various GSs. This study shows the influence of the GS on the plastic behavior, specifically the inflection point, i.e., dcrit for NC metals, which is a crucial aspect. How do these models vary in achieving the desired performance and implicitly describing the impact of linked dislocation mechanisms at the intragranular and intergranular levels?
2. Self-Consistent Models
Both models utilize the elastoplastic self-consistent model [
41,
42,
43,
44] and incorporate three operating length scales: (i) The first scale operates on a
macroscale level, consisting of a grain aggregate with a distribution of random crystals of varying orientations. This level introduces two second-order tensors, representing the macro stress (
) and macro strain (
); (ii) At the
mesoscale level, the crystal morphology and spatial distribution are neglected. Two second-order tensors for granular stress (
) and granular strain (
) are assumed. Note that the heterogeneity at this level is present due to the orientation of crystals; (iii) Specifically, on the
microscale, we observe slip systems denoted as ss. For both models, we adopted local isotropic hardening (LIH) (q
s, R
s) on each ss, where R
s represents its associated force, and q
s refers to the isotropic hardening variable, described by a differential equation provided below. We also considered interaction effects among the ss in each grain.
Two sources of back stress, known as kinematic hardening, can be experimentally observed. The first source of stress is caused by the incompatibility of plastic deformations at the boundaries between grains (intergranular), resulting in non-uniform stress and strain fields at the mesoscale. The second source of stress (intragranular) can be provoked at the ss level. In this self-consistent approach, the interaction law describes the global effects of these back stresses naturally and implicitly through the coefficient (Θ
ο) [
41]. Model-1 considered this coefficient as one of the key parameters for modeling the GS effect.
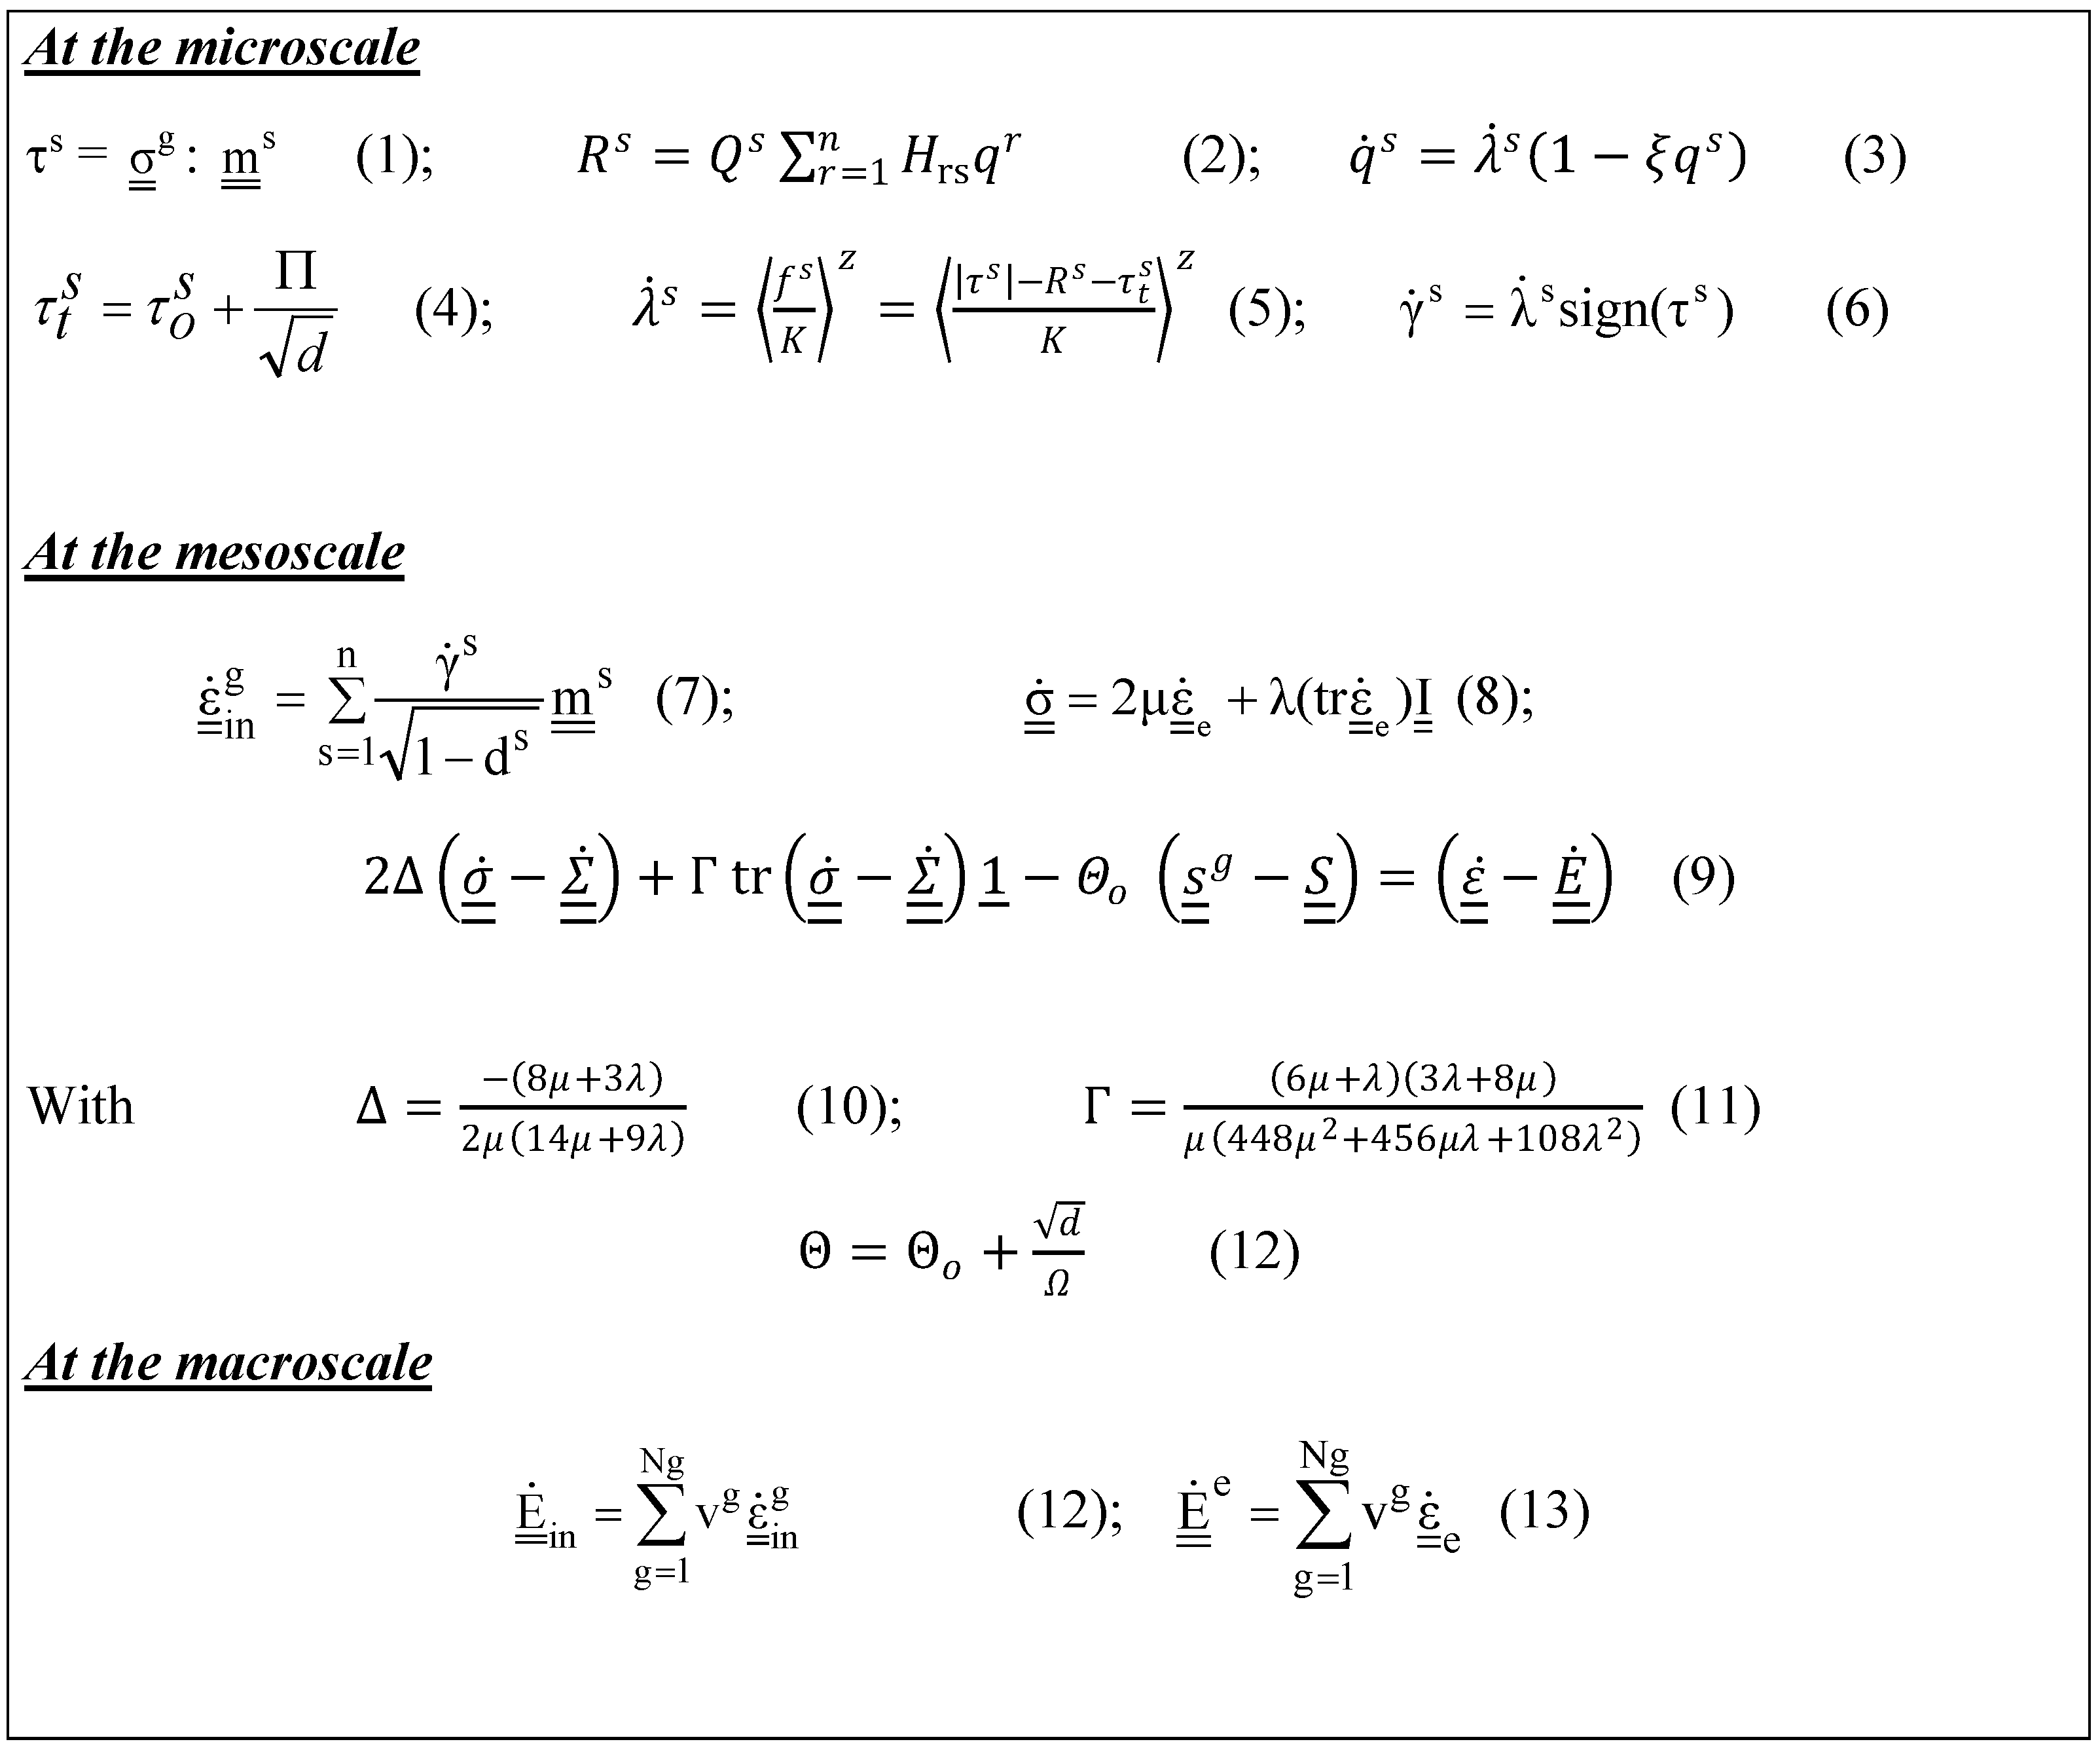
Crystals in the distribution were assumed to possess equivalent elastic coefficients. The homogenization process was utilized to compute the overall elastic strain tensor () in conjunction with the overall inelastic strain tensor (), resulting in the overall total strain (), utilizing the small strain assumption framework.
The metals used in this study have an FCC structure, thereby allowing for the activation of a maximum of 12 slip systems (n = 12). The maximum number of crystals in the aggregate of grains is Ng, where the index g {1, 2,…., Ng} denotes the grain rank.
The granular elasticity is assumed to be both isotropic and homogeneous, resulting in the granular stress
being expressed as follows:
where
is the second-order identity tensor, and λ and μ are the classical granular Lame’s coefficients considered to be independent of grain size.
The LIH force R
s is expressed by [
41] as follows:
where
Q represents the LIH modulus, which is considered equal for all ss, and
Hrs is the hardening interaction matrix. This considers the interaction of dislocations and provides the cross-effect of the slip of system
s on the hardening of system
r, including self-hardening and cross-hardening within the same grain.
At the microscale, neglecting the GS effect, the yield surface can be modeled as Schmid type (f
s) [
41] as follows:
where
and
are the friction stress (local yield shear stress) and the resolved shear stress on each
ss, respectively.
is defined by a tensorial product between the Schmid’s orientation tensor
and the granular stress
, given therefore by the following:
The plastic multiplier
for each
ss was modeled by a power law based on the yield surface (3):
where K and z are material coefficients describing the material’s local viscous effect.
The plastic potential F
s for the non-associated plasticity configuration is expressed by the following [
43]:
where
is a material coefficient of LIH considered equal for all
ss.
The laws governing the evolution of granular plastic strain and LIH variables are derived through the application of the generalized normality rule.
with
where
is the slip rate.
The orientation tensor
is defined by the following:
where
and
are the slip direction and slip plane normal unit vectors, respectively.
The rate of change in LIH
is given by the following [
43]:
The interaction law developed by [
42,
43,
44] without the effect of GS is expressed by the following:
where Θ
ο is a model coefficient describing the back-stress effects, and
and
are the macroscopic and granular deviatoric parts of the Cauchy stress tensor, respectively. The constants Δ and Γ are functions of the Lame’s coefficients defined as follows:
It is assumed that material responses at the macroscale are influenced by the responses at the mesoscale. Consequently, the macroscale elastic and inelastic strain rates are determined by the classical homogenization process [
41]:
where v
g is the grain volume fraction
Since the small strain assumption was adopted, the total macro strain rate (
) is deduced as follows:
2.1. Modeling of Grain Size Effect
It is important to note that the aforementioned equations apply to both models. To address the impact of GS on the mechanical behavior of metals, each model employs a distinct approach. For Model-1, extensions were proposed at two levels—microscale and mesoscale—specifically the microscale yield surface (Equation (3)) and microscale interaction law (Equation (11)). Model-2 only utilizes the microscale yield surface (Equation (3)). Secondly, Model-1 development was conducted using the Hall–Petch formula, while Model-2 adopted the concept of dislocation kinematics.
The main objective of this work is to compare the two approaches and their ability to predict plastic behavior with the GS effect, specifically the UFG/NC transition. This will be achieved by investigating their respective aptitudes.
2.1.1. Model-1
The grain boundary, considered a soft phase, exhibits a pronounced gradual impact on mechanical responses as the GS decreases, while the grain itself represents the hard phase (e.g., [
32,
35,
36,
37]). The mechanical response of metals is mainly influenced by the GS due to the contribution of these two phases. Consequently, the grain (hard phase) was modeled using the Hall–Petch concept at the microscale [
8]:
where
is the initial flow stress influenced by the GS;
is the friction stress for an infinite GS; Π is a material coefficient, and
d is the grain size.
Therefore, the new local yield surface affected by grain size is written by [
8] as follows:
Back stress is known to be generated due to the plastic deformation incompatibility between grains, and it is influenced by GS. Specifically, the volume fraction of grain boundaries increases proportionally to grain refinement, particularly in NC metals. When
d <
dcrit, all local deformations are accommodated at grain boundaries, as shown in the atomic level analysis of copper. The activated accommodation process influences the deformation rate, and grain-boundary sliding (GBS) plays a crucial role in this process. The existence of groups of GBS together was captured [
45], and it is also associated with cooperative grain boundary migration and grain boundary rotation [
46]. Furthermore, the average grain-boundary dislocation-free path is significantly reduced, allowing for easier dislocation motion toward the opposite grain-boundary side [
1,
2,
47,
48]. Thus, the density of dislocations is low during plastic strain without significant hardening. However, for larger GSs, i.e.,
d >
dcrit, deformations predominantly occur within the crystal. As a result, several local mechanisms at the grain boundary level could be considered, such as GB sliding, GB diffusion, GB dislocation emission, and GB annihilation. Many of these mechanisms and the interactions between dislocations and grain boundaries require further exploration and development.
For any model, the objective is to replicate the GS effect on NC metals, primarily concerning their plastic behavior. Thus, it is appropriate to take into account the grain-boundary contribution. As a result, these local mechanisms of deformation and their impact have been globally considered in Model-1 [
8]. Notably, the GS effect, which is expressed as follows, is considered through the law of interaction (Equation (11)), employing its key coefficient, Θ
ο, to naturally describe the back-stress effect [
8]:
where Θ
o represents a model coefficient for an infinite grain size; Θ is a material coefficient that globally describes the contribution of the grain boundary as a soft phase; Ω is a key material coefficient that describes the attribution of local mechanisms associated with the grain boundary, and
d represents the grain size.
The ratio of
plays an important role in the description of yield strength evolution due to grain size effects, especially during the transition from UFG to NC. This ratio influences Θ
o at the mesoscale, which governs the hardening evolution. Consequently, this new interaction law, in conjunction with the GS effect, characterizes the behavior of UFG and NC materials [
8]. The GS effect contributes significantly to both meso- and microscales and displays remarkable complementarity, enabling coverage of a wide range of GS effects, including UFG and NC. The new microscale yield surface (17) and the ratio
describe
dcrit. Consequently, the predicted yield strength weakening zone matches the experimental results. Due to the grain boundary effect in NC materials, the interaction between two scales provides the ability for the grain boundary effect to influence the response of metals.
2.1.2. Model-2
This approach, akin to Model-1, examines the yield surface (f
s) at the microscale (Equation (3)), where
denotes the friction stress for an infinite grain size. The evolution of friction stress affected by GS was illustrated utilizing the kinematic dislocation equations and the notion of thermal diffusion [
7].
Therefore, the yield surface affected by the GS is expressed as follows:
with
where
χGB is a new term describing the GS effect.
The relationship between dislocation density and plasticity in UFG metals is initially investigated by assuming a uniform distribution of dislocations with an average density across the grain [
38,
49,
50]. Consequently, many mechanisms related to dislocations, such as dislocation accumulation, annihilation, and thermal diffusion, are significantly affected by GS. Therefore, the impact of GS on the microscale (i.e., ss) can be defined [
7] as follows:
where
d is the average grain size;
is reference granular shear strain, and
A, C, and
D are constants calculated, respectively, as follows:
where
is the coefficient of dislocation annihilation by slip mechanisms determining the dynamic restoration of the intensity in a deformed metal:
where
Dgb denotes the diffusion coefficient at the grain boundaries at room temperature. Its value varies between 10
−19 and 10
−22 m
2/s. Note that for
FCC metals,
B values are close to each other;
m is the Taylor orientation coefficient;
is the applied strain rate, and the thermal activation coefficient
is defined by
, where
μ is the shear modulus;
b3 is the activation volume;
θ is the temperature, and
is the Boltzmann constant.
where
α is a dimensionless parameter ranging from 0.05 to 0.26, depending on the material;
b is the Burgers vector, and
is a constant accounting for dislocation storage.
where
βo is an isothermal strain constant.
3. Applications
After outlining the main constitutive equations for the two multiscale modes, Model-1 and Model-2 were programmed and are summarized in
Figure A1 (
Appendix A) and
Figure A2 (
Appendix B), respectively. The stress–strain response for copper and nickel will be analyzed to study the GS effect, comparing the ability of each model through a consistent comparison.
3.1. Tested Materials
This published milestone paper [
51] utilized experimental copper databases. In reference to nickel, a micrometer nickel powder (supplied by Sigma-Aldrich, Saint-Quentin, France) with a purity of 99.99% was used. Sintering at 850 °C for one minute produced a microstructure centered around 3.79 µm. Additionally, the company Argonide fabricated Ni nanopowder with an average diameter of 220 nm via electro-explosion of fibers. Before undergoing Spark Plasma Sintering (SPS), the powder exhibited a size distribution with a mean of approximately 50 nanometers. SPS was conducted using an optimal cycle at 550 °C for 1 min. The resulting microstructure of the matrix displayed an average diameter of 220 nm.
To experimentally characterize nickel, a microtesting machine was utilized for tensile, compression, and bending (refer to
Figure 2), which has a small size of 148 × 114 × 39 mm
3. This machine comes from the Research laboratory LSPM, located in France. Prior to testing, specimens were cut using electrical discharge machining (EDM) from rough nickel UFG specimens. Compression tests were carried out at room temperature with a quasi-static strain rate of 10
−4/s. The specimen had a cross-sectional area of 4 mm
2, with dimensions of 2 × 2 × 3 mm
3. The ANR-mimic project (no. ANR 09-BLAN-0010-01) provided these results.
3.2. Identification of Model Coefficients
The model coefficients were identified using experimental databases available for nickel and copper. Both metals possess an FCC microstructure.
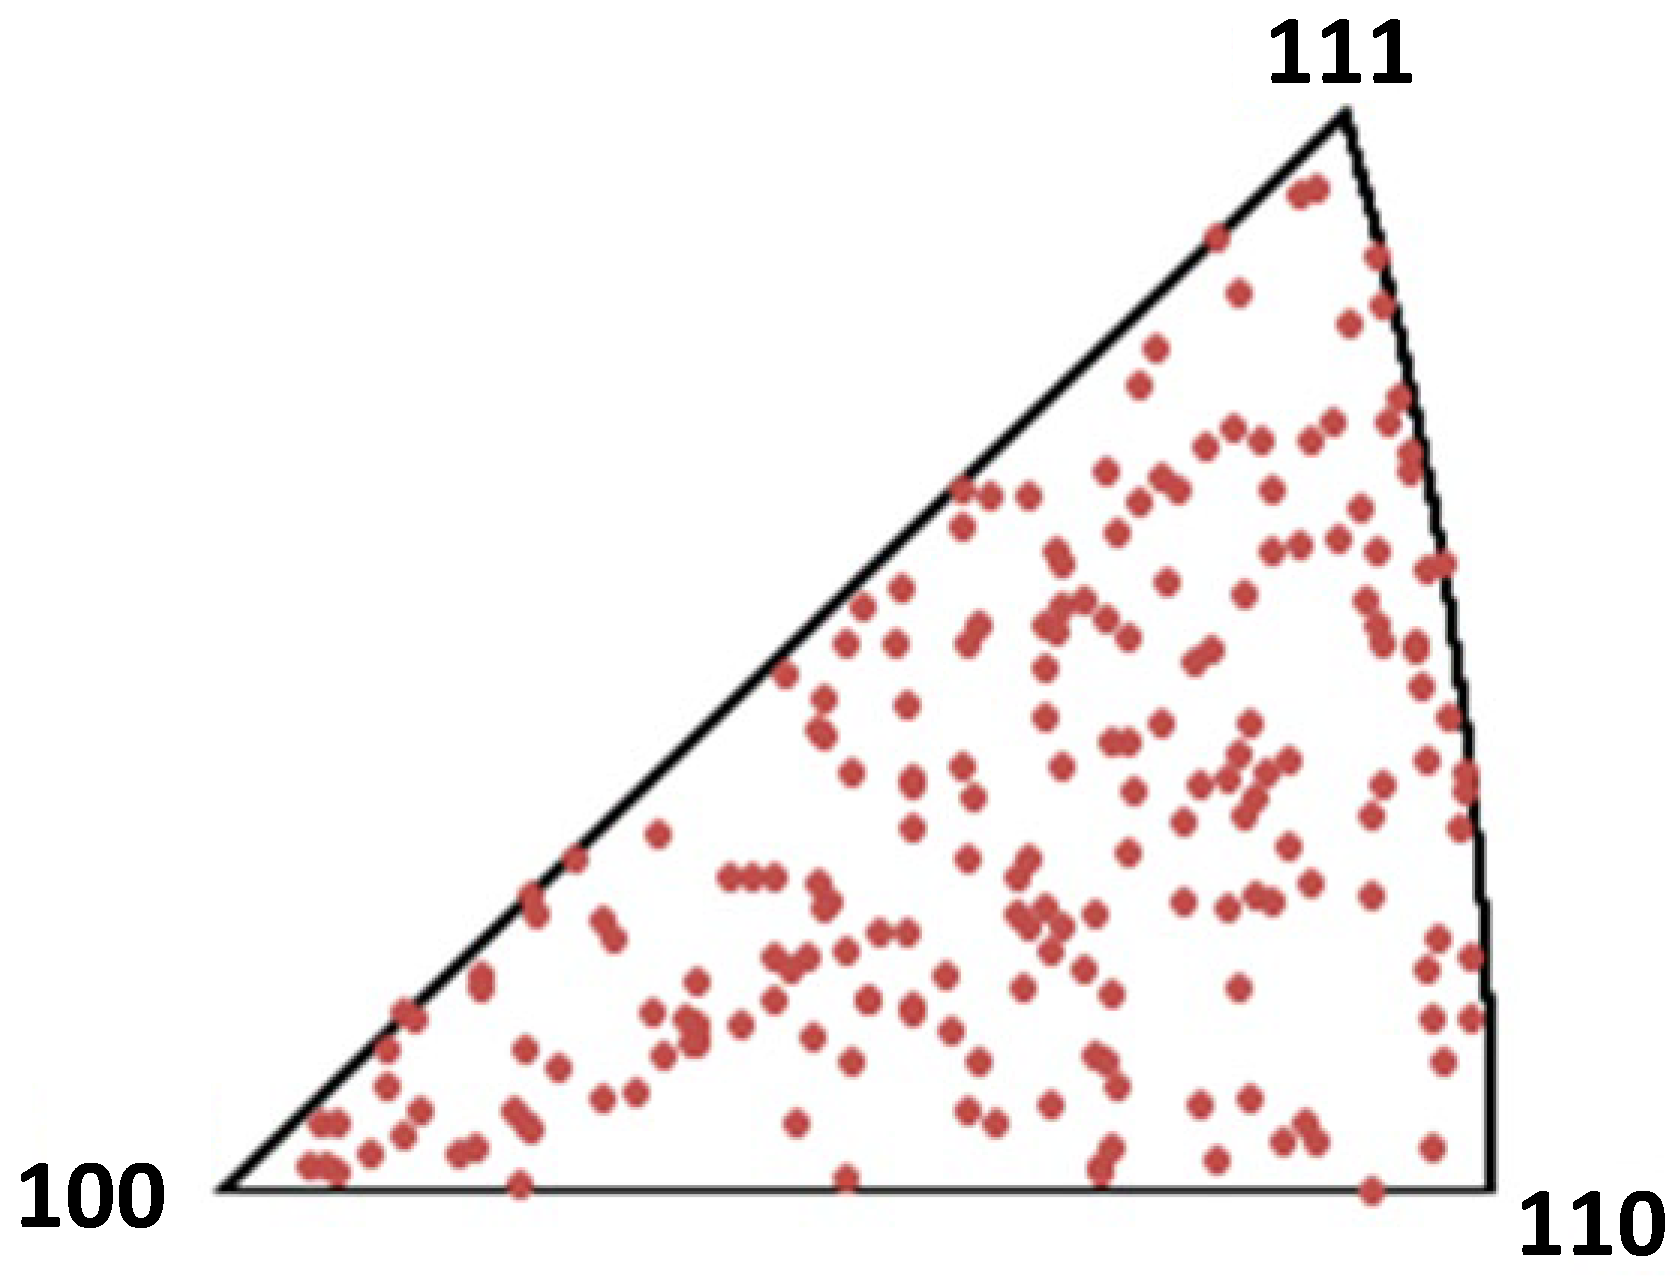
All numerical simulations were performed using a distribution of 400 randomly oriented crystals [
44]. The orientation of the crystals is defined by three Euler angles that cover almost all directions in space.
Figure 3 depicts the inverse pole figure. The study utilized copper databases from Sanders et al. [
51], which included three distinct grain sizes of 0.049, 0.11, and 20 μm, as well as nickel databases, which featured two varying grain sizes of 0.22 and 3.79 μm. These data were sourced from the ANR-mimic project (no. ANR 09-BLAN-0010-01) based in France.
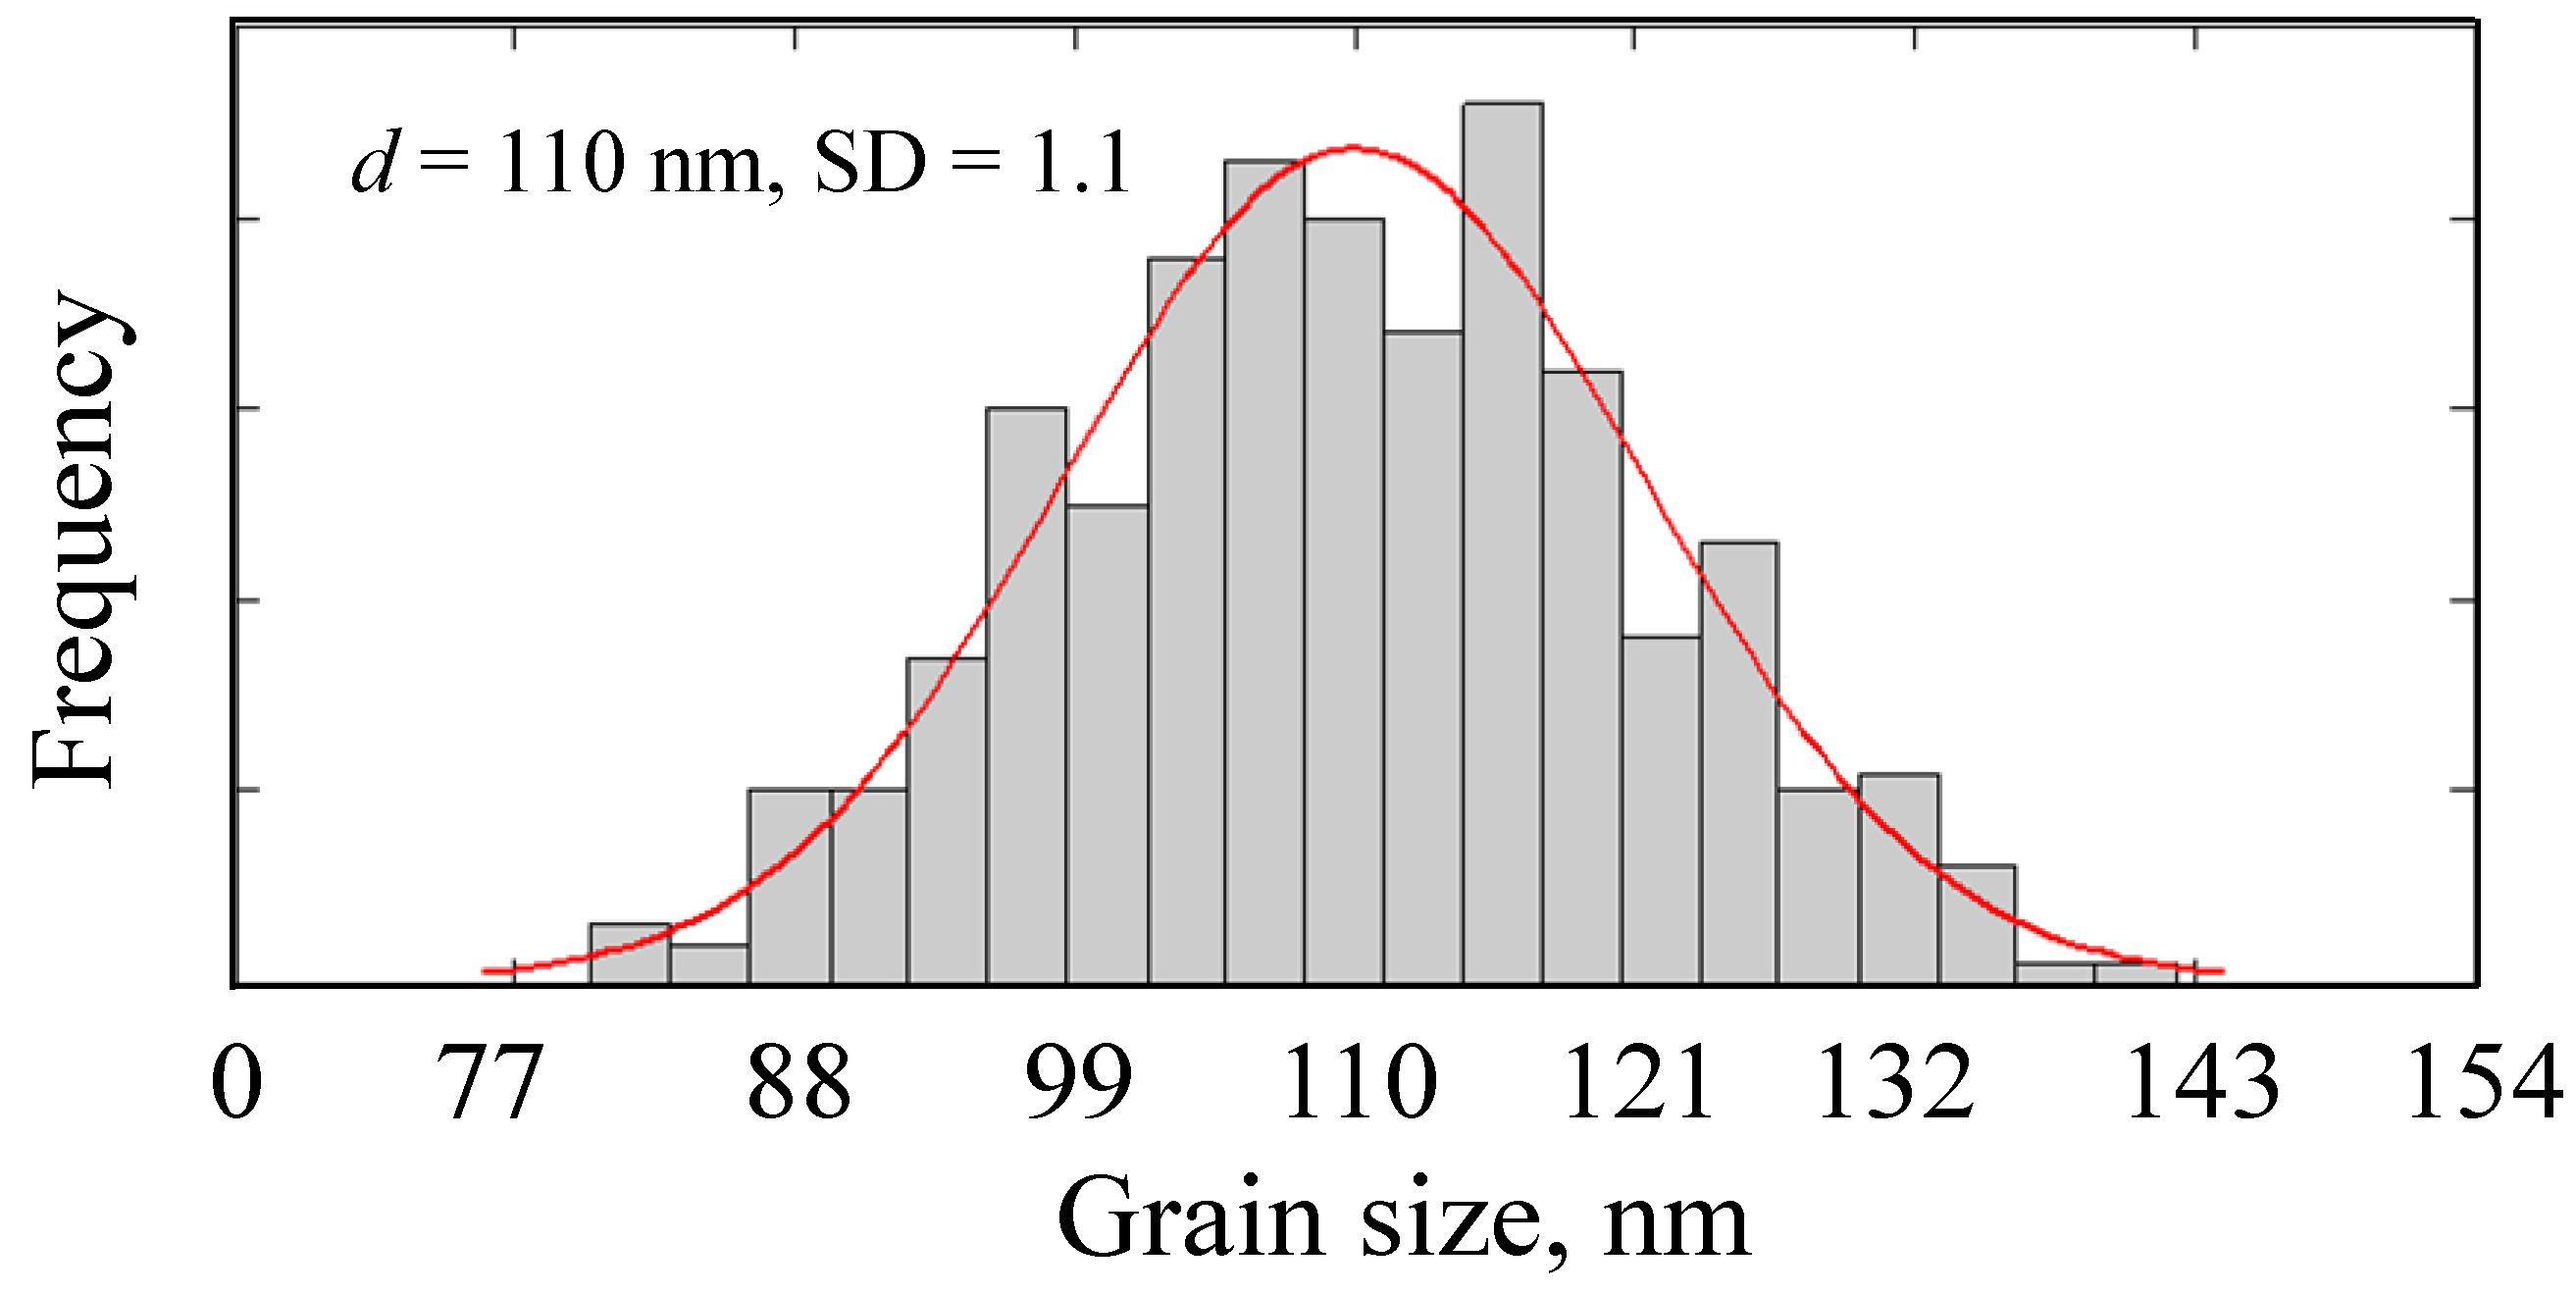
Three crystal distributions were generated with different standard deviations (SD = 0.1d, 0.01d, and 0.001d), and these were used in several simulations [
8].
Figure 4 displays one of the considered cases as a typical example. Analysis of the results showed that the SD of 0.1d provided the optimal solution, exhibiting maximum local heterogeneity behavior (i.e., stress and strain). Therefore, the coefficients of both models were identified using the crystal distribution with this particular SD.
During the calibration process, we initially assumed that GS does not affect the elastic behavior explained by the models. Therefore, we determined Lame’s coefficients by using the standard macroscopic Young’s modulus and Poisson’s ratio λ (=νE/(1 + ν)(1 − 2ν)) and μ (E/2(1 + ν)). Moreover, we built the matrix Hrs of (12 × 12) by six coefficients named h1, h2, ….., h6. For simplicity, we considered the diagonal coefficient h1 and four others to be equal to 1 (h1 = h2 = h3 = h4 = h5 = 1.0). Only the h6 coefficient needs numerical calibration.
Table 1 and
Table 2 summarize the calibrated coefficients of each model for both the employed copper and nickel, respectively.
3.3. Effect of the Key Model Coefficients
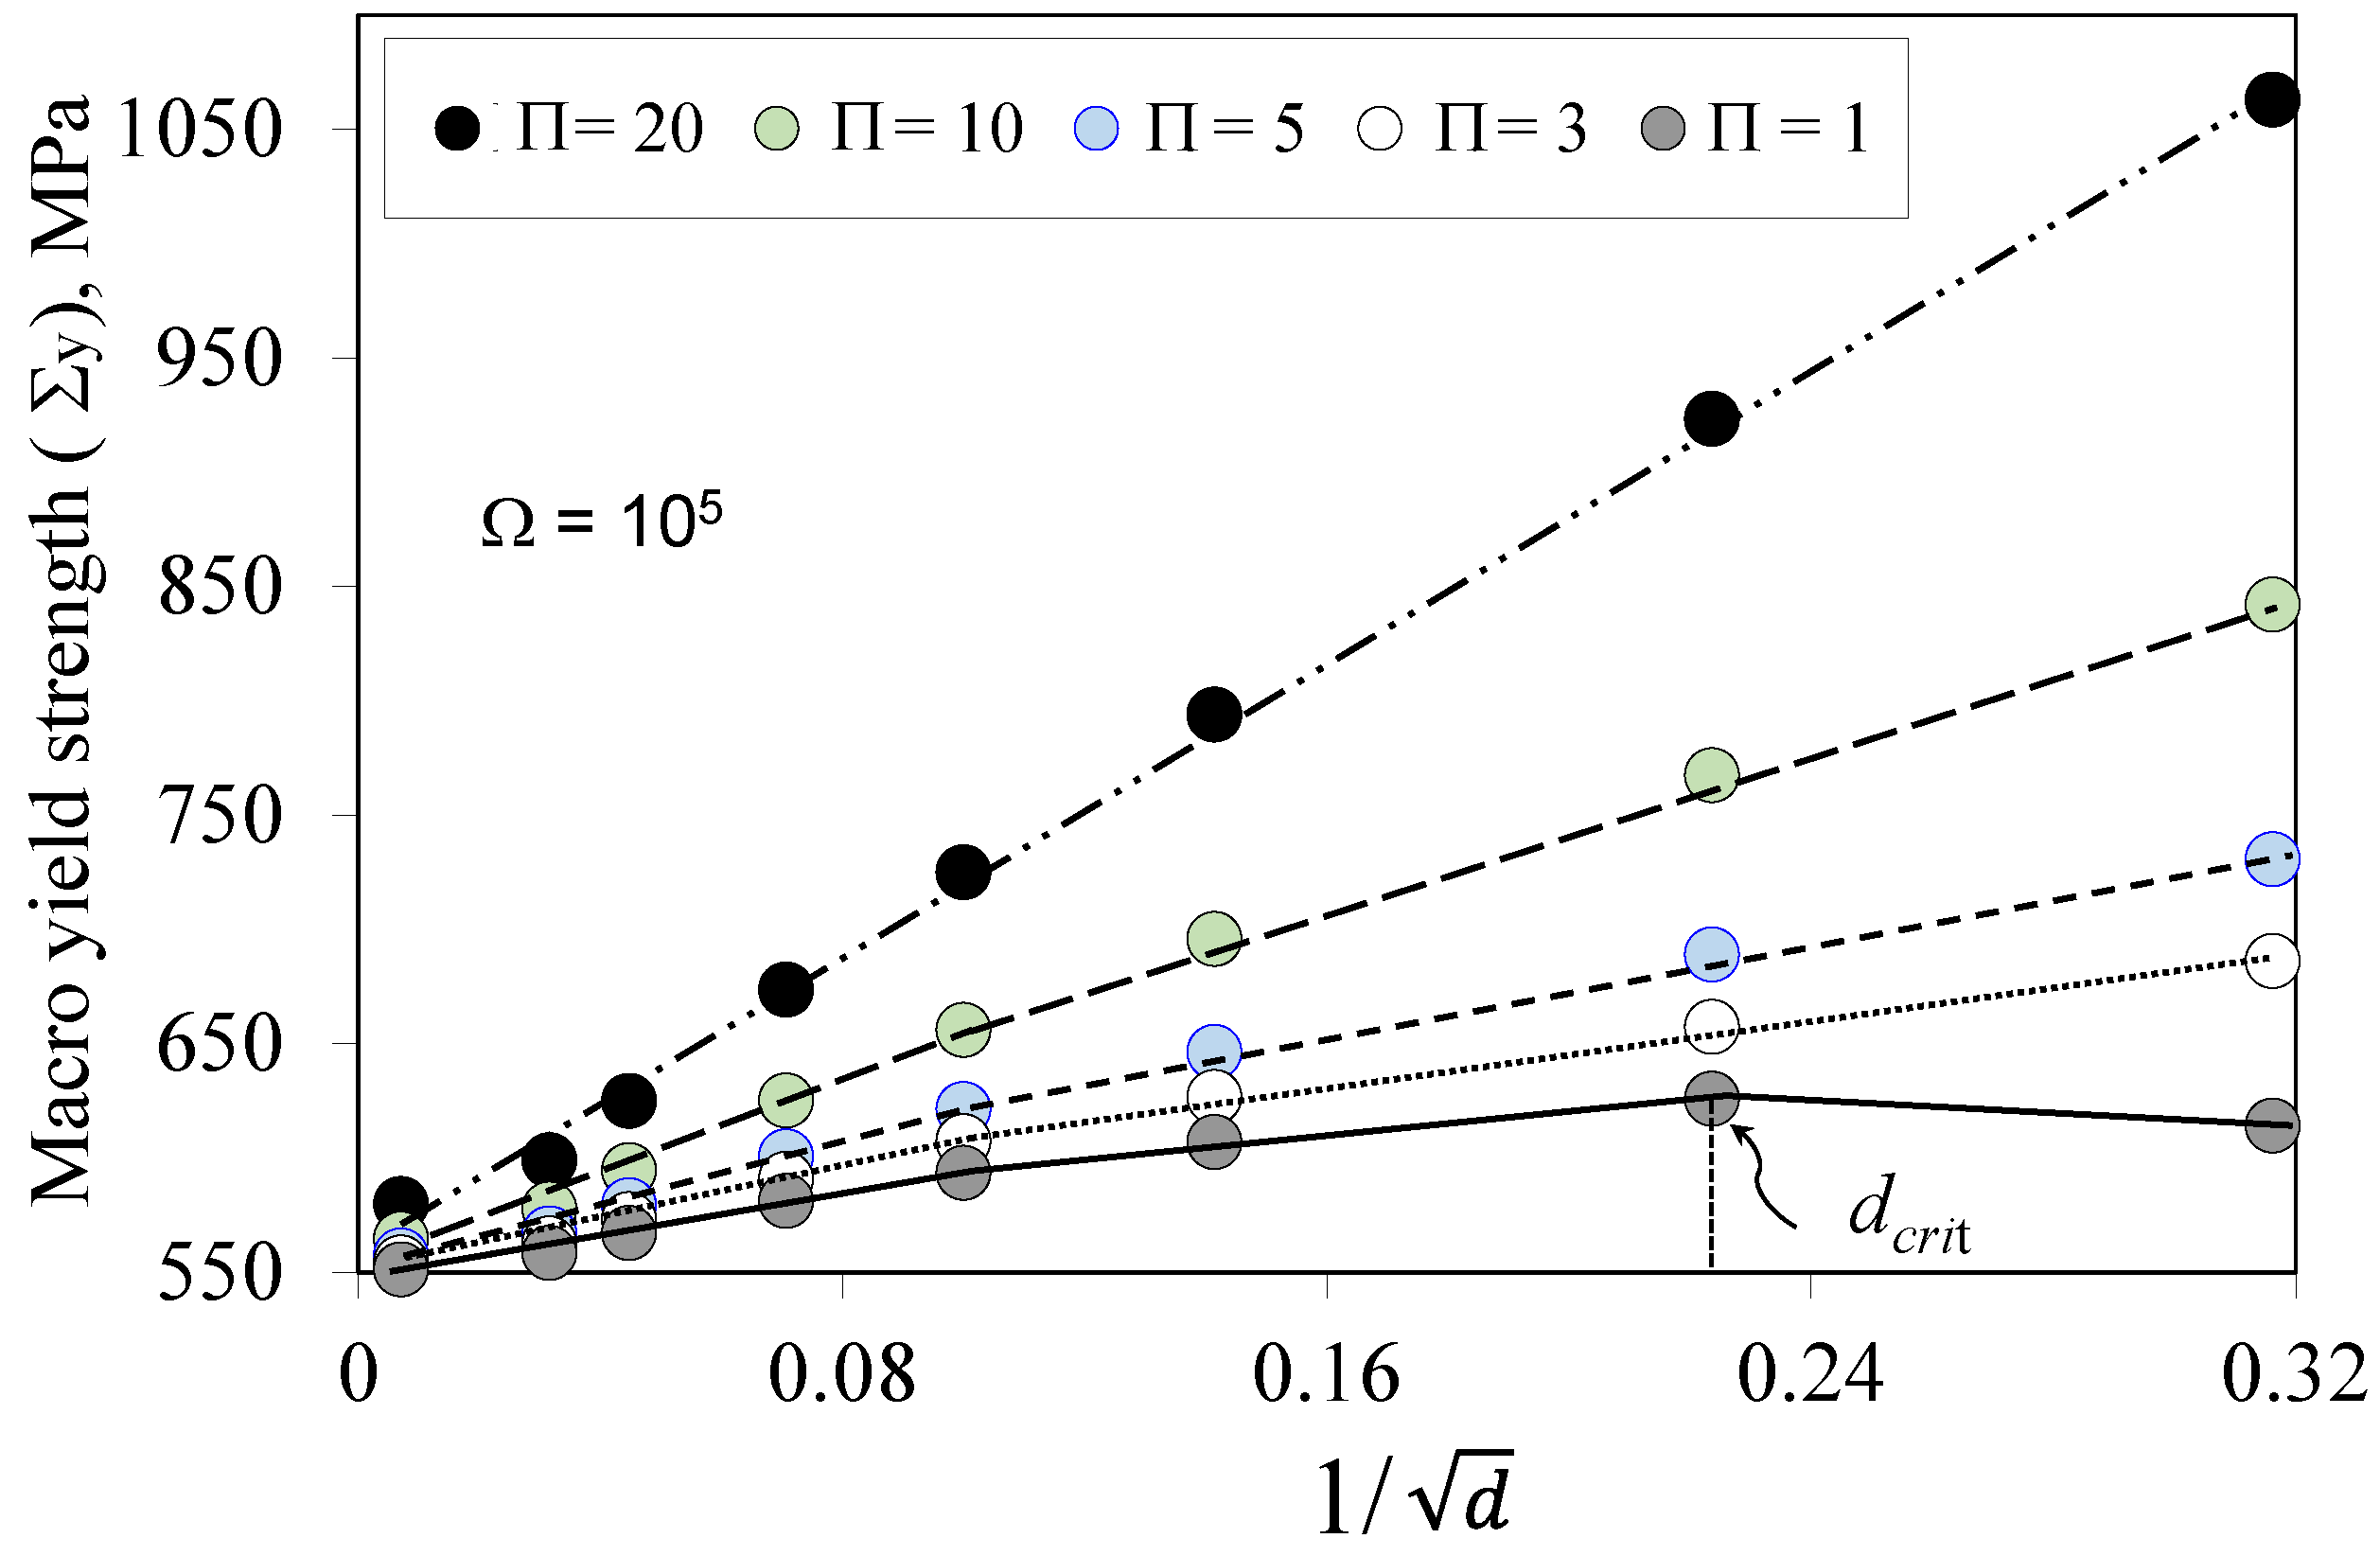
For Model-1, numerical calibration of the two GS coefficients (Π and Ω) is necessary. The parametric study conducted by [
8] demonstrated their significance in describing the impact of GS on plastic behavior. Moreover, their interaction is crucial to replicate the macroscopic effect induced by grain boundaries, especially when they are smaller than 200 nm. A specific combination of Π = 1 and Ω = 105 provides the transition from UFG to NC as presented by
dcrit (
Figure 5), dropping between 100 nm and 200 nm. This finding is corroborated by various published works [
5,
6].
Model-2 has multiple material coefficients that require numerical identification. Nonetheless, the coefficients ka, β
O, k
f, μ, b, m, and k
B do not require numerical identification, and their values are standard, as listed in
Table 2. In addition, the experimental test has directly provided the strain rate (
) value of 10
−4/s and the reference granular shear strain
= 0.006. The only coefficients of this model for GS that need numerical calibration are
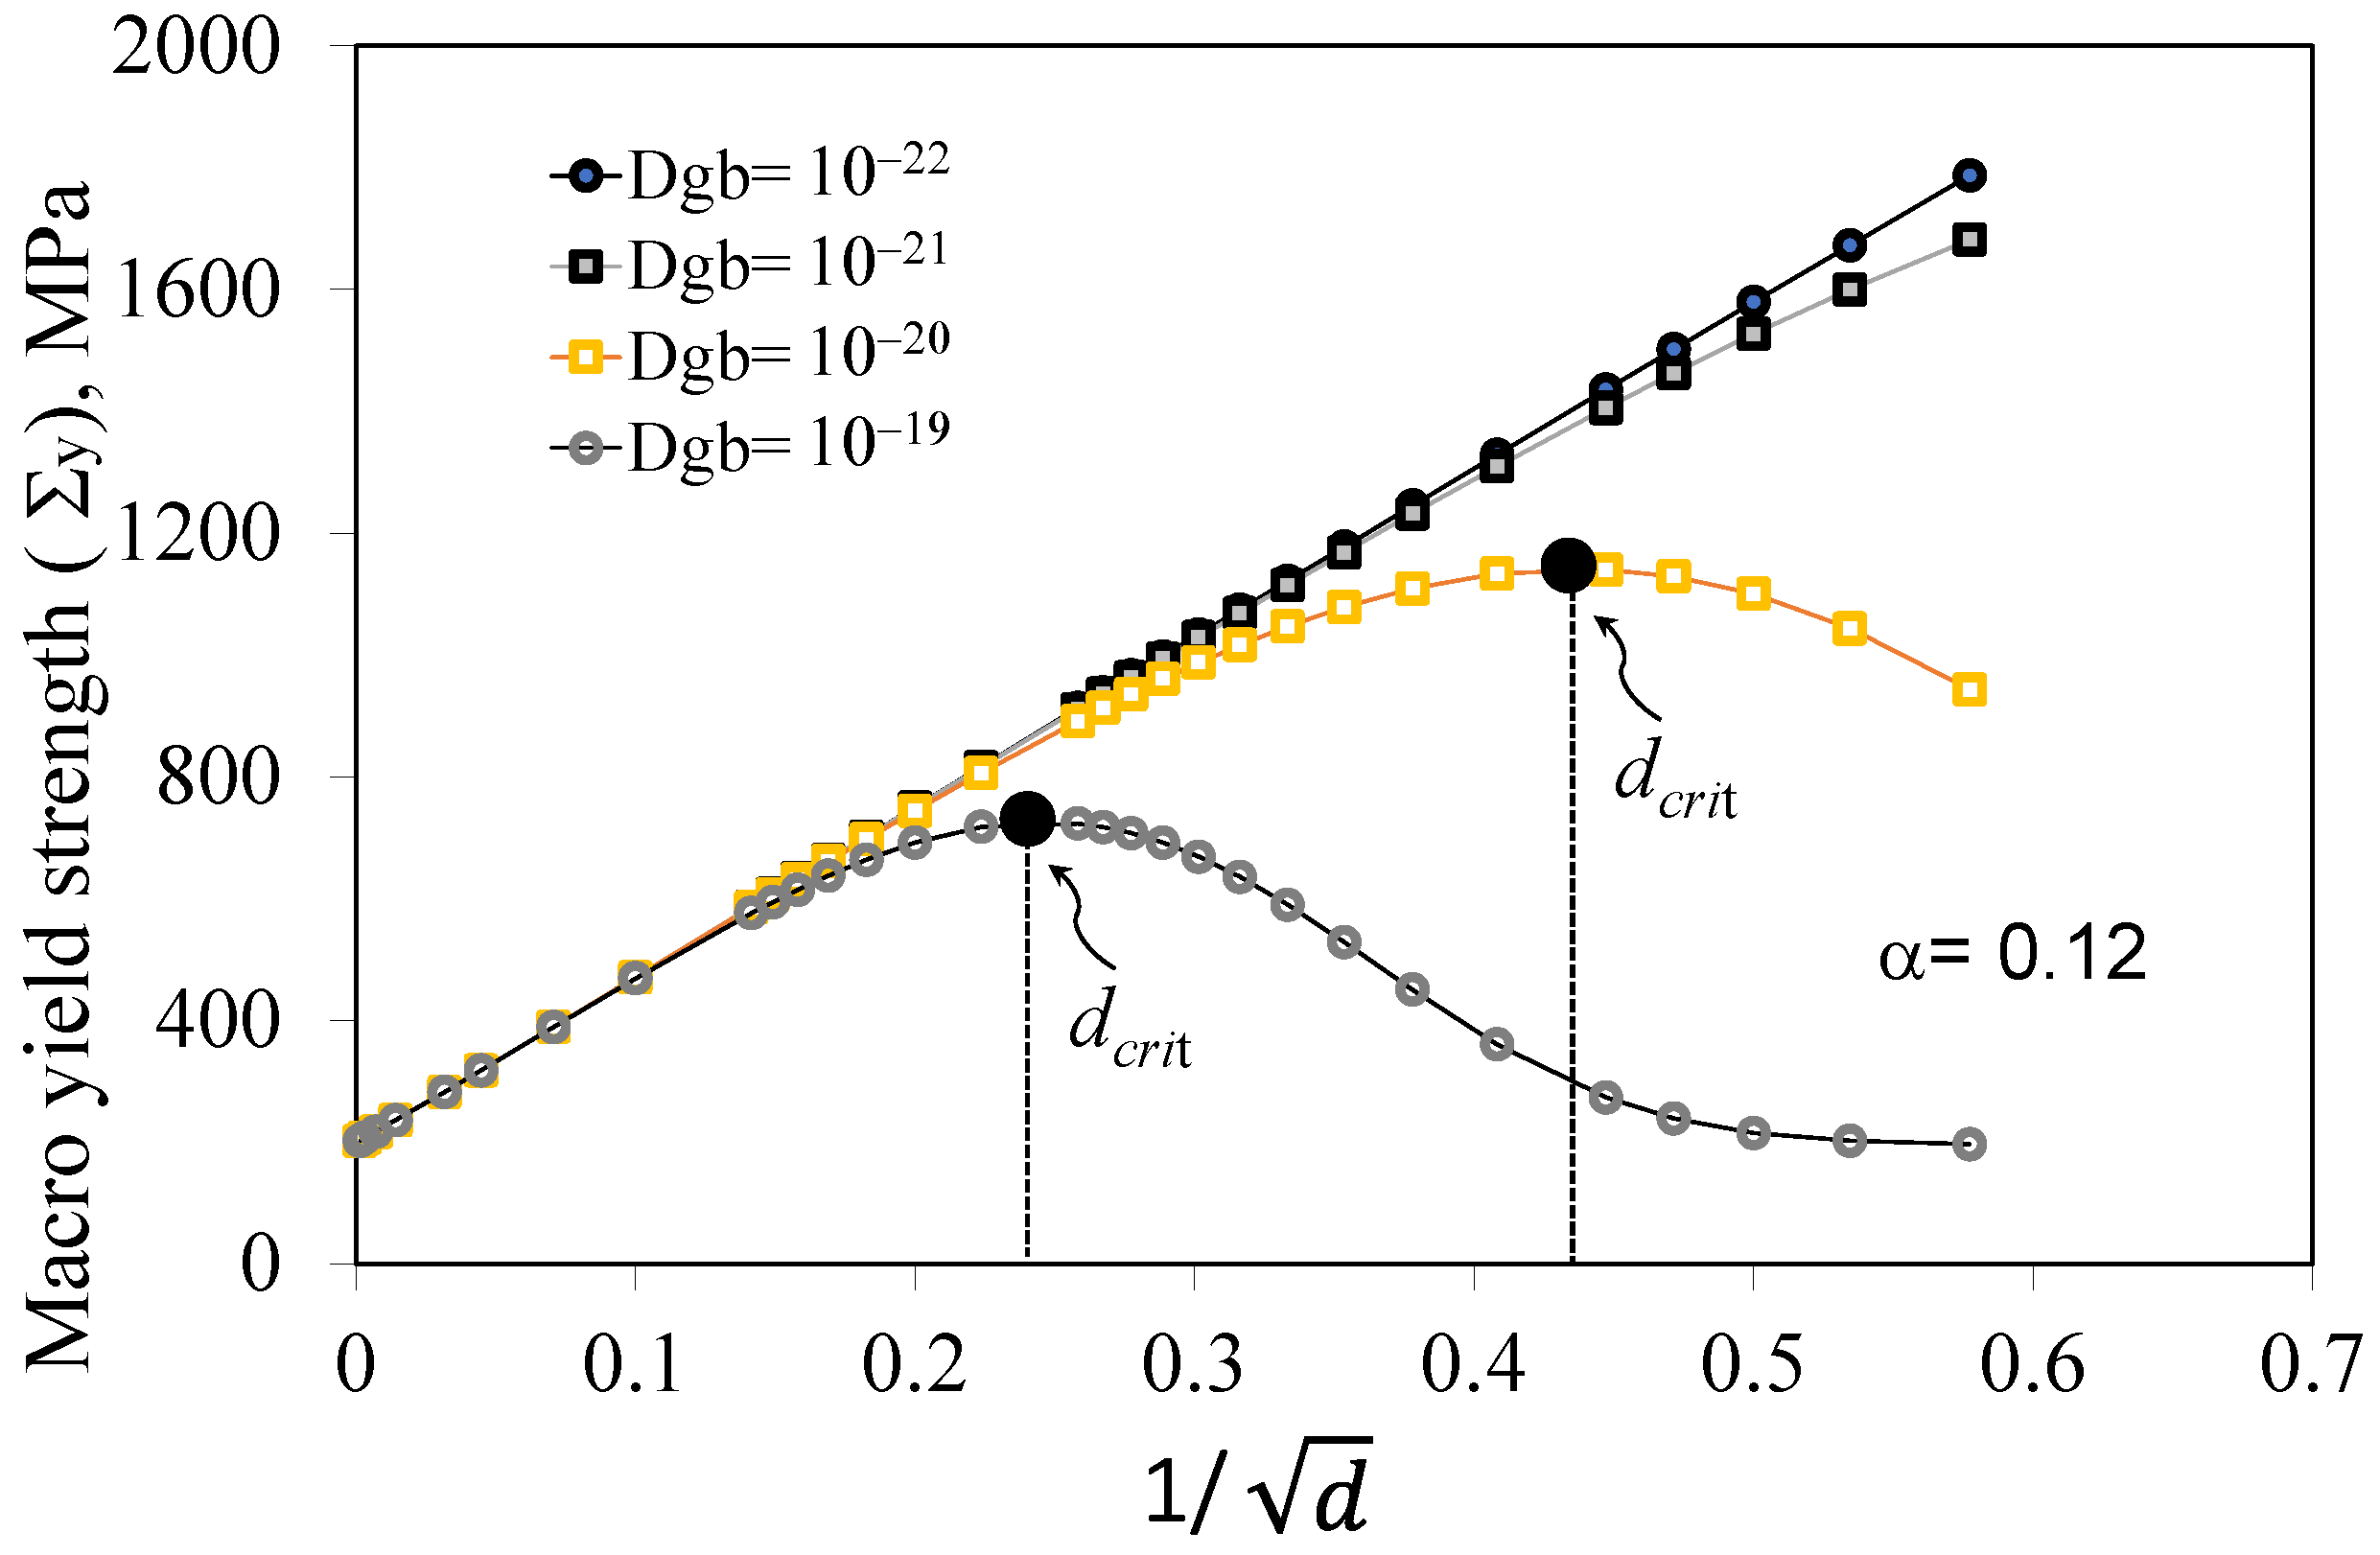
Dgb and α. For the grain size range from 500 μm to 3 μm, the interaction between
Dgb coefficients and a given value of α provides significant insights into the variation in the macroscopic yield strength (Σ
y) as a function of GS.
When α has a value of 0.12, two values of
Dgb (10
−19 and 10
−20) were observed to produce an inflection point (
dcrit) in the range of NC (
Figure 6). This led to the recording of two different inflection points, namely, (
dcrit, Σ
y) (16 nm, 723 MPa) and (5 nm, 1140 MPa), respectively. Consequently, a given value of α makes Model-2 highly susceptible to the diffusion coefficient (
Dgb). By employing a specific combination of
Dgb and α, one can effectively target
dcrit and subsequently achieve a gradual decrease in Σ
y through the softening phase, whereby
d is reduced.
3.4. Yield Strength Predictions
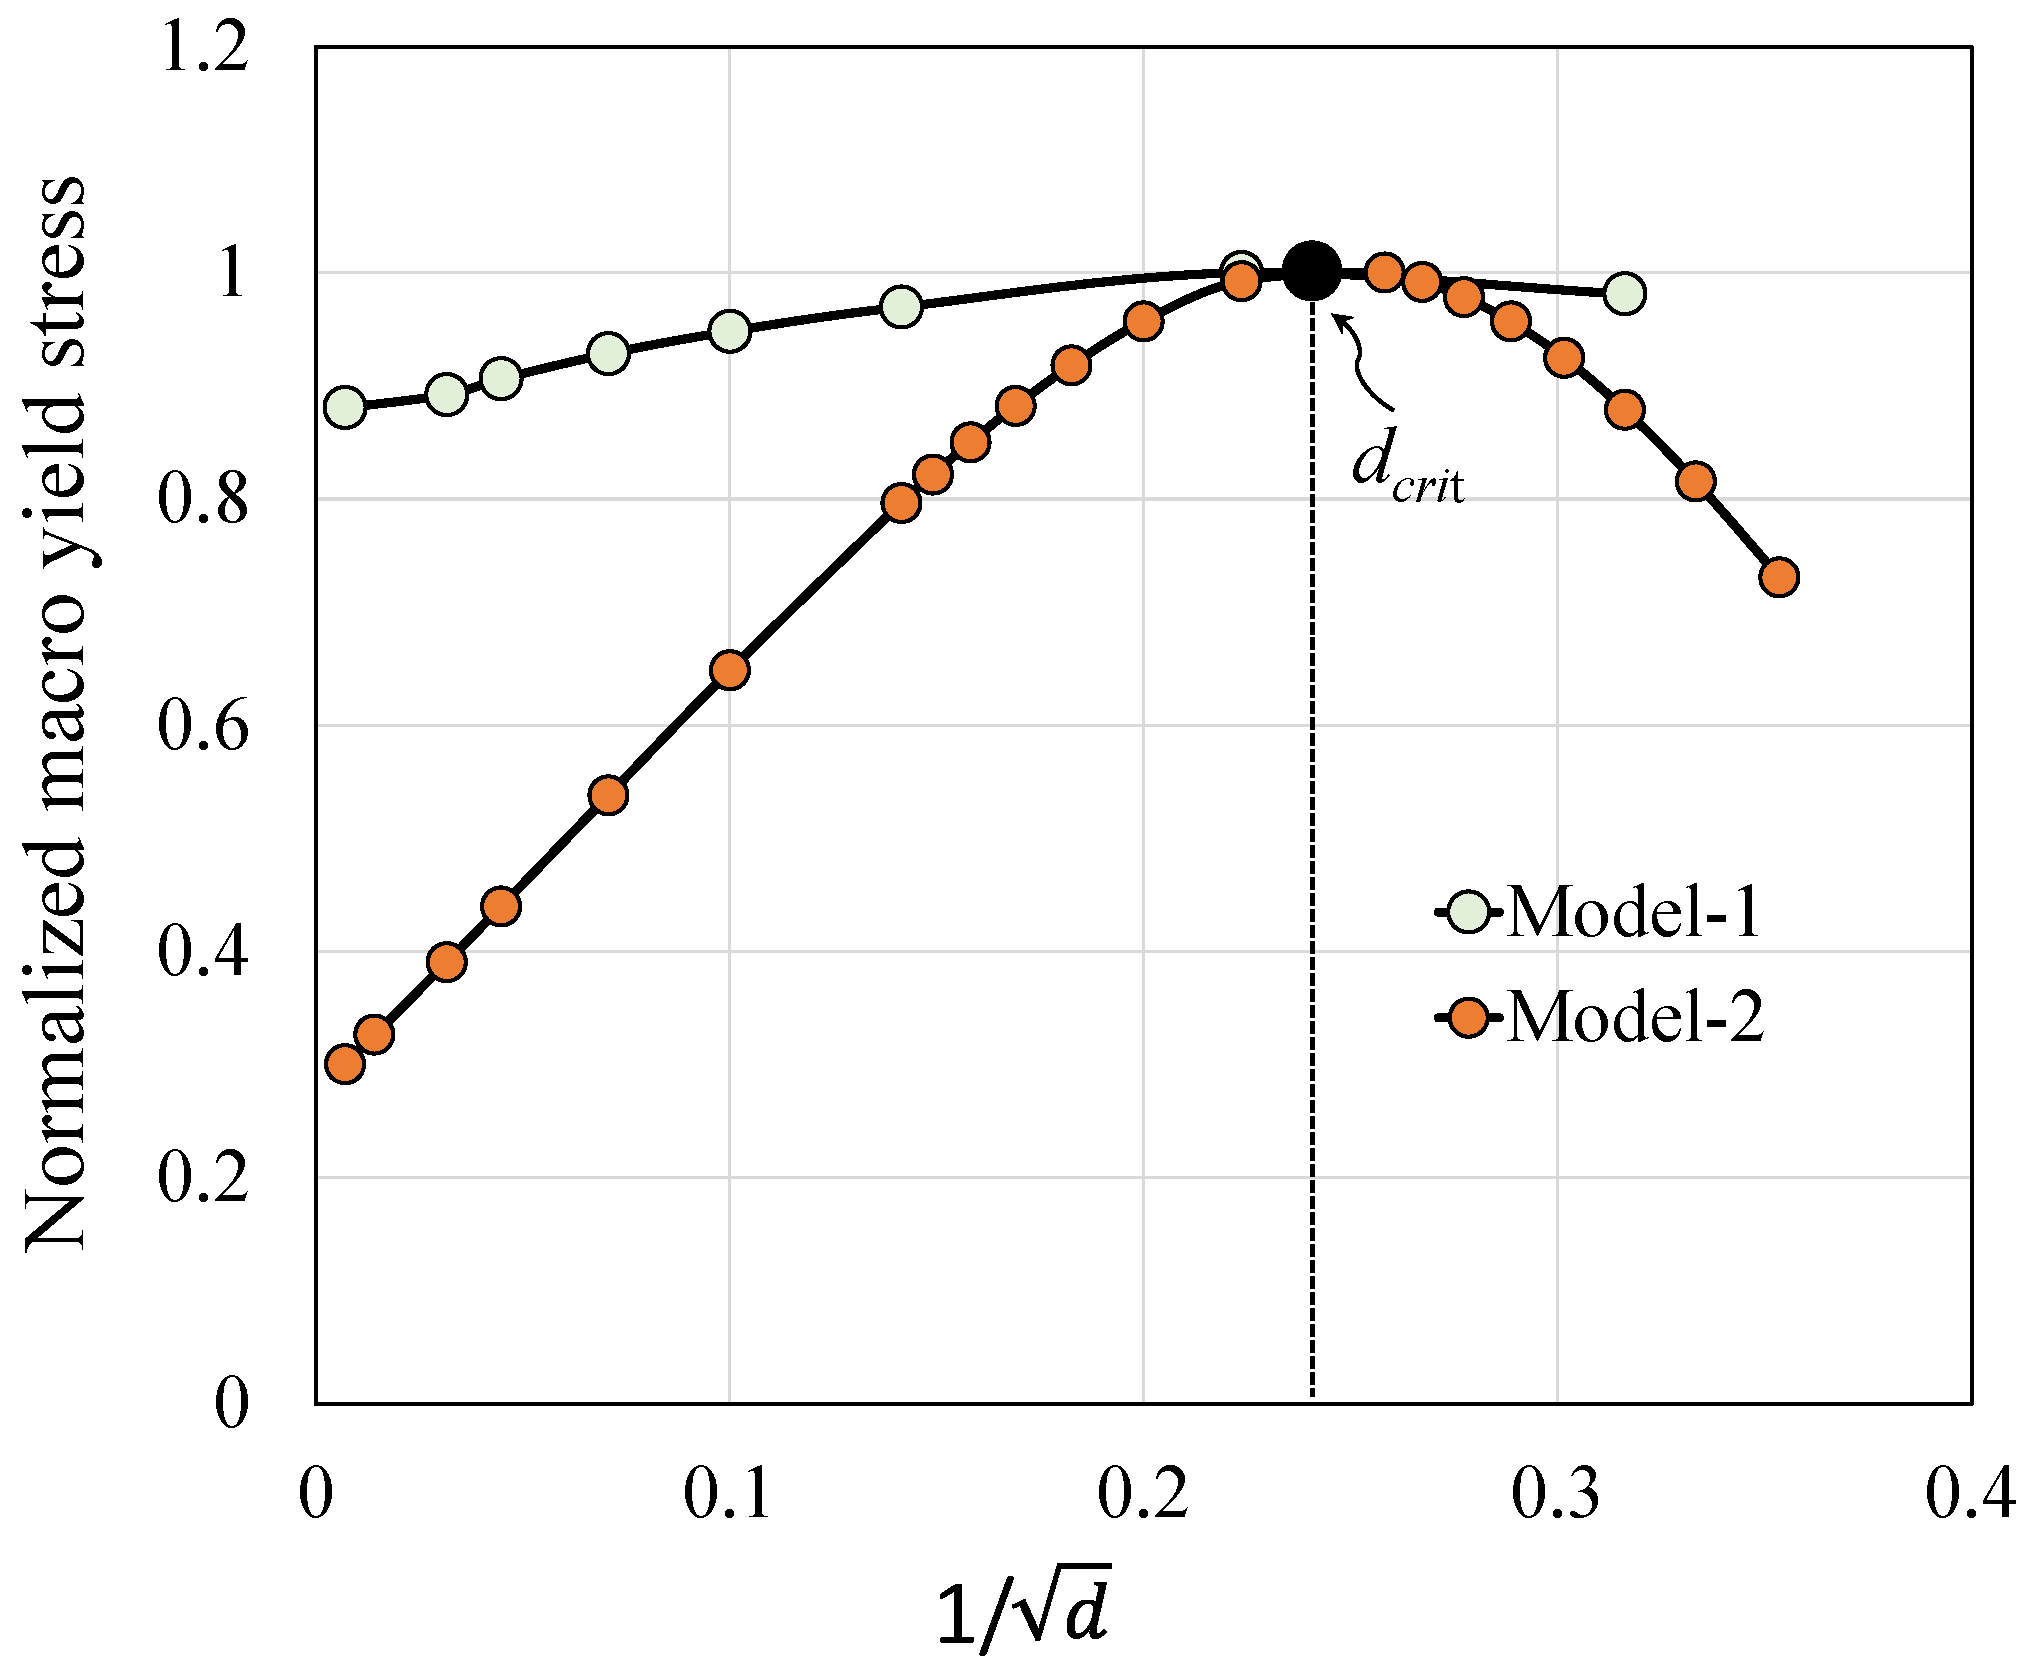
These models have compared the variation in yield strength with grain refinement. To ensure a consistent comparison, the predicted yield strengths have been normalized by the maximum yield strength for each model. Consequently,
Figure 7 reveals numerous insights. The models predict a nearly identical
dcrit of 16 nm. However, Model-1 displays a lower sensitivity of yield strength to GS as compared to Model-2. This observation remains valid even after
dcrit. Indeed, the models indicate a weakening phase. For Model-1, the coefficients Π and Ω, along with their interaction, numerically govern a slight variation in Σ
y. To improve model prediction, a more integrated identification process could offer a sophisticated result describing copper’s response.
3.5. Comparison Models/Experiments
Figure 8 and
Figure 9 present the macroscale stress–strain behavior of copper and nickel, respectively, and demonstrate a comparison between the models and how they describe the GS effect on their response. The experimental copper databases of
d = 0.049, 0.11, and 20 μm [
51] display the plastic behavior and its sensitivity to grain refinement (
Figure 8). Generally, both Model-1 and Model-2 adequately describe this sensitivity, and for both models, Θ
o represents a crucial parameter. A relatively high value of Θ
o =1.61 × 10
−6 (
Table 2) for Model-2, against a lower one of Θ
o = 8.74 × 10
−10 for Model-1 (
Table 1) provides instantaneous elastic response and viscoplastic relaxation [
43]. If these two conditions are met, a relatively high evolution of work hardening (isotropic and back-stress) can be successfully reproduced [
8]. Indeed, for a given GS within this range of values, particularly for the smallest one, the term
achieves a balance in the interaction law (11) between the initial two terms on the left-hand side. This balance results in the heterogeneity of the instant granular elastic effect. As a result, the granular viscoplastic relaxation at steady-state becomes relatively heterogeneous, facilitating smooth interactions between crystals and their matrix [
43].
Model-2 demonstrates superior elastoplastic behavior of copper compared to Model-1, not only concerning the GS effect but also the actual hardening after plasticity onset. This could be attributed to the identified coefficients, specifically Θo, Π, and Ω, for which the model’s sensitivity to their values is noteworthy. Therefore, future works should apply an advanced methodology to calibrate the model coefficients with optimization.
Regarding nickel’s behavior,
Figure 9 shows a comparison to copper’s behavior with two GSs of 0.22 and 3.79 μm, demonstrating the model’s sensitivity to GS. The predicted responses further emphasize the ability of these models to accurately replicate plastic behavior for various GSs. As for the impact of GS on the stress–strain response, both models adequately depict its behavior. However, Model-1 better predicted the experimental evolution of strain hardening after plasticity onset than Model-2, contradicting previous observations made in the case of copper. Due to its significance, the coefficient Θ
o has a comparatively higher value of 4.21 × 10
−4 for Model-1 than the lower value of 5.21 × 10
−8 for Model-2, as shown in
Table 1 and
Table 2. According to [
43], a high value of Θ
o at 4.21 × 10
−4 provokes stiff plastic interactions, resulting in the term (
) dominating other elastic terms on the left-hand side of Equation (11). Therefore, the instantaneous elastic effect loses significance, resulting in a notable granular plastic behavior heterogeneity. As demonstrated in Model-1 (
Figure 9), this leads to a work-hardening with weak evolution, evident in the case of nickel of
d = 3790 nm. Furthermore, for a value of 5.21 × 10
−8, the term (
) creates a particular balance between the first two elastic terms on the left-hand side of Equation (11). This study recorded the heterogeneity of the instantaneous granular elastic effect. The observations showed smooth interactions between the grains and their matrix. As a result, the work-hardening evolution for nickel described by Model-2 became more significant than the first case of Model-1.
The work-hardening process, involving isotropic and back stress, can be effectively described for different grain sizes. Model-2 exhibited similar responses, albeit with slightly lower performance.
The distinctive capabilities of each model arise from their respective constitutive equations and their ability to better describe the behavior, contingent upon the nature of their equations for any given type of hardening evolution and their calibrated parameters. Differences in the hardening evolution were observed between copper and nickel. To gain a better understanding of their behavior, future work could explore the links between microstructures/deformations and dislocation mechanisms/macroscopic behavior, which could lead to new extensions.
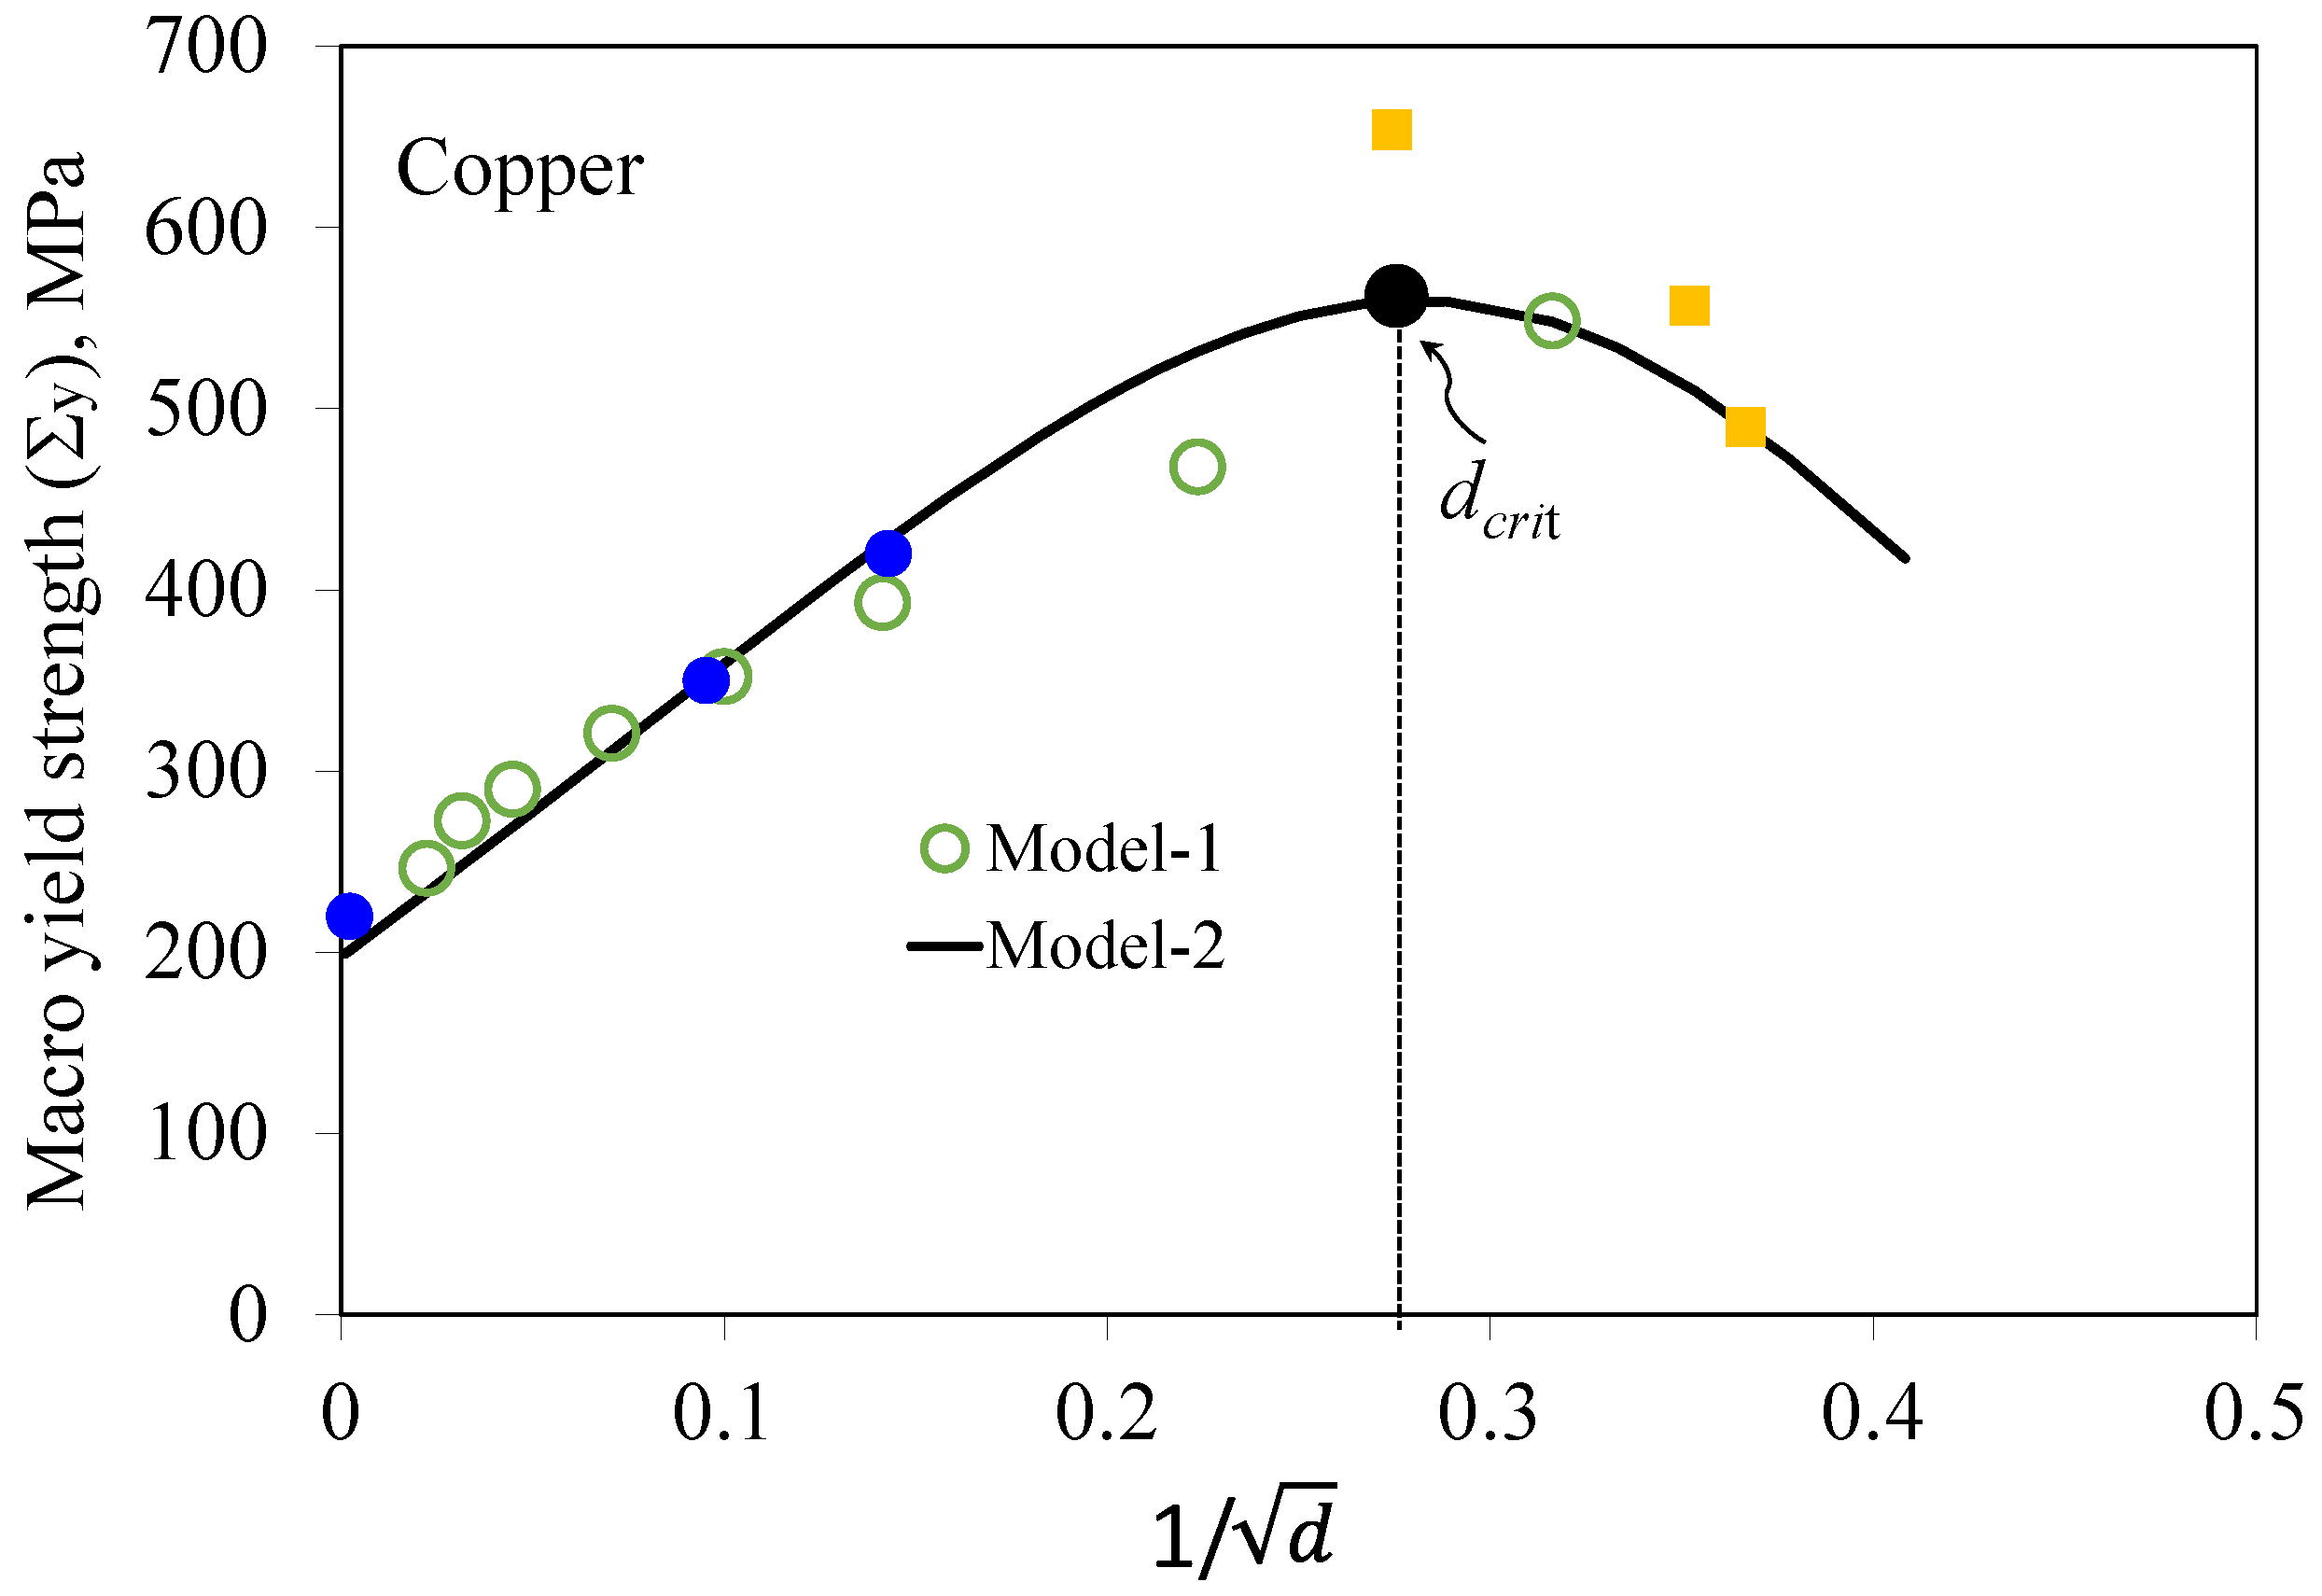
Finally, the two models were examined for their ability to predict the variation in Σ
y in copper as a function of the inverse square root of grain size (
) based on the Hall–Petch relation.
Figure 10 presents a comparison between the models’ responses and limited experimental databases. Both models accurately describe the evolution of Σ
y in the grain size range from 20,000 nm to 49 nm, covering UFG and NC. However, Model-2 demonstrates a
dcrit of 16 nm. In contrast, Model-1 is incapable of displaying this value despite the fact that it exhibited this capability in the example depicted in
Figure 7. To further validate the model predictions, we compared additional experimental copper databases of 13, 8, and 7.4 nm to these predictions (
Figure 10) that were taken from ref. [
12]. Based on this, we can conclude that Model-2 is better suited to describing these results than Model-1 for the given range of
d <
dcrit.
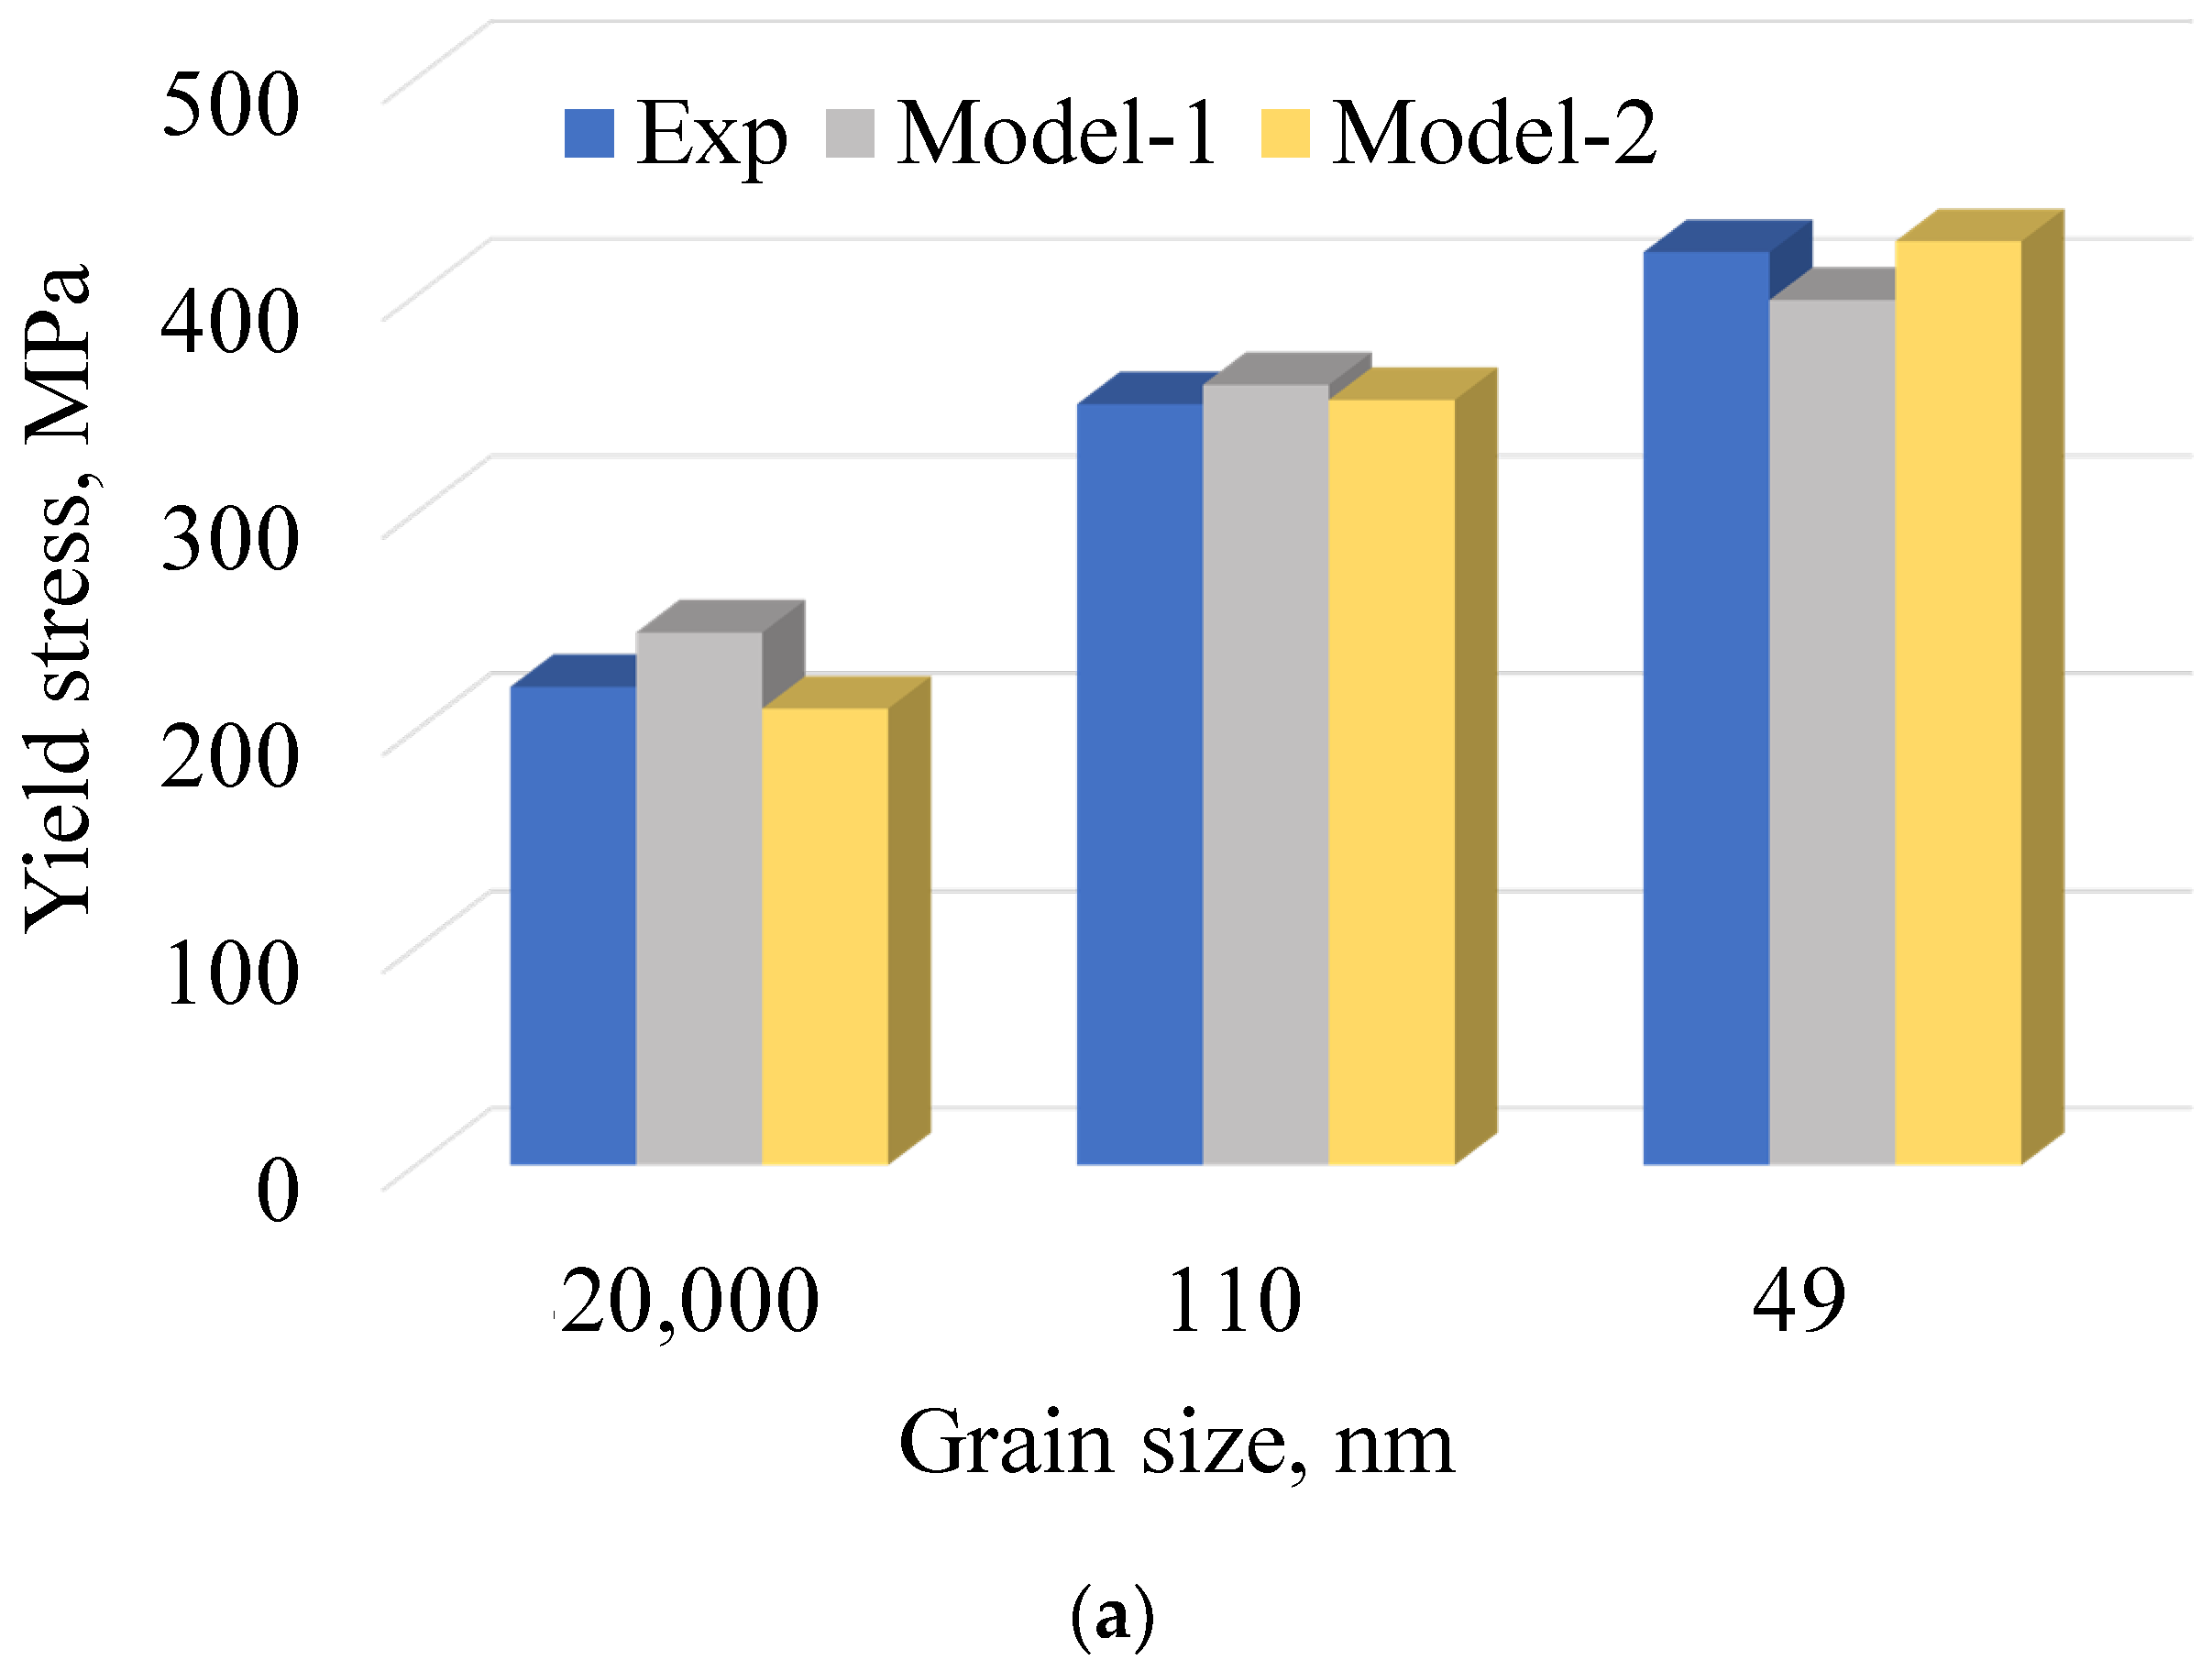
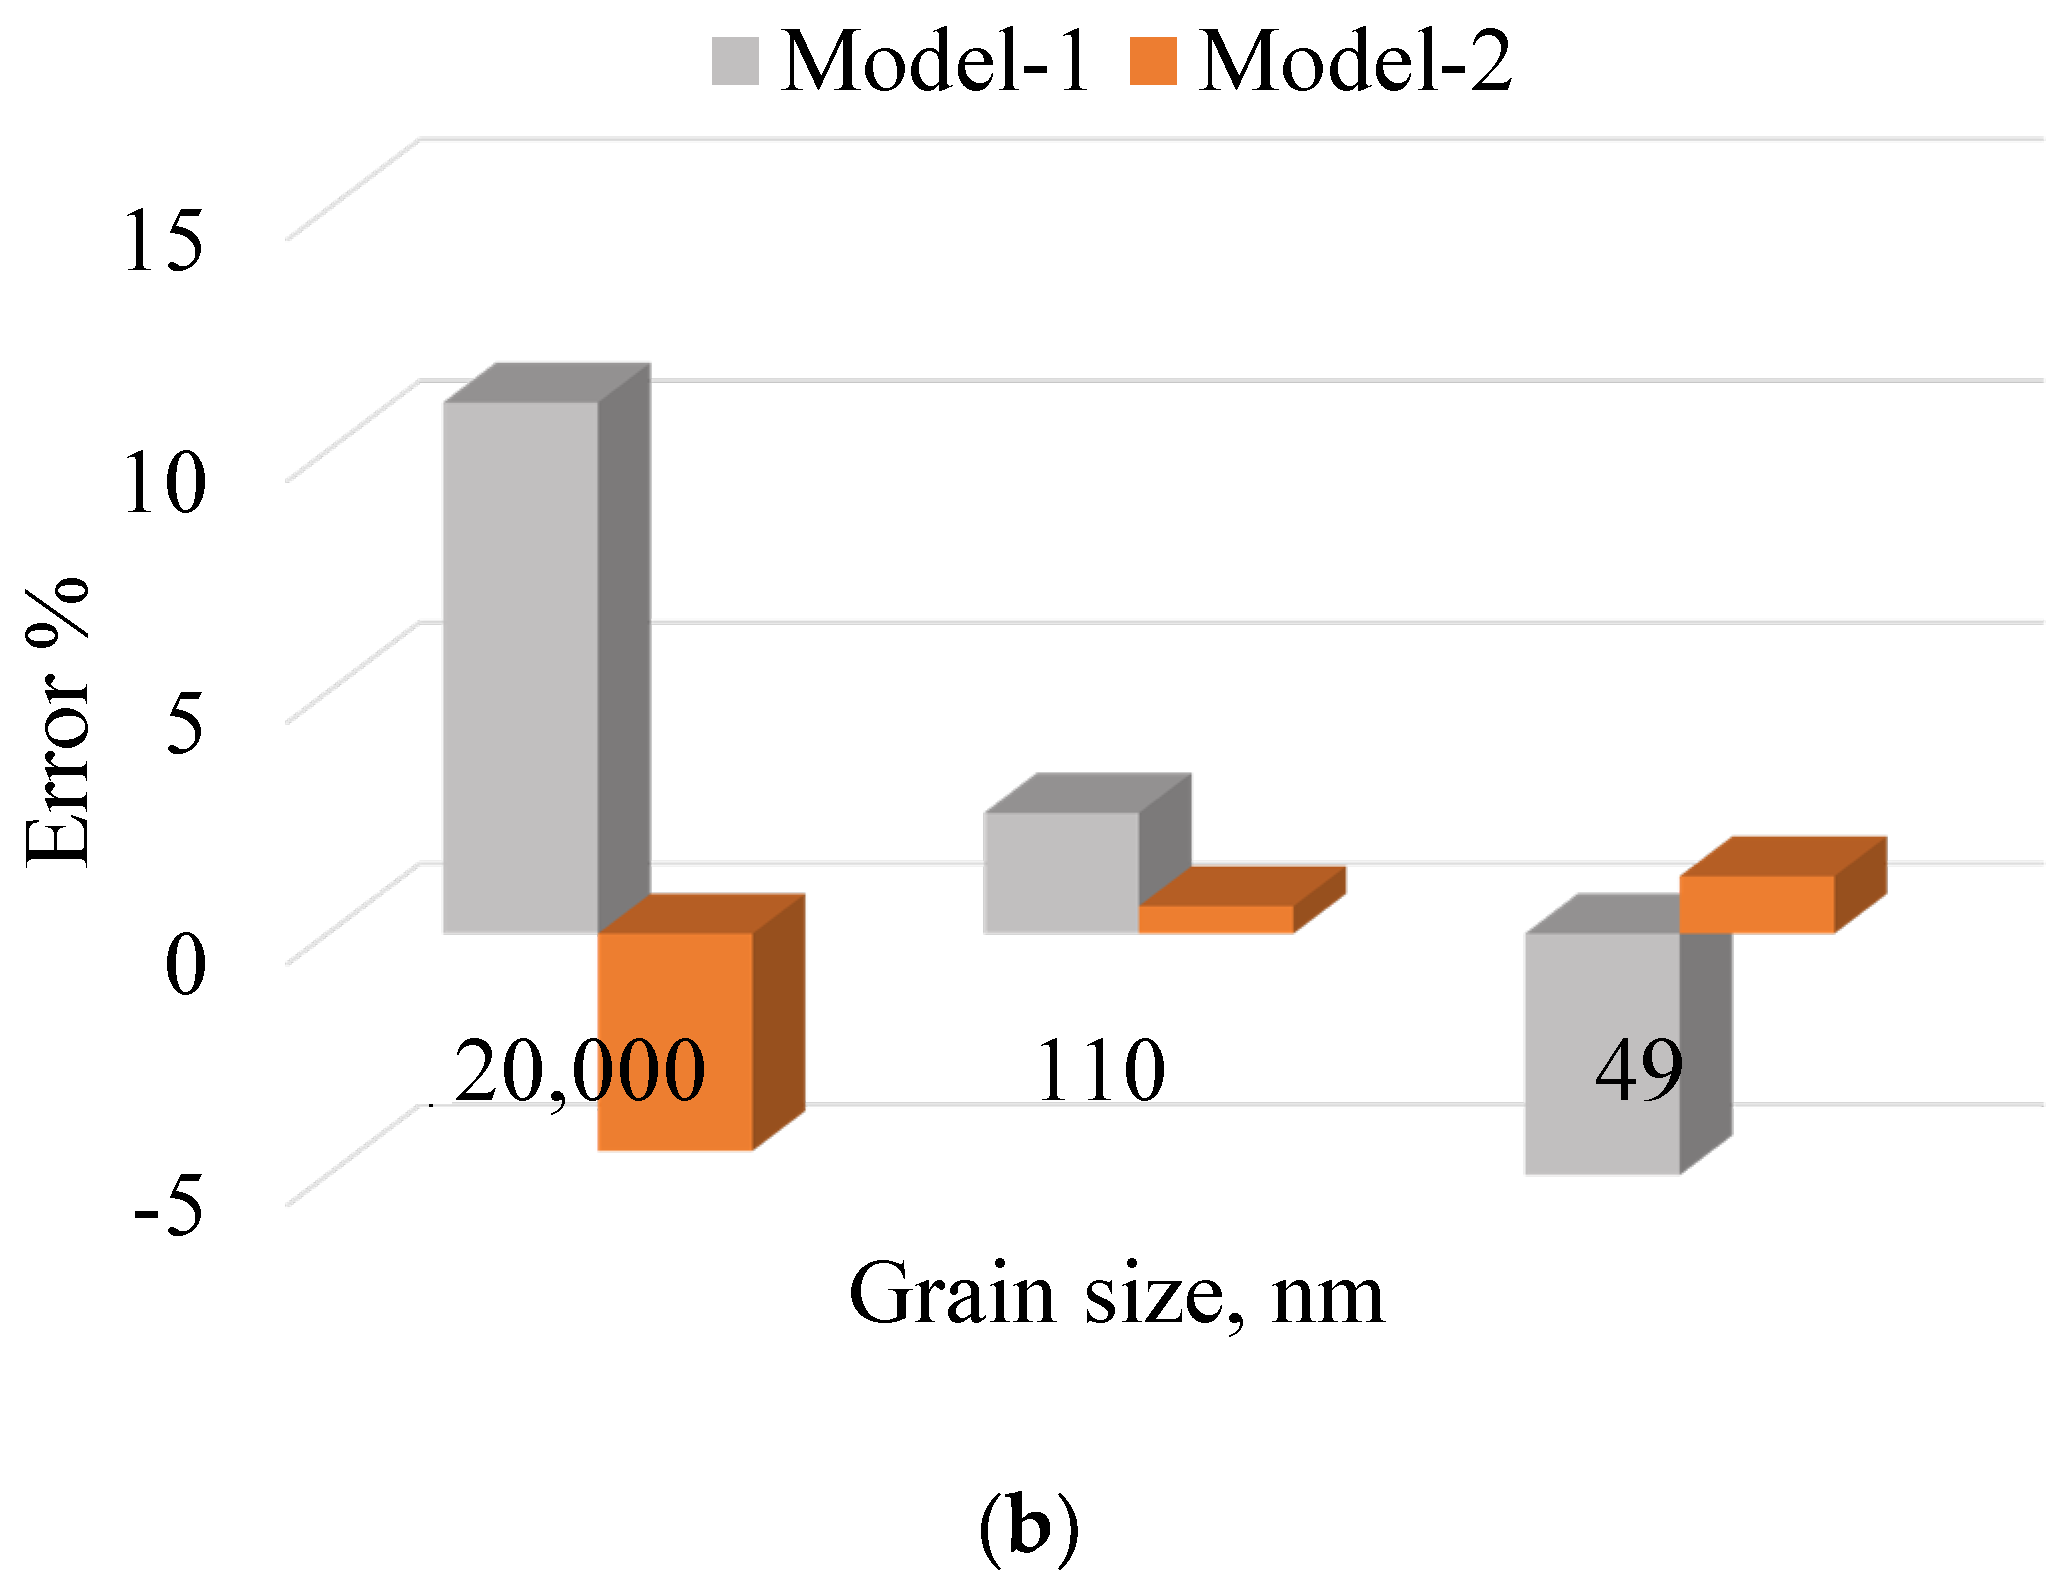
Furthermore,
Figure 11 highlights a comparison of the yield stresses for copper with those for the three different GSs and the two models’ predictions. The Figure also displays the errors produced by each model for each GS. This study revealed that Model-1 generated maximum errors of 11% with a GS of 20,000 nm, while Model-2 had a minimum error of 0.6% for a GS of 110 nm. Once again, further investigation is required to identify whether the model coefficients themselves or the model are responsible for the observed results. A sophisticated identification strategy should be employed in future work.


 ,
, 


 and Sanders et al., 1997
  .
.
