Article

Effect of the Microstructure of Support Materials on Cracking Catalyst Performance

1
Hunan Changlian New Material Technology Co., Ltd., Yueyang 414012, China
2
School of Materials Science and Technology, China University of Geosciences, Beijing 100083, China
3
National Laboratory of Mineral Materials, China University of Geosciences, Beijing 100083, China
4
Beijing Key Laboratory of Materials Utilization of Nonmetallic Minerals and Solid Wastes, China University of Geosciences, Beijing 100083, China
5
Engineering Research Center of Ministry of Education for Geological Carbon Storage and Low Carbon Utilization of Resources, China University of Geosciences, Beijing 100083, China
*
Authors to whom correspondence should be addressed.
Crystals 2023, 13(1), 123; https://doi.org/10.3390/cryst13010123
Submission received: 11 December 2022 / Revised: 26 December 2022 / Accepted: 5 January 2023 / Published: 10 January 2023
(This article belongs to the Section Inorganic Crystalline Materials)

Abstract

:
Fluid catalytic cracking (FCC) is a production process that converts petroleum into petroleum products in the presence of catalysts. The performance of an FCC catalyst plays a decisive role in petroleum refining. An FCC catalyst mainly comprises a molecular sieve (catalytic cracking active center), a carrier, and a binder. The carrier can enable the precracking of the heavy oil in its large pore, which can improve the overall activity of the catalyst and the conversion rate of heavy oil. The surface area and pore structure of carrier materials with different microscopic morphologies differ, which significantly affects the precracking of heavy oil molecules. Therefore, here, FCC catalysts were prepared using flake kaolinite, tubular halloysite, natural flake-tube-combined kaolinite, and mixed kaolinite as support materials, respectively. The FCC catalysts were used in FCC-heavy oil, and the influence of the carrier material morphology on the comprehensive performance of the catalysts was studied. The strength and cracking performance of the catalyst prepared using flake Maoming (M) were poor, whereas the catalyst prepared using tubular halloysite exhibited a good strength, high activity, and a good cracking ability for heavy oil. The catalyst prepared using natural flake-tube combined with Suzhou (S) exhibited a good strength and cracking performance, and it has been widely used in the industrial production of FCC catalysts. When 40% tube-like halloysite was mixed into M, the attrition of the prepared catalyst decreased by 0.5 units, the microreactivity increased by 1.4 units, the gasoline + liquefied petroleum gas (LPG) yield increased by 3.09 percentage points, and the gasoline research octane number (RON) increased by 0.6 units. The comprehensive performance of the catalyst can reach or exceed that of the natural-lamp-tube-based kaolin carrier. The results can not only provide guidance for the stable quality control of kaolin, but they can also significantly alleviate the resource restrictions for FCC catalyst production enterprises.

1. Introduction

Fluid catalytic cracking (FCC) is the most important secondary processing unit in refineries and the main source of profit for petroleum-refining enterprises [1,2,3,4,5]. The catalyst is the core of FCC technology. Owing to the advanced production process, the binder FCC catalyst [6,7,8,9] is adopted by most FCC catalyst manufacturers worldwide; kaolin is used as the carrier, and a molecular sieve functions as the active component. In addition, it is highly flexible in adjusting the number of active components, pile ratio, pore volume, and other properties. The molecular sieve provides the acidic reactive center for the FCC catalyst, and the carrier plays an important role in ensuring the stability of the catalyst and supporting the active component. The carrier performance influences the quality of the catalyst [10,11,12,13].
With the heavy and inferior quality of crude oil, the raw material processed during catalytic cracking has changed from the main wax oil to the residual oil in the mixing phase [14,15,16,17]. In terms of the residue components, its molecular diameter ranges from 1.2 to 15 nm, whereas the pore diameter of the Y molecular sieve, the main active component of FCC catalysts, is only 0.74 nm, and its allowed molecular diameter is only 1.02 nm [18]. Hydrocarbon molecules with a carbon number that is below 20 may penetrate the pore of the molecular sieve, however, heavy oil fractions with a boiling point at 400 °C cannot easily penetrate the pore [19]. This increases the requirements on the carrier material, which is another important component of the FCC catalyst [20]. The carrier material is required to have a certain heavy oil cracking ability, such that the heavy oil macromolecules can predecompose into oil and gas molecules with a small molecular diameter on the carrier material and diffuse to the active center of the molecular sieve for further cracking.
Kaolin is widely used as the carrier material of FCC catalysts because of its low price, high availability, and good plasticity [21,22,23,24]. Although it can be used as a heat carrier, disperse and protect the active component, enhance the anti-wear performance of the catalyst, and prevent heavy metal pollution, its small specific surface area and pores affect the diffusion of oil and gas molecules in the catalyst pores and reduce the accessibility to the acidic center of the catalyst. The final product selectivity of the catalyst is poor, and the coke yield is high. Therefore, it is necessary to investigate carrier materials with large specific surface areas, abundant mesopores and macropores, and heavy oil precracking ability. Chen (2005) reported that FCC catalysts containing active carriers can significantly improve the conversion rate of heavy oil. Andersson and Myrstad [25] showed that when the ratio of the specific surface area between the carrier and molecular sieve was low, the gasoline yield would be high. Halloysite [26] exhibits a unique tubular morphology, which endows it with high application value. It is a typical nanostructured mineral with mesoporous pore channels and a high specific surface area and pore volume. Rong and Xiao [27] observed that after calcination, halloysite nanotubes (as a carrier material) had a larger specific surface area and more cracking activity than those of kaolin. Zhang et al. [28] used halloysite, instead of kaolin, as a cracking agent carrier, which resulted in the high conversion rate of raw oil and the enhanced cracking ability of residual oil. They believed that when halloysite is used as an FCC catalyst carrier alone, the strength of the catalyst will weaken. In addition, at the current mining level, the mining cost of halloysite is relatively high, which limits its application.
The Yangshan mine in Suzhou was formed because of the oil-hole filling alteration on the paleokarst denudation surface [29], and kaolin is a mixed clay containing 60–70% kaolinite and 30–40% halloysite [30]. Suzhou Yangshan kaolin exhibits a sheet and tube microstructure, a high specific surface area, and large pores. The FCC catalyst with its adhesive dosage form as the carrier exhibits metal resistance, a good wear performance, high cracking activity, and good selectivity. The product, red S-1, has been widely used in the preparation of FCC catalysts since the 1980s. Presently, it is used in over 80% of the company’s products. However, many years of mining have depleted the high-quality raw-ore resources in Suzhou, and the mining process is unsustainable. Therefore, it is necessary to discover alternative resources.
Owing to the unique flake-tube bonding microstructure of Suzhou Yangshan kaolin with halloysite as the FCC catalyst carrier, the specific surface area of the carrier material and residual oil cracking capacity can be improved. In this study, the physical and chemical properties of the Maoming (M) kaolin, halloysite (Suzhou), Suzhou (S) kaolin, and M combined with halloysite (MH) kaolin samples were analyzed. The cracking catalyst samples were prepared in the cracking agent medium laboratory by conventional cracking catalyst preparation technology. Thereafter, the effects of the micromorphology of the support material on the attrition, microreactivity, and reactivity of the catalyst samples were investigated. The influence of the carrier material on the comprehensive performance of the FCC catalyst was examined from the microform of the carrier material, which is important for the purification of kaolin used in the FCC catalyst, mineral control, and expansion of its resources.

2. Materials and Methods

2.1. Raw Materials

The raw materials used in this experiment were as follows: kaolin (M) (China Kaolin Co., Ltd., Suzhou, China), dry base 84.81 wt.%; halloysite (Suzhou, H), dry base 64.21 wt.%; kaolin (Suzhou, S), dry base 83.17 wt.%; aluminum sol (Sinopec Catalyst Changling Branch, Yueyang, China), alumina content of 20.68 wt.%; Y molecular sieve HRY-1 (Sinopec Catalyst Changling Branch), dry group 35.12 wt.%; Y molecular sieve PSRY (Sinopec Catalyst Changling Branch), dry group 36.71 wt.%; pseudoboehmite (Aluminum Corporation of China, Beijing, China), dry base 60.94 wt.%; hydrochloric acid (Sinopec Catalyst Changling Branch), Concentration 20 wt.%.

2.2. Preparation of MH Sample

In view of the report [31] that S kaolin contains a 30–40% tubular halloysite structure, this study used sheet M soil and tubular H soil as raw materials to configure the MH samples containing 40% tubular H. The specific configuration process is as follows. The soil samples with 60% mass fraction and halloysite samples with 40% mass fraction were added into chemical water with 30% solid content. The samples were evenly stirred and dried at 120 °C for 4 h.

2.3. Catalyst Preparation Process

The semisynthetic FCC catalyst preparation process was adopted (Figure 1). The specific steps are as follows: ① At room temperature, add the measured molecular sieve into the water, stir for 10 min, and disperse evenly. ② Add pseudo-boehmite to ① and continue to stir for 20 min. ③ Add aluminum sol to ② and continue stirring for 20 min. ④ add kaolin to ③ and stir for 50 min. ⑤ Add 20% hydrochloric acid, stir for 30 min, adjust pH value to 3.0, and obtain the FCC catalyst colloidal samples. ⑥ The gel was spray-dried at the tail gas temperature of 220~250 °C to obtain the FCC catalyst particle samples. ⑦ Then, the catalyst samples were roasted for 2 h at 550 °C to obtain the FCC catalyst products. The cracking catalyst samples, CAT-M, CAT-H, CAT-S, and CAT-MH, were prepared in the medium catalytic cracking laboratory with M soil, H soil, S soil, and MH soils, respectively. The FCC catalyst formula is as follows.
Kaolin (dry base, wt.%): Pseudo-boehmite (dry base, wt.%): Aluminum Sol (Al2O3 content, wt.%): Y molecular sieve (dry group, wt.%) = 32:20:10:38.

2.4. Analysis Method

X-ray diffraction (XRD; UltimaIV-185 type, Rigaku, Japan) was performed for the sample phase analysis, with a tube voltage of 40 kV, a tube current of 40 mA, a 2θ scanning range of 5°–70°, a scanning rate of 0.02°/s, and Cu target rays.
The morphologies of the samples were analyzed by field-emission scanning electron microscopy (Zeiss Sigma 300, Zeiss, Jena, Germany). The microstructure of the samples was analyzed by transmission electron microscopy (TEM; JEM-2100Plus, JEOL, Tokyo, Japan).
The chemical composition of the samples was measured by X-ray fluorescence spectroscopy (XRF; Axios mAX, PANalytical B.V., Almelo, Netherlands). The powder samples were pressed, the intensity of the characteristic spectral lines of each element was measured by XRF, and the elemental content was calculated using the external standard method.
The ASAP 2460 Autosorb Multistation automatic surface area and porosity analyzer was used to test the specific surface area of the samples. Prior to the test, the samples were calcined at 550 °C for 3 h and pressed. The specific surface area of the samples was calculated using the Brunauer–Emmett–Teller (BET) method, and the pore volume and pore-size distribution were calculated using the Barrett–Joyner–Halenda (BJH) method.
The attrition of the catalyst samples was measured using the attrition tester produced by the Research Institute of Petroleum and Chemical Engineering of China Petroleum and Chemical Industry. The measurement method was Q/SH 3360 208, which put a certain amount of samples into the attrition measuring device, blowing and grinding at a constant gas speed for five hours. The samples blown in the first hour are discarded, and the samples blown four hours after the collection are calculated to use the hourly average wear mass fraction as the attrition of the samples. The attrition is calculated as follows:
AI = (m3m1)/[(m4m) + (m3m1)]/4 × 100%
In formula:
AI—the value of the mass fraction of the attrition, expressed as %/h−1;
m—the mass of a measuring bottle, expressed in grams (g);
m1—the mass of the filter paper cartridge after humidification, expressed in grams (g);
m3—total weight of filter paper cartridge after blowing and grinding for 4 h, expressed in grams (g);
m4—the mass of the bottle after collecting the catalyst powder, expressed in grams (g);
4—four hours.
The activity stability of the catalyst samples was determined using the microreactivity automatic tester produced by the Research Institute of Petrochemical and Petrochemical Science of China. The determination method was Q/SH 3360 211. Fresh catalyst samples were aged at 800 °C under 100% water vapor for 17 h. The steam aging treatment conditions were: (1) Aging treatment temperature: 800 ± 1 °C. (2) Aging treatment time: 17 h. (3) Pressure: normal pressure, 100% water steam. (4) Water inlet speed: 60 ± 3 mL/h. The operating conditions for the activity determination were: (1) Catalyst: 5.000 ± 0.002 g. (2) Oil intake: 1.56 ± 0.02 g. (3) Reaction time: 70 s. (4) Reaction temperature: 46 ± 1 °C. (5) Agent-to-oil ratio: 3.2. (6) Nitrogen or air purging time after reaction: 10~20 min. (7) Purge gas flow rate: 40~60 mL/min. (8) Length of isothermal zone: not less than 7 cm.
The cracking performance of the catalyst samples was evaluated using a small fixed-fluidized bed unit.
Dry base test was to measure the percentage of sample left after the sample was burned at 800 ± 20 °C for 1 h.

3. Results and Discussion

3.1. Physical and Chemical Properties of Kaolin

3.1.1. Chemical Composition Analysis

The chemical compositions of the M, H, S, and MH samples were analyzed (Table 1). The main chemical components of the samples were SiO2 and Al2O3, and the total content of SiO2 and Al2O3 in the sample exceeded 95 wt.%. The Si/Al molar ratios of the M, H, S, and MH samples (n(SiO2)/n(Al2O3)) were 2.15, 2.80, 2.00, and 2.10, respectively. Except for the H sample, the Si/Al ratio of the M, S, and MH samples was close to the theoretical value (2:1) [32]. The sodium, potassium, and phosphorus contents of the H sample were low, and there was no α-quartz. The quartz content of the M sample was high.
The impurity content of kaolin used as a carrier impacts the performance of FCC catalysts. The impurities in kaolin are mainly Na+ and K+; Fe2+ and Fe3+; Ti4+ [7]. The aforementioned metal ions can neutralize the acid center of the molecular sieve, except for the vanadium presence in the anatase and rutile which increases the mechanical resistance of those phases. In the presence of amorphous oxides and hydroxides, under the action of water vapor, they become free active metal ions and penetrate the acid center of the active component of the molecular sieve, causing the partial inactivation of the catalyst. For other impurities such as P2O5, when the P2O5 content in the kaolin sample was ≥0.6 wt.%, the microreactivity significantly reduced for the prepared catalyst sample [33].
The MH sample with a low content of metal impurities can effectively reduce the content of alkali metal impurities and P2O5 in the support material of the FCC catalyst and reduce the probability of poisoning the active center of the catalyst.

3.1.2. Scanning Electron Microscopy and Transmission Electron Microscopy

The SEM and TEM images of the sample are shown in Figure 2 and Figure 3, respectively. M is pseudohexagonally lamellar, and its particle size was approximately 300–600 nm (Figure 2a). H exhibits a hollow tubular shape, and the content of the H samples with tubular shape accounted for over 90% of the total amount of the samples. The size of the H particles varied from 20 nm × 100 nm to 30 nm × 800 nm (Figure 2b). The S sample exhibited a flake-tube binding morphology (Figure 2c), and the microstructure of the MH sample was similar to that of the S sample (Figure 2d).
The TEM image (Figure 3) shows the pseudohexagonal sheet shape of M kaolin and the hollow tubular H structure, which correlated with the typical characteristics of kaolinite and halloysite, respectively [31,34]. Simultaneously, the composite samples of the S and MH kaolin samples exhibited a flake-tube binding morphology, correlating with the report in [35].
The hollow tubular shape of H enabled the hydroxyl group on its surface to provide acid active sites under specific conditions and catalyze reactions, such as petroleum cracking [36]. In addition, H was used as the catalyst carrier because the nanoscale cavity structure can fix the catalyst on the surface or inside the tube to endow the catalyst with good activity and selectivity. The set size of the tube diameter only allowed molecules of a specific size to enter the tube so that part of the reactant molecules can penetrate the tube and contact the active site to achieve shape-selective catalysis. Another important reason is that the nanotube cavity structure of the supported catalyst did not significantly obstruct the diffusion of the reactants, which was conducive for the improvement of the reaction speed.

3.1.3. X-ray Diffraction

The XRD patterns of the sample are shown in Figure 4. The XRD patterns of the S and M samples show the characteristic reflections of kaolinite at 12.24°, 24.92°, 35.02°, 35.98°, and 38.42°, and no reflection was observed for the impurity phase, indicating that the sample was pure [33]. Halloysite exhibited a typical characteristic reflection of halloysite-10 Å at 2θ of 12° and 20° [34]. However, halloysite exhibited characteristic kaolinite reflections at 24.92°, 35.02°, 35.98°, and 38.42°, indicating that it contained kaolinite. As it is a kind of clay mineral, halloysite is a typical weathering product. Halloysite is often associated with kaolinite, bauxite, and hydroaluminite in the weathering crust. It is difficult to completely separate halloysite and kaolinite to produce pure-phase halloysite in the existing mineral processing procedure. Halloysite (Figure 2b and Figure 3b) exhibited a tubular morphology without kaolinite, which exhibits a flake morphology, indicating that the halloysite had an extremely low kaolinite content. Therefore, the halloysite in this study did not influence the results. Halloysite exhibited kaolinite reflections in its XRD pattern because kaolinite exhibits stronger crystallinity than halloysite does. Therefore, the intensity of the kaolinite reflections was stronger when the kaolinite content was extremely low. The XRD pattern of the MH sample shows characteristic reflections of kaolinite but not those of halloysite, which was also because the halloysite content with poor crystallization was low.

3.1.4. Surface Structure Analysis

The analysis results of the surface structure of the sample are shown in Table 2 and Figure 5. Compared with those of the S sample, the specific surface area and pore volume of the M soil were lower, whereas those of the H soil were higher at 65.8 m2/g and 0.33 mL/g, respectively. The specific surface area of the MH sample slightly increased, whereas the pore volume significantly increased from 0.09 mL/g to 0.19 mL/g.
The pore structure of the carrier material has an important effect on the performance of an FCC catalyst. A large pore volume and specific surface area can improve the dispersion of the active component and the accessibility of the acid center in the catalyst, increase the diffusion rate of the target-product molecules, inhibit the occurrence of side reactions such as the production of coke, and improve the yield of valuable products.

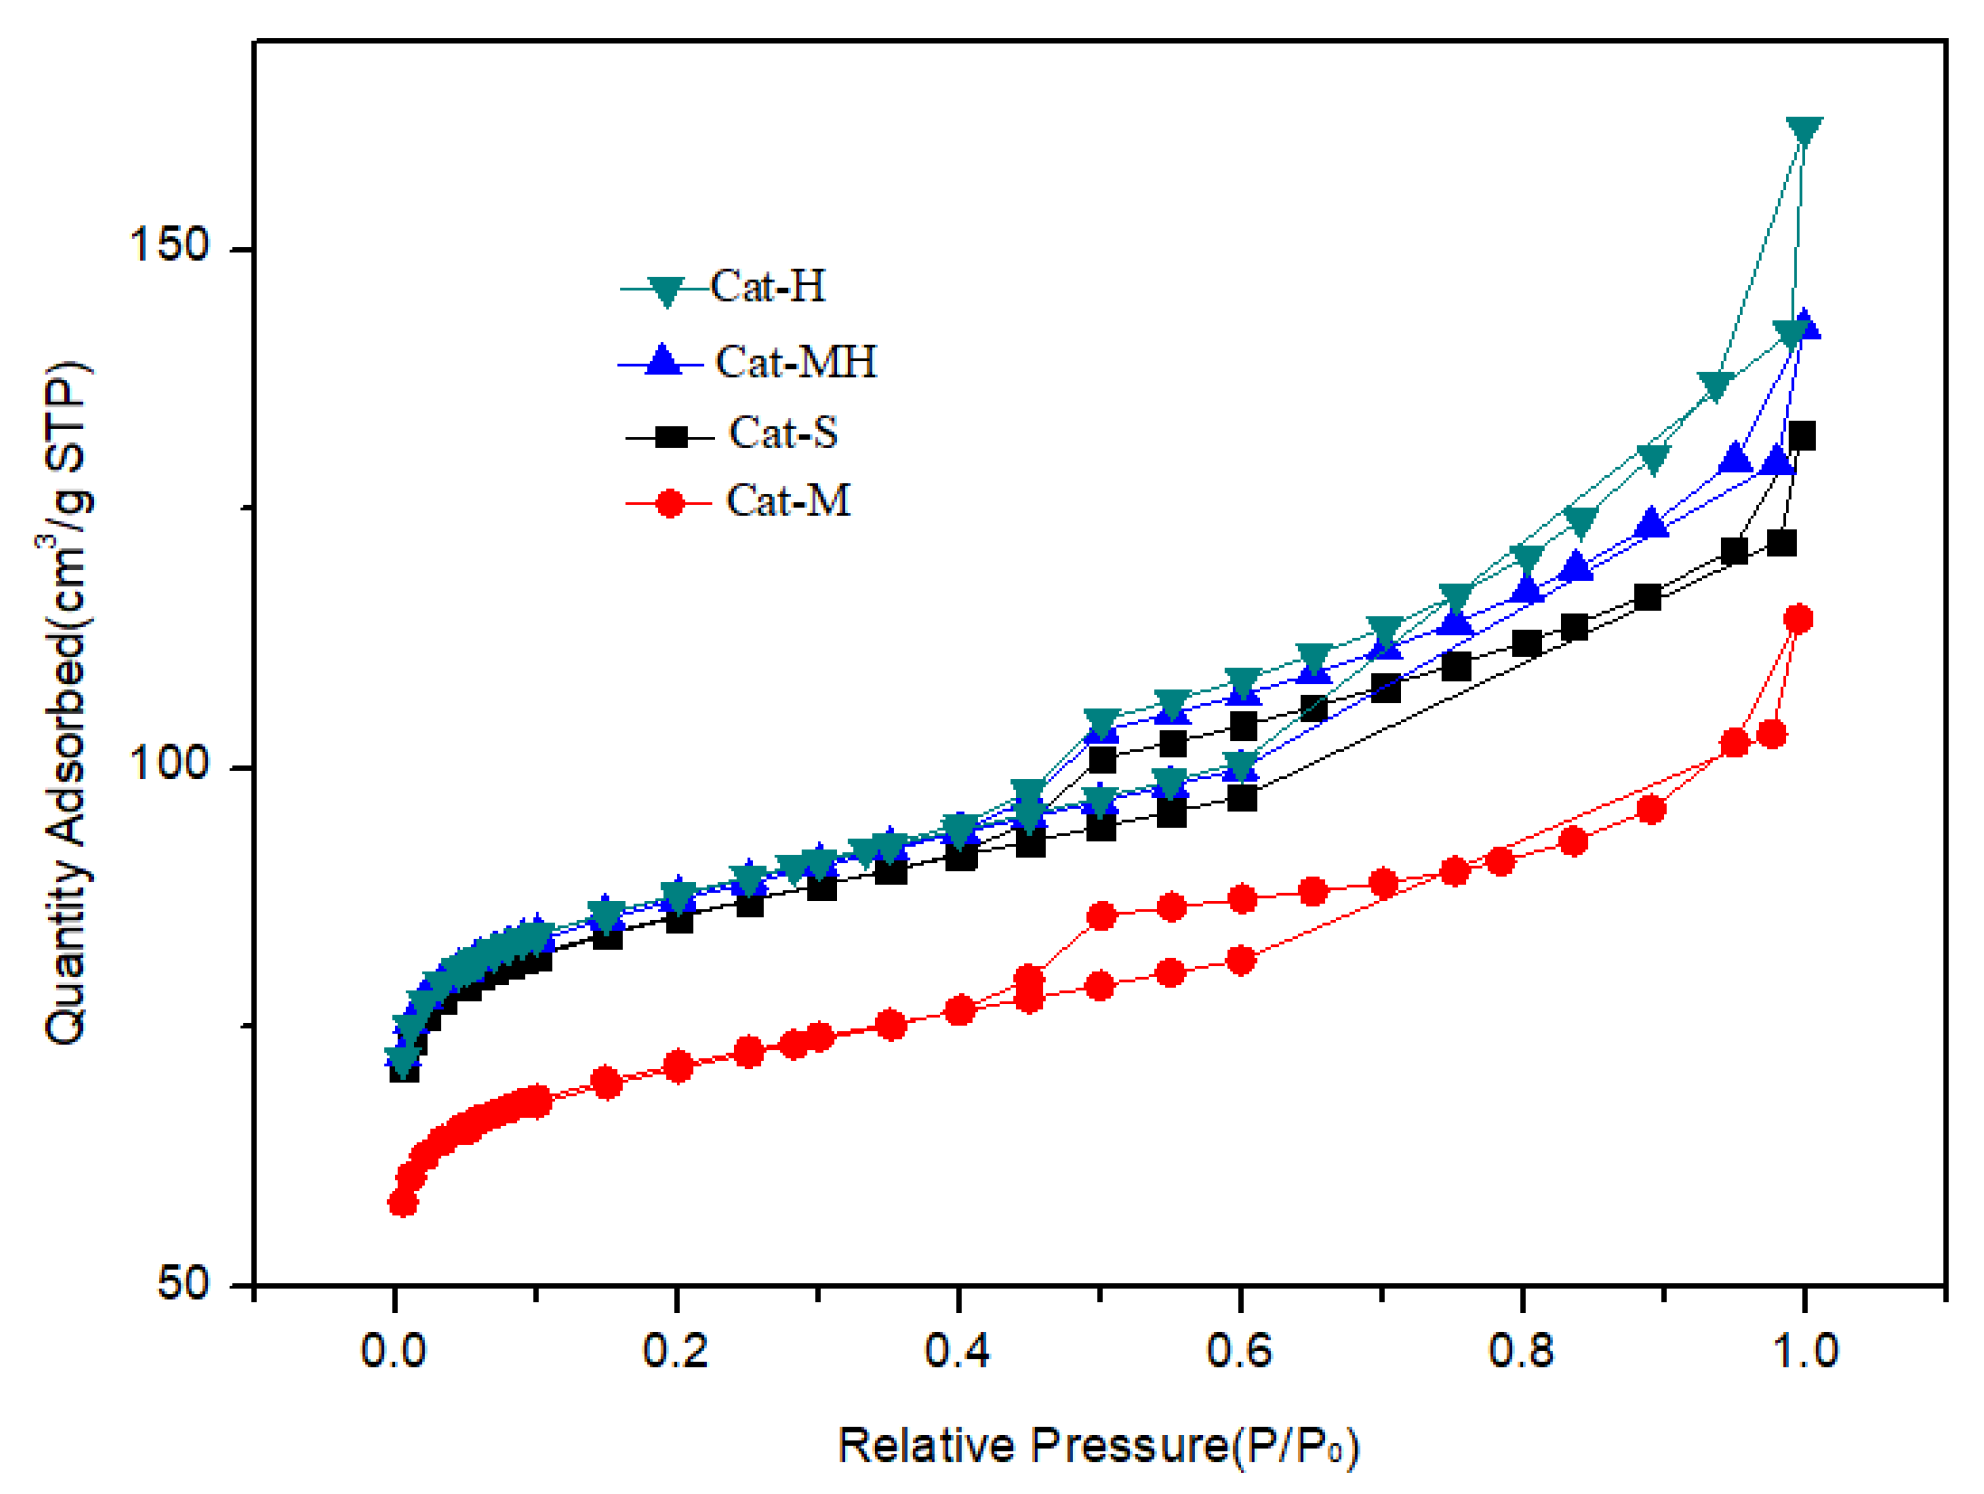
3.2. Characterization of Catalyst Properties

3.2.1. Physicochemical Properties of the Catalyst Samples

The FCC catalyst samples were prepared from M, H, S, and MH soils in the medium laboratory of catalytic cracking. After washing and drying the prepared FCC catalyst samples, the chemical composition and surface structure of the catalysts were analyzed, and the results are shown in Table 3 and Table 4 and Figure 6.
The analysis results of the chemical composition of the catalysts showed that using the same formula and only changing the type of kaolin, the chemical compositions of the prepared catalysts were similar. This indicated that the preparation process of the catalyst was extremely stable, excluding the influence factors of other raw materials and the preparation process in the performance evaluation of the catalysts.
For the results of the surface structure analysis of the catalysts, the N2 adsorption curves of the catalyst samples exhibited the same trend as that of the support material, kaolin. Compared with those of CAT-M, the specific surface area, matrix area, pore volume, and mesoporous volume of CAT-MH and CAT-H were higher, and those of CAT-S were similar to those of CAT-MH. The reason is that the addition of tubular halloysite as the support material increased the specific surface area, matrix area, pore volume, and mesoporous volume of the catalyst under the premise that the other raw materials remained the same.
The attrition index and microreactivity of the catalyst samples were evaluated (Table 5). The attrition indicates the strength of the FCC catalyst. The higher the attrition is, then the weaker the catalyst is. The attrition of the FCC catalyst used in the industry is generally required to be below 3.0 wt.% h−1. Compared with the attrition of CAT-M (3.5 wt.% h−1), those of the other three samples were lower, and the order is as follows: CAT-M > CAT-MH > CAT-S > CAT-H. The addition of tubular halloysite improved the strength of the FCC catalyst, and the attrition of CAT-MH was equivalent to that of CAT-S, which meets the requirements of the attrition of industrial catalysts. On the condition that the other raw materials were the same, the alpha-SiO2 content and origin of kaolin can impact the attrition of the FCC catalyst. In addition, alpha-SiO2 is insoluble in an FCC catalyst gel formation, and a high alpha-SiO2 content will increase the attrition of the catalyst.
The microreactivity test (MAT) is a method to rapidly detect the activity of fresh and balanced catalysts, which can preliminarily determine the heavy oil cracking ability of catalysts. The higher the microreactivity, the stronger the heavy oil cracking ability. Here, the activity of CAT-M was 62.2 wt.%, and that of CAT-H was higher (63.9 wt.%). The activity of CAT-S was similar to that of CAT-MH, which was between those of CAT-M and CAT-H. This indicated that under the premise of the same raw materials, the addition of tubular halloysite to the carrier of M soil can improve the activity of the catalyst, which correlated with the results reported by Zhang et al. (1996).

3.2.2. Evaluation of Catalyst Reaction Performance

Here, a fixed-fluidized bed test device was used to evaluate the cracking reaction performance of the catalyst samples. The device can measure the product distribution and product in detail and better simulate the operation of the catalyst in the industrial process. The flow chart of the device is shown in Figure 7.
After the fresh catalyst samples were aged at 800 °C under 100% water vapor for 17 h, the cracking reaction performance of the catalyst samples was investigated at 510 °C, and the ratio of agent to oil was 6.0. The properties of raw oil are shown in Table 6. The product distribution results of the fixed-fluidized bed are listed in Table 7, and the properties of gasoline are shown in Table 8.
The evaluation results of the cracking reaction performance showed that the conversion rate of CAT-M was 67.61 wt.%. The yield of LPG + gasoline was 60.57 wt.%, while that of diesel oil was 19.48 wt.%, and that of heavy oil was 12.91 wt.%. In comparison, under the same reaction conditions, the conversion rate of CAT-H increased by 4.05 percentage points. Its LPG + gasoline yield increased by 2.87 percentage points, while that of diesel oil decreased by 1.48 percentage points, and that of heavy oil decreased by 2.58 percentage points. For CAT-S, the conversion rate increased by 2.28 percentage points, the LPG + gasoline yield increased by 1.75 percentage points, the diesel oil yield decreased by 1.37 percentage points, and the heavy oil yield decreased by 1.51 percentage points. For CAT-MH, the conversion rate increased by 3.08 percentage points, the LPG + gasoline yield increased by 3.09 percentage points, the diesel oil yield decreased by 0.93 percentage points, and the heavy oil yield decreased by 1.24 percentage points. From the main properties of gasoline, compared with those of CAT m (89.9), the octane numbers of CAT-H, CAT-S, and CAT-MH were 0.7, 0.4, and 0.6 units higher.
According to the cracking reaction performance results, compared with those of CAT-M, the catalyst samples prepared using a tubular or flake-tube-combined carrier exhibited higher reaction conversion rates and valuable product yields, lower diesel and heavy oil yields, stronger conversion ability of heavy oil, and higher octane numbers of gasoline. These results correlated with the MAT results.
CAT-S, CAT-MH, and CAT-H exhibited good physicochemical and cracking properties. There are three possible reasons of this: (1) The hollow tubular microscopically shaped halloysite has a large specific surface area, and the active component molecular sieve can be evenly distributed, which affords the active component with additional active sites. (2) The catalyst cracking reaction followed seven steps: external diffusion, internal diffusion, adsorption, reaction, desorption, internal diffusion, and external diffusion. The tubular microstructure rendered the oil and gas molecules of the reaction raw material easy to adsorb and diffuse to the active site for the reaction, which increased the accessibility of the active components. (3) MH (M mixed with halloysite) or halloysite was used as the support material of the FCC catalyst, which effectively reduced the content of alkali metal impurities and P2O5 in the support material.

4. Conclusions

The attrition of the FCC catalyst prepared with flake kaolin (CAT-M) was high, its strength did not meet the requirements of industrial production, and the microreactivity and cracking reaction performance were poor. The catalyst prepared with the microform of tubular halloysite (CAT-H) exhibited better strength, higher microreactivity, and better cracking reaction performances than those of CAT-M. CAT-S and CAT-MH exhibited good strength and cracking reaction performances. The former one has been widely used in the preparation process of FCC catalysts, and the latter one exhibited better strength and increased microreactivity and cracking reaction performances, owing to the addition of tubular halloysite. This performance was comparable to that of CAT-S. The possible reason is that the MH sample had a larger specific surface area and pore volume, the active component was evenly dispersed, and the accessibility of the active center increased. Additionally, the MH sample had a lower alkali metal and P2O5 impurity content.
The study of the micromorphology and compounds of the carrier material can guide the mineral processing and resource allocation of kaolin used for the carrier materials of FCC catalysts and broaden the source of kaolin used for these carriers, which is important for overcoming the resource limitation of the kaolin used for FCC catalysts.

Author Contributions

J.B.: investigation, visualization, methodology, data curation, writing—original draft, writing—review and editing. W.R.: investigation, visualization, methodology, writing—review and editing. Y.Z.: resources, supervision, writing—review and editing. B.W. (Bin Wen): conceptualization, resources, investigation, supervision. B.W. (Bo Wang): experimentalize, gather data. G.L.: conceptualization, resources, supervision, writing—review and editing. L.L.: conceptualization, resources, supervision. All authors have read and agreed to the published version of the manuscript.

Funding

This research was funded by The National 13th Five-Year key research and development plan, China, grant number [2017YFB0310704], and The APC was funded by [2017YFB0310704].

Data Availability Statement

Data will be made available on request.

Acknowledgments

This work was financially supported by The National 13th Five-Year key research and development plan, China (grant No. 2017YFB0310704).

Conflicts of Interest

The authors have no conflict of interest.

References

  1. Magee, J.S.; Letzsch, W.S. Fluid cracking catalyst performance and development. Am. Chem. Soc. 1994, 571, 349–371. [Google Scholar]
  2. Hou, X. Refining Technology in China; China Petroleum Press: Beijing, China, 2001; pp. 104–146. [Google Scholar]
  3. Yun, X.; Honghong, S. Process and technical progress of residual catalytic cracking. Chem. Eng. Oil Gas. 2001, 30, 79–82. [Google Scholar]
  4. Karl, K.; Melissa, C.M.; Aaron, T.; Bilge, Y. Iron Tolerance in FCC Catalysts from in situ synthesis: A combined Mössbauer spectroscopy and catalytic testing investigation. Appl. Catal. A Gen. 2022, 644, 118743. [Google Scholar]
  5. Souza, N.L.A.; Paniago, R.; Ardisson, J.D.; Morgado, E., Jr.; Krambrock, K. Iron contamination of FCC catalysts: Quantification of different crystalline phases and valence states. Appl. Catal. A Gen. 2019, 569, 57–65. [Google Scholar] [CrossRef]
  6. Junwu, C. Catalytic Cracking Process and Engineering; China Petroleum Press: Beijing, China, 2005; pp. 17–18. [Google Scholar]
  7. Zheng, S.; Suo, J.; Zhang, L.; Liu, H.; Wang, B. The influence and application of kaolin in FCC catalyst. Non Met. Mines 2002, 25, 22–23. [Google Scholar]
  8. Brzaj, B.; Hocevar, S.; Pejovnik, S. Zeolite-Synthesis, Structure, Technology and Application; Elsevier: Amsterdam, The Netherlands; Oxford, UK; New York, NY, USA; Tokyo, Japan, 1985; pp. 147–154. [Google Scholar]
  9. Yongming, Z.; Liu, H.; Zheng, S.; Suo, J. The preparation and characterrization of a novel type of FCC catalysts. J. Mol. Cat. 1995, 9, 424–434. [Google Scholar]
  10. Sadeghbeigi, R. Fluid Catalytic Cracking Handbook: An Expert Guide to the Practical Operation, Design, and Optimization of FCC Units, 3rd ed.; Edwards Brothers Inc./Butterworth-Heinemann (Elsevier): Ann Arbor, MI, USA, 2012; pp. 130–134. [Google Scholar]
  11. Wilson, J.W. Fluid Catalytic Cracking Technology and Operations; Pennwell Publishing Company: Tulsa, OK, USA, 1997; pp. 47–52. [Google Scholar]
  12. Scherzer, J. Octane-enhancing, zeolitic FCC catalysts: Scientific and technical aspects. Cat. Rev. 1989, 31, 293–300. [Google Scholar] [CrossRef]
  13. Liu, P.; Zhang, Z.; Jia, M.; Gao, X.; Yu, J. ZSM-5 zeolites with different SiO2/Al2O3 ratios as fluid catalytic cracking catalyst additives for residue cracking. Chin. J. Cat. 2015, 36, 806–812. [Google Scholar] [CrossRef]
  14. Wang, G.; Lan, X.; Xu, C.; Gao, J. Study of optimal reaction conditions and a modified residue catalytic cracking process for maximizing liquid products. Ind. Eng. Chem. Res. 2009, 48, 3308–3316. [Google Scholar] [CrossRef]
  15. Rana, M.S.; Sámano, V.; Ancheyta, J.; Diaz, J.A.I. A review of recent advances on process technologies for upgrading of heavy oils and residua. Fuel 2007, 86, 1216–1231. [Google Scholar] [CrossRef]
  16. Gray, M.R. Upgrading Petroleum Residues and Heavy Oils; Marcel Dekker, Inc.: New York, NY, USA, 1994; p. 261. [Google Scholar]
  17. Shan, H.; Li, C.; Niu, G.; Yang, C.; Zhang, J. Research progress of fluidized catalytic cracking technology. J. Univ. Petrol. 2005, 29, 135–150. [Google Scholar]
  18. Khattaf, S.; de Lasa, H. The role of diffusion in alkyl-benzenes catalytic cracking. Appl. Cat. Gen. 2002, 226, 139–153. [Google Scholar] [CrossRef]
  19. Nace, D.M. Catalytic cracking over crystalline aluminosilicates. Microreactor study of gas oil cracking. Ind. Eng. Chem. Prod. Res. Dev. 1970, 9, 203–209. [Google Scholar] [CrossRef]
  20. Yang, Y. Study in Synthesis and Analysis of New Fluid Catalytic Cracking Catalyst with Characterization and Reaction Properties of Cracking; Northwest Normal University: Lanzhou, China, 2009. [Google Scholar]
  21. Wang, L.; Liu, Q. Application of kaolin in the synthesis of FCC catalyst. China Non-Met. Miner. Ind. Guide 2009, 75, 19–22. [Google Scholar]
  22. Li, Z.; Liu, Y. Effects of kaolin on properties of fluidized catalytic cracking catalyst. Inorg. Chem. Ind. 2017, 49, 83–86. [Google Scholar]
  23. Adams, J.M.; McCabe, R.W. Clay minerals as catalysts. In Handbook of Clay Science; Bergaya, F., Theng, B.K.G., Lagaly, G., Eds.; Elsevier: Amsterdam, The Netherlands, 2006; pp. 541–581. [Google Scholar]
  24. Castellano, M.; Turturro, A.; Riani, P.; Montanari, T.; Finocchio, E.; Ramis, G.; Busca, G. Bulk and surface properties of commercial kaolins. Appl. Clay Sci. 2010, 48, 446–454. [Google Scholar] [CrossRef]
  25. Andersson, S.; Myrstad, T. Optimum prorerties of RFCC catalysts. Stud. Surf. Sci. Cat. 2001, 134, 227–238. [Google Scholar]
  26. Yuan, P.; Tan, D.; Annabi-Bergaya, F. Properties and applications of halloysite nanotubes: Recent research advances and future prospects. Appl. Clay Sci. 2015, 112–113, 75–93. [Google Scholar] [CrossRef]
  27. Rong, T.; Xiao, J. The catalytic cracking activity of the kaolin-group minerals. Mater. Lett. 2002, 57, 297–301. [Google Scholar] [CrossRef]
  28. Xin, Z.; Juewu, Z.; Jun, G.; Mingyuan, H. The application of different kaolin clays in the matrices of FCC catalysts. Petrol. Process. Petrochem. 1996, 2, 23–27. [Google Scholar]
  29. Liu, C. Resource Types of Hunan Kaolin and Exploitation and Utilization of Low-Quality Kaolin; Central South University: Changsha, China, 2004. [Google Scholar]
  30. Mingguo, Z. A discussion on an application of clay into industrial catalysator in China. Gui Zhou Geol. 1998, 15, 43–46. [Google Scholar]
  31. Niu, J.; Qiang, Y.; Wang, C.; Li, X.; Zhou, Y.; Shang, X.; Zhuang, Q. Nomenclature, structure, morphology and curling mechanism of halloysite-7. Acta. Mineral. Sin. 2014, 1, 13–22, (In Chinese with English Abstract). [Google Scholar]
  32. Yanjun, M.; Hongchang, D.; Gangwei, X.; Zhengguo, T.; Haitao, Z. Effect of soil sources on properties of fluid catalytic cracking catalyst. Petrochem. Technol. Appl. 2019, 37, 26–29. [Google Scholar]
  33. Wang, B.; Bao, J.; Wen, B.; Feng, J.; Wu, X.; Lin, Y. The feasibility study of kaolin from different regions as the FCC catalyst carrier. Non-Met. Mines 2020, 43, 30–32. [Google Scholar]
  34. Zhilin, C.; Wei, S. Structure and physical properties of halloysite nanotubes. Acta Petrol. Sin. 2016, 32, 150–155. [Google Scholar]
  35. Feng, M.; Tian, H.; Zhang, W.; Yu, S.; Zhang, J.; Wang, Z.; Li, J. Properties of different kaolin clays and their application in FCC catalysts. Ind. Cat. 2018, 26, 20–26. [Google Scholar]
  36. Ma, Z.; Wang, J.; Gao, X.; Ding, T.; Qin, Y. Application of halloysite nanotubes. Prog. Chem. 2012, 24, 275–283. [Google Scholar]
Figure 1. Preparation process of the semisynthetic FCC catalyst.
Crystals 13 00123 g001
Figure 2. SEM images of kaolinite and halloysite. (a) M; (b) H; (c) S; (d) MH.
Crystals 13 00123 g002
Figure 3. TEM images of kaolinite and halloysite. (a) M; (b) H; (c) S; (d) MH.
Crystals 13 00123 g003
Figure 4. XRD pattern of the samples.
Crystals 13 00123 g004
Figure 5. N2 adsorption curves of the carrier samples.
Crystals 13 00123 g005
Figure 6. N2 adsorption curves of the catalyst samples.
Crystals 13 00123 g006
Figure 7. Flow chart of small fixed-fluidized bed catalytic cracking test unit. ① Oxygen. ② Air. ③ Flow meter. ④ Oil pump. ⑤ Gasifier. ⑥ Preheating oven. ⑦ Water pump. ⑧ Catalyst inlet. ⑨ Reactor. ⑩ Emergency vent valve. ⑪ Primary condensation. ⑫ Secondary condensation. ⑬ Three-stage condensation. ⑭ Gas products. ⑮ Liquid products. ⑯ Blowoff valve. ⑰ Gas jar.
Crystals 13 00123 g007
Table 1. Chemical composition of kaolin.
Samples (wt.%)MHSMH
Al2O342.0237.0244.8043.02
SiO253.1361.2552.8253.23
Fe2O30.670.110.810.56
SO42−/0.381.240.67
Na2O0.070.000.040.06
K2O0.440.250.530.38
P2O50.300.070.330.23
a-SiO21.14/1.050.85
n(SiO2)/n(Al2O3)2.152.802.002.10
Table 2. Surface properties of the kaolin samples.
SamplesMHSMH
Total Surface Area (m2/g)18.1365.8023.5027.36
Pore Volume (mL/g)0.090.330.110.19
Table 3. Chemical compositions of the catalysts.
Samples (wt.%)CAT-MCAT-HCAT-SCAT-MH
Al2O351.4152.0451.6251.38
SiO243.1242.2843.1643.09
Fe2O30.320.280.140.33
SO42−0.480.440.470.42
Na2O0.140.140.120.15
K2O0.220.150.130.20
TiO20.160.120.150.14
P2O50.400.470.430.41
Re2O32.913.092.952.95
Cl0.730.870.770.76
Table 4. Surface structures of the catalysts.
SamplesCAT-MCAT-HCAT-SCAT-MH
Total surface Area (m2/g)330340338342
Micropore area (m2/g)247246248251
Matrix area (m2/g)83949091
Pore Volume (mL/g)0.210.240.220.22
Micropore volume (mL/g)0.0960.0970.0970.098
Mesoporous volume (mL/g)0.1140.1430.1230.122
Table 5. Physicochemical properties of catalysts.
SamplesCAT-MCAT-HCAT-SCAT-MH
MAT */17 h (wt.%)62.263.963.163.6
Attrition (wt.% h−1)3.51.32.83
* Fresh catalyst samples were aged at 800 °C under 100% water vapor for 17 h.
Table 6. Properties of raw oil.
ItemsDensity (kg/m³)Carbon Residue (wt.%)H (wt.%)Fe (ug/g)Na (ug/g)Ni (ug/g)V (ug/g)Saturated Hydrocarbon (wt.%)Aromatic (wt.%)Colloid (wt.%)
values928.72.6812.109.190.224.232.3458.4130.837.67
Table 7. Evaluation results of the fixed-fluidized bed.
Samples (wt.%)CAT-MCAT-HCAT-SCAT-MH
dry gas1.802.181.961.81
LPG11.6513.0113.1712.61
gasoline48.9250.4349.1551.05
diesel19.4818.0018.7118.55
slurry12.9110.3311.4010.67
coke5.246.055.615.32
conversion67.6171.6769.8970.79
propene4.174.234.314.17
butene2.932.843.213.33
light oil68.4068.4367.8669.60
LPG + gasoline60.5763.4462.3263.66
coke selectivity #0.0780.0840.0800.075
# coke selectivity = coke/conversion×100%.
Table 8. The main properties of gasoline.
SamplesCAT-MCAT-HCAT-SCAT-MH
n-alkanes (wt.%)2.963.603.213.56
i-alkanes (wt.%)31.1635.4835.4334.61
Olefins (wt.%)21.0719.8520.9422.47
Cycloalkanes (wt.%)10.109.269.699.54
Aromatics (wt.%)33.8430.8029.7728.97
Research octane number89.990.690.390.5
Motor octane number73.575.174.474.9
Disclaimer/Publisher’s Note: The statements, opinions and data contained in all publications are solely those of the individual author(s) and contributor(s) and not of MDPI and/or the editor(s). MDPI and/or the editor(s) disclaim responsibility for any injury to people or property resulting from any ideas, methods, instructions or products referred to in the content.

