Article

Thermal and Mechanical Characterization of Coir Fibre–Reinforced Polypropylene Biocomposites

1
Faculty of Industrial Design and Business Management, Gheorghe Asachi Technical University of Iasi, 29 Prof. Dr. Doc. D. Mangeron Blvd, 700050 Iasi, Romania
2
Taparo Company SA, 198 Borcut Street, 435600 Targu Lapus, Romania
3
“Cristofor Simionescu” Chemical Engineering and Environmental Protection Faculty, Gheorghe Asachi Technical University of Iasi, 73 Prof. Dr. Doc. D. Mangeron Blvd, 700050 Iasi, Romania
*
Author to whom correspondence should be addressed.
Crystals 2022, 12(9), 1249; https://doi.org/10.3390/cryst12091249
Submission received: 14 August 2022 / Revised: 30 August 2022 / Accepted: 31 August 2022 / Published: 2 September 2022
(This article belongs to the Special Issue Feature Papers in Macromolecular Crystals)

Abstract

:
In recent years, the growth of environmental awareness has increased the interest in the development of biocomposites which are sustainable materials with an excellent price–performance ratio and low weight. The current study aimed to obtain and characterize the biocomposites prepared by thermoforming using coir fibres as reinforcing material and polypropylene as matrix. The biocomposites were produced with different coir fibres/polypropylene ratios and were characterized by physical–mechanical indices, thermal analysis, crystallinity, attenuated total reflection-Fourier transform infrared spectroscopy analysis (ATR-FTIR), scanning electron microscopy (SEM), and chromatic measurements. Both tensile and bending strength of biocomposites decreased when the coir fibre content increased. The melting temperature of biocomposite materials has decreased with the increase of the coir fibre loading. Regarding the thermal stability, the weight loss and degradation temperature increased with decreasing coir fibre content. The ATR-FTIR and SEM analyses underlined the modifications that took place in the structure of the biocomposites by modifying the coir fibres/matrix ratio.

Graphical Abstract

1. Introduction

Over the last few years, the environmental problems caused by the depletion of nonrenewable petroleum resources, pollution and climate change have boosted research on biocomposites for various end-use applications.
The definition of biocomposites differs significantly in the literature. Some authors define biocomposites as composite materials obtained from natural fibres as reinforcement and polymers from synthetic or natural sources as matrix [1,2]. Other authors consider biocomposites to be the materials whose constituents have natural origins [3,4]. Because several biopolymers produced from renewable resources are not biodegradable, in order to define biocomposites, the ability of composite constituents to decompose under environmental conditions has been taken into consideration, instead of constituent source [5,6,7]. Drzal et al. classified biocomposites as partially biodegradable and completely biodegradable [8], the latter materials being known in the literature as green biocomposites [2,9].
The coir fibre-reinforced polypropylene biocomposites are partially biodegradable. The coir fibres used as reinforcement are completely biodegradable and come from a renewable resource (the husk of coconut fruit). Coir fibres are found between the hard, inner shell and the outer layer of a coconut [10]. Their length can range from 15 to 35 cm and diameter from 50 to 300 μm [11]. Depending on the moment of dehusking, the coir fibres can be white or brown [12,13]. White coir fibres are extracted from immature coconut husk, while brown coir fibres are extracted from mature coconut husk. Because the content of lignin is lower, the white coir fibres are weaker, finer, and more flexible than the brown fibres. In engineering, brown fibres are mainly used due to their high mechanical properties.
Coir fibres are lignocellulosic fibres, and their chemical composition varies greatly depending on the conditions and growing area or the method of extraction used. Coir fibres are found in abundance in many tropical countries such as India, Sri Lanka, Thailand, Bangladesh, Malaysia, Vietnam, Indonesia, etc., [13,14]. Many authors present different chemical compositions of coir fibres that can contain 32–50% cellulose, 30–46% lignin, 0.15–15% hemicellulose, and about 3–4% pectin [15,16,17]. One of the most important properties of these fibres is the increased resistance to degradation because of the high content of lignin. Coir fibres have a series of advantages such as low price, low density (1.1–1.5 g/cm3), high breaking elongation, low elastic modulus, and good strength, but because of the high lignin content, they are stiff [16].
Polypropylene is a by-product of the petroleum industry. Polypropylene comes from fossil resources and is not biodegradable but has the advantage of being recyclable. Several authors have investigated the recycling of polypropylene and polypropylene-based composites [18,19,20,21]. The studies have revealed that polypropylene can be subjected to many heating and cooling cycles. Between thermoplastic polymers, polypropylene is the most used matrix in composite materials owing to its advantages: low density, low moisture absorption, good tensile and abrasion resistance [22].
Coir fibre-reinforced biocomposites have a wide range of end-uses such as acoustic panels for sound insulation, ceilings, partition boards, furniture, panels for automotive interior applications, etc., [23,24,25,26]. In many applications, coir fibres can replace the fibreglass reinforcement due to environmental benefits and an excellent price–performance ratio at low weight [23]. Coir fibres have suitable properties for composite reinforcement such as durability, high hardness, low thermal conductivity, good acoustic resistance, resistance to moisture and salt water, nontoxicity, low combustibility, and resistance to microbes and fungi [26].
In the last decade, the interest in using coir fibres as reinforcement in polymeric composites has continuously increased. Several researchers have studied the mechanical characteristics of coir fibre-reinforced composites [27,28,29,30,31,32,33], the treatment of coir fibres, and the thermal properties of polymer-based composites reinforced with coir fibres [16,17,34,35]. Based on the research findings, it can be appreciated that the future of composite materials containing coir fibres is promising.
The research aim was to obtain and characterize biocomposite materials that contain, in various mixing ratios, coir fibres as reinforcement and polypropylene (PP) as matrix. Thermoforming has been chosen as the manufacturing technique for biocomposites due to its advantages: high reinforcement fibre content, high production rate, low production costs, appropriate for three-dimensional large parts production [36]. The biocomposite materials were analysed in terms of physical and mechanical properties, crystallinity, thermal behaviour, surface morphology by SEM images and ATR-FTIR spectra and colour analysis. In the present work, a correlation between mechanical properties and the crystallinity of biocomposite materials has been performed.

2. Materials and Methods

2.1. Materials

Matrix polypropylene fibres and mature coir (Co) fibres as the reinforcing agent were used for the experiments. The fibres have been provided by S.C. TAPARO S.A., TarguLapus, Romania. The characteristics of the fibres were as follows:
  • Polypropylene: 6.7 dtex linear density, 27 cN/tex tenacity, 100% breaking elongation; 60 mm length; 7.5 g/10 min (230 °C/2.16 kg) melting flow index = 0.9 g/cm3 density; 160 °C melting temperature—produced by Beauileu International Group, Kruisem, Belgium;
  • Coir fibres: 0.25 mm diameter, 102 MPa tensile strength, 23% breaking elongation and a length that ranged between 50 and 100 mm—purchased from Madras, India.

2.2. Methods

2.2.1. Experimental Variants

Polypropylene (PP) and coir (Co) fibres were blended in different ratio, the percentage of each constituent in the blend ranging from 0 to 100%. The composition and the coding of each blend variant are presented in Table 1.

2.2.2. Composite Manufacturing Process

The matrix and reinforcing fibres were manually blended and then fed to an Ingolstadt scutcher (Ingolstadt, Germany). The obtained mat was mechanically bonded on a needle punching machine. Four pieces of each variant of needle-punched nonwoven fabric were overlaid in the mould of the thermoforming machine. The material was heated (190 °C) and pressed (735.5 MPa) between the plates for 10 min and then cooled.

2.2.3. Mechanical Properties

Bending and tensile tests were performed on LBG testing equipment (Azzano San Paolo, Italy). The samples for tensile testing were cut at 250 mm length and 25 mm width, as stated in the EN 326–1 standard. The tensile testing conditions were as follows: 150 mm distance between grips and 5 mm/min test speed, in agreement with SR EN ISO 527–42006 standard. The width of the samples for the bending test was 15 mm and the length was established in accordance with sample thickness, as specified in SR EN ISO 14125 standard. Five measurements were performed for each test and variant.

2.2.4. Thermogravimetric Analysis

The thermogravimetric analysis was performed on a Mettler Toledo TGA/SDTA 851 balance (Columbus, OH, USA). Samples of 1.9–5.3 mg were used for heating scans in the temperature domain from 25 °C to 700 °C in order to record the mass losses (TG) and the derivative thermogravimetric curves (DTG). The nitrogen flow was constant (20 mL/min) and the heating rate was 10 °C/min.

2.2.5. Differential Scanning Calorimetry (DSC)

A Mettler Toledo DSC1 differential scanning calorimeter (Columbus, OH, USA) was used to analyse the melting and crystallisation behaviour of the biocomposites. The scanning of the samples took place in a temperature domain from −60 °C to 200 °C at a heating rate of 10 K/min. The samples were cooled with the same rate and then rescanned. The flow rate of nitrogen was set at 150 mL/min. Composite materials are partially crystalline substances in which the crystalline domains and the amorphous domains coexist. The ratio between the amorphous phase and the crystalline phase varies depending on the matrix and on the reinforcing agent used. For determination of the crystallinity degree of the composite material, we used the DSC method. The crystallinity of biocomposites, ΧC (%), was obtained using Equation (1) [37]:
Χ c % = Δ H m Δ H m 0 · 100
wherein ∆Hm is the melting enthalpy of the biocomposite materials, and Δ H m 0 is the theoretical enthalpy of melting of fully crystalline polypropylene, whose value is given in the literature (207 J∙g−1).

2.2.6. Fourier Transform Infrared Spectroscopy

For the spectroscopic analysis of biocomposites, a Bruker FTIR Vertex 70 spectrometer was used (Golden Gate; Bruker, Billerica, MA, USA). Spectra were accumulated from 64 scans in the spectral domain of 600–4000 cm−1.

2.2.7. Scanning Electron Microscopy

The characterization of the morphology and surface structure of biocomposites was performed using a Quanta 200 (FEI) scanning electron microscope (Hillsboro, OR, USA).

2.2.8. Chromatic Measurements

A DATACOLOR SF–300 spectrophotometer (Lawrence Township, NJ, USA) was used to measure the biocomposite sample colour on the entire visible spectrum. Colour strength has been evaluated using the Kubelca–Munk equation [38]:
K S = 1 R 2 2 R
where “R” is the reflectance at sample complete opacity, “K” is the absorption coefficient, and “S” is the scattering coefficient.

3. Results and Discussions

3.1. Mechanical Properties

The mechanical characteristics of the experimental variants are presented in Table 2. The 100Co variant is a needle-punched nonwoven material. The slippage of fibres during testing explains its low tensile strength and high breaking elongation when compared to biocomposite material characteristics.
As can be seen in Table 2, the tensile strength of coir fibre-reinforced biocomposites decreased when the content of coir fibres increased due to an increase in the interfacial area between fibres and matrix. The weak bond at the fibre–matrix interface does not allow a good transfer of stress from the matrix to the fibres. This result agrees with the results of other authors [27,29]. The tensile strength of all biocomposite variants was lower than the tensile strength of the 100PP variant.
The breaking elongation of biocomposite variants increased as the content of coir fibres increased. A rise in the content of reinforcement fibres leads to fewer bonds between fibres and matrix and makes fibres prone to slipping. The breaking elongation of biocomposite materials is lower than the breaking elongation of 100PP due to the large difference between the breaking elongations of the biocomposite materials constituents. Moreover, the insertion of rigid coir fibre in the PP matrix decreases the mobility of the PP molecular chains that cannot move easily in the biocomposite materials.
It can be noticed from Table 2 that the bending strength of coir fibre-reinforced biocomposites decreased with the rise in coir fibre loading. This behaviour can be explained by the decrease of fibre–matrix interactions. At high content of coir fibres, the PP matrix cannot completely cover the fibre surface. The bending strength of coir fibre-reinforced PP biocomposites is generally lower than that of PP-based biocomposites reinforced with other lignocellulosic fibres. This can be explained by the lower cellulose content (32–42%) and the fibrillar structure of coir fibre. The microfibril angle of the secondary cell wall is higher (30–49°) than in other fibres which leads to a low degree of orientation of the cellulose chains and, consequently, to a low mechanical performance [14,39,40,41].
As regards the bending modulus, its value increased with the increase of the amount of coir fibre in the biocomposite up to 25%. This increase in bending modulus can be attributed to coir fibre which has a higher bending modulus than the thermoplastic PP matrix. The increase in the content of coir fibres in the biocomposite material led to an increase in the rigidity of the material. Thus, the mobility in the amorphous regions is lower with the incorporation of coir fibres in the polymeric matrix (PP) because the coir fibres are more rigid than the polymeric matrix [26]. However, at higher coir fibre contents, the bending modulus showed lower values, probably due to the decrease of fibre–matrix interactions.

3.2. TG and DTG Analysis

The TG and DTG thermogravimetric curves of biocomposite materials are shown in Figure 1a,b.
In the first step, the thermogravimetric curves of the two components that form the biocomposite material were analysed: polypropylene fibre and coir fibre. In the second step, the biocomposite materials were analysed, obtaining information about the degradation temperatures, mass losses, melting temperatures, crystallization temperatures, and the degree of crystallinity of the materials.
The TG diagram of the PP fibre shows that the maximum degradation of the fibre occurs in the temperature domain 358–469 °C, when there is a decrease in the sample mass of 98.14% (Figure 1a). The DTG diagram shows that the maximum degradation rate occurs at 442 °C (Figure 1b) [42].
The TG and DTG diagrams obtained for coir fibre confirm that the mass losses occur in three stages. The first stage comprises the temperature range between 51.4 °C and 103.52 °C (with a maximum at 70.47 °C). The peak at 70.47 °C can be attributed to the moisture loss from the cellulosic fibre. This is followed by an area in which the fibre degradation is very small, in the range of 103.52–213 °C, in which the mass losses are practically zero. This is the maximum temperature range in which coir fibre can be used.
The greatest degradation of coir fibre occurs in the second stage between 249 °C and 345 °C when the mass loss is very high. The steep peak at 328 °C is mainly associated with the degradation of lignin, an important component of coir fibre, and the peak at 280.1 °C can be assigned to the degradation of cellulose and hemicellulose [43,44,45,46,47]. Mass losses also occur in the third stage in the temperature range 345–608.39 °C (the peak of 457.87 °C can be assigned to the degradation of lignin, cellulose, and PP).
From the analysis of the TG and DTG curves of 75Co25PP biocomposite material consisting of 75% coir and 25% PP (Figure 1a,b), the following conclusions can be drawn:
  • In the first stage, in the temperature range between 48.86 °C and 91.67 °C, there is a loss of mass due to the removal of moisture from coir fibres (4.8%). The maximum degradation rate is recorded at a temperature of 64.71 °C.
  • In the second stage, for the temperature range between 250.19 °C and 342.26 °C the mass losses are higher, reaching a maximum value at the temperature of 278.07 °C, a temperature that can be attributed to cellulose and hemicellulose degradation. The peak at 328.31 °C is assigned to both the degradation of hemicellulose and cellulose and the degradation of PP fibres [48].
  • In the last temperature zone, between 391.99 °C and 477.66 °C, the maximum degradation rate is recorded at a temperature of 451 °C and corresponds both to the degradation of lignin and cellulose, but also to the degradation of PP.
From the analysis of TG and DTG diagrams of 50Co50PP biocomposite material results in the first stage, up to a temperature of 252 °C, the mass losses are very small because the coir fibres are completely covered by the polymeric matrix (PP). For temperatures higher than 252 °C, the mass losses increase, reaching a maximum value at a temperature of 277.07 °C, a temperature that corresponds to the degradation of hemicellulose, cellulose, and the beginning of lignin degradation. The second highest rate of degradation occurs at 329.97 °C and can be assigned to the degradation of cellulose, hemicellulose, and lignin. In the last stage, the degradation of lignin and PP from the biocomposite material continues. The maximum mass loss rate occurs at 460.38 °C.
In the case of 25Co75PP biocomposite materials, up to a temperature of 253 °C, the mass losses are very small. Above this temperature, the first changes in mass loss occur. In the first two stages, the mass losses are produced with a low rate of degradation and correspond to the temperatures of 268.20 °C and 330.29 °C, respectively. These can be assigned to the breakdown of hemicellulose and the degradation of cellulose. In the last stage, a higher degradation rate occurs in the temperature range between 411.29 °C and 483.49 °C (with the peak at 459.41 °C). These losses can be assigned to the degradation of cellulose, lignin, and PP.
As expected, the mass losses of biocomposites increase with increasing temperature (Table 3). Therefore, the weight loss and degradation temperature increase with decreasing coir fibre content. For mass losses of more than 15%, biocomposites with a coir fibre content of less than 50% have a higher temperature resistance compared to 100% PP fibres.

3.3. DSC Analysis

The DSC diagrams that indicate the behaviour in the heating and cooling process of coir fibres, polypropylene fibres, and biocomposite materials are presented in Figure 2a,b.
The DSC curve corresponding to the heating process of the coir fibre exhibits an endothermic peak around the temperature of 79.93 °C, attributed to the removal of the moisture from the fibre by evaporation. In the DSC plot, no clear endothermic point is observed for coir fibre due to the low moisture content of the fibre. These results are consistent with the small mass losses obtained by TG analyses (where mass losses are 2.5% according to Table 3). For temperatures higher than 79.93 °C, there are no changes in the heating process or in the cooling process on the analysed temperature range.
PP fibre has an endothermic peak in the temperature range from 153.68 °C to 171.69 °C, with a maximum at 164.74 °C. In the cooling process, the PP fibre shows an exothermic peak in the temperature range 116.95–105.75 °C, with a maximum at 112.15 °C.
The biocomposite material consisting of 25Co75PP has two endothermic peaks: the first located in the temperature range 26.57–77.22 °C, with a maximum at 70.13 °C which can be attributed to the elimination of humidity, and a second within the temperature range 153.2–171.33°C has a maximum temperature of 167.18 °C. In the cooling process, crystallization occurs in the temperature range 119.58–109.21 °C, with a maximum at 114.46 °C.
In the case of biocomposite materials made of 50Co50PP, two endothermic peaks appear. The first peak located in the temperature range 36.64–109.24 °C, with a maximum at 71.78 °C corresponding to the elimination of moisture from the analysed material, and a second peak between 154.74 °C and 171.48 °C, with a maximum at 166.99 °C corresponding to the melting of PP from the biocomposite material. In the cooling process, the exothermic peak appears in the temperature range 121.07–111.14 °C, with a maximum of crystallization at 116 °C.
The DSC diagrams of the 75Co25PP biocomposite materials show a process of removing moisture through an endothermic effect in the temperature range between 17.15 °C and 105.20 °C, with a maximum at 64.80 °C and a second endothermic process in the temperature range of 152.33–169.40 °C when PP melts (with a maximum at 165.28 °C). The cooling process followed by the crystallization of the biocomposite material takes place in the temperature range between 120.96 °C and 111.55 °C, with a maximum at 115.99 °C.
From the DSC diagrams corresponding to the cooling process (after the second heating), the crystallization enthalpy (∆HC) and the melting enthalpy (∆Hm) were determined. Using the Equation (1), the degree of crystallinity (χcomp) of the biocomposite materials was calculated. The obtained results are presented in Table 4.
The diagram of the cooling process shows an increase by about 3.5 °C of the crystallization temperature of biocomposites compared to the PP matrix (Figure 2b). These temperatures increase from 114.46 to 116 °C with the increase in coir fibre content. The obtained results are also in agreement with the decrease of the biocomposite global crystallinity as the coir fibre content increases. This can be explained by the reduction of the adhesion between the coir fibre and the PP matrix confirming that the coir fibres behaved as nucleating agents, and therefore, the PP in the biocomposite matrix began to crystallize at a temperature above 112.15 °C [49,50,51,52,53].
Figure 2a and Table 4 show that in comparison with the melting temperature of the PP matrix, during the heating process, the melting temperature of the biocomposite materials decreased slightly as the coir fibre content increased.
Analysing the values of melting enthalpies (ΔHm) of biocomposite materials, it can be concluded that their values are lower than those obtained for the PP matrix. This allows us to say that coir fibre causes a decrease in the value of the melting enthalpy of biocomposite materials, and therefore, their degree of crystallinity. A similar behaviour has been reported by other researchers [54,55].
This decrease in the melting temperature with the increase in the reinforcing agent content in the biocomposite material can be explained by the weak interactions between the PP fibre which has nonpolar groups and the coir fibre which is a hydrophilic lignocellulosic fibre. These behaviours are also confirmed by SEM images when determining the bending strength of biocomposites, it is observed that the PP matrix detaches from the coir fibres, thus confirming weak bonds at fibre–matrix interface.

3.4. ATR-FTIR Analysis
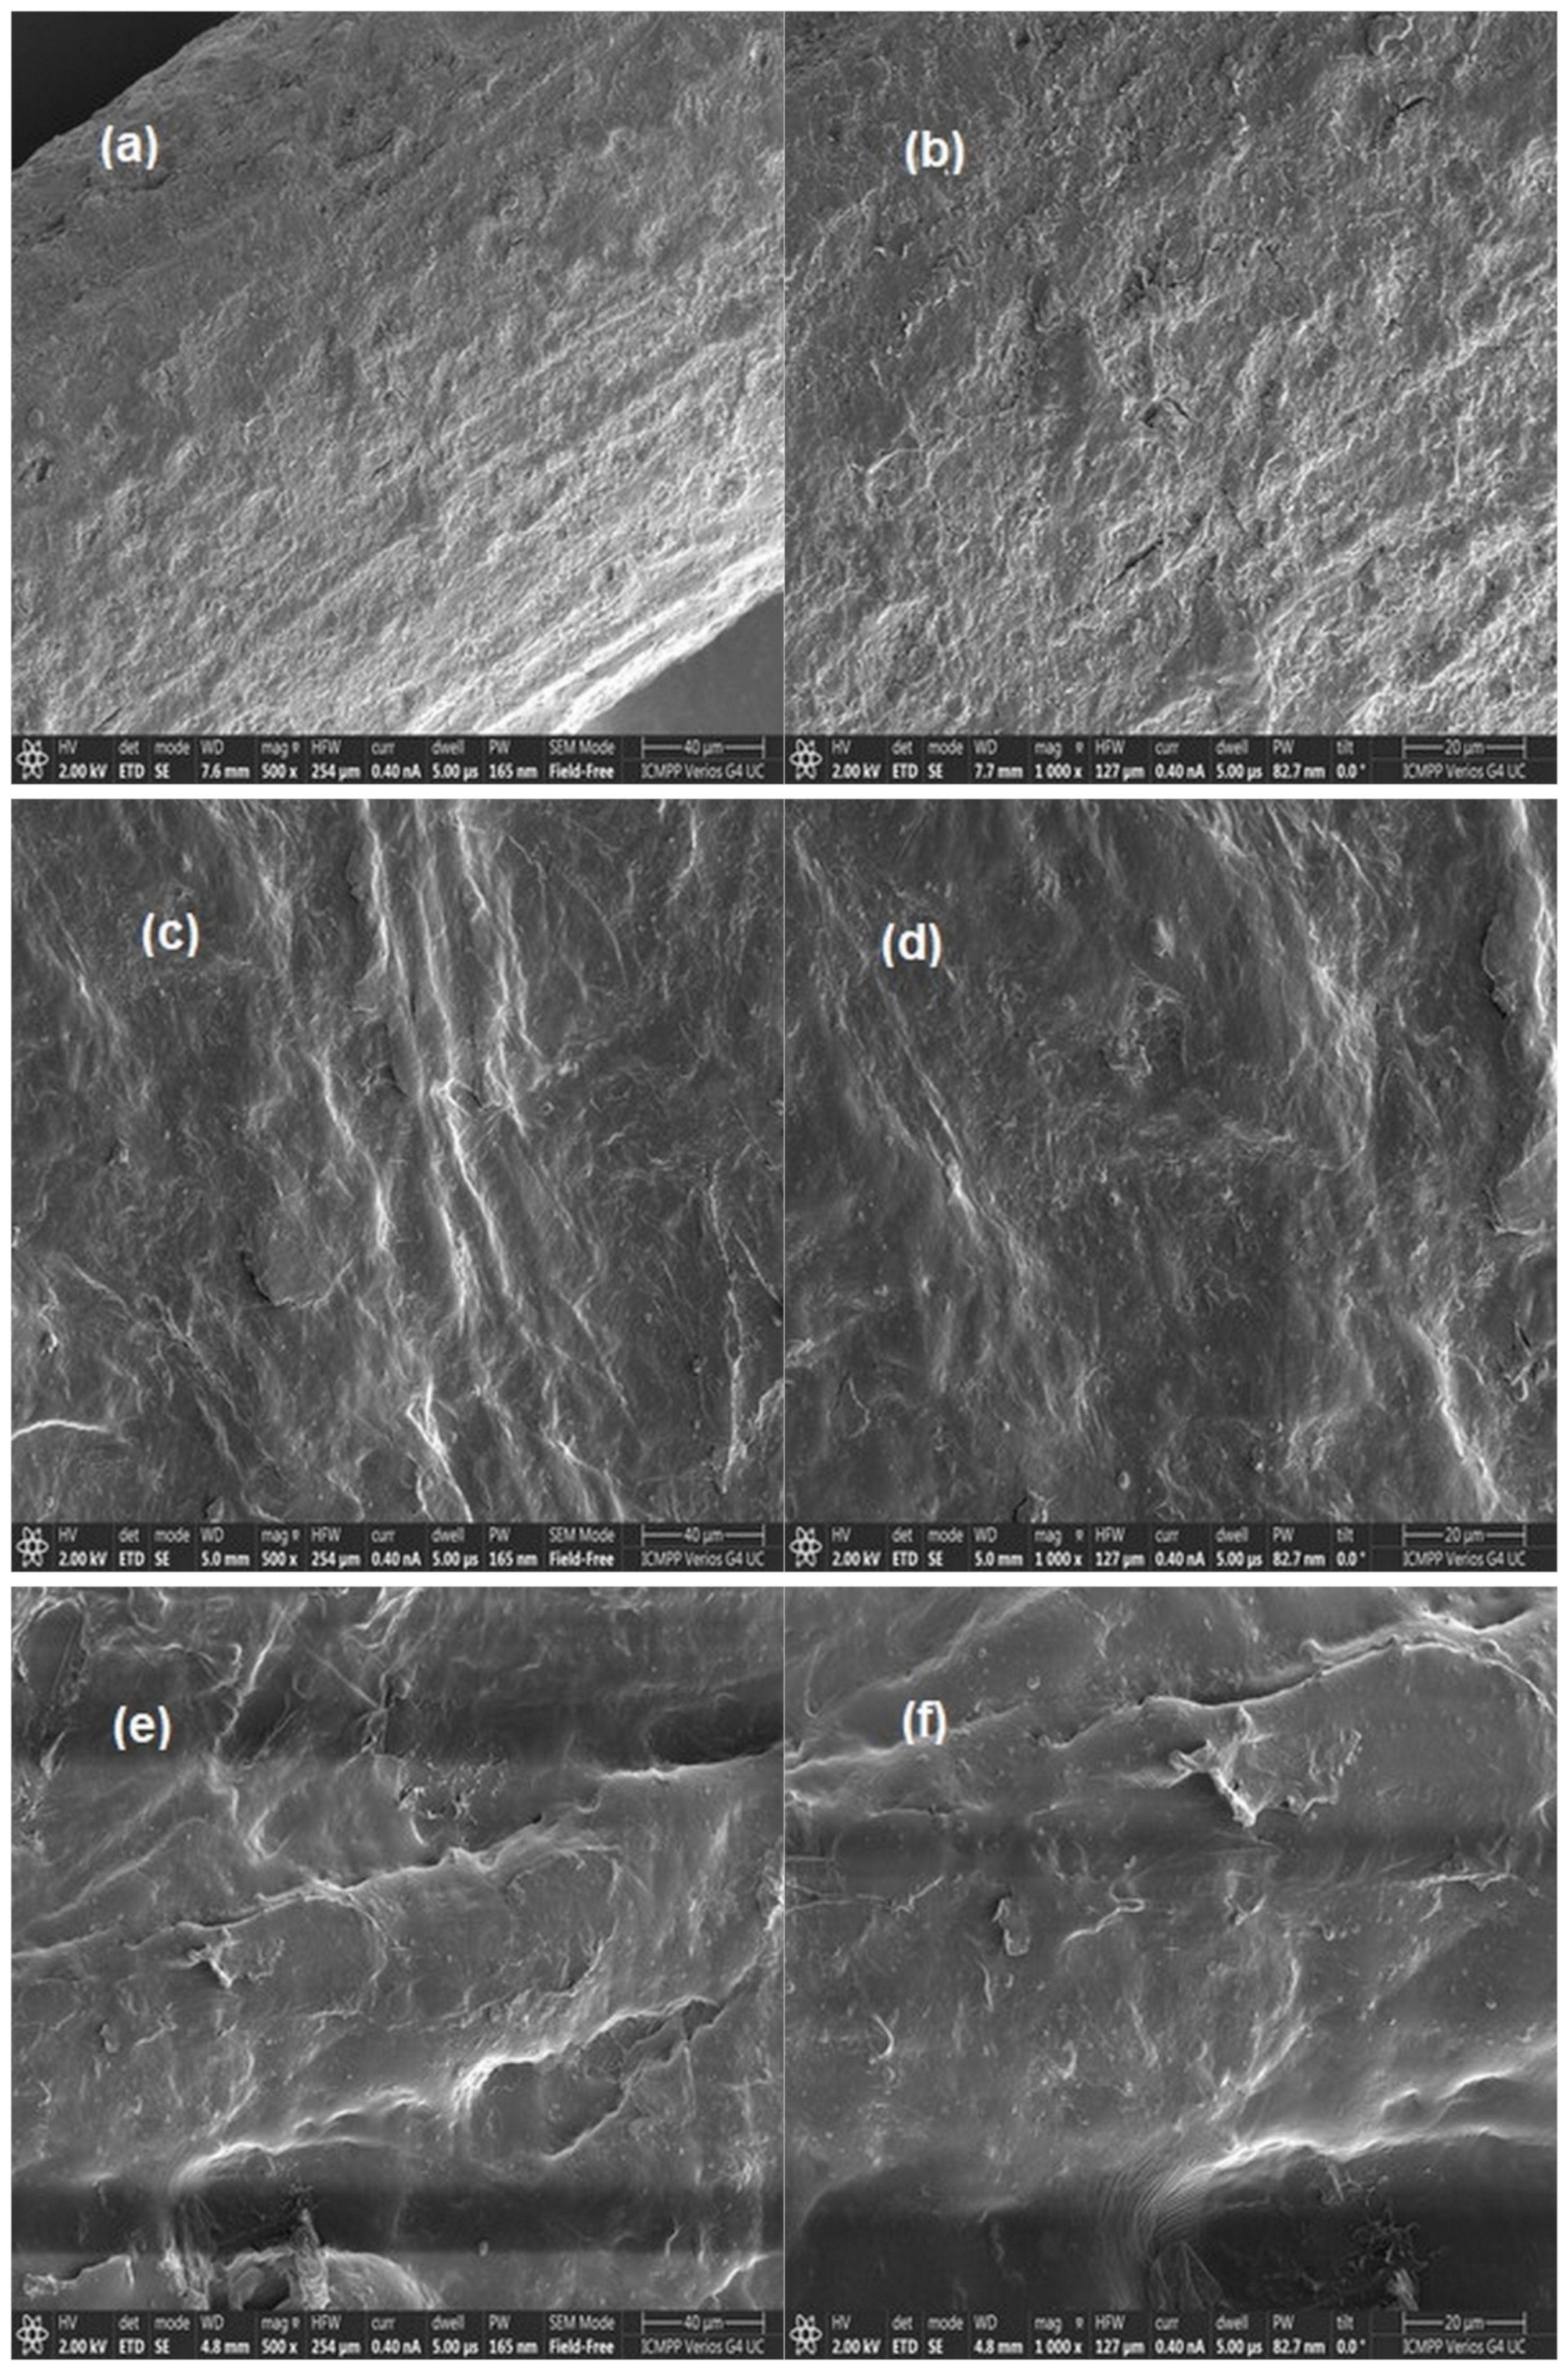
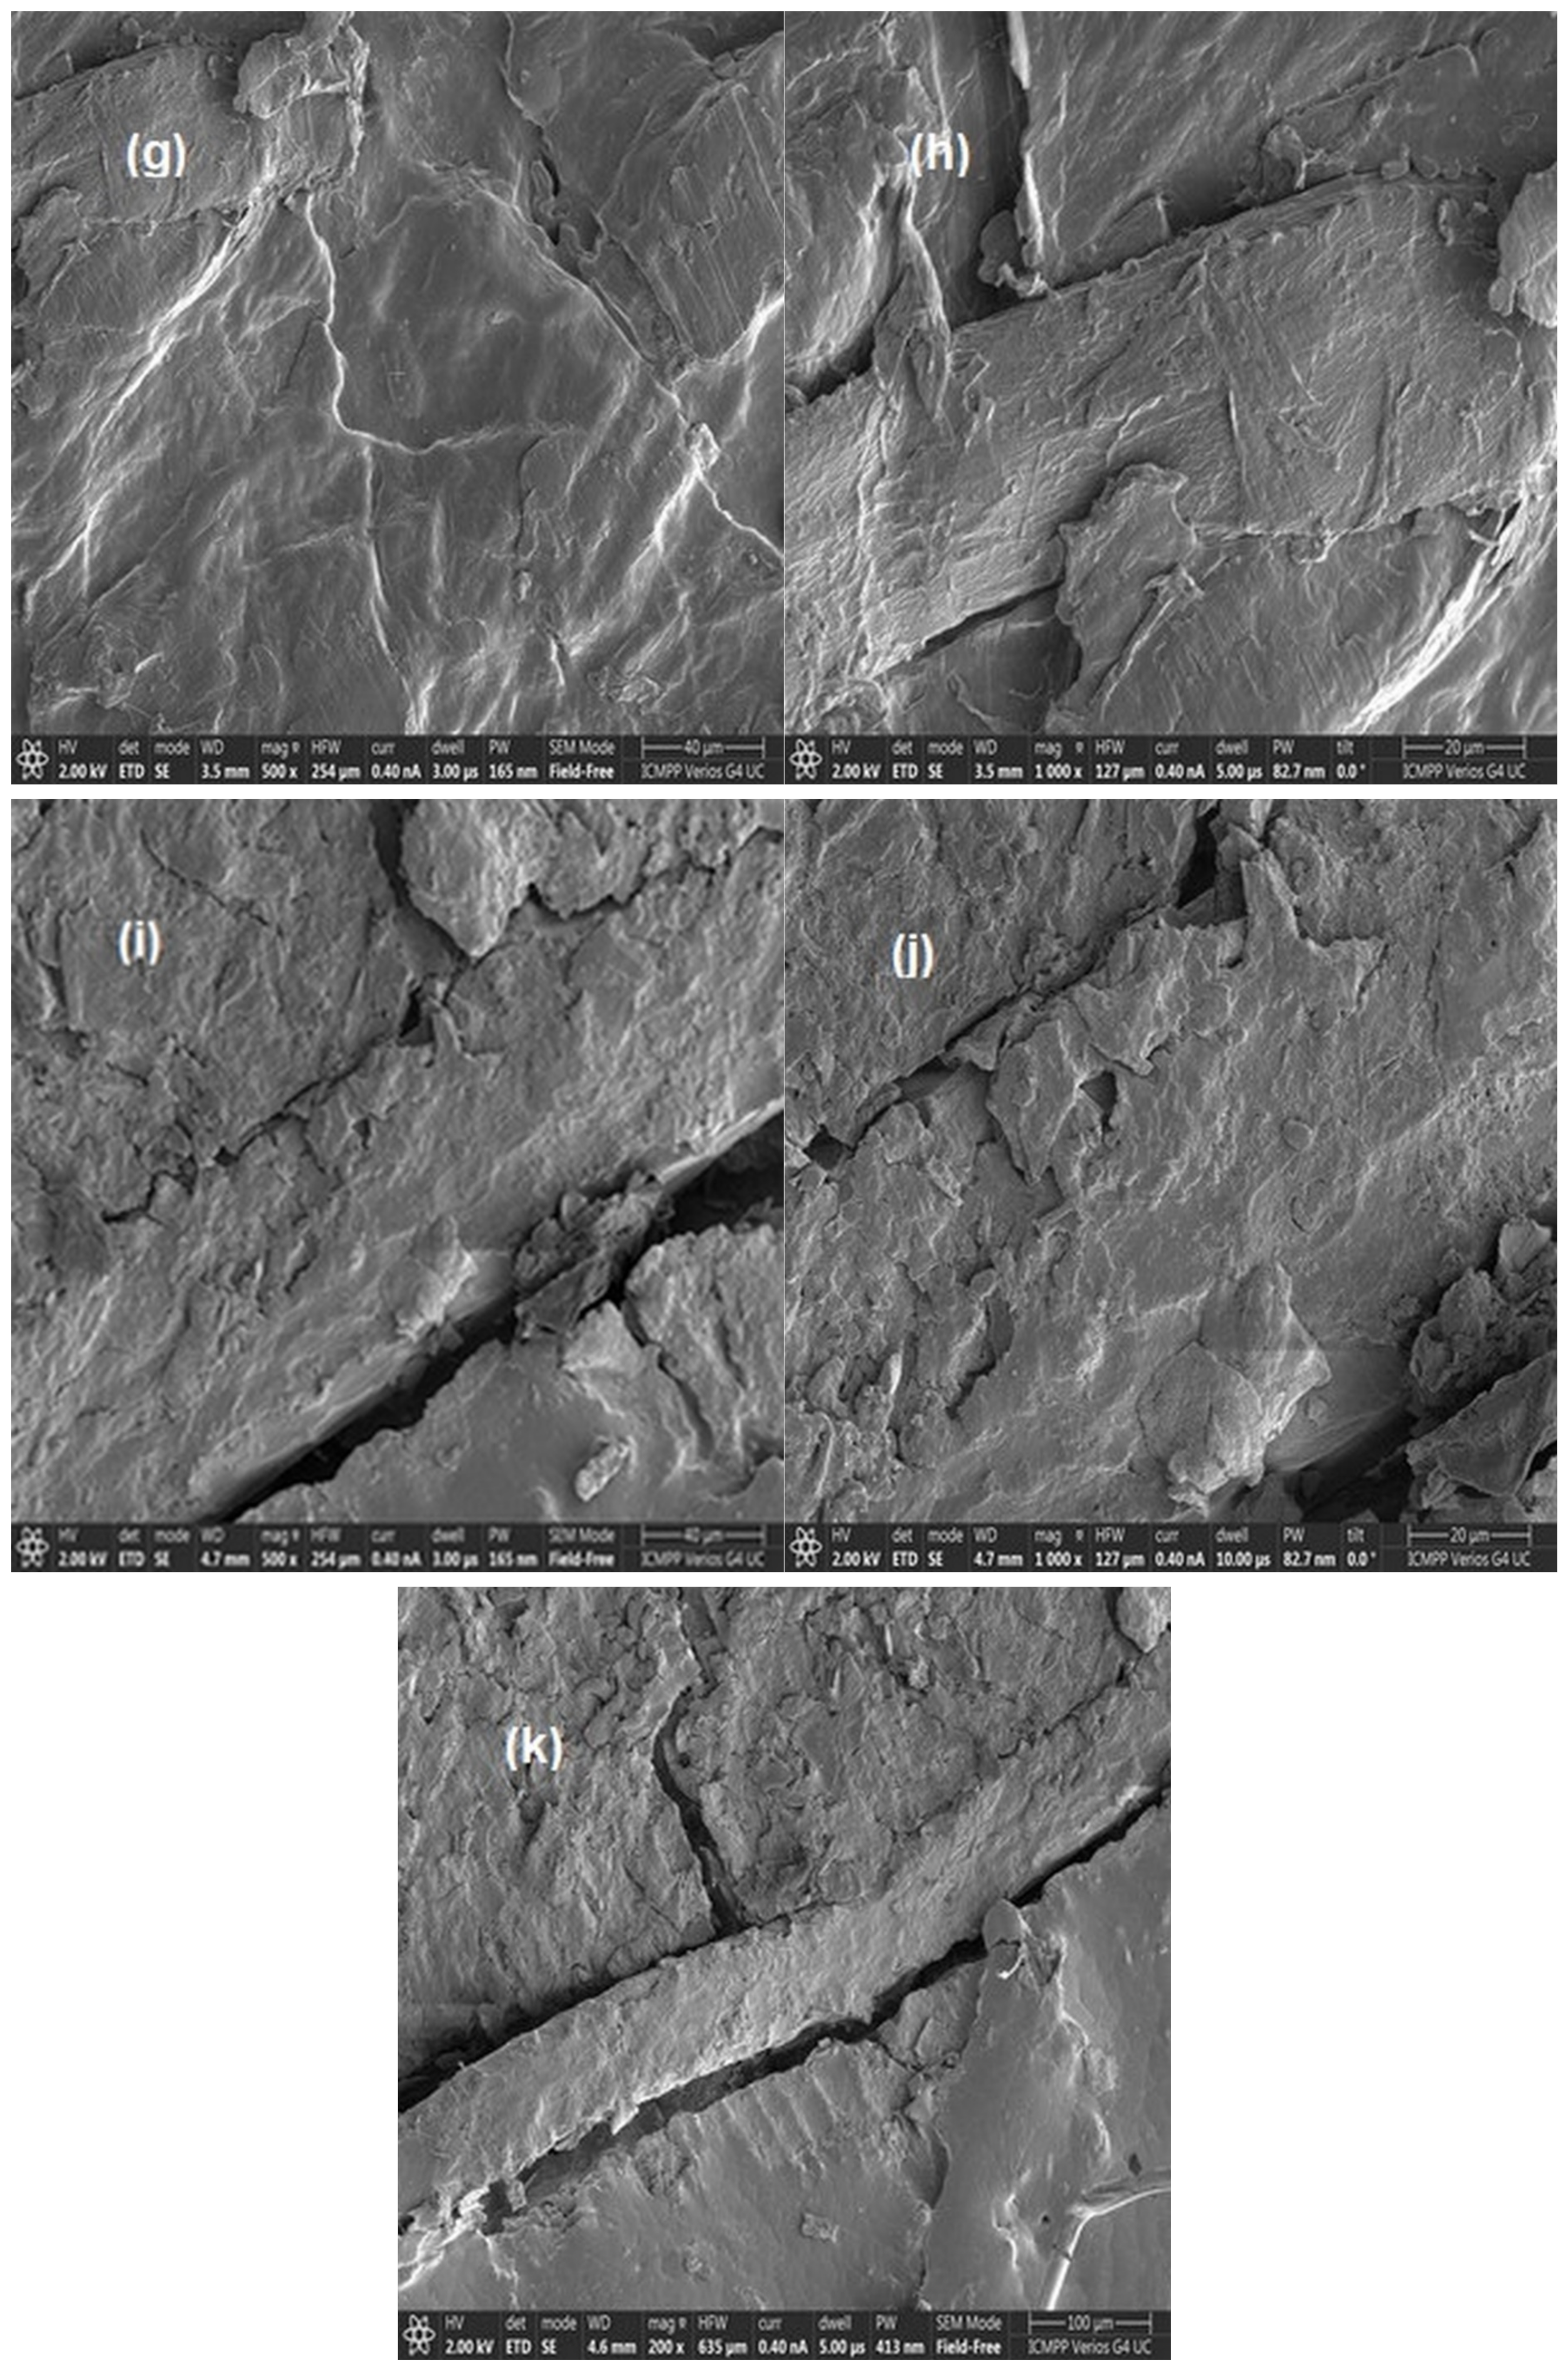
The ATR-FTIR spectra of coir fibres, polypropylene, and biocomposite materials are shown in Figure 3a–e.
The wide band between 3402 cm−1 and 3358 cm−1 is characteristic to the stretching vibrations of the –OH groups present in the cellulose and hemicellulose of the coir fibre. The peaks in the range 2957–2852 cm−1 in the FTIR spectra of coir fibre, polypropylene, and biocomposite materials can be attributed to both types of stretching vibrations (symmetrical and asymmetrical) of the C–H bonds in CH2 groups containing coir fibre and polypropylene fibre [56,57]. The peaks at 1724 cm−1 in the FTIR spectrum of coir fibre and at 1736 cm−1 in the FTIR spectrum of biocomposite materials can be attributed to the stretching vibrations of the C=O bonds of lignin, pectins, hemicelluloses, and wax present in the coir fibre. As the coir fibre content in the biocomposite materials decreased, the intensity of the peak also decreased [58].
Peaks occurring between 1649 cm−1 and 1605 cm−1 can be assigned to the stretching vibrations of the C=C bonds and the stretching vibrations of the C=O groups in lignin [59]. The peak recorded between 1460 cm−1 and 1456 cm−1 in the FTIR spectrum of PP and coir fibres, and in the FTIR spectra of biocomposite materials corresponds to the bending vibrations of the C–H bonds from the CH2 and CH3 groups of propylene and the CH2 groups of cellulose and lignin. The peak located at approximately 1375 cm−1 corresponds both to the stretching vibrations of the C–H bonds present in cellulose and hemicellulose, and to the asymmetric stretching vibrations of the C–H bonds in the CH2 and CH3 groups in polypropylene [60,61]. The peaks in the range 1261–1242 cm−1 are attributed to the tensile vibrations of the C–O bonds in the ether group and the stretching vibrations of the O–H groups in lignin. Peaks around 1100 cm−1 are attributed to asymmetric stretching vibrations of C–O–C and C–O bonds in cellulose, hemicellulose, and lignin [62]. The peak at 1167 cm−1 in the FTIR spectrum of polypropylene is attributed to the swing vibrations of the C–H bonds in the CH2 and CH3 groups [63].
The peak recorded at 1035 cm−1 in the FTIR spectrum of coir fibre and at 1045 cm−1 in the FTIR spectrum of biocomposites is attributed to the stretching vibrations of C–O bonds (C–O–C glycoside bonds in cellulose and hemicellulose, C–OH phenolic groups in lignin and, respectively, etheric C–O–C bonds in lignin) [64]. The decrease in peak intensity and the shift of the wavelength from 1035 cm−1 to 1045 cm−1 as the PP/coir ratio increases may be due to the steric hindrance that occurs by increasing the amount of PP in the composites. The peak around 898 cm−1 is due to symmetrical stretching vibrations of β–glycosidic bonds in cellulose and hemicellulose [65]. The presence of peaks located at 728–725 cm−1 is related to the bending vibrations outside the plane of the C-H bonds in the aromatic ring [66,67].

3.5. SEM Analysis

The PP matrix, coir fibre and biocomposite materials were analysed morphologically. Images were taken at 200×, 500×, and 1000× magnitudes (Figure 4a–k).
The SEM analysis shows that the coir fibre has a diameter of about 160 μm, and a rough surface that results in a rougher topography of the surface (Figure 4a,b). This surface can have an advantage that can provide increased adhesion to the PP matrix and also a mechanical interlocking of the polymer in the fibre. The PP matrix has a specifically compact, homogeneous structure (Figure 4c,d). SEM images on the 100% PP matrix show that the surface is smooth and the polymer forms a continuous film [68].
From a morphological point of view, a good adhesion between the components presupposes a compact structure, in which the reinforcing agent is evenly distributed in the matrix. Figure 4e,j show the SEM images of the obtained biocomposite materials, respectively, the effect of the coir fibre content on the morphology of the Co–PP biocomposites. For a composition of 25–50% coir, it can be seen that the fibres are well-embedded in the PP matrix. When the coir fibre content increases to 75%, fibres that are not well-incorporated into the matrix can be noticed. Thus, the SEM images provide an explanation for the decreasing trend of the tensile strength. Additionally, from the SEM analyses, it can be seen that with the increase in the coir fibre content, the degree of coverage of the fibres with the PP matrix decreases. Thus, the 25Co75PP biocomposite material shows a total degree of fibre coverage, while the 75Co25PP biocomposite presents a series of holes (cavities), which confirm the above statement.
When determining the bending strength of biocomposites, it was observed that the PP matrix detached from the coir fibres, thus confirming weak bonds between the reinforcements and the matrix (Figure 4k).

3.6. Chromatic Measurements

In the process of obtaining composite materials, a series of products are used such as matrices, reinforcing agents and various other products with a role of compatibilizing agents, fillers, etc. The manufacturing process of biocomposite materials changes the colour of the initial mixture. As a result of temperature and pressure, the PP matrix melted and spread throughout the coir fibre mass. These substances can be coloured or colourless. Finally, the obtained composite material may have a certain colour. Depending on the final destination of the composite material, certain colours are required. These can be standardized, and depending on the conditions of obtaining a series of standards, a well-established colour can be elaborated. In this sense, in the present paper, a series of chromatic measurements were performed in order to assess the obtained biocomposite materials on the entire visible spectrum by determining the colour intensity (K/S). The results are shown graphically in Figure 5.
The chromatic characteristics of the biocomposites were influenced by the ratio between the coir fibre and the matrix. In all the analysed variants, the colour intensity of the biocomposites increased with the increase in the content of coir fibre which has a slightly brown colour.

4. Conclusions

The conducted research led to the following conclusions:
  • Coir fibre-reinforced polypropylene biocomposite materials were obtained in various reinforcement agent–matrix mixing ratios.
  • The tensile and bending strength of biocomposites decreased when the coir fibre content increased due to the weak bonds from the fibre–matrix interface.
  • The analysis of the TG and DTG diagrams showed that the mass losses of biocomposite materials increased with increasing temperature. Moreover, for the same mass loss, the degradation temperature increases with increasing coir content. For mass losses greater than 15%, the biocomposite materials with a maximum coir fibre content of 50% had a higher temperature resistance compared to the 100% PP fibres.
  • The DSC diagrams confirmed that the values of melting enthalpies (ΔHm) of biocomposites are lower than those obtained for the PP matrix and therefore, a decrease in the overall crystallinity of the biocomposites with increasing coir fibre content was registered.
  • The FTIR spectra confirmed the presence of the two fibres and the changes that occur with the variation of the ratio between the two components used to obtain the studied biocomposites. From the analysis of SEM microelectrophotographs, it has been observed that with the increase of coir fibre content the degree of coverage of fibres with PP matrix decreased, so for 25Co75PP biocomposites, it appeared as a total coverage, while for 75Co25PP biocomposites, a series of holes appeared which confirms the above statement.
  • From the analysis of the spectra, the colour intensity of the samples increased with the increase in the content of coir fibres which have a slightly brown colour.
  • Due to its properties and low cost, coconut fibres are increasingly used to obtain composite materials containing thermoplastic polymer matrices.
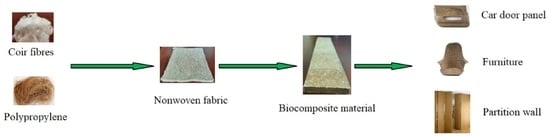
  • The biocomposite materials obtained from pp fibres and coconut fibres can be used in various fields such as the furniture industry, cars, constructions, etc.

Author Contributions

All authors contributed to the research presented in this work. Their contributions are presented below. Conceptualisation, methodology, investigation, M.I., L.S., I.F. and E.I.M.; formal analysis and data curation, L.S., M.I., G.L. and E.I.M.; writing—original draft preparation, M.I., L.S. and E.I.M.; funding, I.F.; project administration, I.F., writing—review and editing, M.I. and E.I.M. All authors have read and agreed to the published version of the manuscript.

Funding

The publication fees were financed from the Fund for University Scientific Research (FCSU)-2022 of Gheorghe Asachi Technical University of Iasi, Romania.

Institutional Review Board Statement

Not applicable.

Informed Consent Statement

Not applicable.

Data Availability Statement

All data are included in the published article.

Acknowledgments

This work has been developed within the framework of COP Project No. 267/22.06.2020, MySMIS 121434—“Creating a center of excellence in the field of composite material at SC TAPARO SA”, funded by the European Union via the European Regional Development Fund and Romanian Government.

Conflicts of Interest

The authors declare no conflict of interest.

References

  1. Zwawi, M. A Review on Natural Fiber Bio-Composites, Surface Modifications and Applications. Molecules 2021, 26, 404. [Google Scholar] [CrossRef] [PubMed]
  2. Manu, T.; Nazmi, A.R.; Shahri, B.; Emerson, N.; Huber, T. Biocomposites: A Review of Materials and Perception. Mater. Today Commun. 2022, 31, 103308. [Google Scholar] [CrossRef]
  3. Abdulkhani, A.; Echresh, Z.; Allahdadi, M. Chapter 15. Effect of nanofibers on the structure and properties of biocomposites. In Micro and Nano Technologies, Fiber-Reinforced Nanocomposites: Fundamentals and Applications; Han, B., Sharma, S., Nguyen, T.A., Longbiao, L., Subrahmanya Bhat, K., Eds.; Elsevier: Amsterdam, The Netherlands, 2020; pp. 321–357. [Google Scholar] [CrossRef]
  4. Shanmugam, V.; Mensah, R.A.; Försth, M.; Sas, G.; Restás, A.; Addy, C.; Xu, Q.; Jiang, L.; Neisiany, R.E.; Singha, S.; et al. Circular economy in biocomposite development: State-of-the-art, challenges and emerging trends. Compos. Part C Open Access 2021, 5, 100138. [Google Scholar] [CrossRef]
  5. Edebali, S. Methods of engineering of biopolymers and biocomposites. In Advanced Green Materials; Shakeel, A., Ed.; Woodhead Publishing: Cambridge, UK, 2021; pp. 351–357. ISBN 9780128199886. [Google Scholar] [CrossRef]
  6. Christian, S.J. Natural fibre-reinforced noncementitious composites (biocomposites). In Nonconventional and Vernacular Construction Materials; Harries, K.A., Sharma, B., Eds.; Woodhead Publishing: Cambridge, UK, 2016; pp. 111–126. ISBN 9780081008713. [Google Scholar] [CrossRef]
  7. Andrew, J.J.; Dhakal, H.N. Sustainable biobased composites for advanced applications: Recent trends and future opportunities—A critical review. Compos. Part C Open Access 2022, 7, 100220. [Google Scholar] [CrossRef]
  8. Drzal, L.T.; Mohanty, A.K.; Misra, M. Bio-composite materials as alternatives to petroleum-based composites for automotive applications. Magnesium 2001, 40, 1–3. [Google Scholar]
  9. Jawaid, M.; Sapuan, S.M.; Alothman, O.Y. Green Biocomposites: Manufacturing and Properties; Springer: Cham, Switzerland, 2016. [Google Scholar] [CrossRef]
  10. Chisholm, H. Encyclopædia Britannica 6, 11th ed.; Cambridge University Press: Cambridge, UK, 1911; p. 654. [Google Scholar]
  11. Yan, Y. Developments in fibers for technical nonwovens. In Advances in Technical Nonwovens; Kellie, G., Ed.; Woodhead Publishing: Cambridge, UK, 2016; pp. 19–96. ISBN 9780081005750. [Google Scholar] [CrossRef]
  12. Bongarde, U.S.; Khot, B.K. A Review on Coir Fiber Reinforced Polymer Composite. Int. Res. J. Eng. Technol. 2019, 6, 793–795. [Google Scholar]
  13. Goyat, V.; Ghangas, G.; Sirohi, S.; Kumar, A.; Nain, J. A review on mechanical properties of coir based composites. Mater. Today Proc. 2022, 62, 1738–1745. [Google Scholar] [CrossRef]
  14. Mohanty, A.K.; Misra, M.; Drzal, L.T. Natural Fibers, Biopolymers and Biocomposites; Taylor & Francis: Boca Ranton, FL, USA, 2005; p. 875. [Google Scholar]
  15. Adeniyi, A.G.; Onifade, D.V.; Ighalo, J.; Adeoye, A.S. A review of coir fiber reinforced polymer composites. Compos. B Eng. 2019, 176, 107305. [Google Scholar] [CrossRef]
  16. Hasan, K.M.F.; Horváth, P.G.; Kóczán, Z.; Alpár, T. Thermo-mechanical properties of pretreated coir fiber and fibrous chips reinforced multilayered composites. Sci. Rep. 2021, 11, 3618. [Google Scholar] [CrossRef]
  17. Siakeng, R.; Jawaid, M.; Asim, M.; Saba, N.; Sanjay, M.R.; Siengchin, S.; Fouad, H. Alkali treated coir/pineapple leaf fibres reinforced PLA hybrid composites: Evaluation of mechanical, morphological, thermal and physical properties. Express Polym. Lett. 2020, 14, 717–730. [Google Scholar] [CrossRef]
  18. Guerrica-Echevarria, G.; Eguiazábal, J.; Nazábal, J. Effects of reprocessing conditions on the properties of unfilled and talc-filled polypropylene. Polym. Degrad. Stab. 1996, 53, 1–8. [Google Scholar] [CrossRef]
  19. Bourmaud, A.; Baley, C. Investigations on the recycling of hemp and sisal fibre reinforced polypropylene composites. Polym. Degrad. Stab. 2007, 92, 1034–1045. [Google Scholar] [CrossRef]
  20. Bourmaud, A.; Le Duigou, A.; Baley, C. What is the technical and environmental interest in reusing a recycled polypropylene—hemp fibrecomposite? Polym. Degrad. Stab. 2011, 96, 1732–1739. [Google Scholar] [CrossRef]
  21. Ichim, M.; Ailenei, E.C.; Sava, C.; Filip, I.; Cionca, I.; Stelea, L. Investigations on the Recycling of Polypropylene Matrix Composites Reinforced with Hemp Fibres. In Proceedings of the 7th International Symposium “Technical Textiles—Present and Future”, Iași, Romania, 12 November 2021; Sciendo: Warsaw, Poland, 2022; pp. 149–154, ISBN 978-83-66675-73-5. [Google Scholar] [CrossRef]
  22. Mukhopadhyay, S. Natural and synthetic fibres for composite nonwovens. In Composite Nonwoven Materials: Structure, Properties and Applications; Das, D., Pourdeyhimi, B., Eds.; Woodhead Publishing Limited: Cambridge, UK, 2014; pp. 20–29. [Google Scholar] [CrossRef]
  23. Samuel, O.D.; Agbo, S.; Adekanye, T.A. Assessing Mechanical Properties of Natural Fibre Reinforced Composites for Engineering Applications. J. Miner. Mater. Charact. Eng. 2012, 11, 780–784. [Google Scholar] [CrossRef]
  24. Hassan, T.; Jamshaid, H.; Mishra, R.; Khan, M.Q.; Petru, M.; Novak, J.; Choteborsky, R.; Hromasova, M. Acoustic, Mechanical and Thermal Properties of Green Composites Reinforced with Natural Fibers Waste. Polymers 2020, 12, 654. [Google Scholar] [CrossRef] [Green Version]
  25. Naik, M.K. Coconut fiber reinforced polymer composite for partition wall. Int. J. Adv. Res. Ideas Innov. Technol. 2018, 4, 607–611. [Google Scholar]
  26. Ayrilmis, N.; Jarusombuti, S.; Fueangvivat, V.; Bauchongkol, P.; White, R.H. Coir fiber reinforced polypropylene composite panel for automotive interior applications. Fibers Polym. 2011, 12, 919–926. [Google Scholar] [CrossRef]
  27. Gelfuso, M.V.; da Silva, P.V.G.; Thomazini, D. Polypropylene matrix composites reinforced with coconut fibers. Mater. Res. 2011, 14, 360–365. [Google Scholar] [CrossRef]
  28. Kumar, S.; Shamprasad, M.S.; Varadarajan, Y.S.; Sangamesha, M.A. Coconut coir fiber reinforced polypropylene composites: Investigation on fracture toughness and mechanical properties. Mater. Today Proc. 2021, 46, 2471–2476. [Google Scholar] [CrossRef]
  29. Naveen, P.N.E.; Dharma Raju, T. Evaluation of Mechanical Properties of Coconut Coir Fiber Reinforced Polymer Matrix Composites. J. Nano Res. 2013, 24, 34–45. [Google Scholar] [CrossRef]
  30. Hasan, M.; Hoque, M.E.; Mir, S.S.; Saba, N.; Sapuan, S. Manufacturing of Coir Fibre-Reinforced Polymer Composites by Hot Compression Technique. In Manufacturing of Natural Fibre Reinforced Polymer Composites, 1st ed.; Sapuan, S.M., Jawaid, M., Yusoff, N., EnamulHoque, M., Eds.; Springer: Cham, Switzerland, 2015; pp. 309–328. [Google Scholar] [CrossRef]
  31. Obele, C.; Ishidi, E. Mechanical Properties of Coir Fiber Reinforced Epoxy Resin Composites for Helmet Shell. Ind. Eng. Lett. 2015, 5, 67–73. [Google Scholar]
  32. Kumar, S.; Deka, K.; Suresh, P. Mechanical Properties of Coconut Fiber Reinforced Epoxy Polymer Composites. Int. Res. J. Eng. Technol. 2016, 3, 1334–1336. [Google Scholar]
  33. Pani, D.; Mishra, P. Analysis of Mechanical Properties of Coir composites with varied compositions. Int. J. Mater. Sci. Technol. 2019, 9, 2249–3077. [Google Scholar]
  34. Nam, T.H.; Ogihara, S.; Kobayashi, S. Interfacial, Mechanical and Thermal Properties of Coir Fiber-Reinforced Poly(Lactic Acid) Biodegradable Composites. Adv. Compos. Mater. 2012, 21, 103–122. [Google Scholar] [CrossRef]
  35. Mittal, M.; Chaudhary, R. Effect of fiber content on thermal behavior and viscoelastic properties of PALF/Epoxy and COIR/Epoxy composites. Mater. Res. Express 2018, 5, 125305. [Google Scholar] [CrossRef]
  36. Ball, P. Manufacturing Processes. In Handbook of Polymer Composites for Engineers; Hollaway, L., Ed.; Woodhead Publishing Limited: Cambridge, UK, 1994; pp. 73–94. [Google Scholar]
  37. Salazar-Cru, B.A.; Chávez-Cinco, M.I.; Morales-Cepeda, A.B.; Ramos-Galván, C.E.; Rivera-Armenta, J.L. Evaluation of Thermal Properties of Composites Prepared from Pistachio Shell Particles Treated Chemically and Polypropylene. Molecules 2022, 27, 426. [Google Scholar] [CrossRef]
  38. Ingamells, W. Colour for Textiles: A User’s Handbook; Society of Dyers and Colourists: Bradford, UK, 1993; p. 154. ISBN1 0901956562. ISBN2 9780901956569. [Google Scholar]
  39. Bledzki, A.K.; Gassan, J. Composites reinforced with cellulose based fibres. Prog. Polym. Sci. 1999, 24, 221–274. [Google Scholar] [CrossRef]
  40. Schirp, A.; Stender, J. Properties of extruded wood-plastic composites based on refiner wood fibres (TMP fibres) and hemp fibres. Eur. J. Wood Wood Prod. 2010, 68, 219. [Google Scholar] [CrossRef] [Green Version]
  41. Nourbakhsh, A.; Ashori, A. Highly Fiber-Loaded Composites: Physical and Mechanical Properties. Polym. Polym. Compos. 2008, 16, 283–287. [Google Scholar] [CrossRef]
  42. Stelea, L.; Filip, I.; Lisa, G.; Ichim, M.; Drobotă, M.; Sava, C.; Mureșan, A. Characterisation of Hemp Fibres Reinforced Composites Using Thermoplastic Polymers as Matrices. Polymers 2022, 14, 481. [Google Scholar] [CrossRef]
  43. Nguyen, T.; Zavarin, E.; Barral, E.M. Thermal Analysis of Lignocellulosic Materials. J. Macromol. Sci.-Part C 1981, 20, 1–65. [Google Scholar] [CrossRef]
  44. Mohanty, A.K.; Patnaik, S.; Singh, B.C.; Misra, M. Graft copolymerization of acrylonitrile onto acetylated jute fibers. J. Appl. Polym. Sci. 1989, 37, 1171–1181. [Google Scholar] [CrossRef]
  45. Sabaa, M.W. Thermal degradation behaviour of sisal fibers grafted with various vinyl monomers. Polym. Degrad. Stab. 1991, 32, 209–217. [Google Scholar] [CrossRef]
  46. Yap, M.G.S.; Que, Y.T.; Chia, L.H.L.; Chan, H.S.O. Thermal properties of tropical wood–polymer composites. J. Appl. Polym. Sci. 1991, 43, 2057–2065. [Google Scholar] [CrossRef]
  47. Santafé, H.P., Jr.; Rodriguez, R.J.; Monteiro, S.N.; Castillo, T.E. Characterization of thermogravimetric behavior of polyester composites reinforced with coir fiber. In Proceedings of the Characterization of Minerals, Metals and Materials Symposium—TMS 2011, Annual Conference, San Diego, CA, USA, 27 February–3 March 2011; pp. 1–6. [Google Scholar]
  48. Sergio, N.M.; Calado, V.; Ruben, J.S.R.; Frederico, M.M. Thermogravimetric behavior of natural fibres reinforced polymer compozites—An overview. Mater. Sci. Eng. A 2012, 557, 17–28. [Google Scholar]
  49. Mark, H.F.; Bikales, N.M.; Overberger, C.G.; Menges, G. Encyclopedia of Polymer Science and Engineering; John Wiley & Sons: New York, NY, USA, 1988; Volume 14. [Google Scholar]
  50. Anderson, K.S.; Hillmyer, M.A. Melt preparation and nucleation efficiency of polylactide stereocomplex crystallites. Polymer 2006, 47, 2030–2035. [Google Scholar] [CrossRef]
  51. Xu, H.; Liu, C.Y.; Chen, C.; Hsiao, B.S.; Zhong, G.J.; Li, Z.M. Easy alignment and effective nucleation activity of ramie fibers in injection-molded poly(lactic acid) biocompozites. Biopolymers 2012, 97, 825–839. [Google Scholar] [CrossRef]
  52. Naruedee, P.; Amnouy, L. Wollastonite and talc reinforced polypropylene hybrid compozites: Mechanical, morphological and thermal properties. J. Met. Mater. Miner. 2021, 31, 92–99. [Google Scholar]
  53. Lee, L.-T.; Tseng, H.-Y.; Wu, T.-Y. Crystallization Behaviors of Composites Comprising Biodegradable Polyester and Functional Nucleation Agent. Crystals 2021, 11, 1260. [Google Scholar] [CrossRef]
  54. Techawinyutham, L.; Frick, A.; Siengchin, S. Polypropylene/Maleic Anhydride Grafted Polypropylene (MAgPP)/Coconut Fiber Composites. Adv. Mech. Eng. 2016, 8, 1687814016645446. [Google Scholar] [CrossRef] [Green Version]
  55. Karsli, N.G.; Aytac, A. Effects of maleated polypropylene on the morphology, thermal and mechanical properties of short carbon fiber reinforced polypropylene composites. Mater. Des. 2011, 32, 4069–4073. [Google Scholar] [CrossRef]
  56. Hasan, K.M.F.; Horváth, P.G.; Bak, M.; Alpár, T. A state-of-the-art review on coir fiber-reinforced biocomposites. RSC Adv. 2021, 11, 10548–10571. [Google Scholar] [CrossRef] [PubMed]
  57. Jung, M.R.; Horgen, F.D.; Orski, S.V.; Rodriguez, V.; Beers, K.L.; Balazs, G.H.; Jones, T.T.; Work, T.M.; Brignac, K.C.; Royer, S.-J.; et al. Validation of ATR FT-IR to identify polymers of plastic marine debris, including those ingested by marine organisms. Mar. Pollut. Bull. 2018, 127, 704–716. [Google Scholar] [CrossRef] [PubMed]
  58. Mir, S.S.; Hasan, S.M.N.; Hossain, J.; Hasan, M. Chemical Modification Effect on the Mechanical Properties of Coir Fiber. Eng. J. 2012, 16, 73–84. [Google Scholar] [CrossRef]
  59. Moosavinejad, S.M.; Madhoushi, M.; Vakili, M.; Rasouli, D. Evaluation of degradation in chemical compounds of wood in historical buildings using FT-IR and FT-Raman vibrational spectroscopy. Maderas Cienc. Tecnol. 2019, 21, 381–392. [Google Scholar] [CrossRef]
  60. Shi, J.; Xing, D.; Lia, J. FTIR Studies of the Changes in Wood Chemistry from Wood Forming Tissue under Inclined Treatment. Energy Procedia 2012, 16, 758–762. [Google Scholar] [CrossRef]
  61. Nandiyanto, A.B.D.; Oktiani, R.; Ragadhita, R. How to Read and Interpret FTIR Spectroscope of Organic Material. Indones. J. Sci. Technol. 2019, 4, 97–118. [Google Scholar] [CrossRef]
  62. Traoré, M.; Kaal, J.; Martínez Cortizas, A. Differentiation between pine woods according to species and growing location using FTIR-ATR. Wood Sci. Technol. 2018, 52, 487–504. [Google Scholar] [CrossRef]
  63. Fang, J.; Zhang, L.; Sutton, D.; Wang, X.; Lin, T. Needleless Melt-Electrospinning of Polypropylene Nanofibres. J. Nanomater. 2012, 2012, 382639. [Google Scholar] [CrossRef]
  64. Javier-Astete, R.; Jimenez-Davalos, J.; Zolla, G. Determination of hemicellulose, cellulose, holocellulose and lignin content using FTIR in Calycophyllum spruceanum (Benth.) K. Schum. and Guazuma crinita Lam. PLoS ONE 2021, 16, e0256559. [Google Scholar] [CrossRef]
  65. Célino, A.; Gonçalves, O.; Jacquemin, F.; Fréour, S. Qualitative and quantitative assessment of water sorption in natural fibres using ATR-FTIR spectroscopy. Carbohydr. Polym. 2014, 101, 163–170. [Google Scholar] [CrossRef] [PubMed]
  66. Annandarajah, C.; Li, P.; Michel, M.; Chen, Y.; Jamshidi, R.; Kiziltas, A.; Hoch, R.; Grewell, D.; Montazami, R. Study of Agave Fiber-Reinforced Biocomposite Films. Materials 2019, 12, 99. [Google Scholar] [CrossRef] [PubMed]
  67. Chércoles Asensio, R.; San Andrés Moya, M.; de la Roja, J.M.; Gómez, M. Analytical characterization of polymers used in conservation and restoration by ATR-FTIR spectroscopy. Anal. Bioanal. Chem. 2009, 395, 2081–2096. [Google Scholar] [CrossRef]
  68. Pisanu, L.; Barbosa, J.; Souza, R.; Nascimento, M. Evaluating the influence of coupling agents in the structural properties of polypropylene coconut fiber compozites. Mater. Res. Express 2019, 6, 115320. [Google Scholar] [CrossRef]
Figure 1. TG curves (a) and DTG curves (b) for coir fibres, polypropylene, and biocomposite materials.
Crystals 12 01249 g001
Figure 2. DSC (heating process) curves (a) and DSC (cooling process) curves (b) for coir fibres, polypropylene, and biocomposite materials.
Crystals 12 01249 g002
Figure 3. ATR-FTIR spectra of (a) 100Co; (b) 75Co25PP; (c) 50Co50PP; (d) 25Co75PP; and (e) 100PP.
Crystals 12 01249 g003
Figure 4. SEM images of (a,b) coir fibres; (c,d) polypropylene; (e,f) 25Co75PP; (g,h) 50Co50PP; (ik) 75Co25PP.
Crystals 12 01249 g004aCrystals 12 01249 g004b
Figure 5. Spectral curves of colour intensity variation of biocomposite materials obtained from polypropylene and coir fibres on the visible range.
Crystals 12 01249 g005
Table 1. Experimental variants.
Blend Variant Code
100% Polypropylene100PP
25% Coir fibres/75% Polypropylene25Co75PP
50% Coir fibres/50% Polypropylene50Co50PP
75% Coir fibres/25% Polypropylene75Co25PP
100% Coir fibres100Co
Table 2. Mechanical characteristics of coir fibre-reinforced polypropylene biocomposites.
VariantTensile Strength
(MPa)
Breaking Elongation
(%)
Bending Strength
(MPa)
Bending Modulus
(MPa)
100PP20.33 ± 0.9614.1 ± 0.7337.3 ± 4.171123.8 ± 142.7
25Co75PP15.02 ± 1.063.6 ± 0.2929.2 ± 4.351332.6 ± 215.88
50Co50PP10.6 ± 1.164.4 ± 0.5321.5 ± 3.95980.7 ± 185.35
75Co25PP8.06 ± 1.225.2 ± 0.8714.4 ± 2.82720.5 ± 146.9
100Co0.86 ± 0.0864.5 ± 7.32
Table 3. Degradation temperature (°C) and mass loss of biocomposite materials.
Mass Loss (%)Process Temperature (°C)
100Co75Co25PP50Co50PP25Co75PP100PP
2.567222.8223.1290.89366
5222.7256.9284.2324.7372.1
10249.9284.1324.9378.9385.6
15263.6304.5358.7411.9394.1
20278.2321.2406.1426405.1
25284.1330.8419.4435.1410.5
50332.3432.8452.9454.3433.1
Table 4. DSC data of biocomposite materials.
SampleFirst HeatingCoolingSecond Heating
Tm (°C)∆Hm (J/g) *Tc (°C)∆HC (J/g)χcomp
(%)
Tm (°C)∆Hm (J/g) **χcomp
%
100Co
75Co25PP165.2835.8115.9942.3320.44162.6237.8218.27
50Co50PP166.9950.3211658.0428.03163.6652.8425.52
25Co75PP167.1859.64114.4672.1234.84164.3661.3329.62
100PP164.7474.40112.593.5645.19167.5481.6739.45
* First heating; ** Second heating.
Publisher’s Note: MDPI stays neutral with regard to jurisdictional claims in published maps and institutional affiliations.

