
Crystal Structure Dynamics of RFe3(BO3)4 Single Crystals in the Temperature Range 25–500 K

 ,
,
Abstract
:1. Introduction
2. Materials and Methods
2.1. Single-Crystal X-ray Diffraction
2.2. Mössbauer Spectroscopy
3. Results and Discussion
3.1. Structural Refinement
3.2. Temperature Dynamics of the Structures
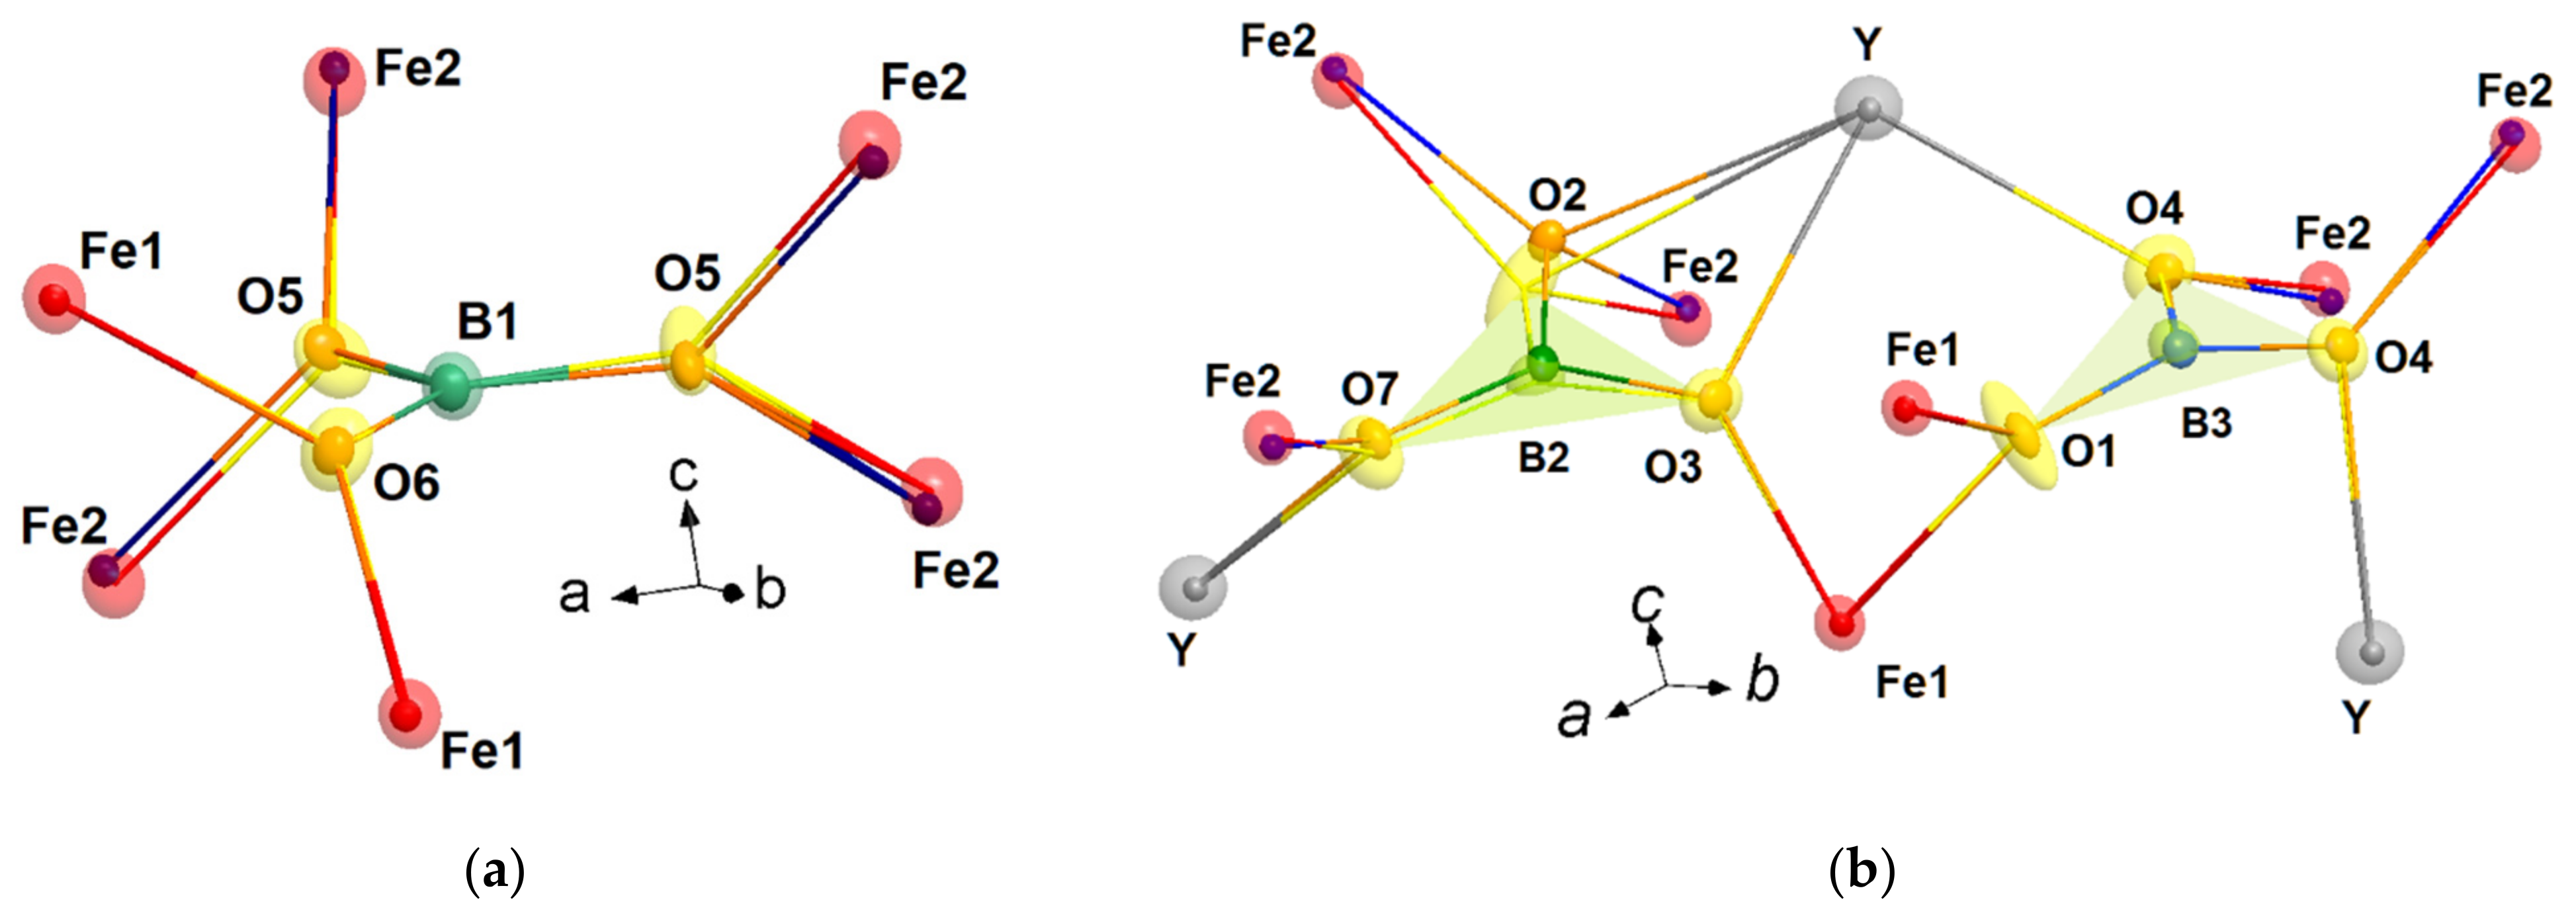
3.2.1. Rigid Boron Triangles
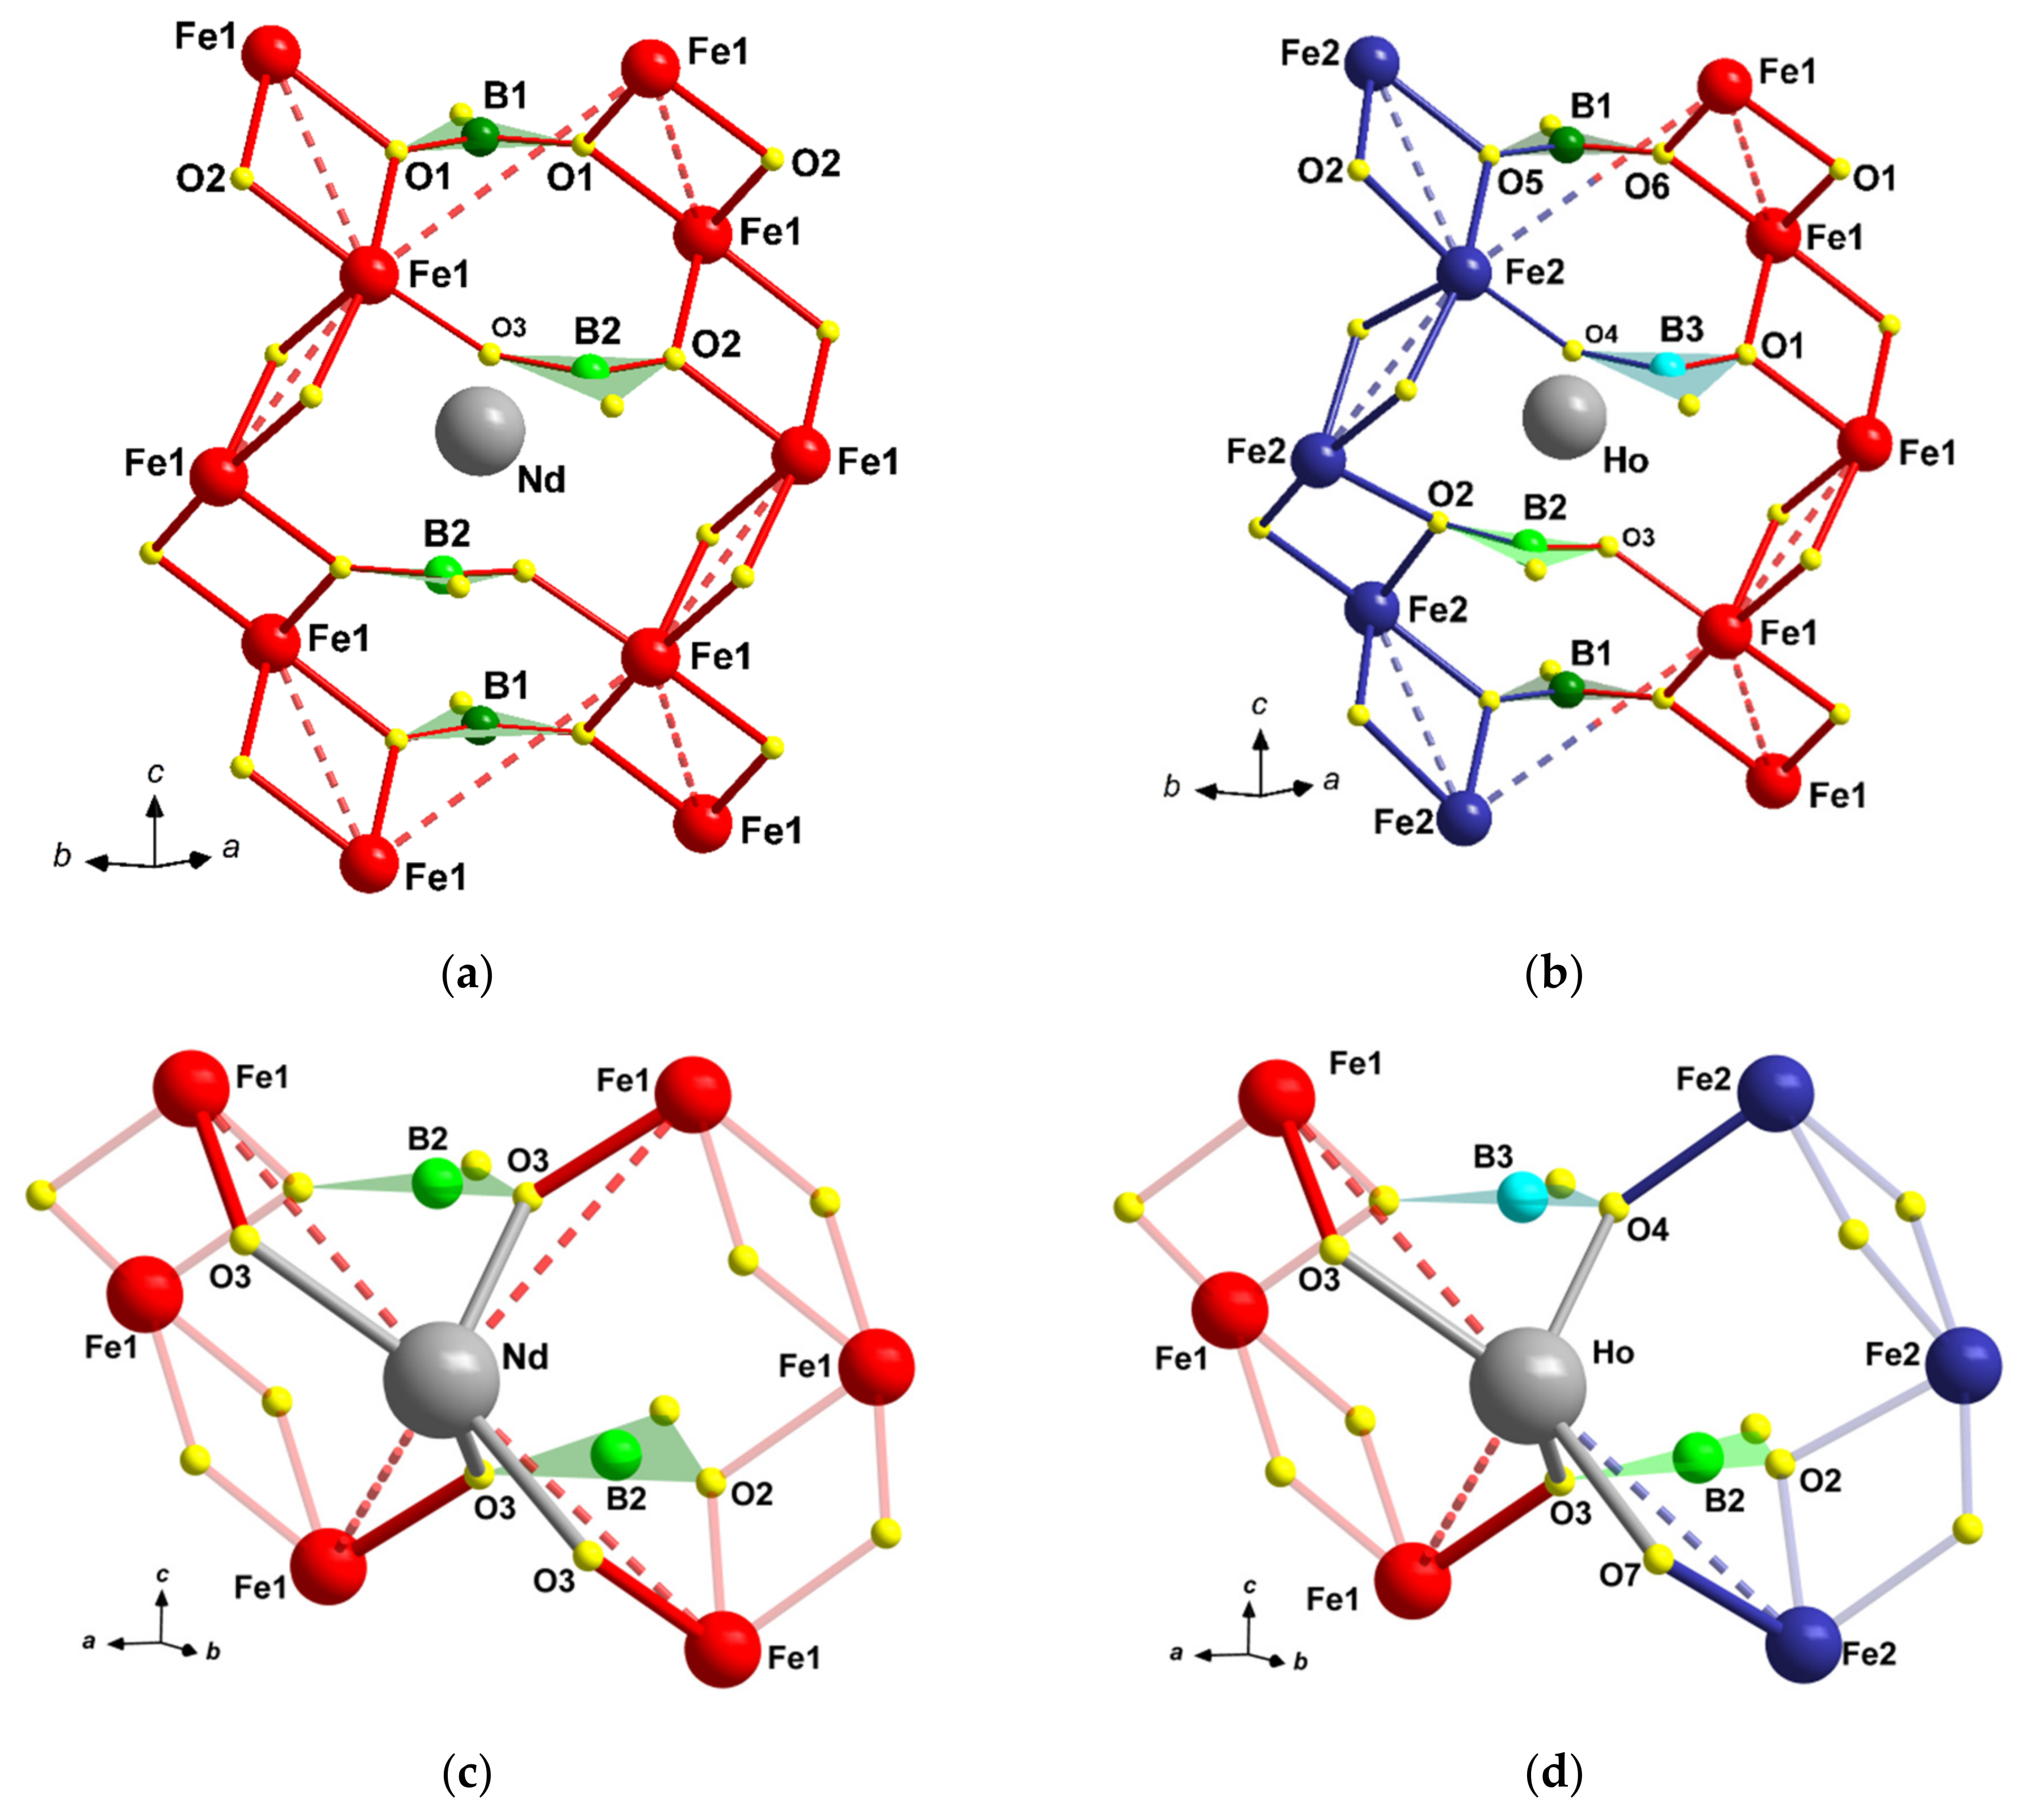
3.2.2. Distortion of Iron Atom Coordination
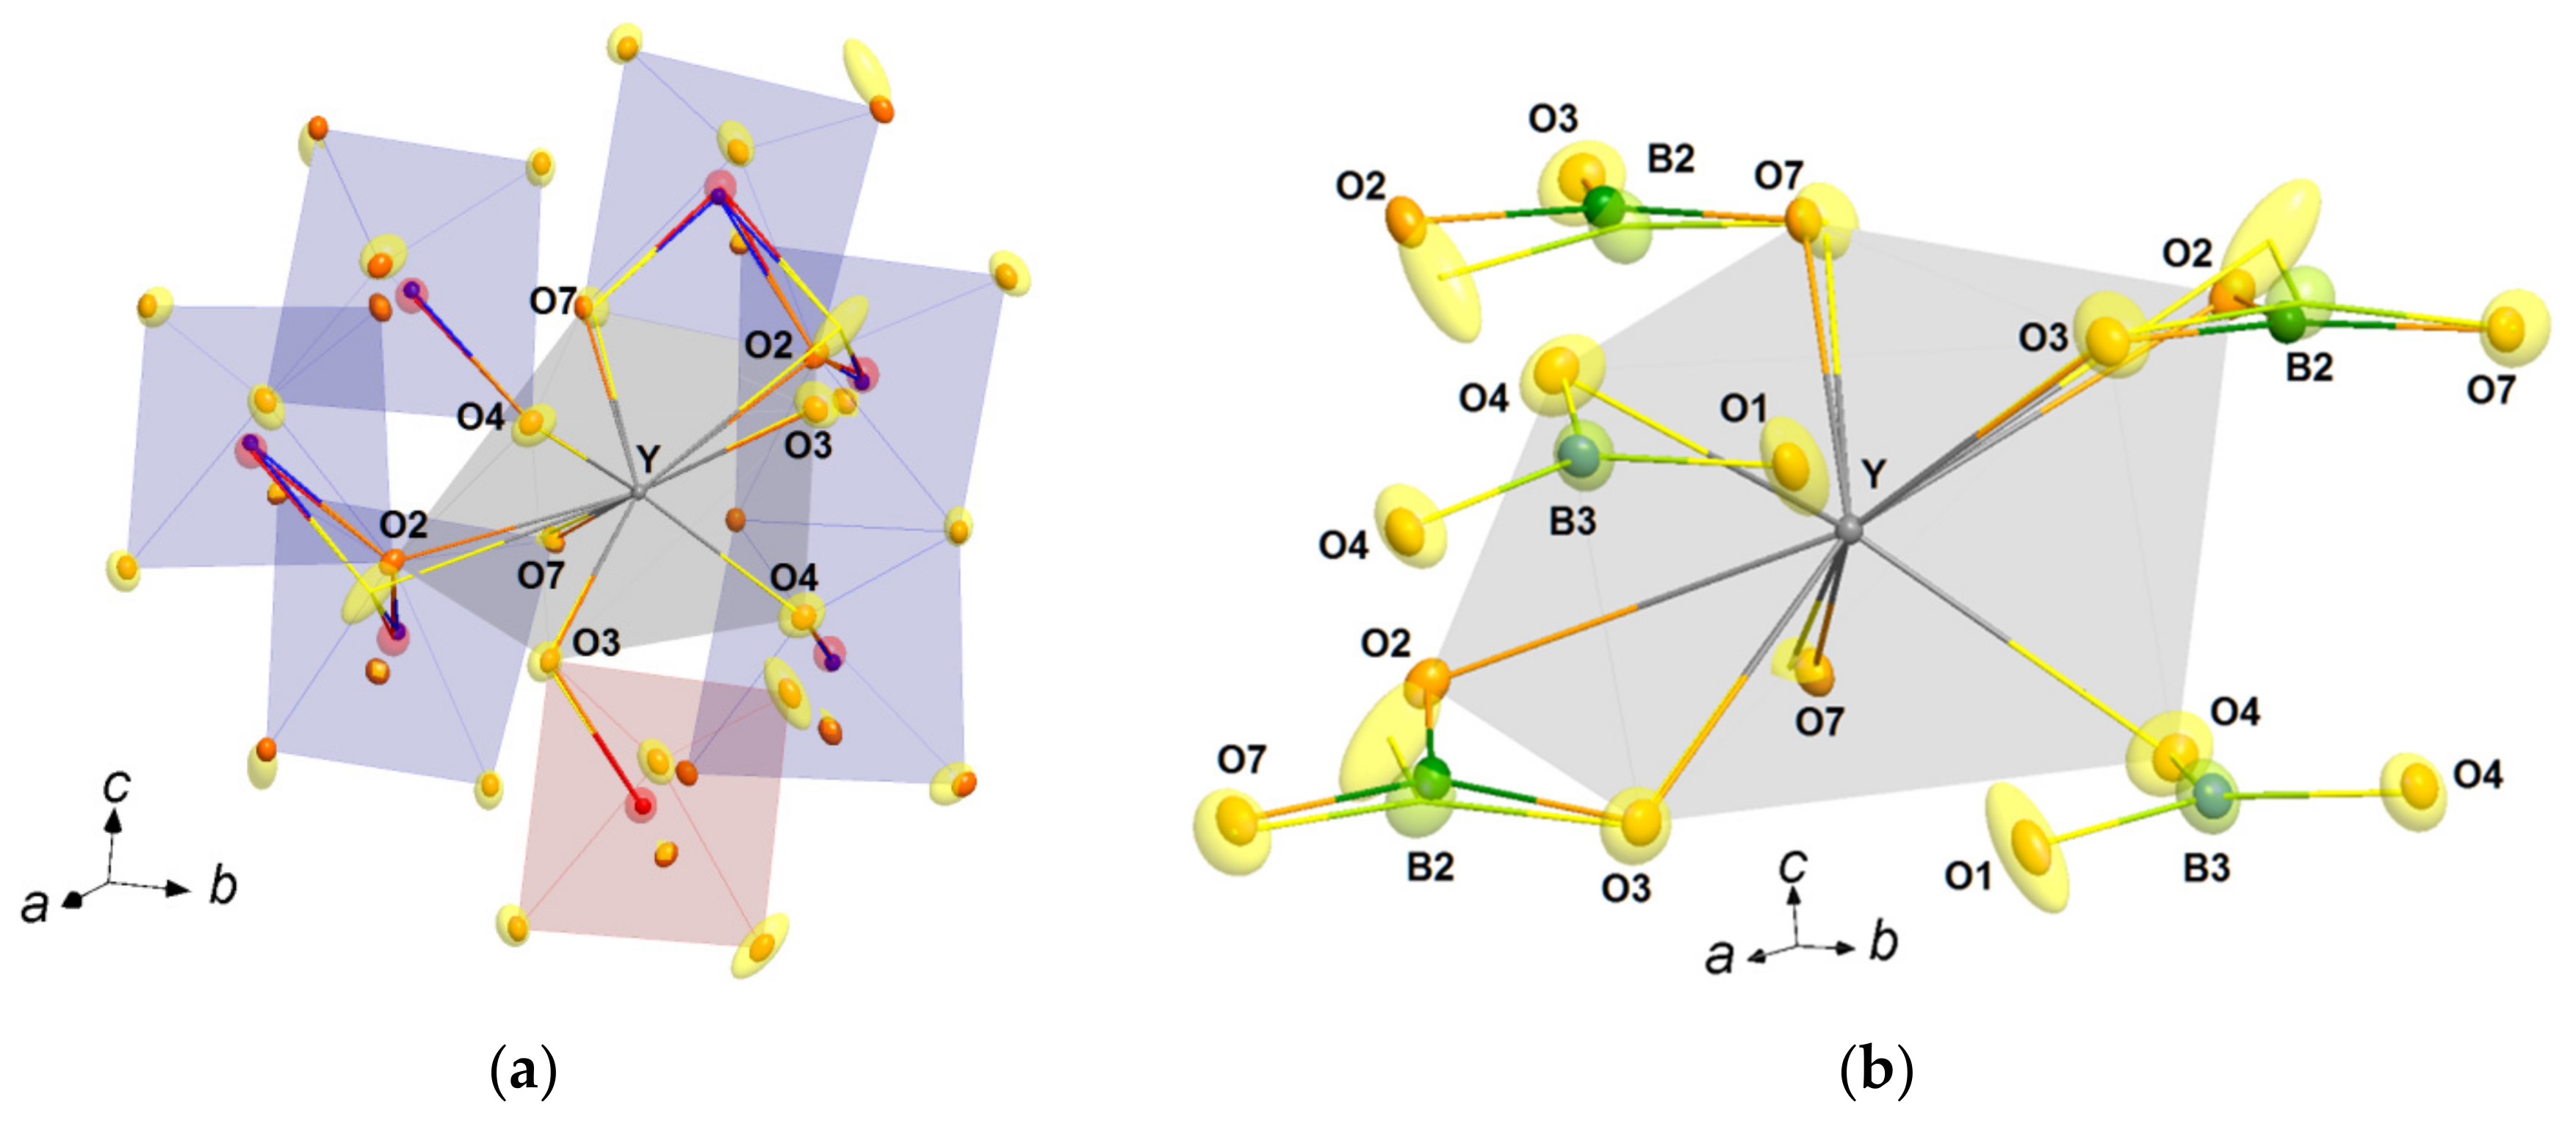
3.2.3. Distortion of Rare-Earth Atom Coordination
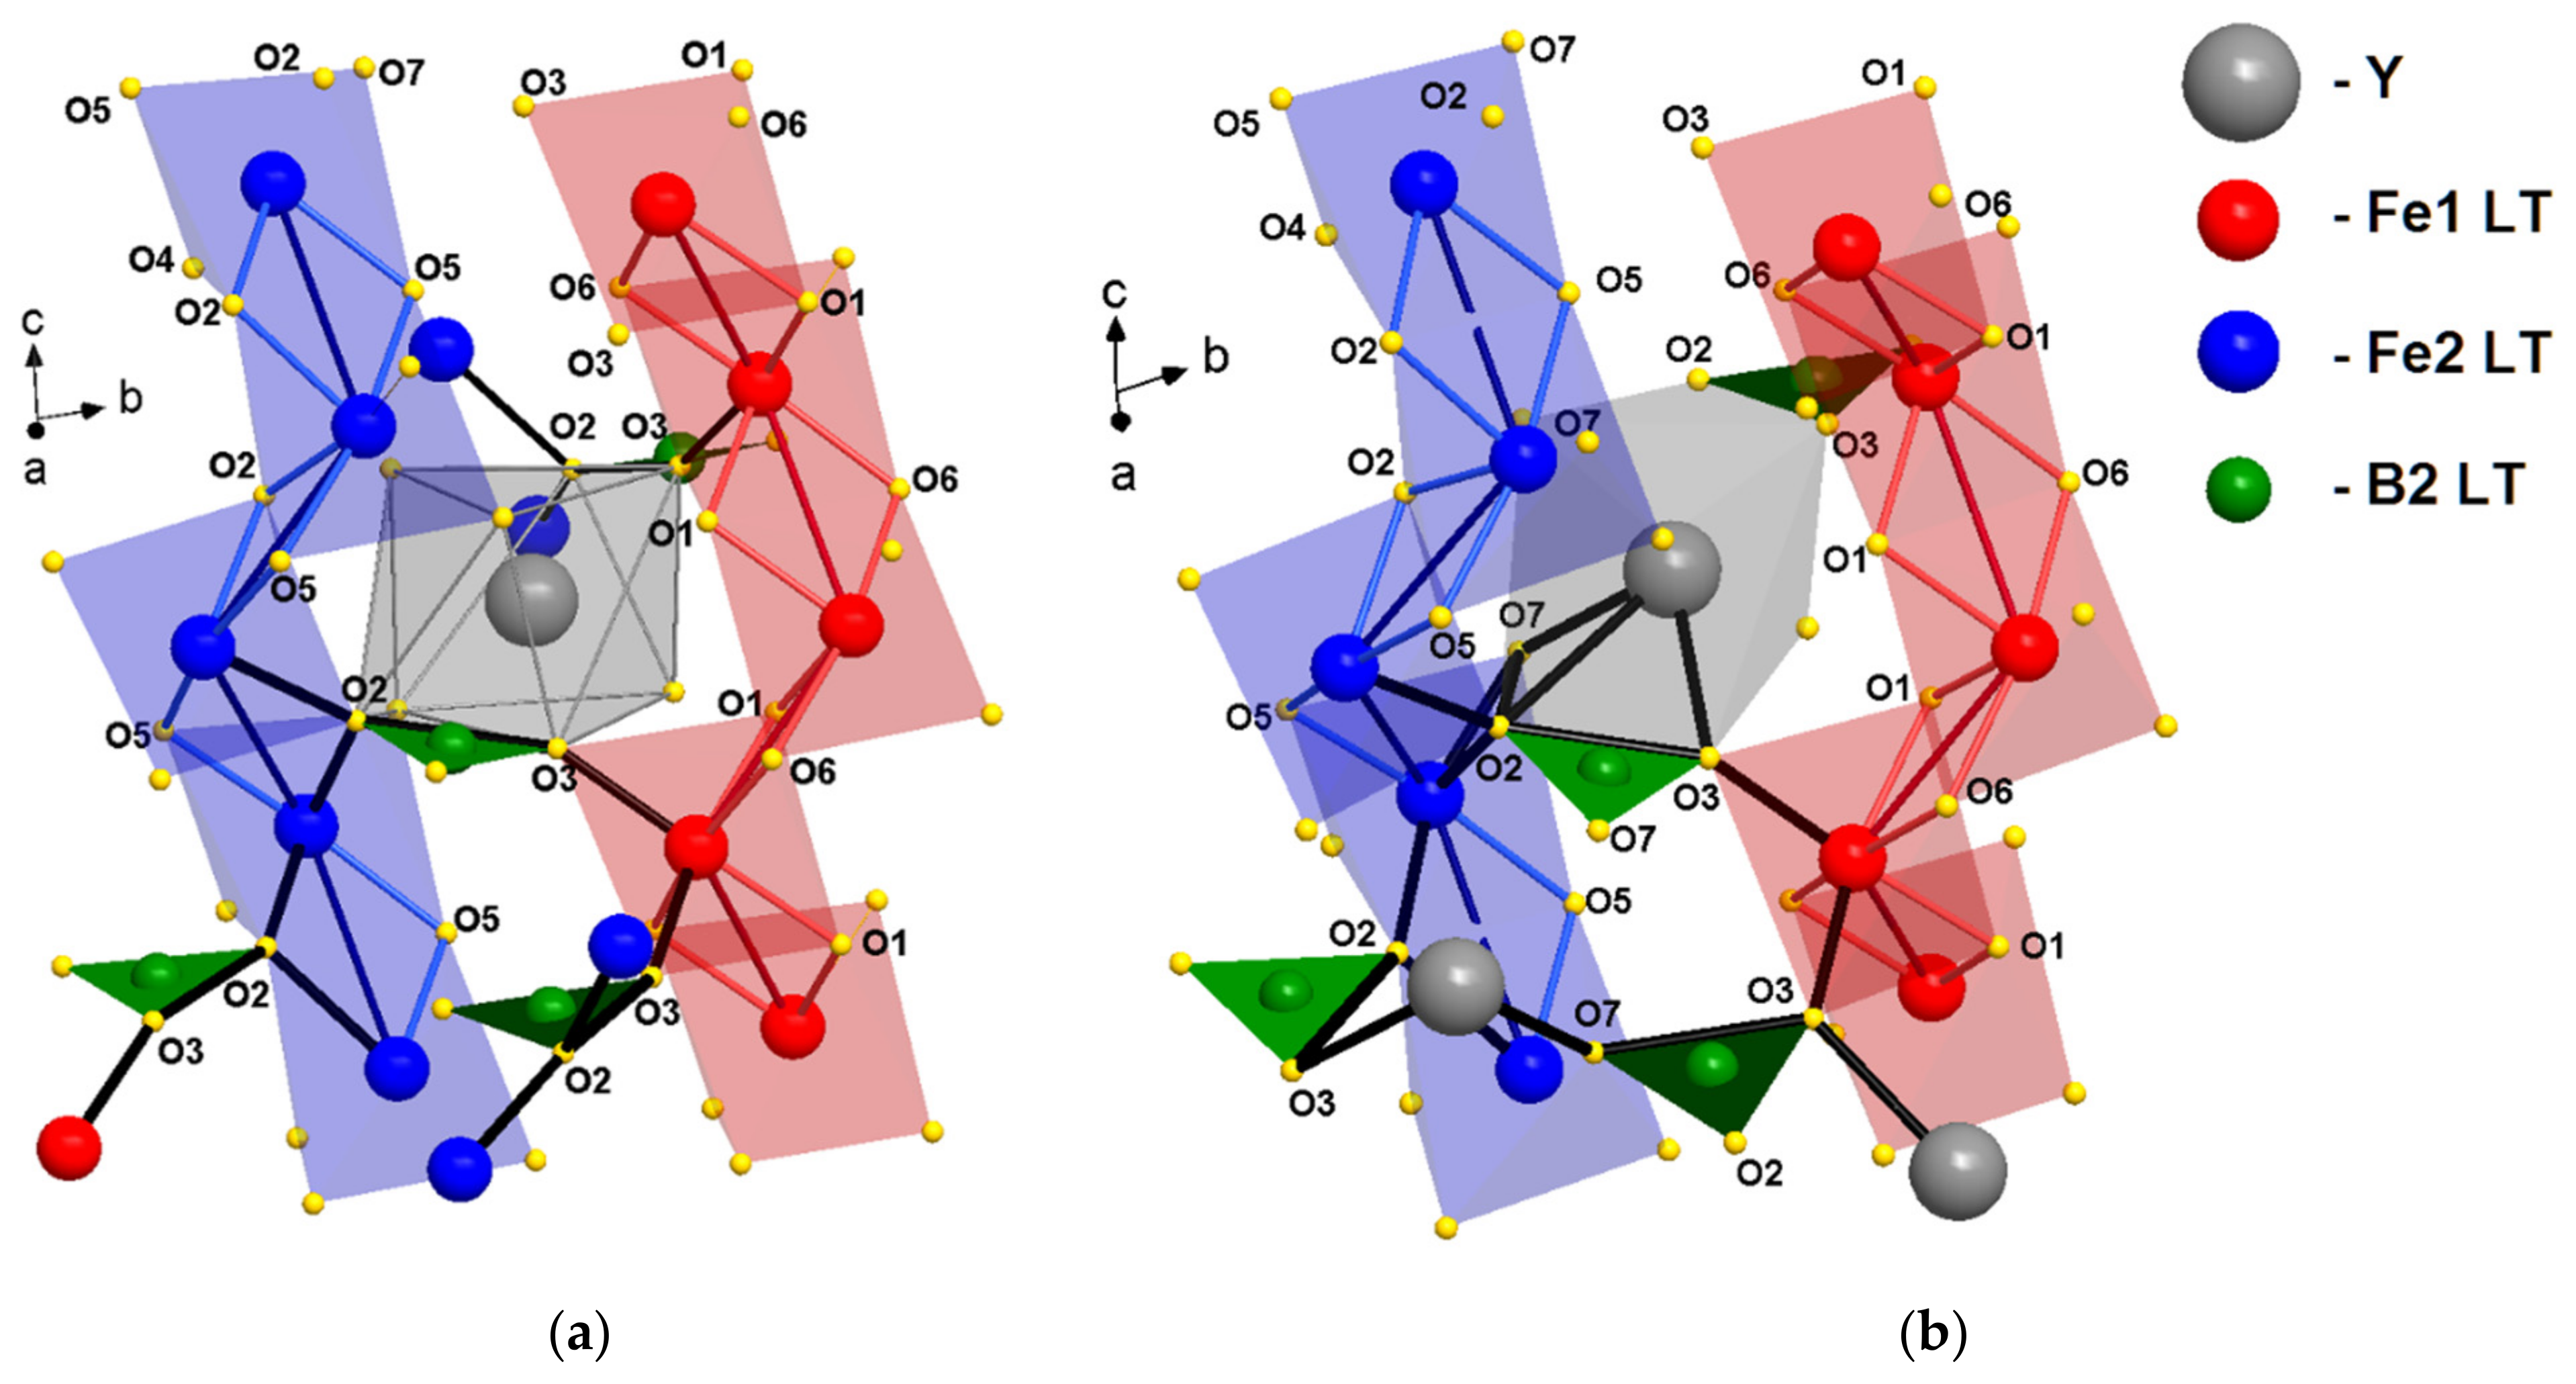
3.3. Exchange and Super-Exchange Paths
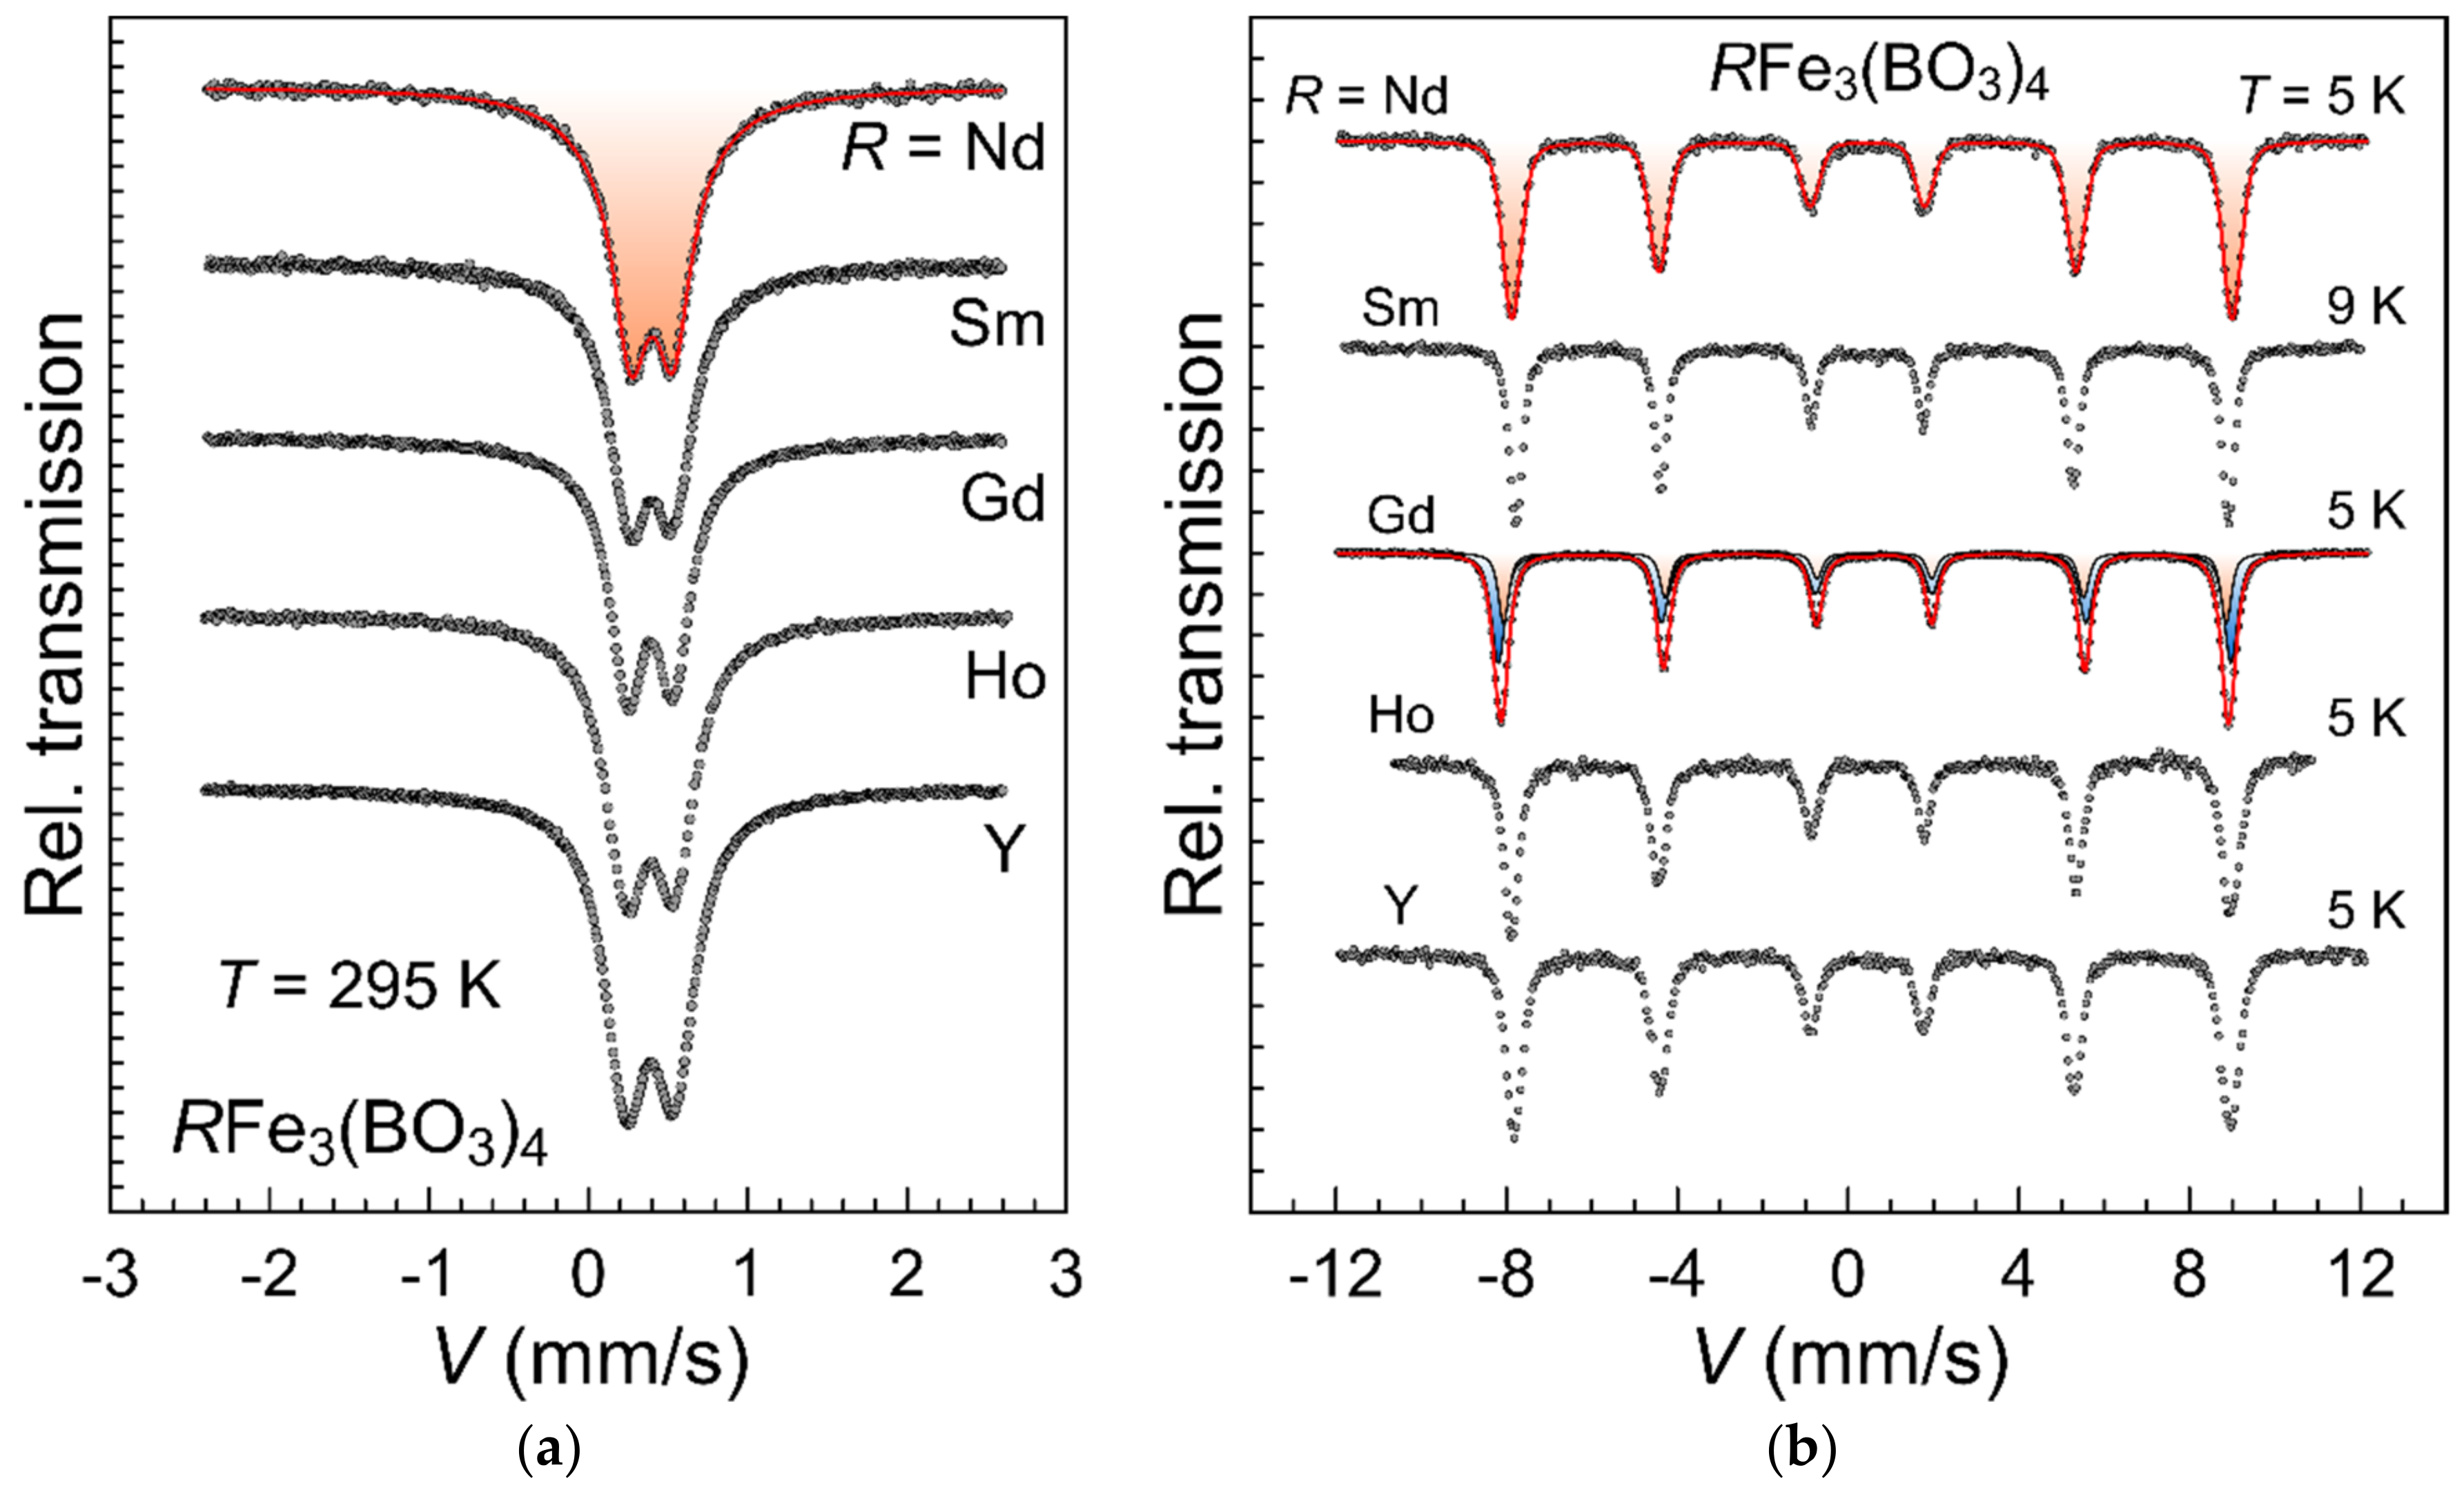
3.4. Mössbauer Spectroscopy Results

| R | Y | Ho | Gd | Sm | Nd | ||
| ΘM (K) | 390(2) | 440(2) [42] | 445(2) | 490(2) [33] | 485(2) [60] | ||
| ΘD (K) | R32 | Fe1 | 472(19) | 478(15) | - | 420(10) | 439(3) |
| P3121 | Fe1 | 422(4) | 439(4) | - | - | - | |
| Fe2 | 416(5) | 430(2) | - | - | - | ||
| Fe1-Fe2 separation by MS | No | Yes, below TN | Yes, below TN | - | - | ||
| TN (K) | 39.42(16) [18] | 37.42(1) [42] | 38.0(1) [39] | 31.93(5) [33] | 32.54(4) [60] | ||
| β | R32 | Fe1 | - | - | - | 0.343(1) | 0.324(1) |
| P3121 | Fe1 | 0.369(16) | 0.283(1) | 0.33(1) | - | - | |
| Fe2 | 0.283(1) | 0.29(2) | |||||
| n | R32 | Fe1 | - | - | - | 2, XY or plane Izing | 1, one-dimensional Izing |
| P3121 | Fe1 | 3, Heisenberg | 1, one-dimensional Izing | 2, XY or plane Izing | - | - | |
| Fe2 | 1, one-dimensional Izing | 1, one-dimensional Izing | |||||
| TSR (K) | - | 4.4(3) | ≈ 10 | - | - | ||
| Orientation of ion magnetic moments (above/below TSR) | R32 | R | - | - | - | in ab plane [14] | in ab plane [20,21] |
| Fe1 | in ab plane | in ab plane | |||||
| P3121 | R | - | in ab plane/ along c axis, partially off axis [17] | about 45° to the c axis/ along c axis [23,39,66,67] | - | - | |
| Fe1 | in ab plane [17] | slightly out of ab plane (increase on cooling)/ along c axis | from 15° to 30° (on cooling) to the ab plane/ about 45° to the c axis | ||||
| Fe2 | in ab plane | in ab plane/ along c axis | |||||
4. Conclusions
Supplementary Materials
Author Contributions
Funding
Institutional Review Board Statement
Informed Consent Statement
Data Availability Statement
Acknowledgments
Conflicts of Interest
Appendix A. Interatomic Distances in the Closest Coordination Spheres
| R | Nd0.91Bi0.09 | Sm0.93Bi0.07 | Gd0.95Bi0.05 | Ho0.96Bi0.04 | Y0.95Bi0.05 |
|---|---|---|---|---|---|
| Space group | R32 | R32 | P3121 | P3121 | P3121 |
| B1O3–triangle | |||||
| B1–O5 LT (O1 HT) × 2 B1–O6 LT (O1 HT) (B1–O)ave Δ (max–min) | 1.3823(3) 1.3823(3) 1.382 0 | 1.3805(3) 1.3805(3) 1.381 0 | 1.3801(15) 1.3802(10) 1.380 0 | 1.3768(10) 1.3753(7) 1.376 0.002 | 1.3762(13) 1.3770(8) 1.376 0.001 |
| B2O3–triangle | |||||
| B2–O2 LT (O2 HT) B2 –O3 LT (O3 HT) B2– O7 LT (O3 HT) (B2–O)ave Δ (max–min) | 1.3796(6) 1.3698(8) 1.3698(8) 1.373 0.010 | 1.3775(6) 1.3715(8) 1.3715(8) 1.374 0.006 | 1.3782(9) 1.3733(15) 1.3650(19) 1.372 0.013 | 1.3793(6) 1.3726(10) 1.3648(13) 1.372 0.014 | 1.3793(7) 1.3723(11) 1.3658(13) 1.372 0.014 |
| B3O3–triangle | |||||
| B3– O4 LT (O3 HT) × 2 B3–O1 LT (O2 HT) (B3–O)ave Δ (max–min) | 1.3698(8) 1.3796(6) 1.373 0.010 | 1.3715(8) 1.3775(6) 1.374 0.006 | 1.3790(8) 1.3748(15) 1.378 0.004 | 1.3813(6) 1.3707(10) 1.378 0.011 | 1.3811(6) 1.3718(12) 1.378 0.010 |
| R | Nd0.91Bi0.09 | Sm0.93Bi0.07 | Gd0.95Bi0.05 | Ho0.96Bi0.04 | Y0.95Bi0.05 |
|---|---|---|---|---|---|
| Space group | R32 | R32 | P3121 | P3121 | P3121 |
| RO6–prism (1st coordination sphere) | |||||
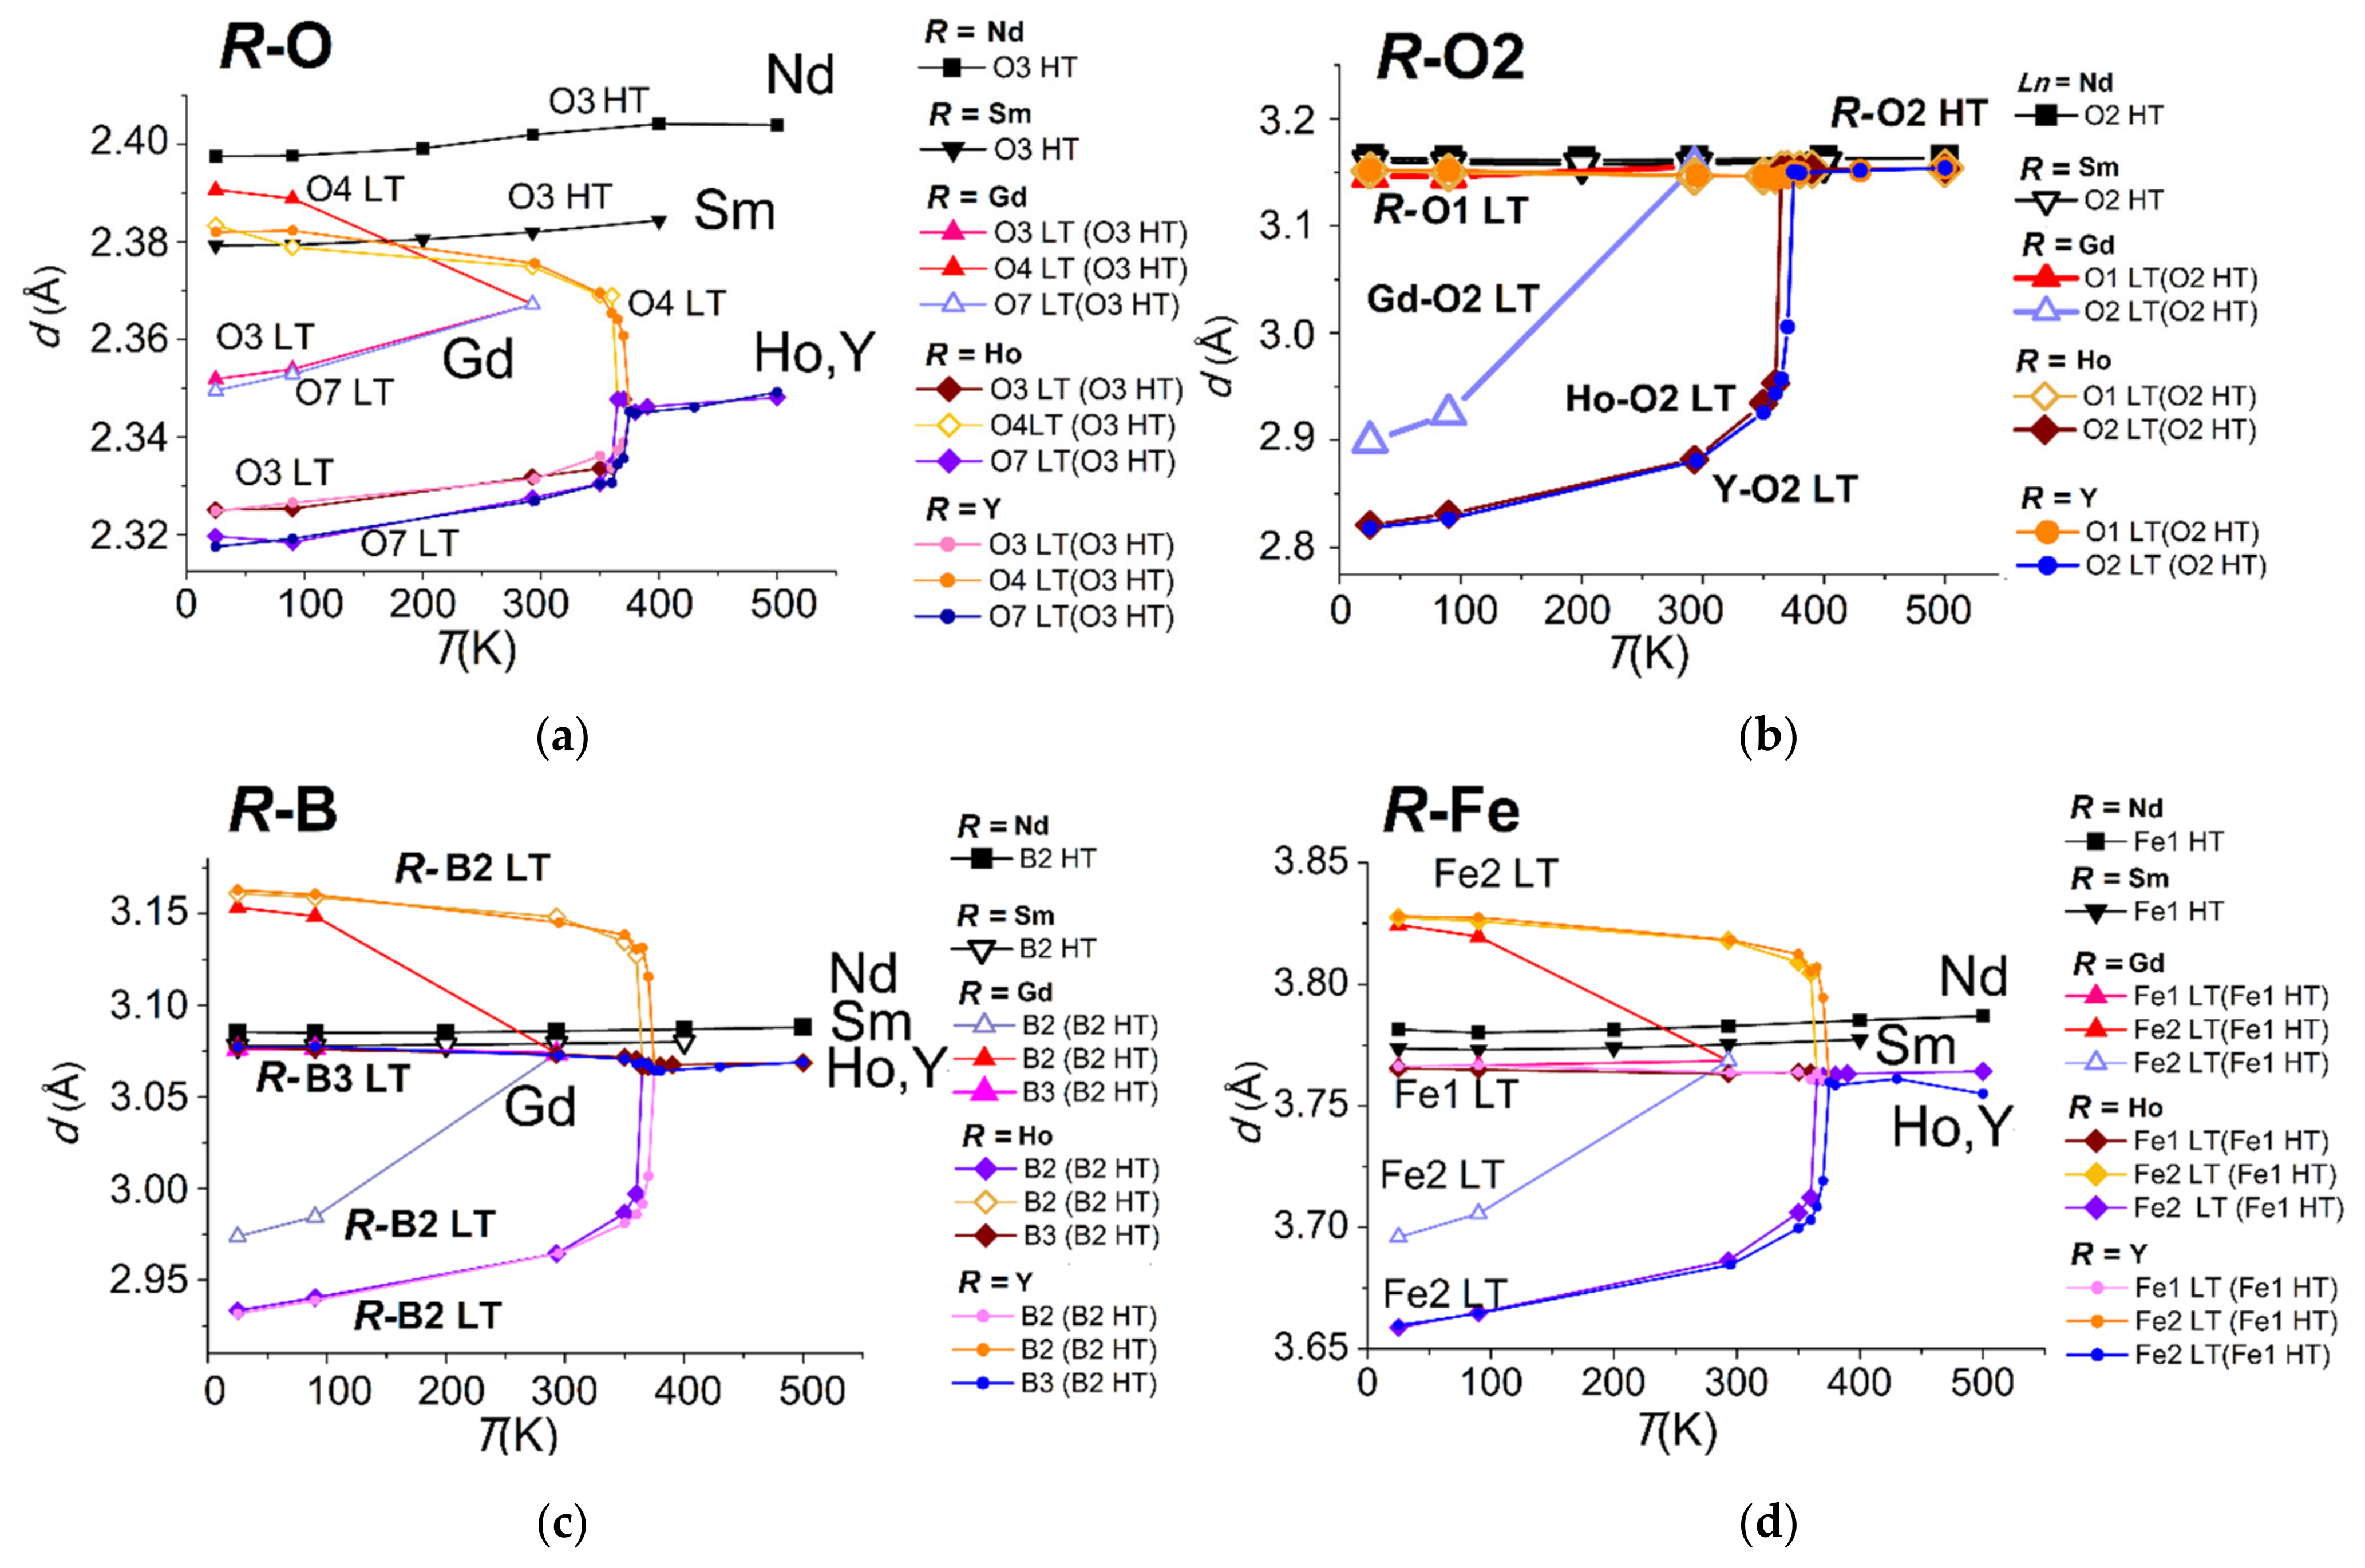
| R–O3 LT (O3 HT) × 2 R–O4 LT (O3 HT) × 2 R–O7 LT (O3 HT) × 2 (R–O)ave Δ (max–min) Distortion (%) Displacement MC (%) | 2.3976(4) 2.3976(4) 2.3976(4) 2.398 0 9.06 0 | 2.3793(4) 2.3793(4) 2.3793(4) 2.379 0 8.99 0 | 2.3519(8) 2.3907(8) 2.3495(6) 2.364 0.041 8.45 0.53 | 2.3253(8) 2.3834(6) 2.3196(5) 2.343 0.064 8.09 0.99 | 2.3248(6) 2.3820(6) 2.3175(5) 2.341 0.065 7.95 1.05 |
| R–O distance (2nd coordination sphere) | |||||
| R–O1 LT (O2 HT) R–O2 LT (O2 HT) | 3.1636(5) 3.1636(5) | 3.1601(3) 3.1601(3) | 3.1462(2) 2.8987(7) | 3.1515(10) 2.8210(10) | 3.1522(10) 2.8180(10) |
| R–B distance (2nd coordination sphere) | |||||
| R–B2min LT (B2 HT) × 2 R–B2max LT (B2 HT) × 2 R–B3 LT (B2 HT) × 2 (R–B)ave Δ (max–min) | 3.0853(5) 3.0853(5) 3.0853(5) 3.085 0 | 3.0778(6) 3.0778(6) 3.0778(6) 3.078 0 | 2.9738(12) 3.1533(9) 3.0760(12) 3.068 0.180 | 2.9332(9) 3.1608(6) 3.0769(2) 3.057 0.228 | 2.9315(10) 3.1628(7) 3.0771(2) 3.057 0.231 |
| R–B distance (3rd coordination sphere) | |||||
| R–B1 LT (B1 HT) × 2 | 3.7980(1) | 3.7910(4) | 3.7796(5) | 3.7691(5) | 3.7712(5) |
| R–Fe distance (3rd coordination sphere) | |||||
| R–Fe1 LT (Fe1 HT) × 2 R–Fe2min LT (Fe1 HT) × 2 R–Fe2max LT (Fe1 HT) × 2 (R–Fe)ave Δ (max–min) | 3.7814(1) 3.7814(1) 3.7814(1) 3.781 0 | 3.7736(1) 3.7736(1) 3.7736(1) 3.774 0 | 3.7662(2) 3.6960(3) 3.8244(3) 3.762 0.128 | 3.7654(2) 3.6588(2) 3.8275(3) 3.751 0.168 | 3.7663(2) 3.6597(2) 3.8280(3) 3.751 0.168 |
| R | Nd0.91Bi0.09 | Sm0.93Bi0.07 | Gd0.95Bi0.05 | Ho0.96Bi0.04 | Y0.95Bi0.05 |
|---|---|---|---|---|---|
| Space group | R32 | R32 | P3121 | P3121 | P3121 |
| Fe1O6 octahedra (1st coordination sphere) | |||||
| Fe1–O1 LT (O2 HT) × 2 Fe1–O3 LT (O3 HT) × 2 Fe1–O6 LT (O1 HT) × 2 (Fe1–O)ave Δ (max-min) Distortion(%) Displacement MC (%) | 2.0462(4) 1.9585(3) 2.0270(3) 2.011 0.088 7.97 7.04 | 2.0396(4) 1.9620(3) 2.0230(3) 2.008 0.078 8.23 7.14 | 2.0430(6) 1.9562(6) 2.0070(7) 2.002 0.087 7.99 7.53 | 2.0388(5) 1.9628(7) 2.0011(6) 2.001 0.076 8.45 8.79 | 2.0379(5) 1.9626(5) 2.0010(5) 2.001 0.075 8.50 7.87 |
| Fe2O6 octahedra (1st coordination sphere) | |||||
| Fe2–O2min LT (O2 HT) Fe2–O2max LT (O2 HT) Fe2–O4 LT (O3 HT) Fe2–O5min LT (O1 HT) Fe2–O5max LT (O1 HT) Fe2–O7 LT (O3 HT) (Fe2–O)ave Δ (max-min) Distortion(%) Displacenent MC | 2.0462(4) 2.0462(4) 1.9585(3) 2.0270(3) 2.0270(3) 1.9585(3) 2.011 0.088 7.97 7.04 | 2.0396(4) 2.0396(4) 1.9620(3) 2.0230(3) 2.0230(3) 1.9620(3) 2.008 0.078 8.23 7.14 | 2.0409(8) 2.0506(5) 1.9640(6) 2.0190(8) 2.0247(6) 1.9730(8) 2.012 0.087 9.73 7.67 | 2.0388(5) 2.0586(4) 1.9651(5) 2.0126(7) 2.0251(5) 1.9803(7) 2.013 0.094 10.46 8.13 | 2.0392(7) 2.0603(5) 1.9666(5) 2.0152(6) 2.0232(5) 1.9832(6) 2.015 0.094 10.55 8.15 |
| Fe1–B distance (2nd coordination sphere) | |||||
| Fe1–B1 LT (B1 HT) × 2 Fe1–B2 LT (B2 HT) × 2 Fe1–B3 LT (B2 HT) × 2 (Fe1–B)ave Δ (max-min) | 3.0807(1) 3.0611(6) 3.1049(7) 3.082 0.043 | 3.074(1) 3.0575(7) 3.0943(7) 3.075 0.037 | 3.0577(9) 3.0878(13) 3.1024(12) 3.083 0.045 | 3.0465(4) 3.0919(7) 3.0935(2) 3.077 0.047 | 3.0474(8) 3.0914(10) 3.0937(8) 3.078 0.046 |
| Fe2–B distance (2nd coordination sphere) | |||||
| Fe2–B1min LT (B1 HT) Fe2–B1max LT (B1 HT) Fe2–B2I LT (B2 HT) Fe2–B2II LT (B2 HT) Fe2–B2III LT (B2 HT) Fe2–B3 LT (B2 HT) (Fe2–B)ave Δ (max-min) | 3.0807(1) 3.0807(1) 3.0611(6) 3.0611(6) 3.0611(6) 3.1049(7) 3.075 0.044 | 3.074(1) 3.074(1) 3.0575(7) 3.0575(7) 3.0575(7) 3.0943(7) 3.069 0.037 | 3.0572(8) 3.0804(9) 3.0263(13) 3.0435(9) 3.0923(13) 3.0513(11) 3.059 0.066 | 3.0420(4) 3.0776(5) 3.0164(9) 3.0189(6) 3.0812(9) 3.0344(8) 3.045 0.065 | 3.0429(7) 3.0761(8) 3.0169(10) 3.0200(7) 3.081(10) 3.0443(8) 3.047 0.064 |
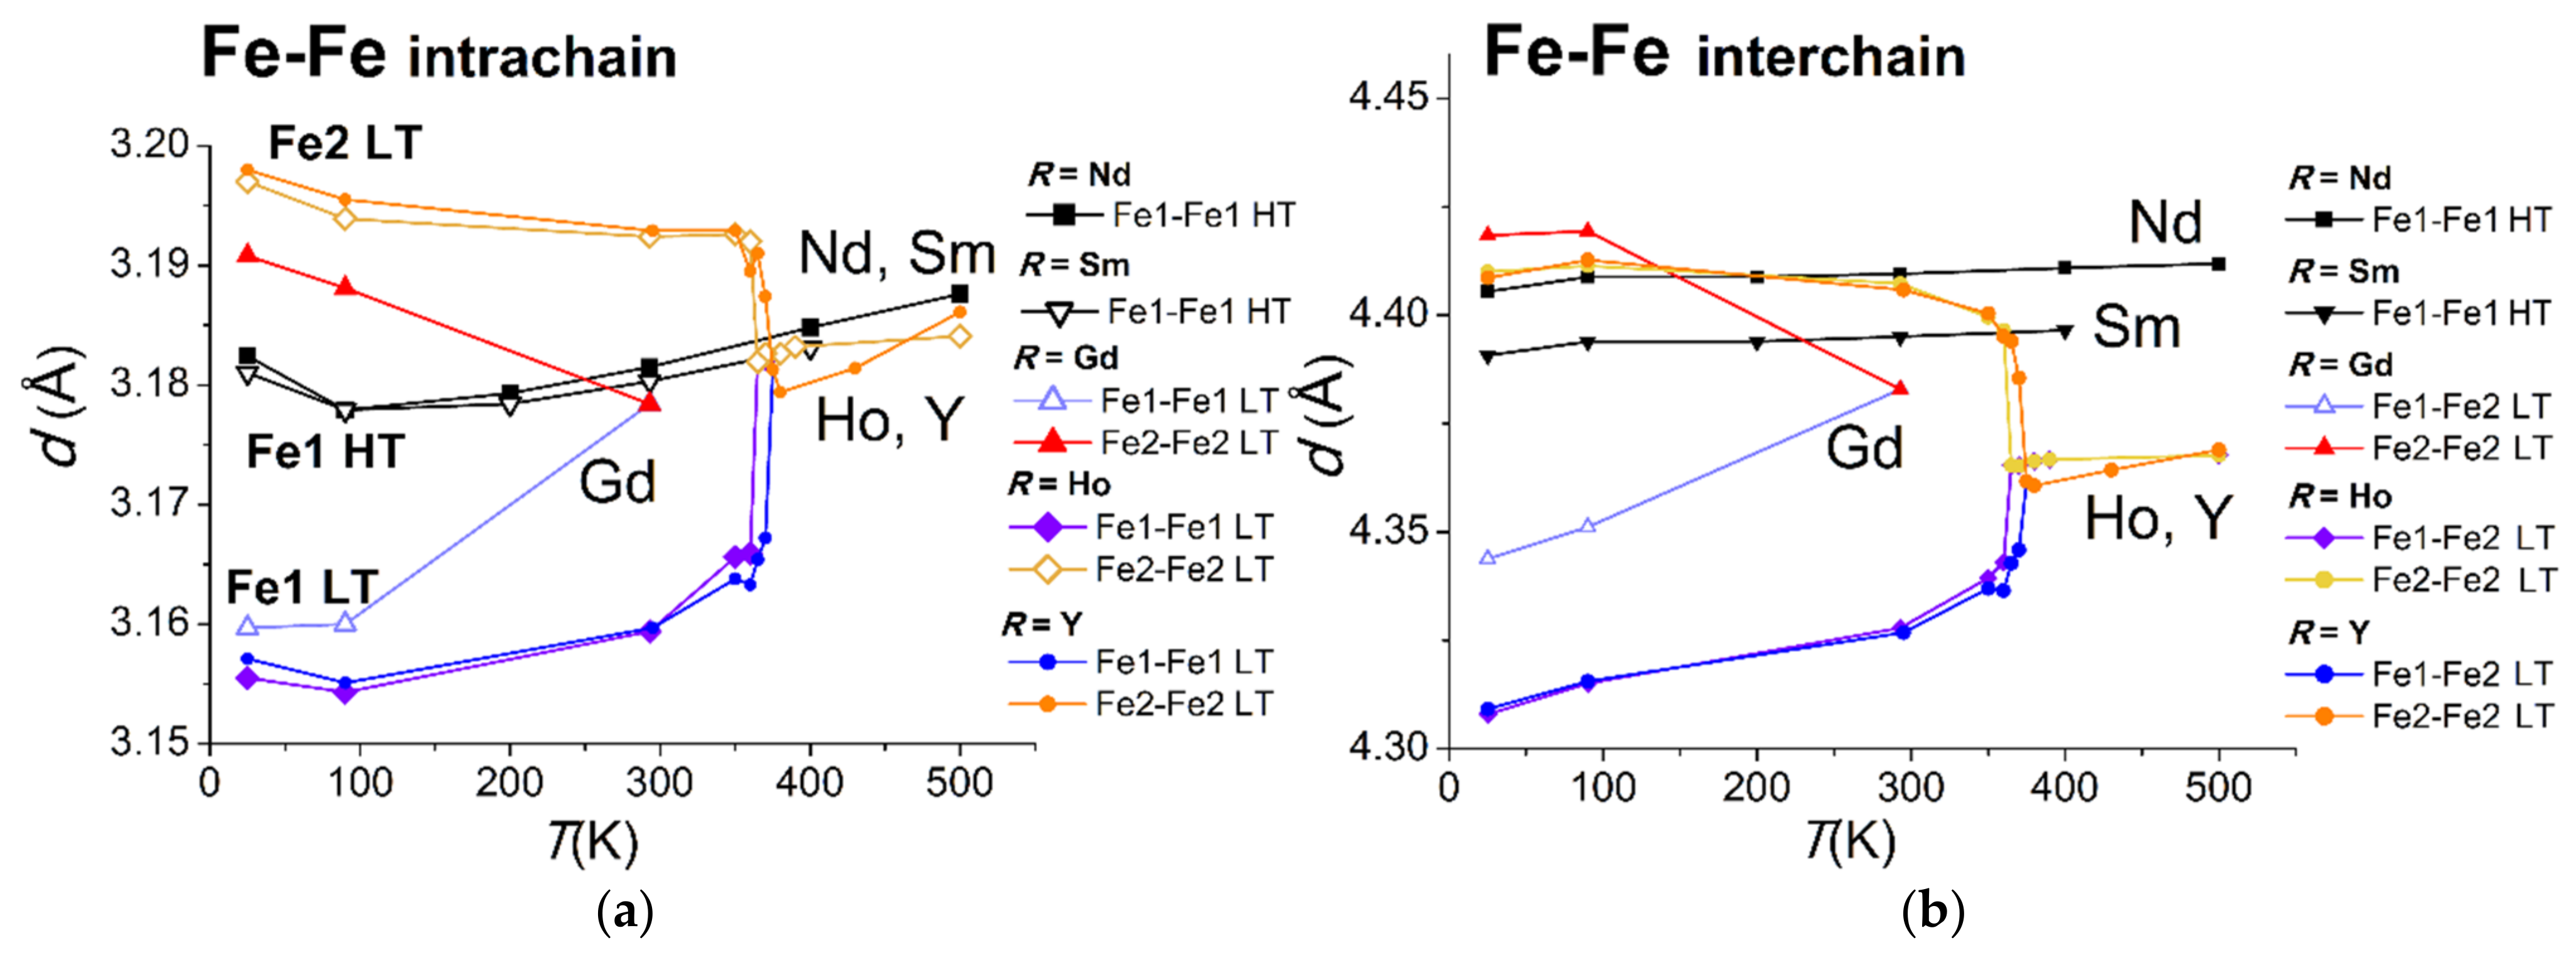
| Fe–Fe distances inside chains (2rd coordination sphere) | |||||
| Fe1-Fe1intra Fe2-Fe2intra (Fe1–Fe1)ave Δ (max-min) | 3.1824(1) 3.1824(1) 3.182 0 | 3.1810(1) 3.1810(1) 3.181 0 | 3.1597(3) 3.1908(3) 3.175 0.031 | 3.1555(3) 3.1970(3) 3.176 0.041 | 3.1571(3) 3.1980(3) 3.176 0.041 |
| Fe–Fe distances between chains (4th coordination sphere) | |||||
| Fe1-Fe2interI Fe1-Fe2interII (ab plane) Fe1-Fe2interIII (ab plane) Fe2-Fe2interI Fe2-Fe2interII (ab plane) (Fe1–Fe1)ave Δ (max-min) | 4.4054(1) 4.8646(1) 4.8646(1) 4.4054(1) 4.8646(1) 4.681 0.459 | 4.3907(1) 4.8537(1) 4.8537(1) 4.3907(1) 4.8537(1) 4.669 0.463 | 4.3438(1) 4.8337(2) 4.8436(2) 4.4184(1) 4.8416(1) 4.656 0.500 | 4.3080(1) 4.8193(1) 4.8261(2) 4.4100(2) 4.8263(2) 4.638 0.518 | 4.3092(1) 4.8183(2) 4.8263(1) 4.4086(1) 4.8260(1) 4.638 0.517 |
| Sm0.93Bi0.07Fe3(BO3)4 (HT Labels) | Gd0.95Bi0.05Fe3(BO3)4 (LT Labels) | ||
|---|---|---|---|
| Intrachain Fe–O–Fe | |||
| Fe1–Fe1 | 3.1810(1) | Fe1–Fe1 Fe2–Fe2 | 3.1597(3) 3.1908(3) |
| Intrachain Fe–O–Fe | |||
| Fe1–O1–Fe1 Fe1–O2–Fe2 | 2.0230(3)–2.0230(3) [4.046] 2.0396(4)–2.0396(4) [4.0792] | Fe2–O5–Fe2 Fe2–O2–Fe2 Fe1–O6–Fe1 Fe1–O1–Fe1 | 2.0189(7)–2.0247(5) [4.0436] 2.0506(5)–2.0409(5) [4.0915] 2.0070(7)–2.0070(7) [4.014] 2.0430(5)–2.0430(5) [4.086] |
| Interchain Fe–O–Fe | |||
| Fe1–O1–O1–Fe1 (B1) Fe1–O2–O3–Fe1 (B2) Fe1–O3–O3–Fe1 (B2) | 2.0230(3)–2.3911(7)–2.0230(3) [6.4371] 2.0396(4)–2.3534(5)– 1.9620(3) [6.355] 1.9620(3)–2.4274(7)–1.9620(3) [6.3514] | Fe2–O4–O1–Fe1 Fe2–O5–O6–Fe1 Fe2–O7–O3–Fe1 Fe2–O5’–O6’–Fe1 Fe2–O2–O3–Fe1 Fe2–O2’–O3’–Fe1 Fe2–O4–O4–Fe2 Fe2–O5–O5–Fe2 Fe2–O5–O5–Fe2’ Fe2–O7–O2–Fe2 Fe2–O7–O2–Fe2’ Fe2–O5’–O5’–Fe2 | 1.9640(6)–2.3572(8)–2.0430(5) [6.3642] 2.0189(7)–2.3816(9)–2.0070(6) [6.4075] 1.9730(9)–2.4239(9)–1.9562(7) [6.3531] 2.0247(6)–2.3816(11)– 2.0070(6) [6.4133] 2.0506(5)–2.3305(11)–1.9562(8) [6.3373] 2.0409(7)–2.3305(11)–1.9562(8) [6.3276] 1.9640(6)–2.4413(12)–1.9640(6) [6.3693] 2.0189(7)–2.4079(11)–2.0247(7) [6.4515] 2.0189(7)–2.4079(11)–2.0189(6) [6.4457] 1.9730(9)–2.3717(12)–2.0409(5) [6.3856] 1.9730(9)–2.3717(12)–2.0505(6) [6.3952] 2.0247(6)–2.4079(13)–2.0247(5) [6.4573] |
| Fe–O–R, Fe–O–R–O–Fe | |||
| Fe1–O3–R (B2) Fe1–O3–O3–R (B2) | 1.9620(3)–2.3793(4) [4.3413] 1.9620(3)–2.4272(7)–2.3793(4) [6.7327] | Fe2–O4–R (B3) Fe2–O7–R (B2) Fe2–O2–R (B2) Fe2–O2’–R (B2) Fe2–O4–O4–R (B3) Fe2–O7–O3–R (B2) Fe2–O7–O2–R (B2) Fe2–O2–O3–R (B2) Fe2–O2–O7–R (B2) Fe2–O2’–O3–R (B2) Fe2–O2’–O7–R (B2) Fe1–O3–R (B2) Fe1–O3–O2–R (B2) Fe1–O3–O7–R (B2) Fe1–O1–O4–R (B3) | 1.9640(6)–2.3907(8) [4.3547] 1.9730(9)–2.3495(6) [4.3225] 2.0506(5)–2.8987(7) [4.9493] 2.0409(7)–2.8987(6) [4.9396] 1.9640(6)–2.4413(12)–2.3907(7) [6.796] 1.9730(9)–2.4239(9)–2.3519(8) [6.7488] 1.9730(9)–2.3717(12)–2.8987(4) [7.2434] 2.0506(5)–2.3305(7)–2.3519(8) [6.733] 2.0506(5)–2.3717(9)–2.3495(8) [6.7718] 2.0409(7)–2.3305(11) [4.3714] 2.0409(7)–2.3717(8)–2.3495(8) [6.7621] 1.9562(8)–2.3519(6) [4.3081] 1.9562(8)– 2.3305(11)–2.8987(7) [7.1854] 1.9562(8)–2.4239(9)–2.3495(8) [6.7296] 2.0430(5)–2.3571(10)–2.3907(6) [6.7908] |
References
- Vasiliev, A.N.; Popova, E.A. Rare-Earth Ferroborates RFe3(BO3)4. Low Temp. Phys. 2006, 32, 735–747. [Google Scholar] [CrossRef]
- Kadomtseva, A.M.; Popov, Y.F.; Vorob’ev, G.P.; Pyatakov, A.P.; Krotov, S.S.; Kamilov, K.I.; Ivanov, V.Y.; Mukhin, A.A.; Zvezdin, A.K.; Kuz’menko, A.M.; et al. Magnetoelectric and Magnetoelastic Properties of Rare-Earth Ferroborates. Low Temp. Phys. 2010, 36, 511–521. [Google Scholar] [CrossRef]
- Kadomtseva, A.M.; Vorob’ev, G.P.; Popov, Y.F.; Pyatakov, A.P.; Mukhin, A.A.; Ivanov, V.Y.; Zvezdin, A.K.; Gudim, I.A.; Temerov, V.L.; Bezmaternykh, L.N. Magnetoelectric and Magnetoelastic Properties of Easy-Plane Ferroborates with a Small Ionic Radius. J. Exp. Theor. Phys. 2012, 114, 810–817. [Google Scholar] [CrossRef]
- Kuzmenko, A.M.; Szaller, D.; Kain, T.; Dziom, V.; Weymann, L.; Shuvaev, A.; Pimenov, A.; Mukhin, A.A.; Ivanov, V.Y.; Gudim, I.A.; et al. Switching of Magnons by Electric and Magnetic Fields in Multiferroic Borates. Phys. Rev. Lett. 2018, 120, 027203. [Google Scholar] [CrossRef]
- Kuz’menko, A.M.; Mukhin, A.A.; Ivanov, V.Y.; Kadomtseva, A.M.; Bezmaternykh, L.N. Effects of the Interaction between R and Fe Modes of the Magnetic Resonance in RFe3(BO3)4 Rare-Earth Iron Borates. JETP Lett. 2011, 94, 294–300. [Google Scholar] [CrossRef]
- Kurumaji, T.; Ohgushi, K.; Tokura, Y. Magnetoelectric Responses from the Respective Magnetic R and Fe Subsystems in the Noncentrosymmetric Antiferromagnets RFe3(BO3)4 (R = Eu, Gd, and Tb). Phys. Rev. B 2014, 89, 195126. [Google Scholar] [CrossRef]
- Kuz’micheva, G.; Kaurova, I.; Rybakov, V.; Podbel’skiy, V. Crystallochemical Design of Huntite-Family Compounds. Crystals 2019, 9, 100. [Google Scholar] [CrossRef]
- Zvezdin, A.K.; Krotov, S.S.; Kadomtseva, A.M.; Vorob’ev, G.P.; Popov, Y.F.; Pyatakov, A.P.; Bezmaternykh, L.N.; Popova, E.A. Magnetoelectric Effects in Gadolinium Iron Borate GdFe3(BO3)4. J. Exp. Theor. Phys. Lett. 2005, 81, 272–276. [Google Scholar] [CrossRef]
- Kuzmenko, A.M.; Mukhin, A.A.; Ivanov, V.Y.; Bezmaternikh, L.N. Coupled R and Fe Magnetic Excitations in RFe3(BO3)4 Multiferroics. Solid State Phenom. 2012, 190, 269–272. [Google Scholar] [CrossRef]
- Ritter, C.; Pankrats, A.; Gudim, I.; Vorotynov, A. Magnetic Structure of Iron Borate DyFe3(BO3)4: A Neutron Diffraction Study. In Proceedings of the Journal of Physics: Conference Series, 5th European Conference on Neutron Scattering, Prague, Czech Republic, 17–21 July 2011; Institute of Physics Publishing: Bristol, UK, 2012; Volume 340, p. 012065. [Google Scholar] [CrossRef] [Green Version]
- Ritter, C.; Vorotynov, A.; Pankrats, A.; Petrakovskiǐ, G.; Temerov, V.; Gudim, I.; Szymczak, R. Magnetic Structure in Iron Borates RFe3(BO3)4 (R = Er, Pr): A Neutron Diffraction and Magnetization Study. J. Phys. Condens. Matter 2010, 22, 206002. [Google Scholar] [CrossRef]
- Ritter, C.; Pankrats, A.I.; Demidov, A.A.; Velikanov, D.A.; Temerov, V.L.; Gudim, I.A. Inclined Magnetic Structure of Iron Borate P Rx Y1-x F E3(BO3)4: A Neutron Diffraction Study and Crystal-Field Calculations. Phys. Rev. B-Condens. Matter Mater. Phys. 2015, 91, 134416. [Google Scholar] [CrossRef]
- Pankrats, A.I.; Petrakovskiĭ, G.A.; Bezmaternykh, L.N.; Temerov, V.L. Antiferromagnetic Resonance and Magnetic Anisotropy in Single Crystals of the YFe3(BO3)4-GdFe3(BO3)4 System. Phys. Solid State 2008, 50, 79–83. [Google Scholar] [CrossRef]
- Ritter, C.; Pankrats, A.; Gudim, I.; Vorotynov, A. Determination of the Magnetic Structure of SmFe3(BO3)4 by Neutron Diffraction: Comparison with Other RFe3(BO3)4 Iron Borates. J. Phys. Condens. Matter 2012, 24, 386002. [Google Scholar] [CrossRef]
- Ritter, C.; Balaev, A.; Vorotynov, A.; Petrakovskii, G.; Velikanov, D.; Temerov, V.; Gudim, I. Magnetic Structure, Magnetic Interactions and Metamagnetism in Terbium Iron Borate TbFe3(BO3)4: A Neutron Diffraction and Magnetization Study. J. Phys. Condens. Matter 2007, 19, 196227. [Google Scholar] [CrossRef]
- Pankrats, A.I.; Demidov, A.A.; Ritter, C.; Velikanov, D.A.; Semenov, S.V.; Tugarinov, V.I.; Temerov, V.L.; Gudim, I.A. Transformation from an Easy-Plane to an Easy-Axis Antiferromagnetic Structure in the Mixed Rare-Earth Ferroborates PrxY1-XFe3(BO3)4: Magnetic Properties and Crystal Field Calculations. J. Phys. Condens. Matter 2016, 28, 96001. [Google Scholar] [CrossRef]
- Ritter, C.; Vorotynov, A.; Pankrats, A.; Petrakovskii, G.; Temerov, V.; Gudim, I.; Szymczak, R. Magnetic Structure in Iron Borates RFe3(BO3)4 (R = Y, Ho): A Neutron Diffraction and Magnetization Study. J. Phys. Condens. Matter 2008, 20, 365209. [Google Scholar] [CrossRef]
- Frolov, K.V.; Lyubutin, I.S.; Alekseeva, O.A.; Smirnova, E.S.; Verin, I.A.; Temerov, V.L.; Bezmaternykh, L.N.; Gudim, I.A.; Artemov, V.V.; Dmitrieva, T.V. Dynamics of Structural and Magnetic Phase Transitions in Ferroborate YFe3(BO3)4. J. Alloys Compd. 2018, 748, 989–994. [Google Scholar] [CrossRef]
- Kadomtseva, A.M.; Kuvardin, A.V.; Pyatakov, A.P.; Zvezdin, A.K.; Vorob’ev, G.P.; Popov, Y.F.; Bezmaternykh, L.N. Magnetic Magnetoelectric and Magnetoelastic Properties of New Multiferroic Material NdFe3(BO3)4. arXiv 2006, arXiv:cond-mat/0607217. [Google Scholar] [CrossRef]
- Janoschek, M.; Fischer, P.; Schefer, J.; Roessli, B.; Pomjakushin, V.; Meven, M.; Petricek, V.; Petrakovskii, G.; Bezmaternikh, L. Single Magnetic Chirality in the Magnetoelectric NdFe3( 11BO3)4. Phys. Rev. B-Condens. Matter Mater. Phys. 2010, 81, 094429. [Google Scholar] [CrossRef] [Green Version]
- Fischer, P.; Pomjakushin, V.; Sheptyakov, D.; Keller, L.; Janoschek, M.; Roessli, B.; Schefer, J.; Petrakovskii, G.; Bezmaternikh, L.; Temerov, V.; et al. Simultaneous Antiferromagnetic Fe3+ and Nd3+ Ordering in NdFe3(11BO3)4. J. Phys. Condens. Matter 2006, 18, 7975–7989. [Google Scholar] [CrossRef]
- Partzsch, S.; Hamann-Borrero, J.E.; Mazzoli, C.; Herrero-Martin, J.; Valencia, S.; Feyerherm, R.; Dudzik, E.; Vasiliev, A.; Bezmaternykh, L.; Büchner, B.; et al. Control of Coexisting Magnetic Phases by Electric Fields in NdFe3(BO3)4. Phys. Rev. B 2016, 94, 054421. [Google Scholar] [CrossRef]
- Kharlamova, S.A.; Ovchinnikov, S.G.; Balaev, A.D.; Thomas, M.F.; Lyubutin, I.S.; Gavriliuk, A.G. Spin Reorientation Effects in GdFe3(BO3)4 Induced by Applied Field and Temperature. J. Exp. Theor. Phys. 2005, 101, 1098–1105. [Google Scholar] [CrossRef]
- Popova, E.A.; Tristan, N.; Hess, C.; Klingeler, R.; Büchner, B.; Bezmaternykh, L.N.; Temerov, V.L.; Vasil’Ev, A.N. Magnetic and Thermal Properties of Single-Crystal NdFe3(BO3)4. J. Exp. Theor. Phys. 2007, 105, 105–107. [Google Scholar] [CrossRef]
- Chaudhury, R.P.; Yen, F.; Lorenz, B.; Sun, Y.Y.; Bezmaternykh, L.N.; Temerov, V.L.; Chu, C.W. Magnetoelectric Effect and Spontaneous Polarization in HoFe3(BO3)4 and Ho0.5 Nd0.5 Fe3(BO3)4. Phys. Rev. B-Condens. Matter Mater. Phys. 2009, 80, 104424. [Google Scholar] [CrossRef]
- Bezmaternykh, L.N.; Kharlamova, S.A.; Temerov, V.L. Flux Crystallization of Trigonal GdFe3(BO3)4 Competing with the Crystallization of α-Fe2O3. Crystallogr. Rep. 2004, 49, 855–857. [Google Scholar] [CrossRef]
- Gudim, I.A.; Eremin, E.V.; Temerov, V.L. Flux Growth and Spin Reorientation in Trigonal Nd1−xDyxFe3(BO3)4 Single Crystals. J. Cryst. Growth 2010, 312, 2427–2430. [Google Scholar] [CrossRef]
- Eremin, E.; Gudim, I.; Temerov, V.; Smolyakov, D.; Molokeev, M. Comparing the Magnetic and Magnetoelectric Properties of the SmFe3(BO3)4 Ferroborate Single Crystals Grown Using Different Solvents. J. Cryst. Growth 2019, 518, 1–4. [Google Scholar] [CrossRef]
- Smirnova, E.S.; Alekseeva, O.A.; Dudka, A.P.; Khmelenin, D.N.; Frolov, K.V.; Lyubutina, M.V.; Gudim, I.A.; Lyubutin, I.S. Crystal Structure and Structural Phase Transition in Bis-muth-Containing HoFe3(BO3)4 in the Temperature Range 11–500 K. Acta Crystallogr. Sect. B Struct. Sci. Cryst. Eng. Mater. 2019, 75, 954–968. [Google Scholar] [CrossRef]
- Smirnova, E.S.; Alekseeva, O.A.; Dudka, A.P.; Verin, I.A.; Artemov, V.V.; Bezmaternykh, L.N.; Gudim, I.A.; Frolov, K.V.; Lyubutin, I.S. Structure of Gd0.95Bi0.05Fe3(BO3)4 Single Crystals at 293 and 90 K. Crystallogr. Rep. 2016, 61, 558–565. [Google Scholar] [CrossRef]
- Smirnova, E.S.; Alekseeva, O.A.; Dudka, A.P.; Verin, I.A.; Artemov, V.V.; Lyubutina, M.V.; Gudim, I.A.; Frolov, K.V.; Lyubutin, I.S. Crystal Structure of Bismuth-Containing NdFe3(BO3)4 in the Temperature Range 20–500 K. Acta Crystallogr. Sect. B: Struct. Sci. Cryst. Eng. Mater. 2022, 78, 1–13. [Google Scholar] [CrossRef]
- Smirnova, E.S.; Alekseeva, O.A.; Dudka, A.P.; Artemov, V.V.; Zubavichus, Y.V.; Gudim, I.A.; Bezmaterhykh, L.N.; Frolov, K.V.; Lyubutin, I.S. Crystal Structure, Phase Transition and Structural Deformations in Iron Borate (Y0.95Bi0.05)Fe3(BO3)4 in the Temperature Range 90–500 K. Acta Crystallogr. Sect. B Struct. Sci. Cryst. Eng. Mater. 2018, 74, 226–238. [Google Scholar] [CrossRef]
- Smirnova, E.S.; Alekseeva, O.A.; Dudka, A.P.; Sorokin, T.A.; Khmelenin, D.N.; Yapaskurt, V.O.; Lyubutina, M.V.; Frolov, K.V.; Lyubutin, I.S.; Gudim, I.A. Crystal Structure, Absolute Configuration and Characteristic Temperatures of SmFe3(BO3)4 in the Temperature Range 11–400 K. Acta Crystallogr. Sect. B Struct. Sci. Cryst. Eng. Mater. 2022, 78, 546–556. [Google Scholar] [CrossRef]
- Popova, M.N.; Malkin, B.Z.; Boldyrev, K.N.; Stanislavchuk, T.N.; Erofeev, D.A.; Temerov, V.L.; Gudim, I.A. Evidence for a Collinear Easy-Plane Magnetic Structure of Multiferroic EuF E3(BO3)4: Spectroscopic and Theoretical Studies. Phys. Rev. B 2016, 94, 184418. [Google Scholar] [CrossRef]
- Popov, Y.F.; Pyatakov, A.P.; Kadomtseva, A.M.; Vorob’ev, G.P.; Zvezdin, A.K.; Mukhin, A.A.; Ivanov, V.Y.; Gudim, I.A. Peculiarities in the Magnetic, Magnetoelectric, and Magnetoelastic Properties of SmFe3(BO3)4 Multiferroic. J. Exp. Theor. Phys. 2010, 111, 199–203. [Google Scholar] [CrossRef]
- Popova, M.N.; Chukalina, E.P.; Boldyrev, K.N.; Stanislavchuk, T.N.; Malkin, B.Z.; Gudim, I.A. Spectroscopy of F-f Transitions, Crystal-Field Calculations, and Magnetic and Quadrupole Helix Chirality in DyF E3(BO3)4. Phys. Rev. B 2017, 95, 125131. [Google Scholar] [CrossRef]
- Hinatsu, Y.; Doi, Y.; Ito, K.; Wakeshima, M.; Alemi, A. Magnetic and Calorimetric Studies on Rare-Earth Iron Borates LnFe 3(BO3)4 (Ln = Y, La-Nd, Sm-Ho). J. Solid State Chem. 2003, 172, 438–445. [Google Scholar] [CrossRef]
- Fausti, D.; Nugroho, A.A.; van Loosdrecht, P.H.M.; Klimin, S.A.; Popova, M.N.; Bezmaternykh, L.N. Raman Scattering from Phonons and Magnons in RFe3(BO3)4. Phys. Rev. B 2006, 74, 024403. [Google Scholar] [CrossRef]
- Frolov, K.V.; Lyubutin, I.S.; Smirnova, E.S.; Alekseeva, O.A.; Verin, I.A.; Artemov, V.V.; Kharlamova, S.A.; Bezmaternykh, L.N.; Gudim, I.A. Low-Temperature Structural and Magnetic Phase Transitions in Multiferroic GdFe3(BO3)4. J. Alloys Compd. 2016, 671, 545–551. [Google Scholar] [CrossRef]
- Campá, J.A.; Cascales, C.; Gutiérrez-Puebla, E.; Monge, M.A.; Rasines, I.; Ruíz-Valero, C. Crystal Structure, Magnetic Order, and Vibrational Behavior in Iron Rare-Earth Borates. Chem. Mater. 1997, 9, 237–240. [Google Scholar] [CrossRef]
- Klimin, S.A.; Fausti, D.; Meetsma, A.; Bezmaternykh, L.N.; van Loosdrecht, P.H.M.; Palstra, T.T.M. Evidence for Differentiation in the Iron-Helicoidal Chain in GdFe3(BO3)4. Acta Crystallogr. Sect. B Struct. Sci. 2005, 61, 481–485. [Google Scholar] [CrossRef]
- Frolov, K.V.; Alekseeva, O.A.; Lyubutin, I.S.; Ksenofontov, V.; Smirnova, E.S.; Temerov, V.L.; Gudim, I.A.; Lyubutina, M.A. Structural and Magnetic Phase Transitions in the Multiferroic HoFe3(BO3)4 Detected by Mössbauer Spectroscopy and X-ray Diffraction. JETP 2022, 135. [Google Scholar]
- Popova, M.N.; Chukalina, E.P.; Erofeev, D.A.; Gudim, I.A.; Golosovsky, I.V.; Gukasov, A.; Mukhin, A.A.; Malkin, B.Z. High-Resolution Optical Spectroscopy, Magnetic Properties, and Single-Crystal Neutron Diffraction of Multiferroic HoFe3(BO3)4: Magnetic Structure. Phys. Rev. B 2021, 103, 094411. [Google Scholar] [CrossRef]
- Golosovsky, I.V.; Mukhin, A.A.; Skumryev, V.; Boehm, M.; Schmidt, W.; Regnault, L.P.; Gudim, I.A. Magnetic Excitations and Exchange Interactions in the Substituted Multiferroics (Nd, Tb)Fe3(BO3)4 Revealed by Inelastic Neutron Scattering. Phys. Rev. B 2021, 103, 214412. [Google Scholar] [CrossRef]
- Klimin, S.A.; Kuzmenko, A.B.; Kashchenko, M.A.; Popova, M.N. Infrared Study of Lattice Dynamics and Spin-Phonon and Electron-Phonon Interactions in Multiferroic TbFe3(BO3)4 and GdFe3(BO3)4. Phys. Rev. B 2016, 93, 054304. [Google Scholar] [CrossRef]
- Platunov, M.; Kazak, N.; Dudnikov, V.; Wilhelm, F.; Hen, A.; Diadkin, V.; Dovgaliuk, I.; Bosak, A.; Temerov, V.; Gudim, I.; et al. Probing Magnetic Sublattices in Multiferroic Ho0.5Nd0.5Fe3(BO3)4 Single Crystal Using X-ray Magnetic Circular Dichroism. arXiv 2018, arXiv:1804.07057v1. [Google Scholar] [CrossRef]
- CrysAlisPro Software System; Version 1.171.41.104a; Rigaku Corporation: Wroclaw, Poland, 2021; Available online: http://www.rigaku.com (accessed on 25 August 2022).
- Petrícek, V.; Dušek, M.; Palatinus, L. Crystallographic Computing System JANA2006: General Features. Z. Fur Krist. 2014, 229, 345–352. [Google Scholar] [CrossRef]
- Stoiber, D.; Niewa, R. PolyDis: Simple Quantification Tool for Distortion of Polyhedra in Crystalline Solids. Z. Für Krist.-Cryst. Mater. 2019, 234, 201–209. [Google Scholar] [CrossRef]
- Naumov, P.G.; Lyubutin, I.S.; Frolov, K.V.; Demikhov, E.I. A Closed-Cycle Cryostat for Optical and Mössbauer Spectroscopy in the Temperature Range 4.2–300 K. Instrum. Exp. Tech. 2010, 53, 770–776. [Google Scholar] [CrossRef]
- Available online: https://ritverc.com (accessed on 25 August 2022).
- Lagarec, K.; Rancourt, D.G. Recoil−Mössbauer Spectral Analysis Software for Windows 1998. Available online: https://denisrancourt.ca/page.php?id=10&name=recoil_ms (accessed on 25 August 2022).
- Matsnev, M.E.; Rusakov, V.S. SpectrRelax: An Application for Mössbauer Spectra Modeling and Fitting. AIP Conf. Proc. 2012, 178, 1489. [Google Scholar]
- Aroyo, M.I. (Ed.) International Tables for Crystallography; International Union of Crystallography: Chester, UK, 2016; Volume 1, ISBN 978-0-470-97423-0. [Google Scholar]
- Bubnova, R.S.; Filatov, S.K. Self-Assembly and High Anisotropy Thermal Expansion of Compounds Consisting of TO3 Triangular Radicals. Struct. Chem. 2016, 27, 1647–1662. [Google Scholar] [CrossRef]
- Zhang, H.; Liu, S.; Nelson, C.S.; Bezmaternykh, L.N.; Chen, Y.S.; Wang, S.G.; Lobo, R.P.S.M.; Page, K.; Matsuda, M.; Pajerowski, D.M.; et al. Structural Features Associated with Multiferroic Behavior in the RX3(BO3)4 System. J. Phys. Condens. Matter 2019, 31, 505704. [Google Scholar] [CrossRef]
- Gagné, O.C. Bond-Length Distributions for Ions Bonded to Oxygen: Results for the Lanthanides and Actinides and Discussion of the f-Block Contraction: Results. Acta Crystallogr. Sect. B Struct. Sci. Cryst. Eng. Mater. 2018, 74, 49–62. [Google Scholar] [CrossRef]
- Gagné, O.C.; Hawthorne, F.C. Bond-Length Distributions for Ions Bonded to Oxygen: Results for the Transition Metals and Quantification of the Factors Underlying Bond-Length Variation in Inorganic Solids. IUCrJ 2020, 7, 581–629. [Google Scholar] [CrossRef]
- Gagné, O.C.; Hawthorne, F.C. Bond-Length Distributions for Ions Bonded to Oxygen: Metalloids and Post-Transition Metals: Metalloids. Acta Crystallogr. Sect. B Struct. Sci. Cryst. Eng. Mater. 2018, 74, 63–78. [Google Scholar] [CrossRef]
- Frolov, K.V.; Lyubutin, I.S.; Alekseeva, O.A.; Smirnova, E.S.; Dudka, A.P.; Verin, I.A.; Temerov, V.L.; Gudim, I.A. Magnetic Properties and Structural Anomalies Observed in Multiferroic NdFe3(BO3)4 by 57Fe Mossbauer Spectroscopy. J. Alloys Compd. 2022, 909, 164747. [Google Scholar] [CrossRef]
- Gütlich, P.; Bill, E.; Trautwein, A.X. Mössbauer Spectroscopy and Transition Metal Chemistry; Springer: Berlin/Heidelberg, Germany, 2011; ISBN 978-3-540-88427-9. [Google Scholar]
- Herber, R.H. (Ed.) Chemical Mossbauer Spectroscopy; Plenum: New York, NY, USA, 1984. [Google Scholar]
- Stanley, H.E. (Ed.) Introduction to Phase Transitions and Critical Phenomena; Clarendon Press: Oxford, UK, 1971. [Google Scholar]
- Renard, J.-P. Magnetic Phase Transitions in Low-Dimensional Systems. In Organic and Inorganic Low-Dimensional Crystalline Materials; Springer: New York, NY, USA, 1987; pp. 125–140. [Google Scholar]
- De Jongh, L.J. (Ed.) Magnetic Properties of Layered Transition Metal Compounds; Springer: Dordrecht, The Netherlands, 1990; Volume 9, ISBN 978-94-010-7329-5. [Google Scholar]
- Pankrats, A.I.; Petrakovskii, G.A.; Bezmaternykh, L.N.; Bayukov, O.A. Antiferromagnetic Resonance and Phase Diagrams of Gadolinium Ferroborate GdFe3(BO3)4. J. Exp. Theor. Phys. 2004, 99, 766–775. [Google Scholar] [CrossRef]
- Mo, H.; Nelson, C.S.; Bezmaternykh, L.N.; Temerov, V.T. Magnetic Structure of the Field-Induced Multiferroic GdFe3(BO3)4. Phys. Rev. B-Condens. Matter Mater. Phys. 2008, 78, 214407. [Google Scholar] [CrossRef] [Green Version]


| R1−xBix | Nd0.91Bi0.09 | Sm0.93Bi0.07 | Gd0.95Bi0.05 | Ho0.96Bi0.04 | Y0.95Bi0.05 |
|---|---|---|---|---|---|
| CSD | 2,176,633 | 2,176,635 | 2,176,631 | 2,176,634 | 2,176,632 |
| Space group | R32 | R32 | P3121 | P3221 | P3121 |
| a (Å) | 9.5835 (1) | 9.5647 (1) | 9.5395 (1) | 9.5132 (1) | 9.5126 (1) |
| c (Å) | 7.5959 (1) | 7.5819 (1) | 7.5592 (1) | 7.5379 (1) | 7.5422 (1) |
| V (Å3) | 604.17 (1) | 600.69 (1) | 595.74 (1) | 590.79 (1) | 591.05 (1) |
| Dx (Mg m−3) | 4.558 | 4.621 | 4.705 | 4.801 | 4.195 |
| µ (mm−1) | 13.10 | 13.66 | 14.38 | 15.89 | 13.53 |
| Crystal radius (mm) | 0.08 | 0.08 | 0.09 | 0.08 | 0.09 |
| No. of measured, independent and observed [I > 3σ(I)] reflections | 96,071, 2834, 2834 | 95,325, 2820, 2820 | 270,671, 8327, 7350 | 273,676, 8246, 8101 | 269,419, 8268, 7341 |
| No. of R32 sys. abs. observed [I > 3σ(I)] reflections, Average(I/Sig(I)) | 0, 0.45 | 0, 0.46 | 71,431, 3.49 | 129,171, 5.69 | 70,426, 3.76 |
| Rint | 0.039 | 0.044 | 0.077 | 0.076 | 0.111 |
| (sin θ/λ)max (Å−1) | 1.357 | 1.357 | 1.357 | 1.357 | 1.357 |
| R[F2 > 3σ(F2)], wR(F2), S | 0.008, 0.022, 1.01 | 0.008, 0.021, 1.04 | 0.019, 0.056, 1.08 | 0.015, 0.045, 1.05 | 0.021, 0.049, 1.09 |
| Δρmax, Δρmin (e Å−3) | 0.91, −1.50 | 0.90, −1.24 | 2.84, −2.35 | 2.33, −1.46 | 1.55, −1.64 |
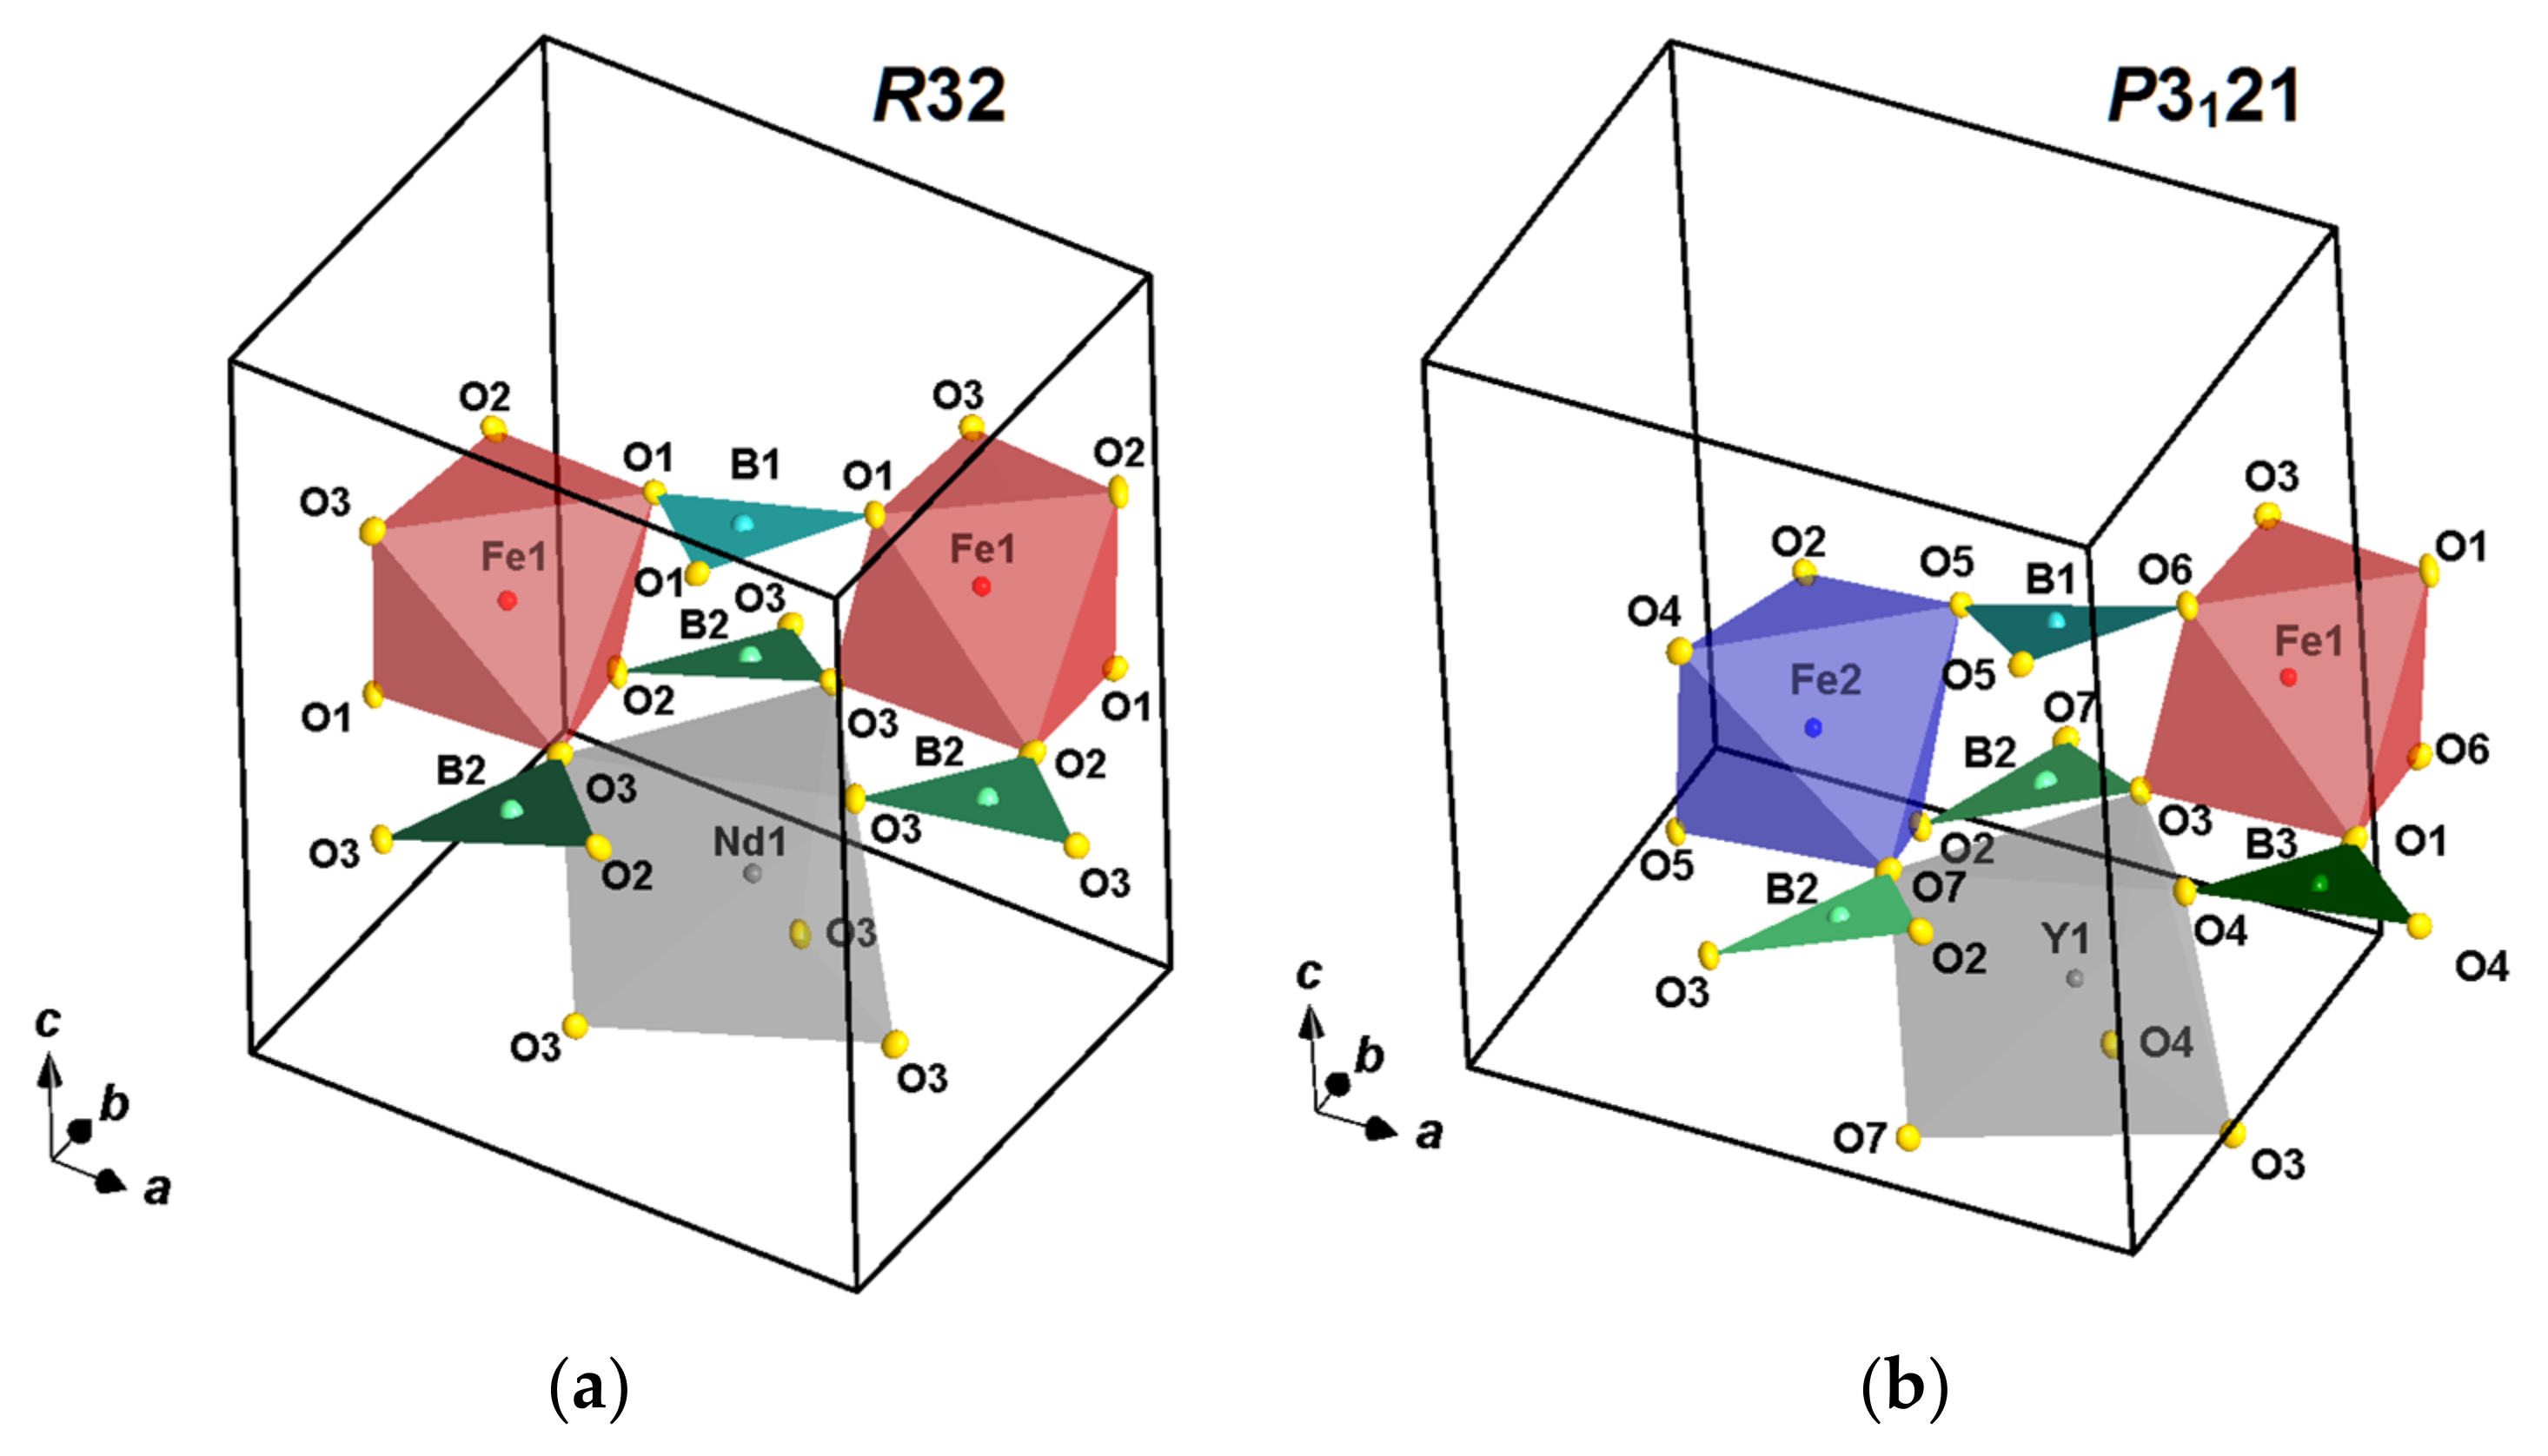
| HT Labels (Wycoff Position) | LT Labels (Wycoff Position) |
|---|---|
| R1 (3a) | R1 (3a) |
| Fe1 (9d) | Fe1 (3a) Fe2 (6c) |
| B1 (3b) | B1 (3b) |
| B2 (9e) | B2 (6c) B3 (3b) |
| O1 (9e) | O5 (6c) O6 (3b) |
| O2 (9e) | O1 (3b) O2 (6c) |
| O3 (18f) | O3 (6c) O4 (6c) O7 (6c) |
| Nd0.91Bi0.09Fe3(BO3)4 (HT Labels) | Y0.95Bi0.05Fe3(BO3)4 (LT Labels) | ||
|---|---|---|---|
| Intrachain Fe–Fe | |||
| Fe1–Fe1 | 3.1824(1) | Fe1–Fe1 Fe2–Fe2 | 3.1571(3) 3.1980(3) |
| Intrachain Fe–O–Fe | |||
| Fe1–O1–Fe1 (B1) Fe1–O2–Fe1 (B2) | 2.0270(3)–2.0270(3) [4.054] 2.0462(4)–2.0462(4) [4.0924] | Fe2–O5–Fe2 (B1) Fe2–O2–Fe2 (B2) Fe1–O6–Fe1 (B1) Fe1–O1–Fe1 (B3) | 2.0232(5)–2.0151(6) [4.0464] 2.0392(7)–2.0603(4) [4.0995] 2.0010(5)–2.0010(5) [ 4.002] 2.0379(4)–2.0379(4) [4.0758] |
| Interchain Fe–O–Fe | |||
| Fe1–O1–O1–Fe1 (B1) Fe1–O2–O3–Fe1 (B2) Fe1–O3–O3–Fe1 (B2) | 2.0270(3)–2.3943(6)–2.0270(3) [6.4483] 2.0462(4)–2.3558(5)– 1.9585(3) [6.3605] 1.9585(3)–2.4208(7)–1.9585(3) [6.3378 ] | Fe2–O4–O1–Fe1 (B3) Fe2–O5–O6–Fe1 (B1) Fe2–O7–O3–Fe1 (B2) Fe2–O5’–O6’–Fe1 (B1) Fe2–O2–O3–Fe1 (B2) Fe2–O2’–O3’–Fe1 (B2) Fe2–O4–O4–Fe2 (B3) Fe2–O5–O5–Fe2 (B3) Fe2–O5–O5–Fe2’ (B1) Fe2–O7–O2–Fe2 (B2) Fe2–O7–O2–Fe2’ (B2) Fe2–O5’–O5’–Fe2 (B1) Fe1–O3–O4–Fe2 (direct) | 1.9666(5)–2.3540(7)–2.0379(4) [6.3585] 2.0151(5)–2.3737(7)–2.0010(5) [6.3898] 1.9832(6)–2.4266(7)–1.9626(5) [6.3724] 2.0232(4)–2.3737(8)–2.0010(5) [6.3979] 2.0603(5)–2.3233(7)–1.9626(5) [6.3462] 2.0393(6)–2.3233(9)–1.9626(5) [6.3252] 1.9666(5)–2.4492(10)–1.9666(5) [6.3824] 2.0151(5)–2.4046(7)–2.0232(6) [6.4429] 2.0151(5)–2.4046(7)–2.0151(5) [6.4348] 1.9832(6)–2.3773(9)–2.0393(4) [6.3998] 1.9832(6)–2.3773(9)–2.0603(5) [6.4208] 2.0232(4)–2.4046(9)–2.0232(4) [6.451] 1.9626(5)–2.7800(7)–1.9666(5) [ 6.7092] |
| Fe–O–R, Fe–O–R–O–Fe | |||
| Fe1–O3–R (B2) Fe1–O3–O3–R (B2) | 1.9585(3)–2.3976(4) [4.3561] 1.9585(3)–2.4208(7)–2.3976(4) [6.7769] | Fe2–O4–R (B3) Fe2–O7–R (B2) Fe2–O2–R (B2) Fe2–O2’–R (B2) Fe2–O4–O4–R (B3) Fe2–O7–O3–R (B2) Fe2–O7–O2–R (B2) Fe2–O2–O3–R (B2) Fe2–O2–O7–R (B2) Fe2–O2’–O3–R (B2) Fe2–O2’–O7–R (B2) Fe1–O3–R (B2) Fe1–O3–O2–R (B2) Fe1–O3–O7–R (B2) Fe1–O1–O4–R (B3) | 1.9666(5)–2.3819(6) [4.3485] 1.9832(6)–2.3175(4) [4.3007] 2.0603(5)–2.8180(6) [4.8783] 2.0393(6)–2.8180(5) [4.8573] 1.9666(5)–2.4492(10)–2. 3819(6) [6.7977] 1.9832(6)–2.4266(7)–2.3248(6) [6.7346] 1.9832(6)–2.3773(9)–2.8180(4) [7.1785] 2.0603(5)–2.3233(7)–2.3248(6) [6.7084] 2.0603(5)–2.3773(9)–2.3175(6) [6.7551] 2.0393(6)–2.3233(9) –2.3248(4) [6.6874] 2.0393(6)–2.3773(7)–2.3175(6) [6.7341] 1.9626(6)–2.3248(4) [4.2874] 1.9626(6)–2.3233(9)–2.8180(6) [7.1039] 1.9626(6)– 2.4266(7)–2.3175(6) [6.7067] 2.0379(4)–2.3540(7)–2.3819(6) [6.7738] |
Publisher’s Note: MDPI stays neutral with regard to jurisdictional claims in published maps and institutional affiliations. |
© 2022 by the authors. Licensee MDPI, Basel, Switzerland. This article is an open access article distributed under the terms and conditions of the Creative Commons Attribution (CC BY) license (https://creativecommons.org/licenses/by/4.0/).
Share and Cite
Alekseeva, O.A.; Smirnova, E.S.; Frolov, K.V.; Lyubutina, M.V.; Lyubutin, I.S.; Gudim, I.A. Crystal Structure Dynamics of RFe3(BO3)4 Single Crystals in the Temperature Range 25–500 K. Crystals 2022, 12, 1203. https://doi.org/10.3390/cryst12091203
Alekseeva OA, Smirnova ES, Frolov KV, Lyubutina MV, Lyubutin IS, Gudim IA. Crystal Structure Dynamics of RFe3(BO3)4 Single Crystals in the Temperature Range 25–500 K. Crystals. 2022; 12(9):1203. https://doi.org/10.3390/cryst12091203
Chicago/Turabian StyleAlekseeva, Olga A., Ekaterina S. Smirnova, Kirill V. Frolov, Marianna V. Lyubutina, Igor S. Lyubutin, and Irina A. Gudim. 2022. "Crystal Structure Dynamics of RFe3(BO3)4 Single Crystals in the Temperature Range 25–500 K" Crystals 12, no. 9: 1203. https://doi.org/10.3390/cryst12091203
APA StyleAlekseeva, O. A., Smirnova, E. S., Frolov, K. V., Lyubutina, M. V., Lyubutin, I. S., & Gudim, I. A. (2022). Crystal Structure Dynamics of RFe3(BO3)4 Single Crystals in the Temperature Range 25–500 K. Crystals, 12(9), 1203. https://doi.org/10.3390/cryst12091203