
Effect of the Composition of the Ceramics (MCeMgSr)O2-δ (M = Y, Sm) on the Microstructure, Mechanical and Electrical Properties for Solid Electrolyte

Abstract
:1. Introduction
2. Materials and Methods
3. Results
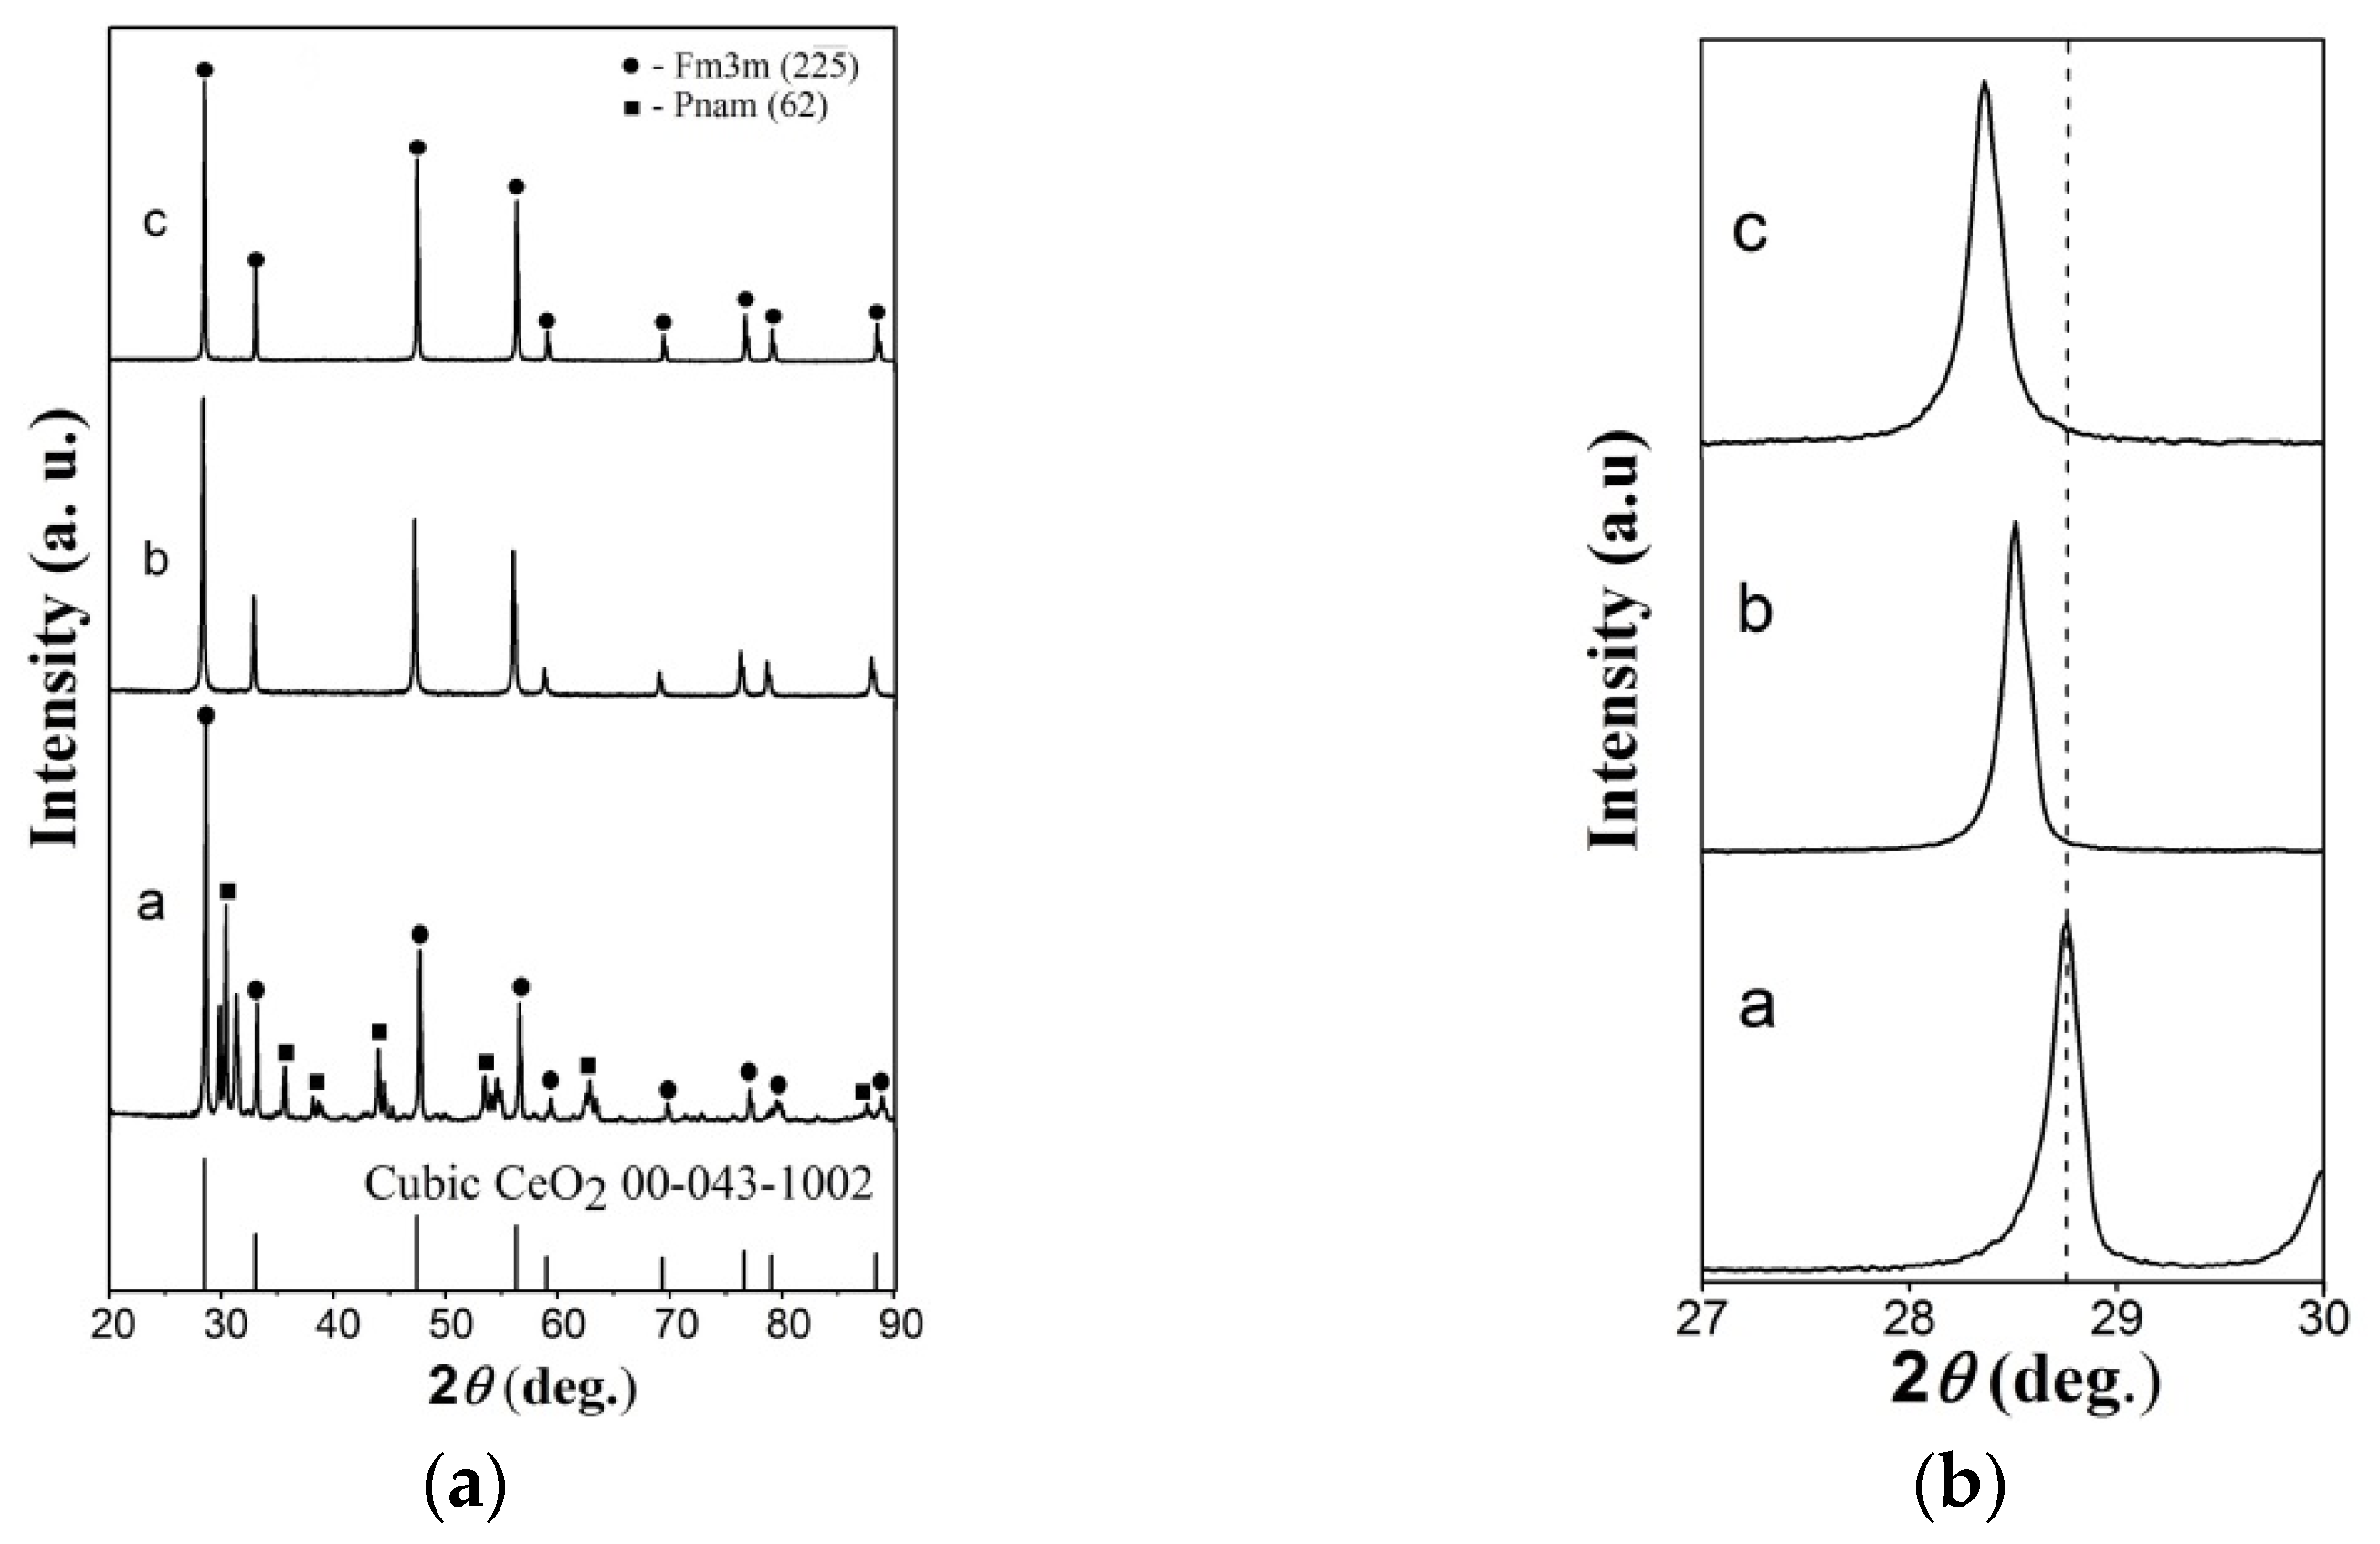
3.1. XRD Analysis
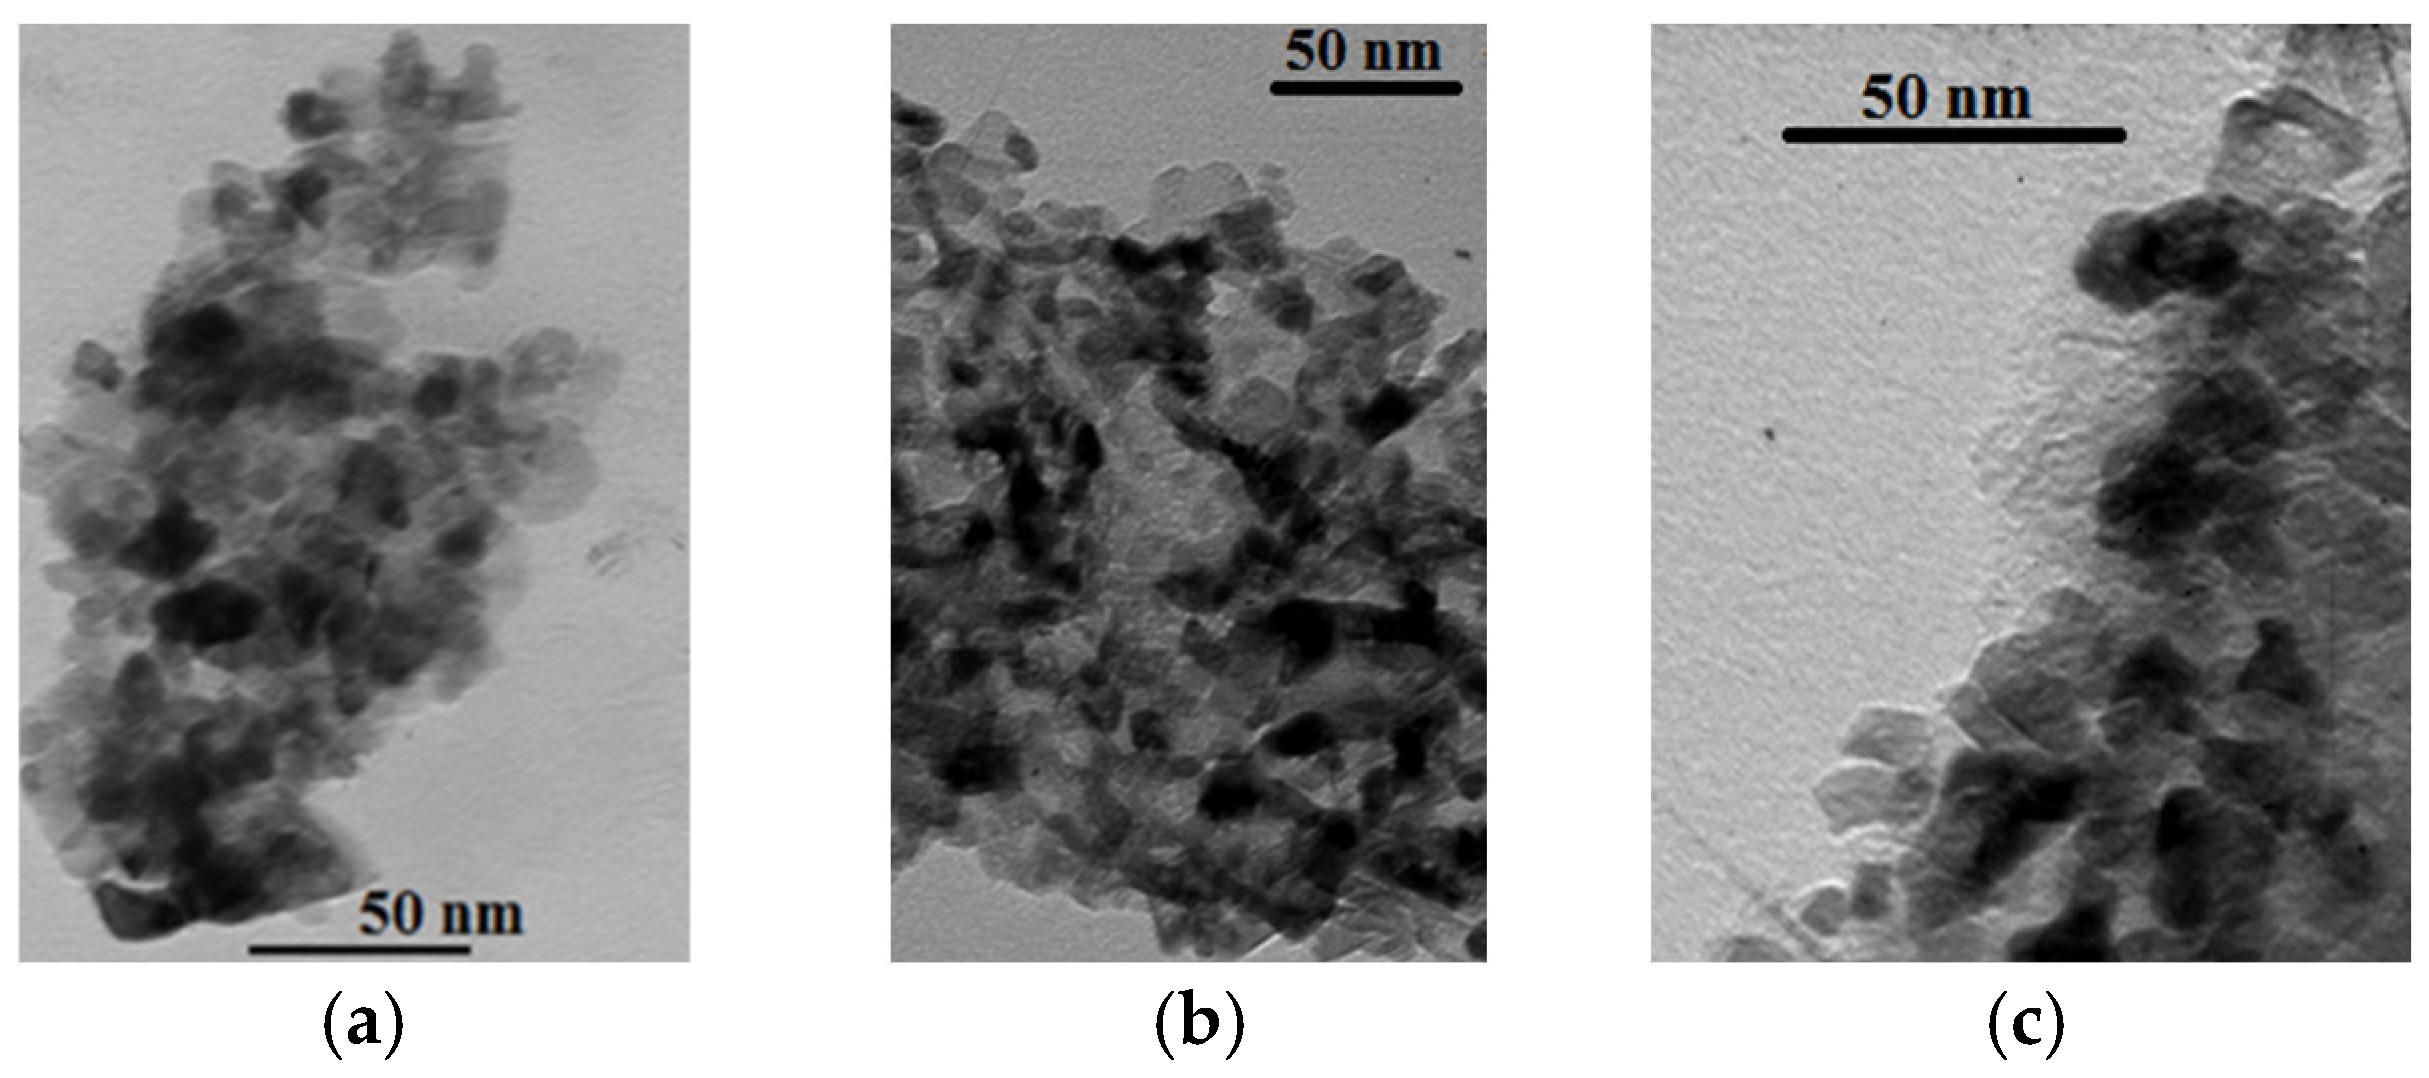
3.2. TEM Aanalysis
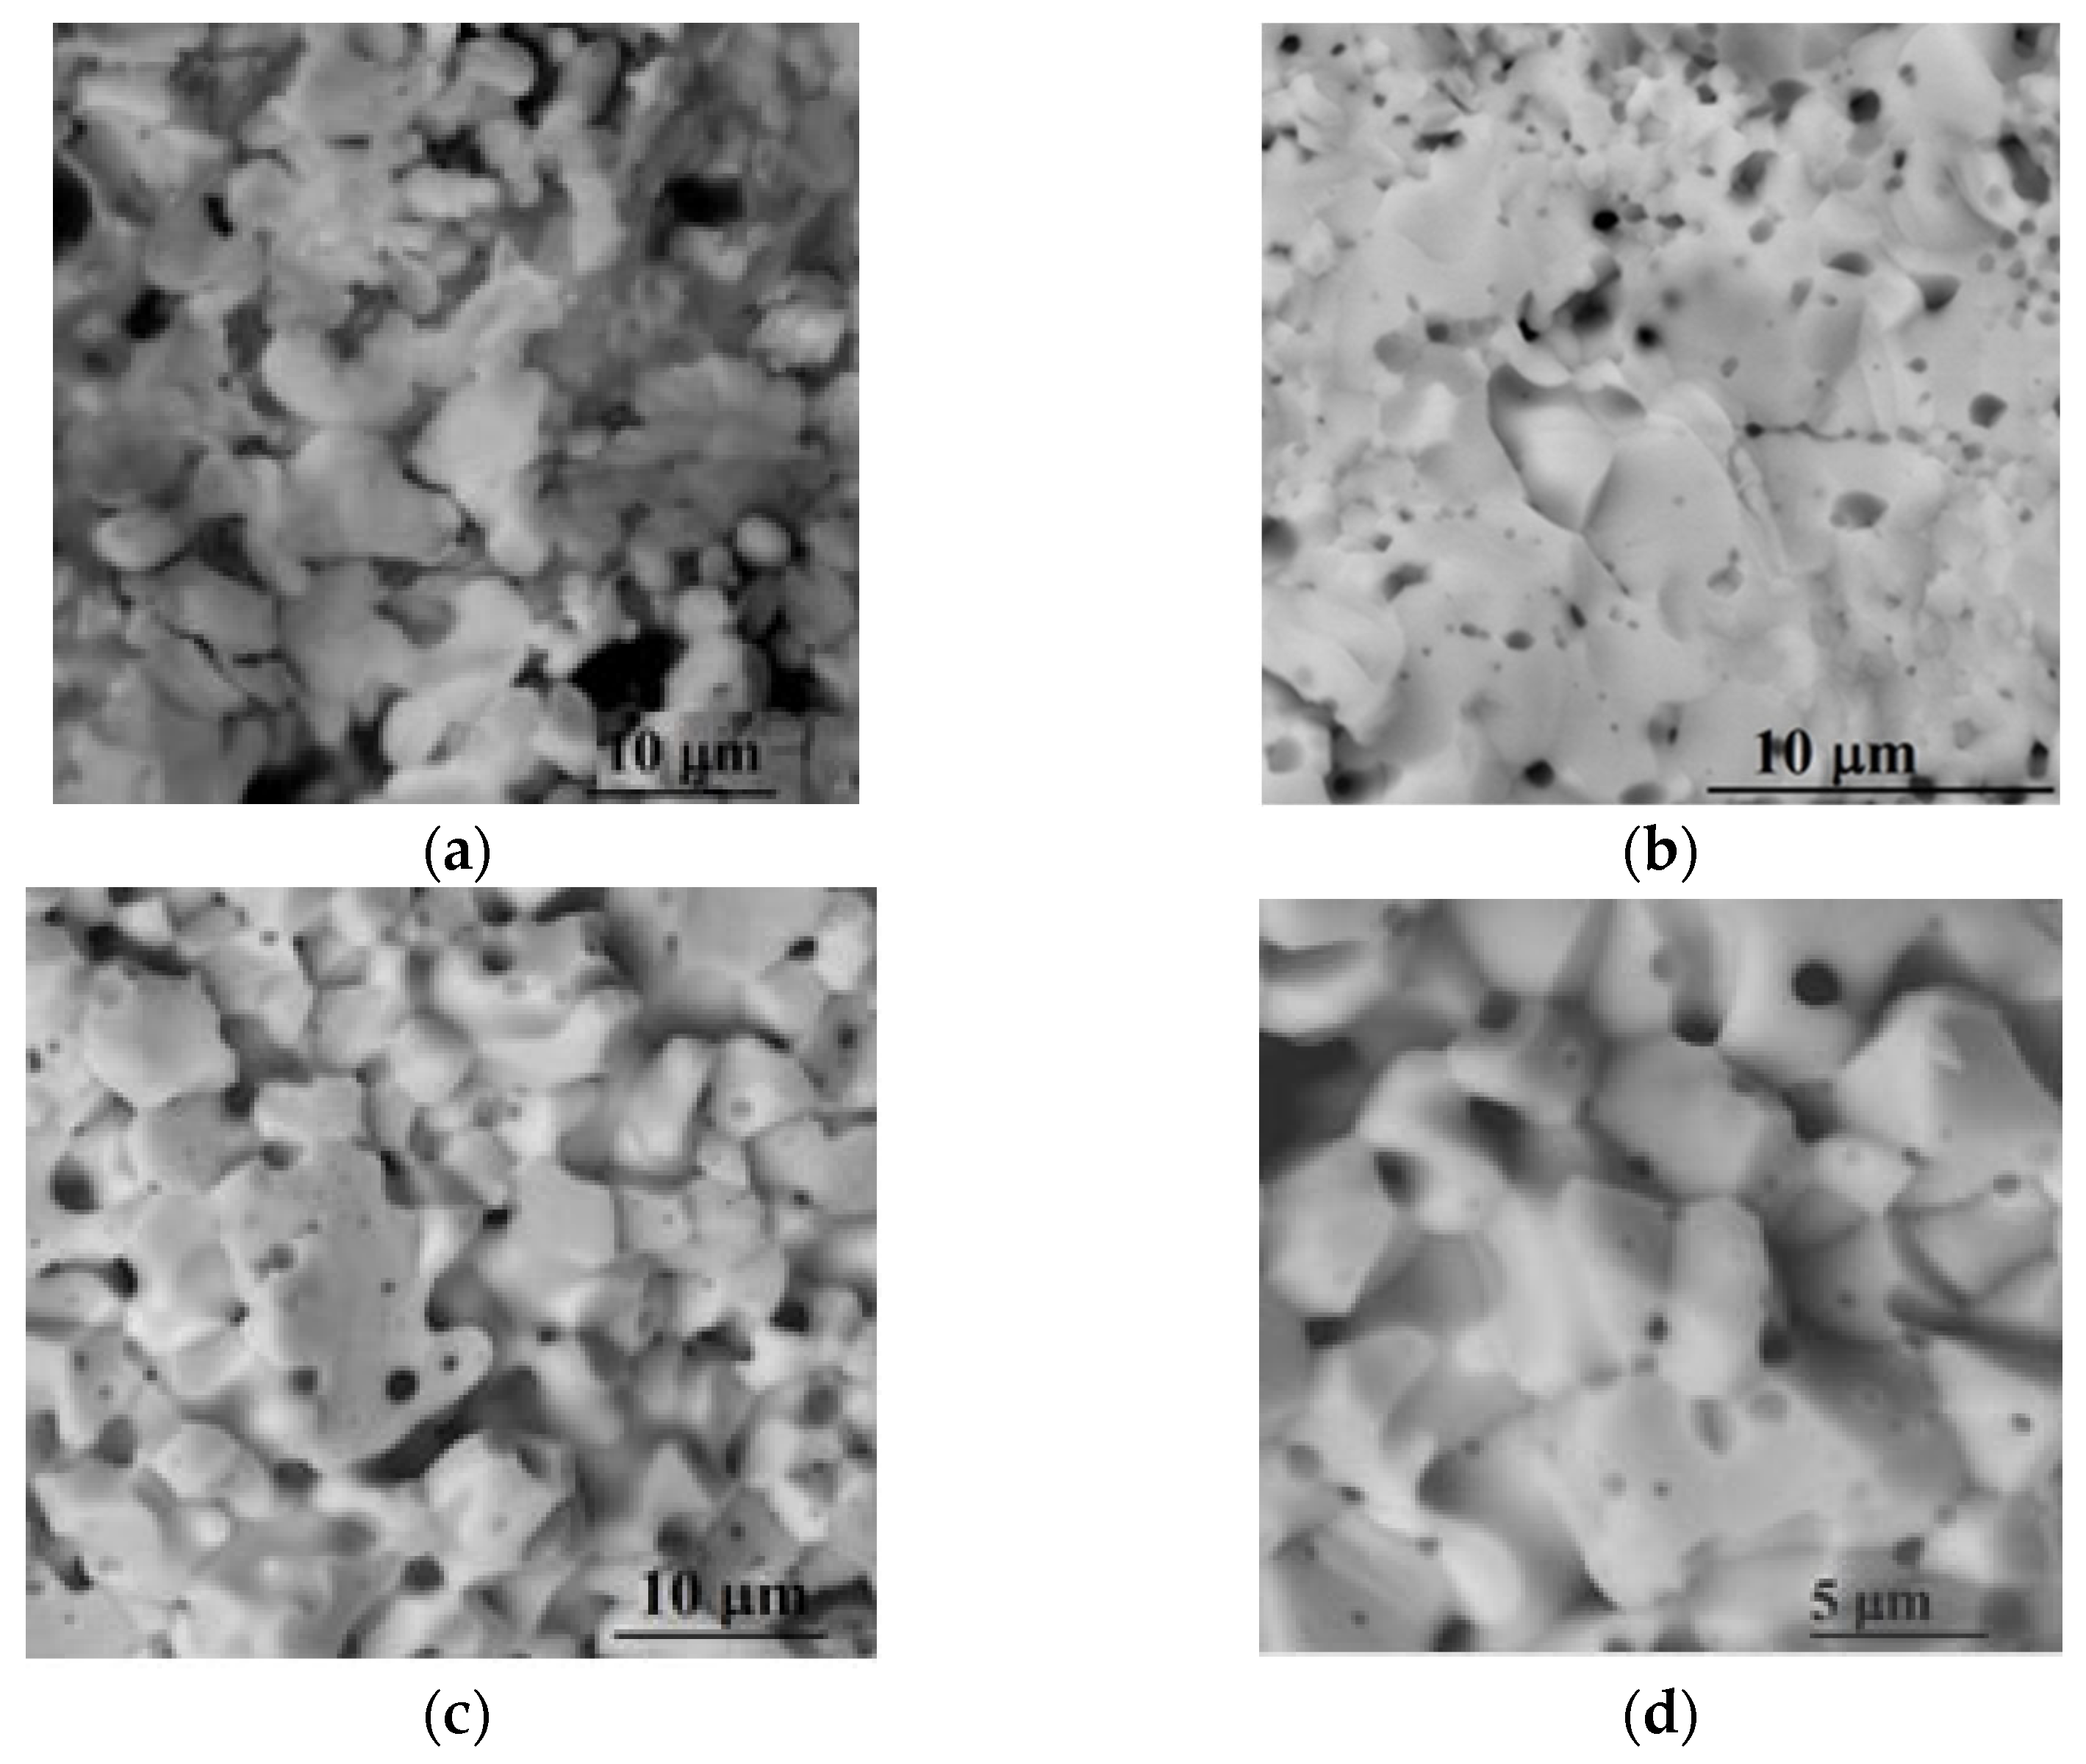
3.3. Microstructure
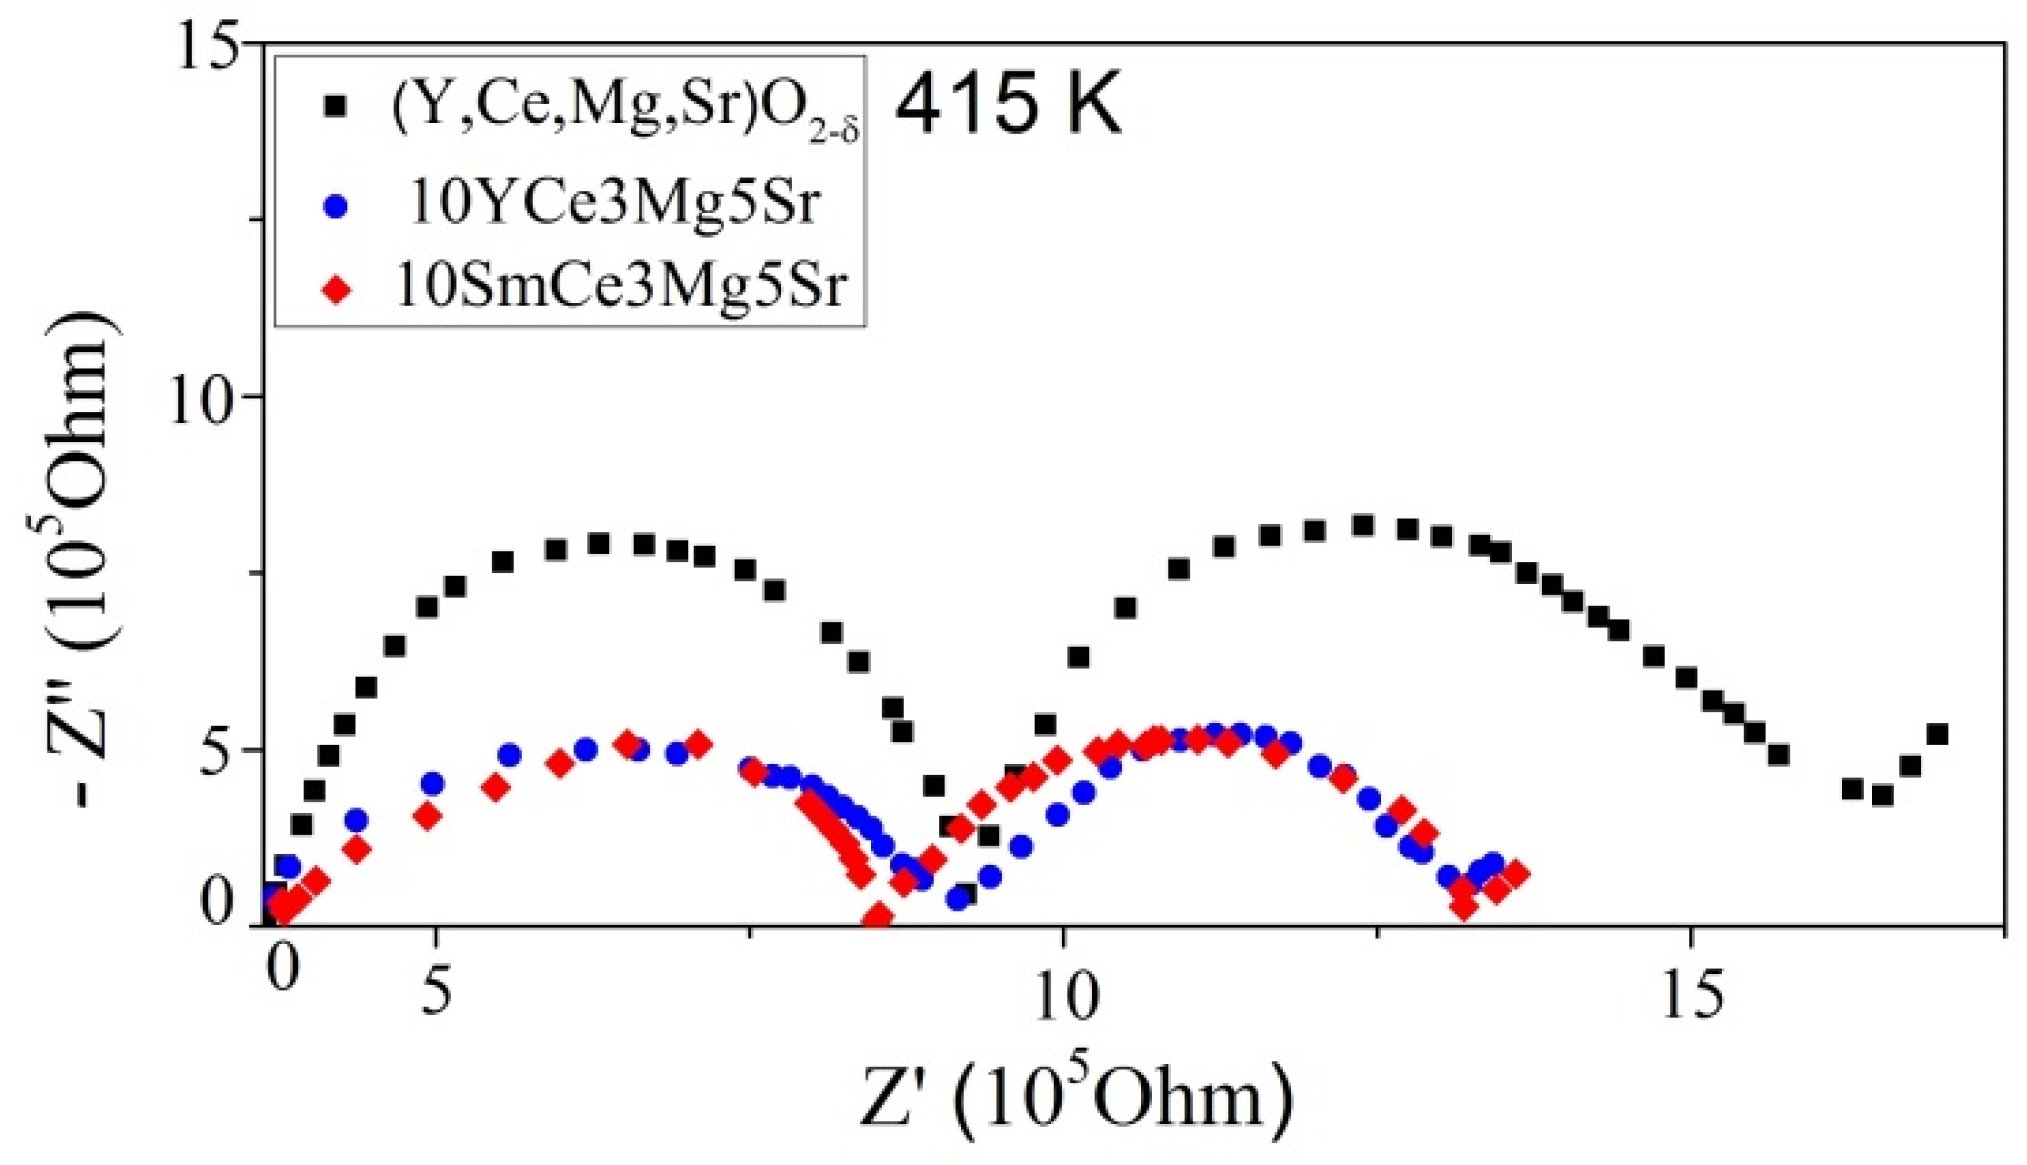
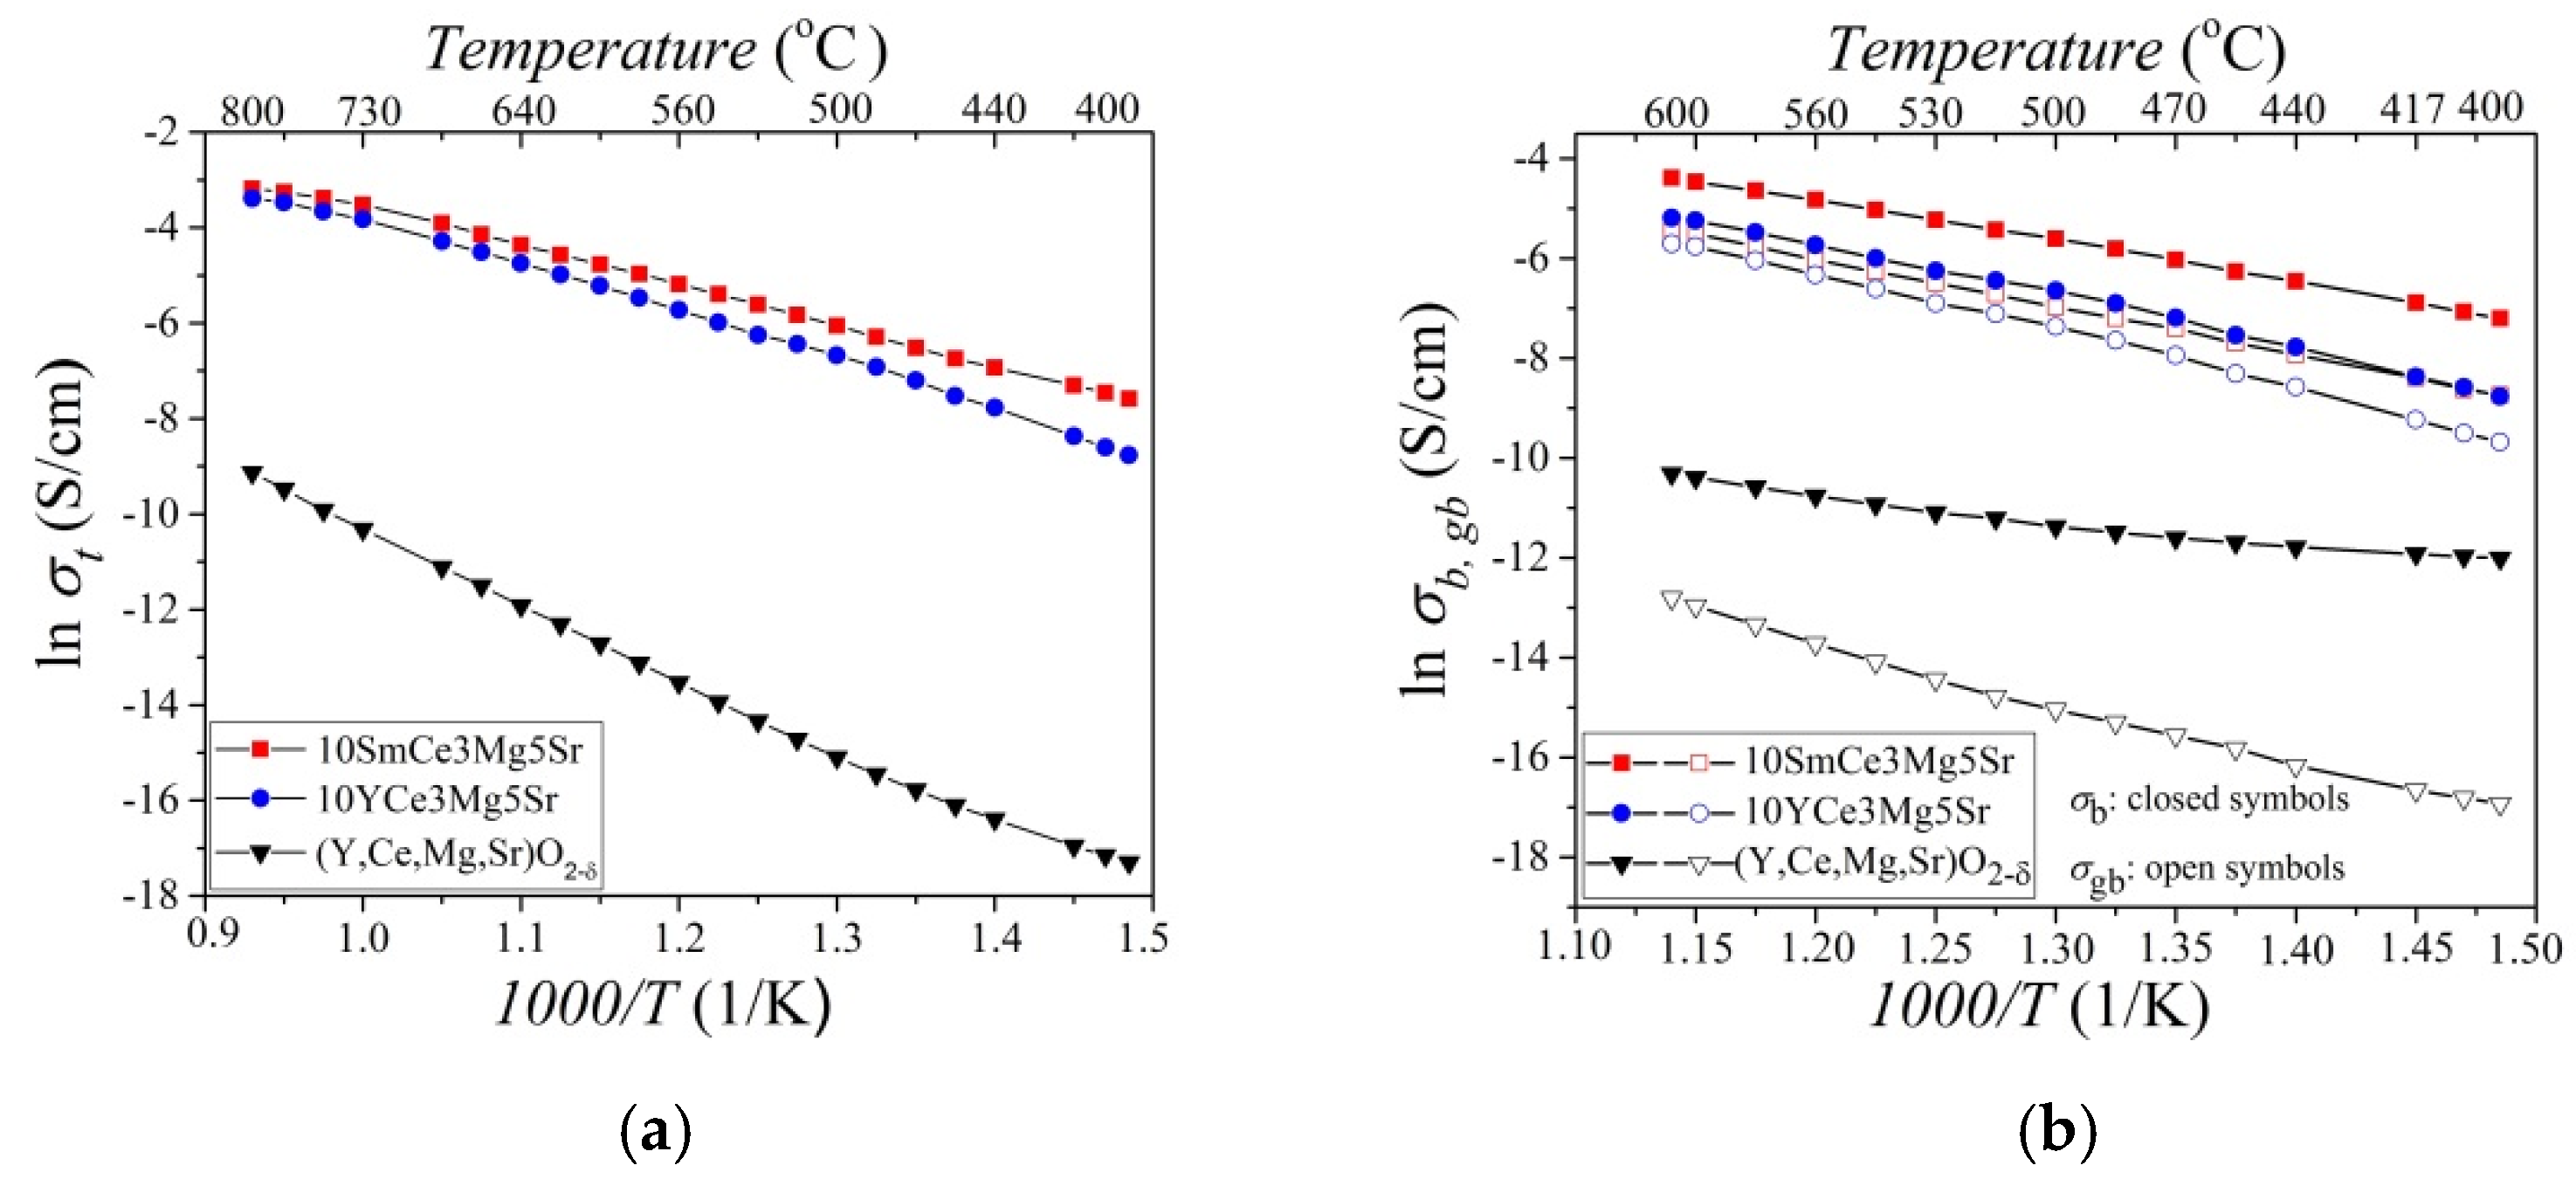
3.4. Electric Conductivity
4. Discussion
Author Contributions
Funding
Informed Consent Statement
Data Availability Statement
Conflicts of Interest
References
- Mahmud, L.S.; Muchtar, A.; Somalu, M.R. Challenges in fabricating planar solid oxide fuel cells: A review. Renew. Sustain. Energy Rev. 2017, 72, 105–116. [Google Scholar] [CrossRef]
- Singh, A.; Baredar, P.; Khare, H.; Kumar, A. Fuel cell: Fundamental, classification, application, and environmental impact. In Low Carbon Energy Supply; Sharma, A., Shukla, A., Aye, L., Eds.; Springer Nature Singapore: Singapore, 2018; pp. 363–385. Available online: https://link.springer.com/book/10.1007/978-981-10-7326-7 (accessed on 28 June 2022).
- Jaiswal, N.; Tanwa, K.; Suman, R.; Kumar, D.; Upadhyay, S.; Parkash, O. A brief review on ceria based solid electrolytes for solid oxide fuel cells. J. Alloys Compd. 2019, 781, 984–1005. [Google Scholar] [CrossRef]
- Shen, M.; Ai, F.; Ma, H.; Xu, H.; Zhang, Y. Progress and prospects of reversible solid oxide fuel cell materials. iScience 2021, 24, 103464. [Google Scholar] [CrossRef]
- Leng, Y.J.; Chan, S.H.; Khor, K.A.; Jiang, S.P. Performance evaluation of anode-supported solid oxide fuel cells with thin film YSZ electrolyte. Int. J. Hydrogen Energy 2004, 29, 1025–1033. [Google Scholar] [CrossRef]
- Etsell, T.N.; Flengas, S.N. The electrical properties of solid oxide electrolytes. Chem. Rev. 1970, 70, 339–376. [Google Scholar] [CrossRef]
- Tu, H.; Stimming, U. Advances, aging mechanisms and lifetime in solid-oxide fuel cells. J. Power Sources 2004, 127, 284–293. [Google Scholar] [CrossRef]
- Kharton, V.V.; Marques, F.M.B.; Atkinson, A. Transport properties of solid oxide electrolyte ceramics: A brief review. Solid State Ion. 2004, 174, 135–149. [Google Scholar] [CrossRef]
- Madhusudan, C.; Kasarapu, V.; Chittimadula, M.; Reddy, Y.S.; Reddy, C.V. Synthesis and characterization of Y and Dy co-doped ceria solid electrolytes for IT-SOFCs: A microwave sintering. Rate Met. 2021, 40, 3329–3336. [Google Scholar] [CrossRef]
- Liu, Z.; Ding, D.; Liu, M.; Ding, X.; Chen, D.; Li, X.; Xia, C.; Liu, M. High-performance, ceria-based solid oxide fuel cells fabricated at low temperatures. J. Power Sources 2013, 241, 454–459. [Google Scholar] [CrossRef]
- Ali, A.; Raza, R.; Ullah, M.K.; Rafique, A.; Wang, B.; Zhu, B. Alkaline earth metal and samarium co-doped ceria as efficient electrolytes. Appl. Phys. Lett. 2018, 112, 43902. [Google Scholar] [CrossRef]
- Venkatesh, V.; Redd, C.V. Thermal and electrical properties of Ce0.8-xPrxSm0.2O2-δ electrolyte materials for IT-SOFC application. Ionics 2017, 23, 3455–3467. [Google Scholar] [CrossRef]
- Fu, Y.-P.; Chen, S.-H.; Huang, J.-J. Preparation and characterization of Ce0.8M0.2O2-δ (M = Y, Gd, Sm, Nd, La) solid electrolyte materials for solid oxide fuel cells. Int. J. Hydrogen Energy 2010, 35, 745–752. [Google Scholar] [CrossRef]
- Wu, Y.C.; Lin, C.C. The microstructures and property analysis of aliovalent cations (Sm3+, Mg2+, Ca2+, Sr2+, Ba2+) co-doped ceria-base electrolytes after an aging treatment. Int. J. Hydrogen Energy 2014, 39, 7988–8001. [Google Scholar] [CrossRef]
- Puente-Martínez, D.E.; Díaz-Guillén, J.A.; Montemayor, S.M.; Díaz-Guillén, J.C.; Burciaga-Díaz, O.; Bazaldúa-Medellín, M.E.; Díaz-Guillén, M.R.; Fuentes, A.F. High ionic conductivity in CeO2 SOFC solid electrolytes; effect of Dy doping on their electrical properties. Int. J. Hydrogen Energy 2020, 45, 14062–14070. [Google Scholar] [CrossRef]
- Ramesh, S. Transport properties of Sm doped CeO2 ceramics. Process. Appl. Ceram. 2021, 15, 366–373. [Google Scholar] [CrossRef]
- Kang, J.; Feng, W.; Guo, D.; Chen, K.; Gao, S.; Jiang, J.; Lu, C.; Niu, B.; Wang, B. Performance optimization of Ca and Y co-doped CeO2-based electrolyte for intermediate-temperature solid oxide fuel cells. J. Alloys Compd. 2022, 913, 165317. [Google Scholar] [CrossRef]
- Momin, N.; Manjanna, J.; D’Souza, L.; Aruna, S.T.; Kumar, S.S. Synthesis, structure and ionic conductivity of nanocrystalline Ce1-xLaxO2-δ as an electrolyte for intermediate temperature solid oxide fuel cells. J. Alloys Compd. 2022, 896, 163012. [Google Scholar] [CrossRef]
- Ihaba, H.; Tagaw, H. Ceria-based solid electrolytes. Solid State Ion. 1996, 83, 1–16. [Google Scholar] [CrossRef]
- Zhang, J.; Lenser, C.; Menzler, N.H.; Guillon, O. Comparison of solid oxide fuel cell (SOFC) electrolyte materials for operation at 500 C. Solid State Ion. 2020, 344, 115138. [Google Scholar] [CrossRef]
- Shao, Z.; Tadé, M.O. Intermediate-Temperature Solid Oxide Fuel Cells: Materials and Applications, Green Chemistry and Sustainable Technology; Springer: Berlin/Heidelberg, Germany, 2016. [Google Scholar]
- Shannon, R.D. Revised Effective Ionic Radii and Systematic Studies of Interatomic Distances in Halides and Chaleogenides. Acta Cryst. 1976, 32, 751–767. [Google Scholar] [CrossRef]
- Yeh, T.-H.; Chou, C.-C. Ionic conductivity investigation in samarium and strontium co-doped ceria system. Phys. Scr. 2007, 129, 303–307. [Google Scholar] [CrossRef]
- Lubke, S.; Wiemhofer, H.-D. Electronic conductivity of Gd-doped ceria with additional Pr-doping. Solid State Ion. 1999, 117, 229–243. [Google Scholar] [CrossRef]
- Souza, E.C.C. Electrochemical properties of doped ceria electrolyte under reducing atmosphere: Bulk and grain boundary. J. Electroceram. 2013, 31, 245–253. [Google Scholar] [CrossRef]
- Fagg, D.; Pérez-Coll, D.; Núñez, P.; Frade, J.; Shaula, A.; Yaremchenko, A.; Kharton, V. Ceria based mixed conductors with adjusted electronic conductivity in the bulk and/or along grain boundaries. Solid State Ion. 2009, 180, 896–899. [Google Scholar] [CrossRef]
- Dąbrowa, J.; Szymczak, M.; Zajusz, M.; Mikuła, A.; Moździerz, M.; Berent, K.; Wytrwal-Sarna, M.; Bernasik, A.; Stygar, M.; Świerczek, K. Stabilizing fluorite structure in ceria-based high-entropy oxides: Influence of Mo addition on crystal structure and transport properties. J. Eur. Ceram. Soc. 2020, 40, 5870–5881. [Google Scholar] [CrossRef]
- Chen, K.; Pei, X.; Tang, L.; Cheng, H.; Li, Z.; Li, C.; Zhang, X.; An, L. A five-component entropy-stabilized fluorite oxide. J. Eur. Ceram. Soc. 2018, 38, 4161–4164. [Google Scholar] [CrossRef]
- Gild, J.; Samiee, M.; Braun, J.L.; Harrington, T.; Vega, H.; Hopkins, P.E.; Vecchio, K.; Luo, J. High-entropy fluorite oxides. J. Eur. Ceram. Soc. 2018, 38, 3578–3584. [Google Scholar] [CrossRef]
- Wu, Y.-C.; Liao, Y.-Y. Effect of Ca2+ and Sr2+ doping on the microstructure and cell performance of samaria-doped ceria electrolytes used in solid oxide fuel cells. Int. J. Hydrogen Energy 2016, 41, 13591–13602. [Google Scholar] [CrossRef]
- Ali, S.A.M.; Anwar, M.; Abdalla, A.M.; Somalu, M.R.; Muchtar, A. Ce0.80Sm0.10Ba0.05Er0.05O2-δ multi-doped ceria electrolyte for intermediate temperature solid oxide fuel cells. Ceram. Int. 2017, 43, 1265–1271. [Google Scholar] [CrossRef]
- Gao, Z.; Liu, X.; Bergman, B.; Zhao, Z. Enhanced ionic conductivity of Ce0.8Sm0.2O2-δ by Sr addition. J. Power Sources 2018, 208, 225–231. [Google Scholar] [CrossRef]
- Jaiswal, N.; Kumar, D.; Upadhyay, S.; Parkash, O. Effect of Mg and Sr co-doping on the electrical properties of ceria-based electrolyte materials for intermediate temperature solid oxide fuel cells. J. Alloys Compd. 2013, 577, 456–462. [Google Scholar] [CrossRef]
- Cho, Y.H.; Cho, P.-S.; Auchterlonie, G.; Kim, D.K.; Lee, J.-H.; Kim, D.-Y.; Park, H.-M.; Drennan, J. Enhancement of grain-boundary conduction in gadolinia-doped ceria by the scavenging of highly resistive siliceous phase. Acta Mater. 2007, 55, 4807–4815. [Google Scholar] [CrossRef]
- Preethi, S.; Babu, K.S. Divalent cations modified grain boundary scavenging in samarium doped ceria electrolyte for solid oxide fuel cells. J. Alloys Compd. 2019, 792, 1068–1078. [Google Scholar] [CrossRef]
- Cho, P.-S.; Cho, Y.H.; Park, S.-Y.; Lee, S.B.; Kim, D.-Y.; Park, H.-M.; Auchterlonie, G.; Drennan, J.; Lee, J.-H. Grain-Boundary Conduction in Gadolinia-Doped Ceria: The Effect of SrO Addition. J. Electrochem. Soc. 2009, 156, B339–B344. [Google Scholar] [CrossRef]
- Kumar, S.A.; Kuppusami, P.; Amirthapandian, S.; Fu, Y.-P. Effect of Sm co-doping on structural, mechanical and electrical properties of Gd doped ceria solid electrolytes for intermediate temperature solid oxide fuel cells. Int. J. Hydrogen Energy 2020, 45, 29690–29704. [Google Scholar] [CrossRef]
- Bi, H.; Liu, X.; Zhu, L.; Sun, J.; Yu, S.; Yu, H.; Pei, L. Effect of MgO addition and grain size on the electrical properties of Ce0.9Gd0.1O1.95 electrolyte for IT-SOFCs. Int. J. Hydrogen Energy 2017, 42, 11735–11744. [Google Scholar] [CrossRef]
- Zheng, Y.; Wu, L.; Gu, H.; Gao, L.; Chen, H.; Guo, L. The effect of Sr on the properties of Y-doped ceria electrolyte for IT-SOFCs. J. Alloys Compd. 2009, 486, 586–589. [Google Scholar] [CrossRef]
- Zheng, Y.; Gu, H.; Chen, H.; Gao, L.; Zhu, X.; Guo, L. Effect of Sm and Mg co-doping on the properties of ceria-based electrolyte materials for IT-SOFCs. Mater. Res. Bull. 2009, 44, 775–779. [Google Scholar] [CrossRef]
- Jaiswal, N.; Upadhyay, S.; Kumar, D.; Parkash, O. Sm3+ and Sr2+ co-doped ceria prepared by citrate–nitrate auto-combustion method. Int. J. Hydrogen Energy 2014, 39, 543–551. [Google Scholar] [CrossRef]
- Zheng, Y.; He, S.; Ge, L.; Zhou, M.; Chen, H.; Guo, L. Effect of Sr on Sm-doped ceria electrolyte. Int. J. Hydrogen Energy 2011, 36, 5128–5135. [Google Scholar] [CrossRef]
- Cioateră, N.; Pârvulescu, V.; Rolle, A.; Vannie, R.N. Effect of strontium addition on europium-doped ceria properties. Solid State Ion. 2009, 180, 681–687. [Google Scholar] [CrossRef]
- Spiridigliozzi, L.; Dell’Agli, G.; Marocco, A.; Accardo, G.; Pansini, M.; Yoon, S.; Ham, H.; Frattini, D. Engineered co-precipitation chemistry with ammonium carbonate for scalable synthesis and sintering of improved Sm0.2Ce0.8O1.90 and Gd0.16Pr0.04Ce0.8O1.90 electrolytes for IT-SOFCs. J. Ind. Eng. Chem. 2018, 59, 17–27. [Google Scholar] [CrossRef]
- Niihara, K.; Morena, R.; Hasselman, D.P.H. Evalution of K1c of brittle solids by the indentation method with low crack-to-indent ration. Mater. Sci. Lett. 1982, 1, 13–16. [Google Scholar] [CrossRef]
- Fu, Y.-P. Ionic conductivity and mechanical properties of Y2O3-doped CeO2 ceramics synthesis by microwave-induced combustion. Ceram. Int. 2009, 35, 653–659. [Google Scholar] [CrossRef]
- Maschio, S.; Sbaizero, O.; Meriani, S. Mechanical Properties in the Ceria-Zirconia System. J. Eur. Ceram. Soc. 1992, 9, 127–132. [Google Scholar] [CrossRef]
- Jaiswal, N.; Singh, N.K.; Kumar, D.; Parkash, O. Effect of strontium (Sr) doping on the conductivity of ceria. J. Power Sources 2012, 202, 78–84. [Google Scholar] [CrossRef]
- Singh, B.; Ghosh, S.; Aich, S.; Roy, B. Low temperature solid oxide electrolytes (LT-SOE): A review. J. Power Sources 2017, 339, 103–135. [Google Scholar] [CrossRef]
- Mogensen, M.; Lybye, D.; Bonanos, N.; Hendriksen, P.V.; Poulsen, F.W. Review. Factors controlling the oxide ion conductivity of fluorite and perovskite structured oxides. Solid State Ion. 2004, 174, 279–286. [Google Scholar] [CrossRef]
- Gerhardt, R.; Nowick, A.S.; Mochel, M.E.; Dumler, I. Grain-Boundary Effect in Ceria Doped with Trivalent Cations: II, Microstructure and Microanalysis. J. Am. Ceram. Soc. 1986, 69, 647–651. [Google Scholar] [CrossRef]
- Kidner, N.J.; Perry, N.H.; Mason, T.O. The Brick Lauer Model Revisited: Introducing the Nanj-Grain Composite Model. J. Am. Ceram. Soc. 2008, 91, 1733–1746. [Google Scholar] [CrossRef]
- Kilner, J.A. Fast oxygen transport in acceptor doped oxides. Solid State Ion. 2000, 129, 13–23. [Google Scholar] [CrossRef]
- Anwar, M.; Ali, S.A.M.; Muchtar, A.; Somalu, M.R. Influence of strontium co-doping on the structural, optical, and electrical properties of erbium-doped ceria electrolyte for intermediate temperature solid oxide fuel cells. Ceram. Int. 2019, 45, 5627–5636. [Google Scholar] [CrossRef]
- Priya, R.; Kaur, S.; Sharma, U.; Pandey, O.P.; Dhoble, S.J. A review on recent progress in rare earth and transition metals activated SrY2O4 phosphors. J. Mater. Sci. Mater. Electron. 2020, 31, 13011–13027. [Google Scholar] [CrossRef]
- Anjaneya, K.C.; Singh, M.P. Synthesis and properties of gadolinium doped ceria electrolyte for IT-SOFCs by EDTA-citrate complexing method. J. Alloys Compd. 2017, 695, 871–876. [Google Scholar] [CrossRef]


| S. No | Compositions | Apparent Density, g/sm3 | Relative Density, % | Vickers Hardness, Hv, GPa | Crack Resistance, MPam1/2 |
|---|---|---|---|---|---|
| 1 | (Y,Ce,Mg,Sr)O2-δ | 4.4 | 88 | 7.26 | 1.48 |
| 2 | 10YCe3Mg5Sr | 6.0 | 90 | 7.80 | 1.82 |
| 3 | 10SmCe3Mg5Sr | 6.48 | 96 | 7.80 | 2.1 |
| S. No | Compositions | Average Grain Size 1450 °C (μm) | Phase Content Data | Lattice Parameter (Å) |
|---|---|---|---|---|
| 1 | (Y,Ce,Mg,Sr)O2-δ | 5.1 | Fm3m | 5.3944 |
| Pnam | 10.1086, 11.9452, 3.4275 | |||
| 2 | 10YCe3Mg5Sr | 3.95 | Fm3m | 5.4142 |
| 3 | 10SmCe3Mg5Sr | 5.07 | Fm3m | 5.4426 |
| Composition | Element | Weight % from EDS | Error % |
|---|---|---|---|
| (Y,Ce,Mg,Sr)O2-δ | O | 6.47 | 2.39 |
| Mg | 17.04 | 1.12 | |
| Sr | 23.28 | 0.61 | |
| Ce | 25.31 | 0.6 | |
| Y | 27.90 | 0.43 | |
| 10YCe3Mg5Sr | O | 29.71 | 10.33 |
| Mg | 2.18 | 13.11 | |
| Sr | 3.88 | 10.44 | |
| Ce | 57.10 | 3.00 | |
| Y | 7.13 | 10.04 | |
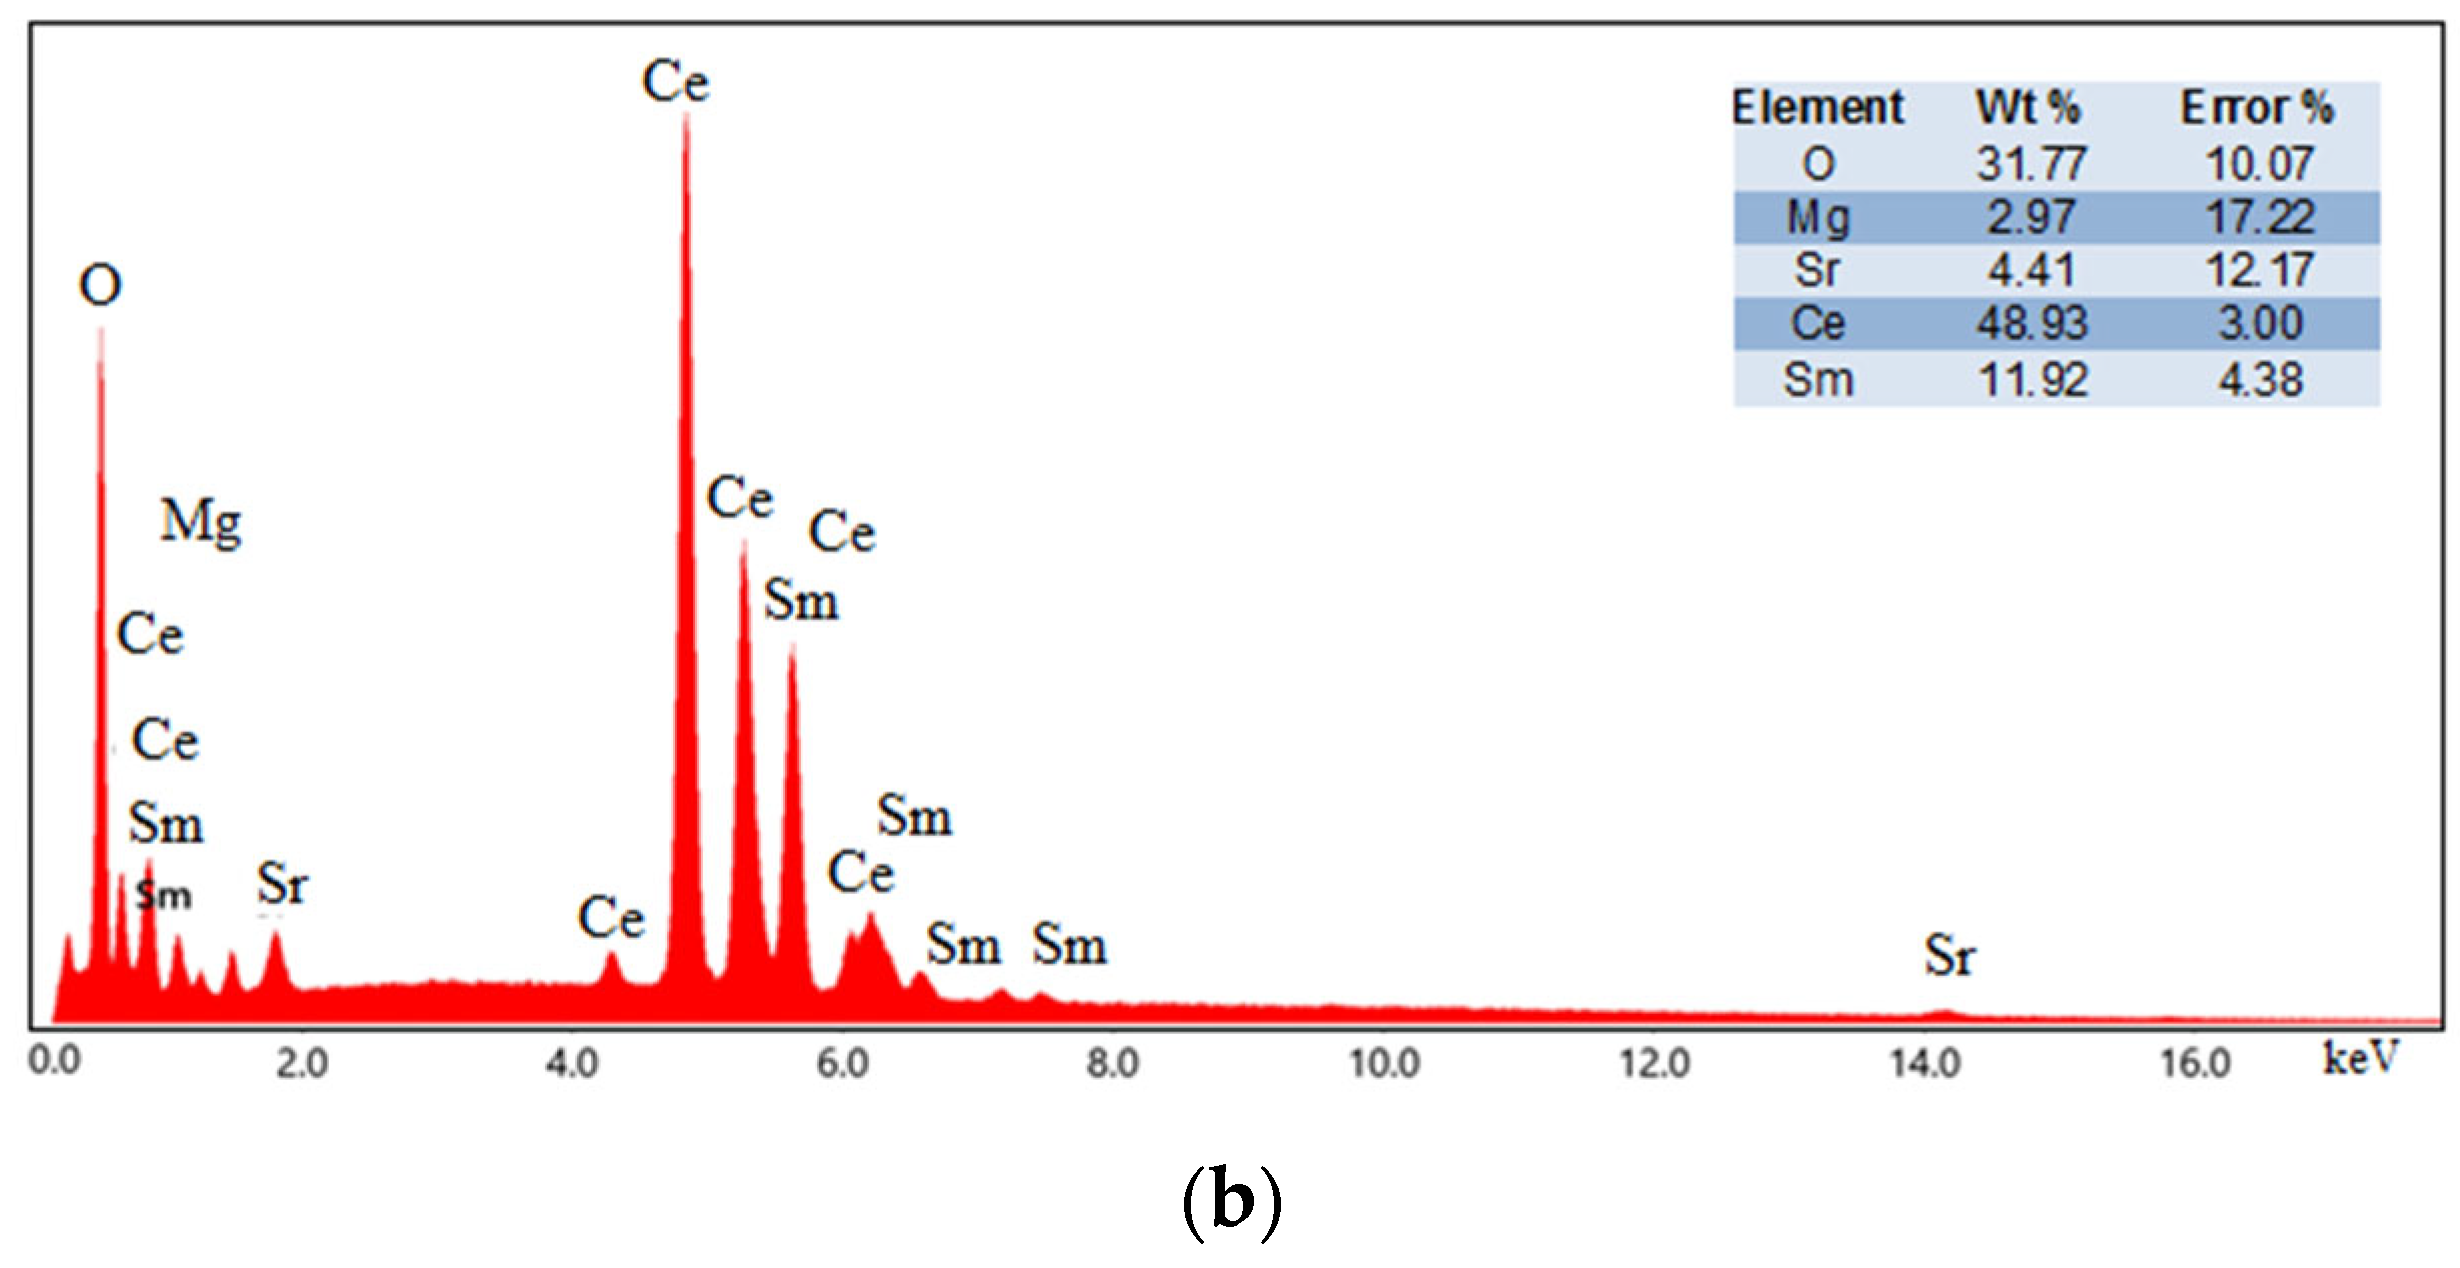
| 10SmCe3Mg5Sr | O | 31.77 | 10.07 |
| Mg | 2.97 | 17.22 | |
| Sr | 4.41 | 12.17 | |
| Ce | 48.93 | 3.00 | |
| Sm | 11.92 | 4.38 |
| S. No | Materials | , S/cm | , eV | , eV | , eV | ||||||||
|---|---|---|---|---|---|---|---|---|---|---|---|---|---|
| 500 °C | 700 °C | 400–600 °C | 600–800 °C | 400–470 °C | 470–800 °C | 400–600 °C | 400–470 °C | 470–600 °C | 400–600 °C | 400–470 °C | 470–600 °C | ||
| 1 | (Y,Ce,Mg,Sr)O2-δ | 3.12 × 10⁻⁷ | 2.1 × 10⁻⁵ | - | - | 0.96 | 1.37 | - | 0.3 | 0.6 | - | 0.96 | 1.17 |
| 2 | 10YCe3Mg5Sr | 1.38 × 10⁻³ | 1.7 × 10⁻² | 0.90 | 0.72 | - | - | 0.89 | - | - | 1.0 | - | - |
| 3 | 10SmCe3Mg5Sr | 1.7 × 10⁻³ | 2.05 × 10⁻² | 0.72 | 0.62 | - | - | 0.70 | - | - | 0.82 | - | - |
Publisher’s Note: MDPI stays neutral with regard to jurisdictional claims in published maps and institutional affiliations. |
© 2022 by the authors. Licensee MDPI, Basel, Switzerland. This article is an open access article distributed under the terms and conditions of the Creative Commons Attribution (CC BY) license (https://creativecommons.org/licenses/by/4.0/).
Share and Cite
Sudzhanskaya, I.V.; Nekrasova, Y.S.; Kubankin, A.S. Effect of the Composition of the Ceramics (MCeMgSr)O2-δ (M = Y, Sm) on the Microstructure, Mechanical and Electrical Properties for Solid Electrolyte. Crystals 2022, 12, 1198. https://doi.org/10.3390/cryst12091198
Sudzhanskaya IV, Nekrasova YS, Kubankin AS. Effect of the Composition of the Ceramics (MCeMgSr)O2-δ (M = Y, Sm) on the Microstructure, Mechanical and Electrical Properties for Solid Electrolyte. Crystals. 2022; 12(9):1198. https://doi.org/10.3390/cryst12091198
Chicago/Turabian StyleSudzhanskaya, Irina Vasilevna, Yulia Sergeevna Nekrasova, and Alexander Sergeevich Kubankin. 2022. "Effect of the Composition of the Ceramics (MCeMgSr)O2-δ (M = Y, Sm) on the Microstructure, Mechanical and Electrical Properties for Solid Electrolyte" Crystals 12, no. 9: 1198. https://doi.org/10.3390/cryst12091198
APA StyleSudzhanskaya, I. V., Nekrasova, Y. S., & Kubankin, A. S. (2022). Effect of the Composition of the Ceramics (MCeMgSr)O2-δ (M = Y, Sm) on the Microstructure, Mechanical and Electrical Properties for Solid Electrolyte. Crystals, 12(9), 1198. https://doi.org/10.3390/cryst12091198