
Study on the Bandgap Characteristics and Vibration-Reduction Mechanism of Symmetric Power-Exponent Prismatic Phononic Crystal Plates

Abstract
:1. Introduction
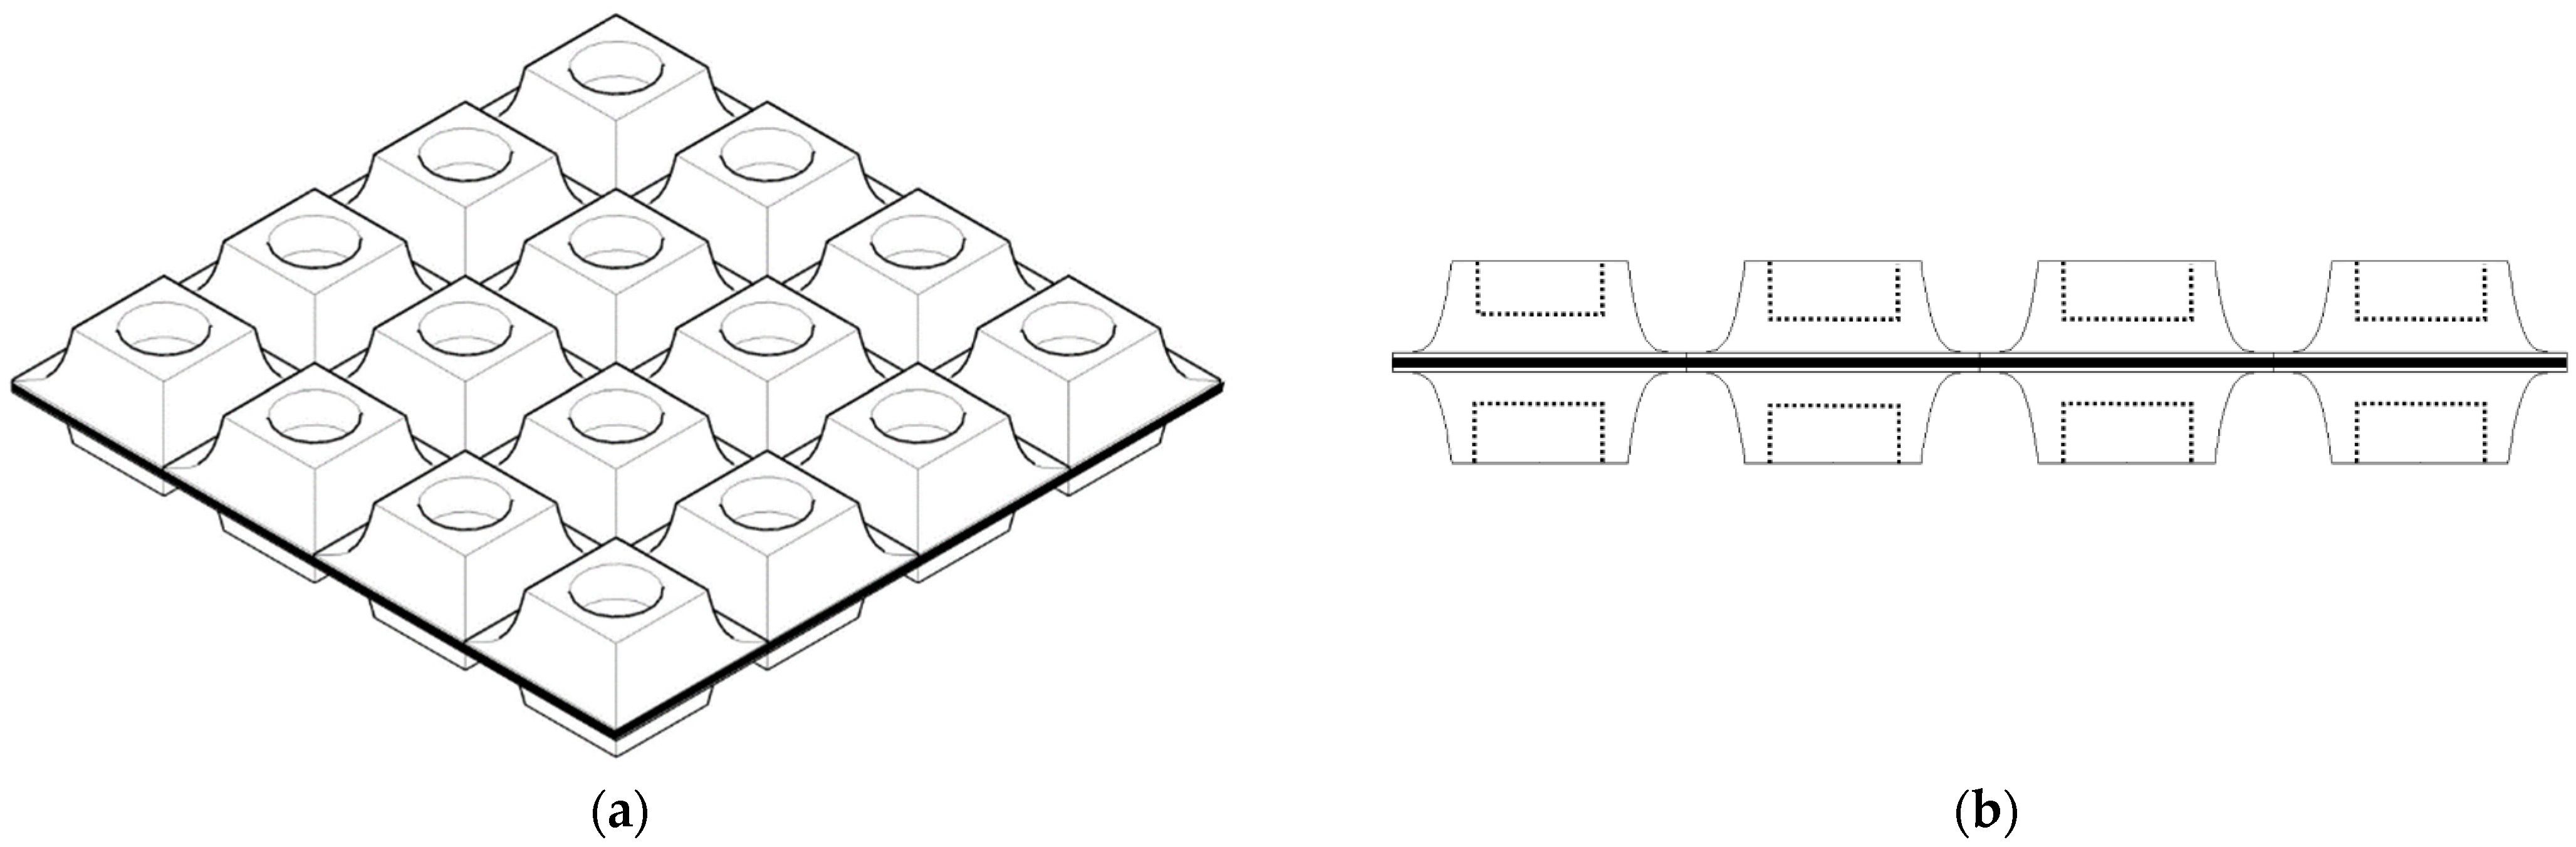
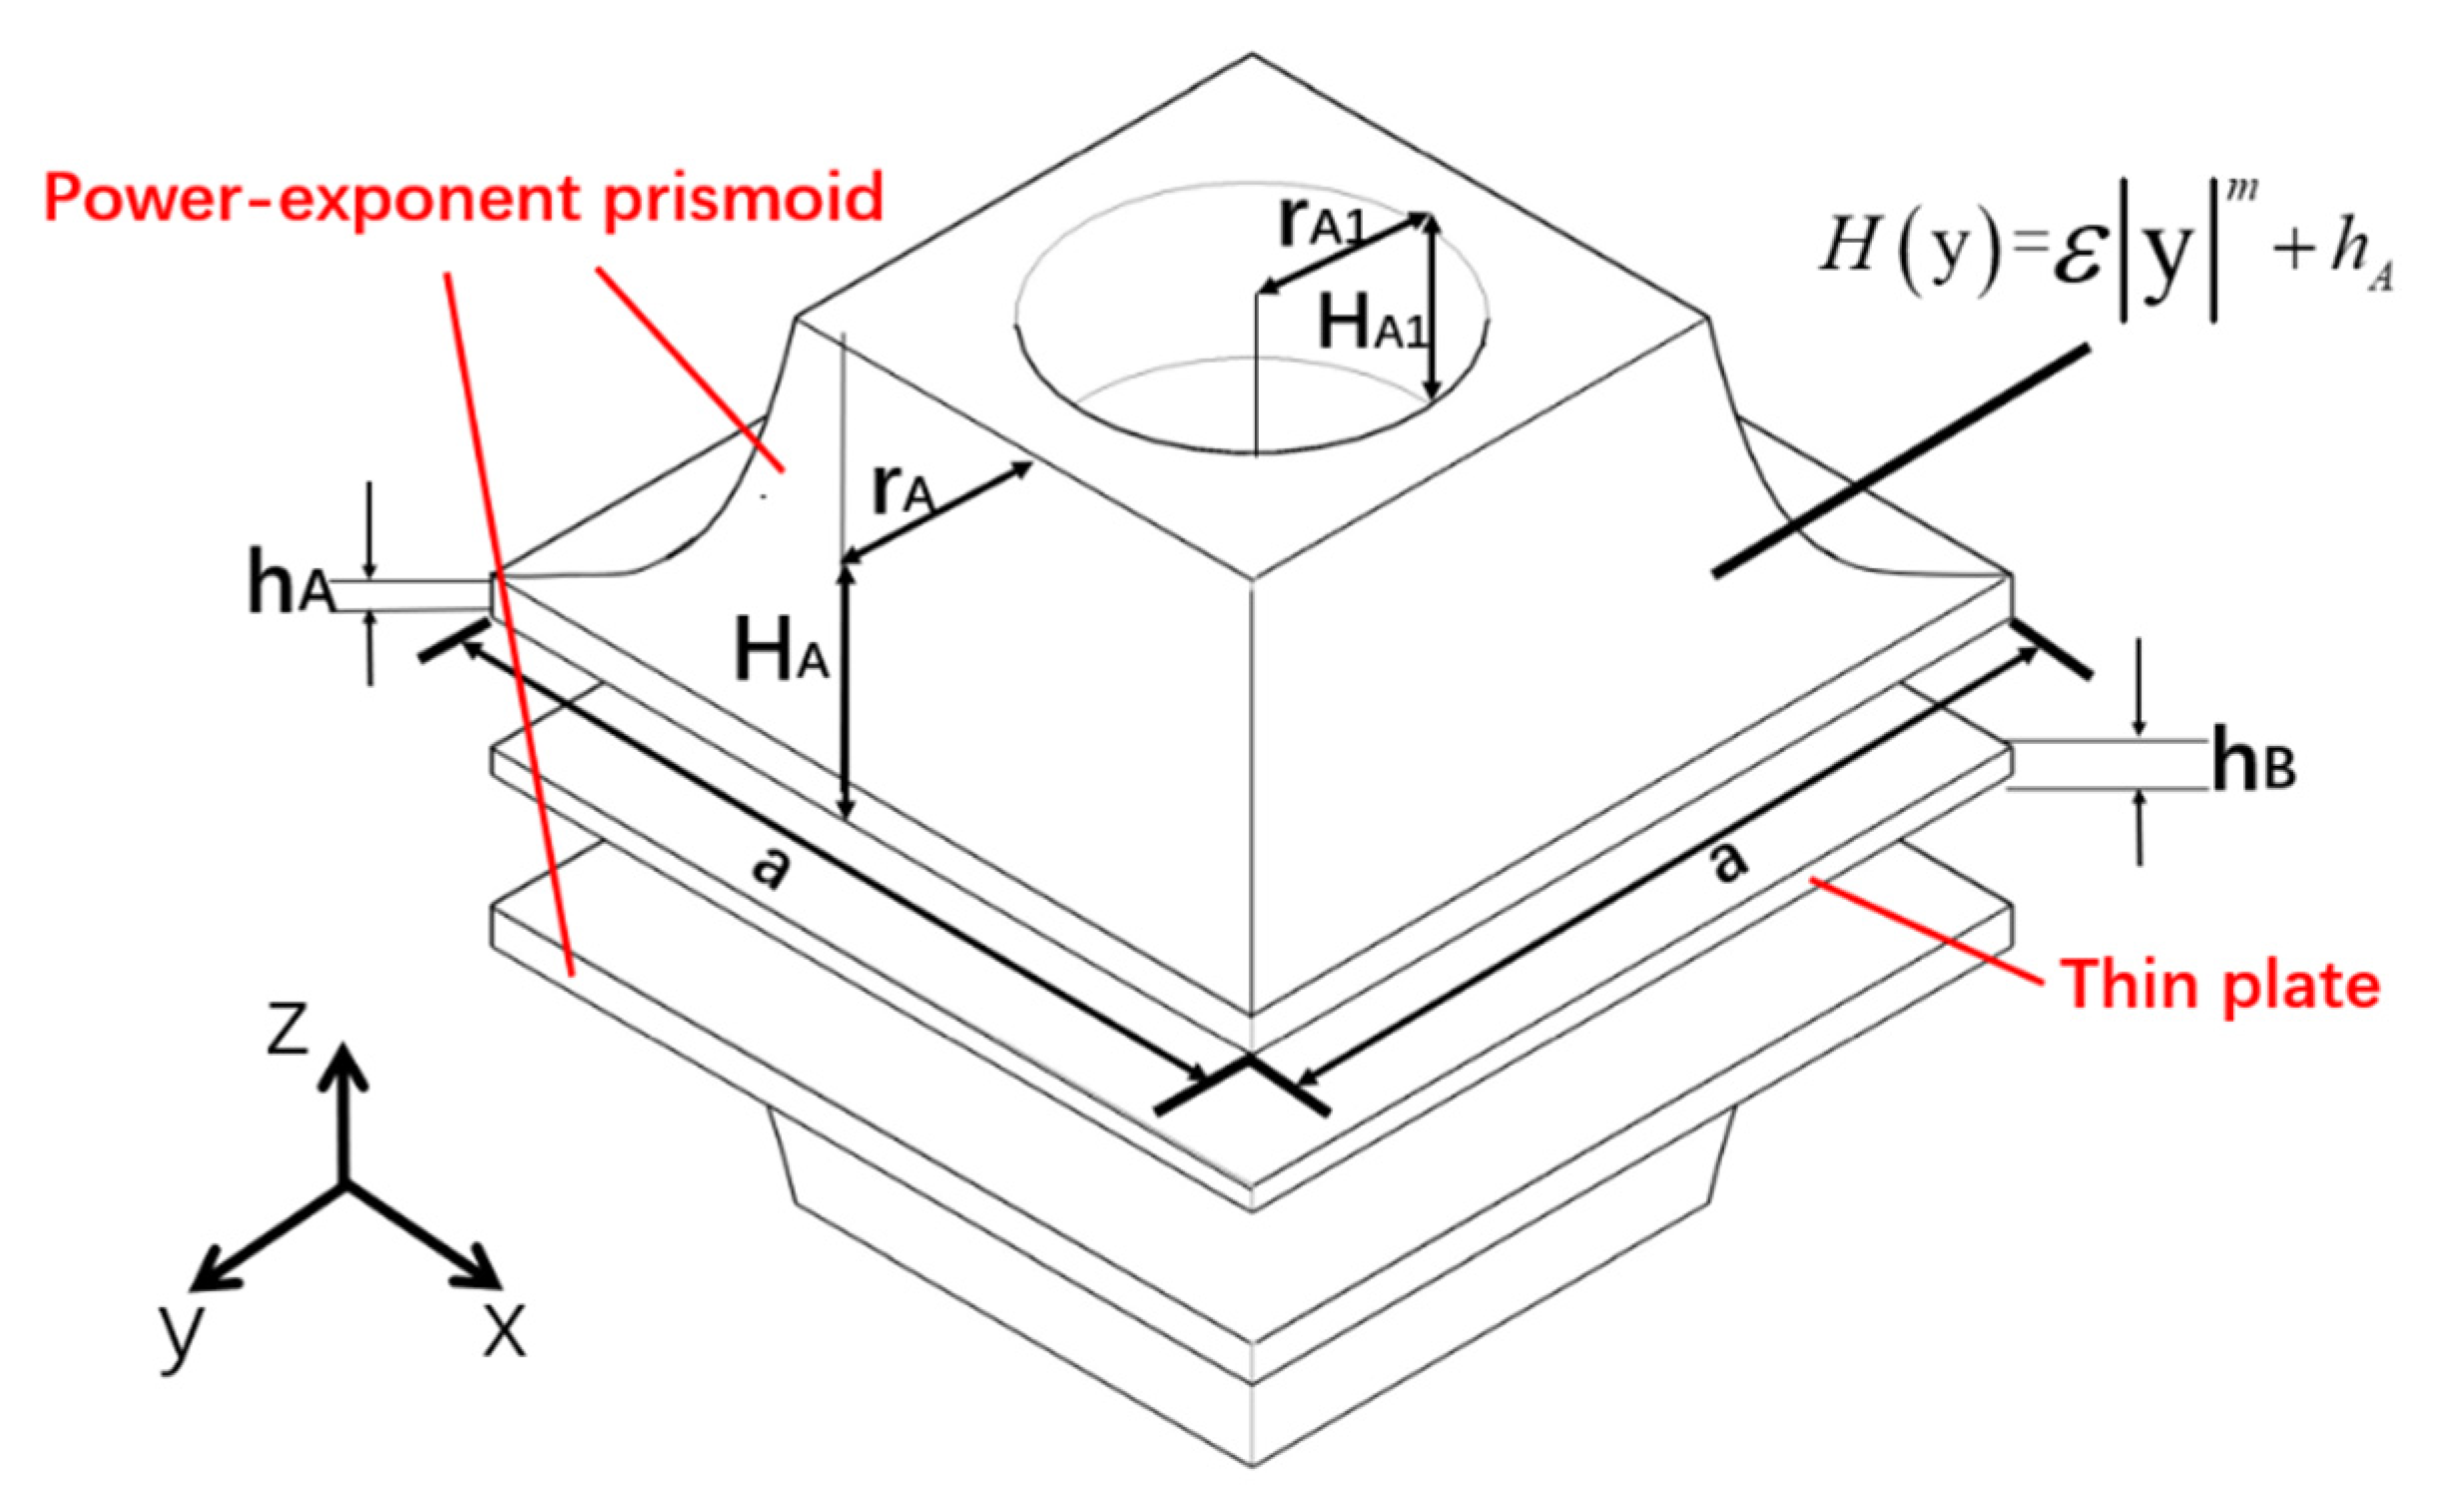
2. Research Model
3. Bandgap Characteristics of the Symmetric Power-Exponent Prismatic Phononic Crystal
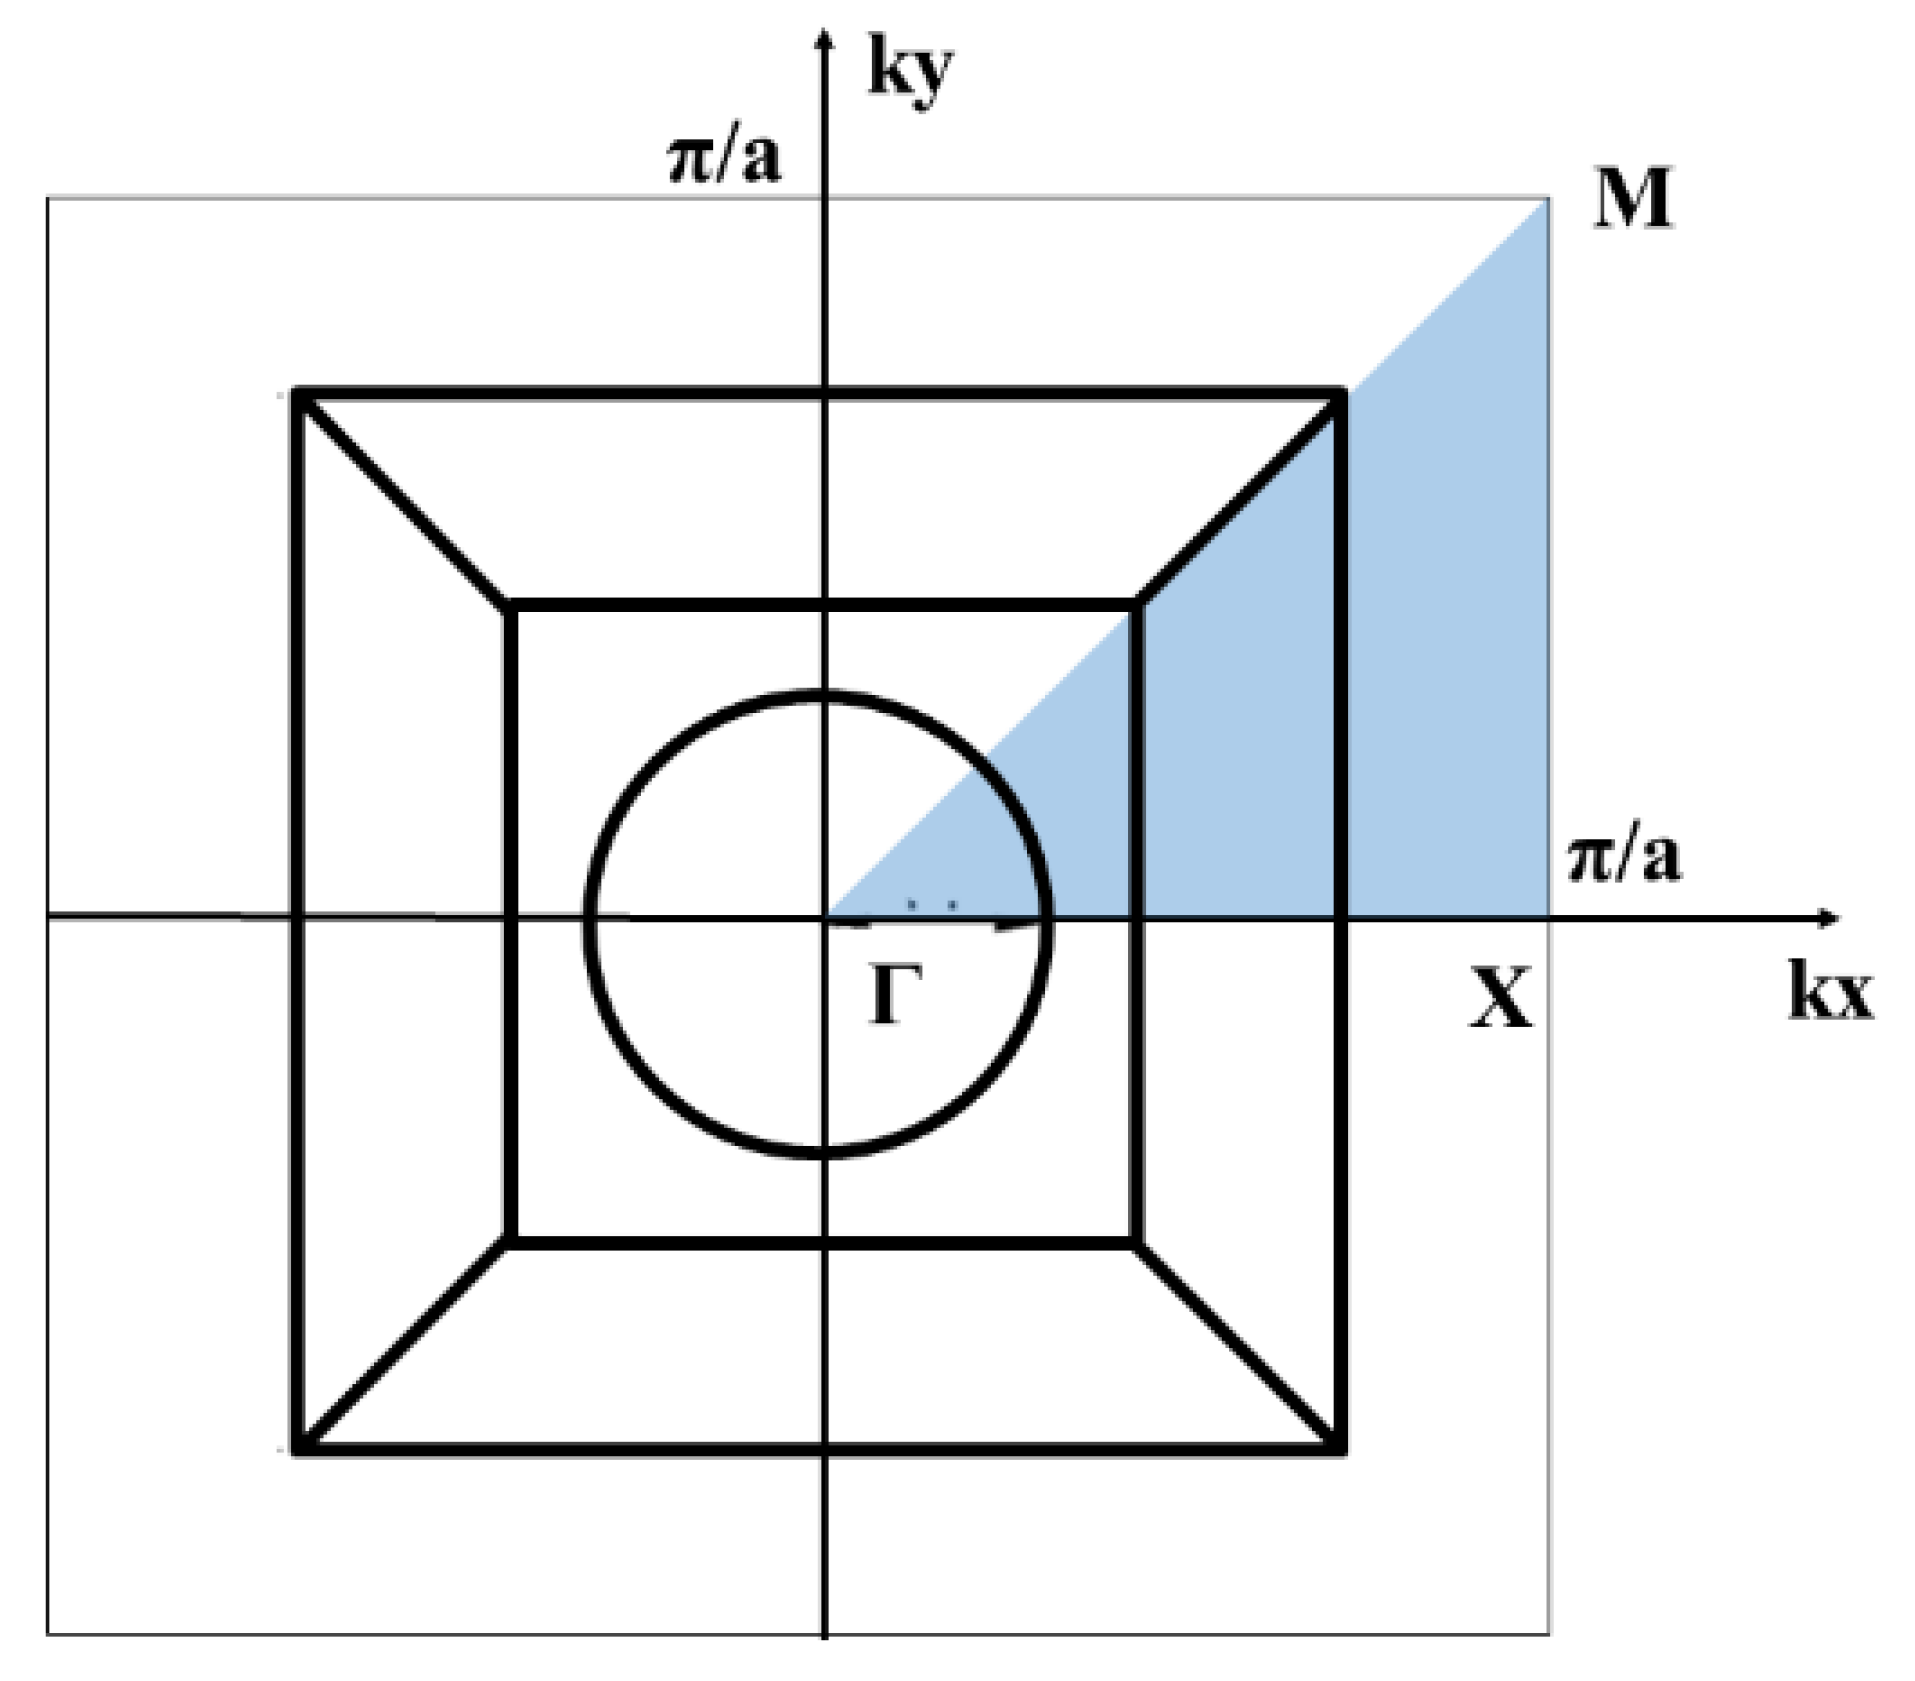
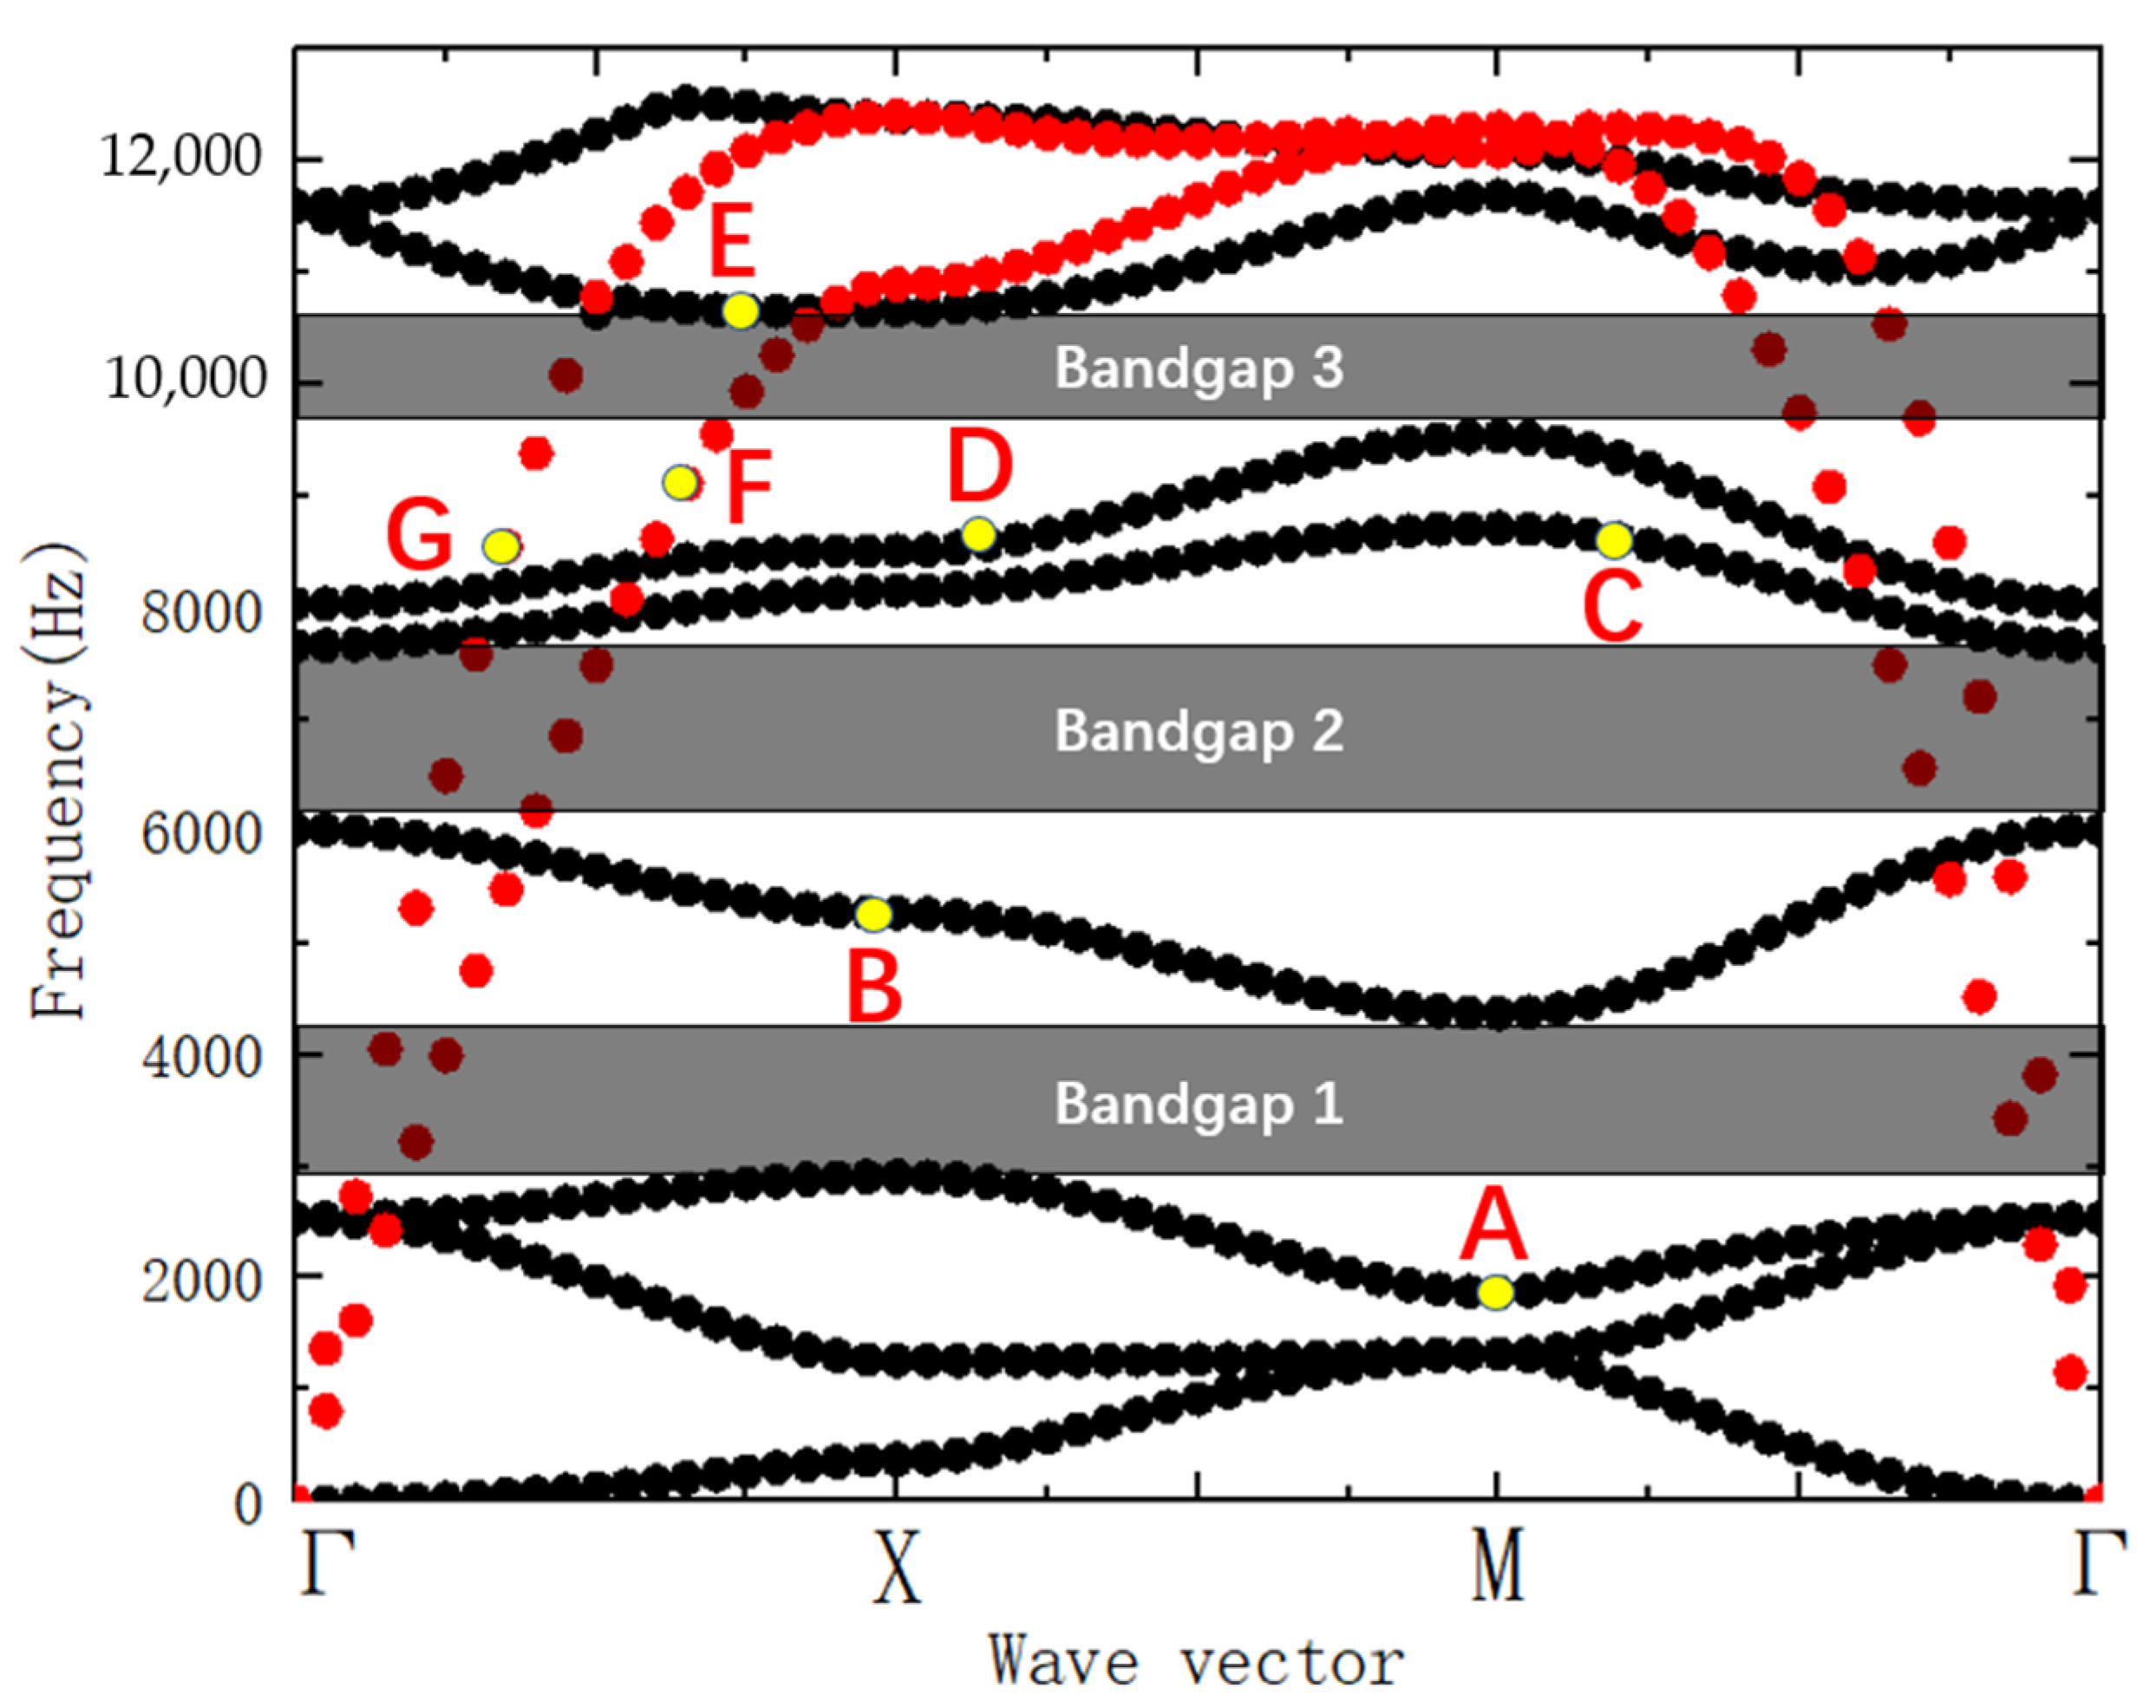
3.1. Calculation of the Frequency Dispersion Curves
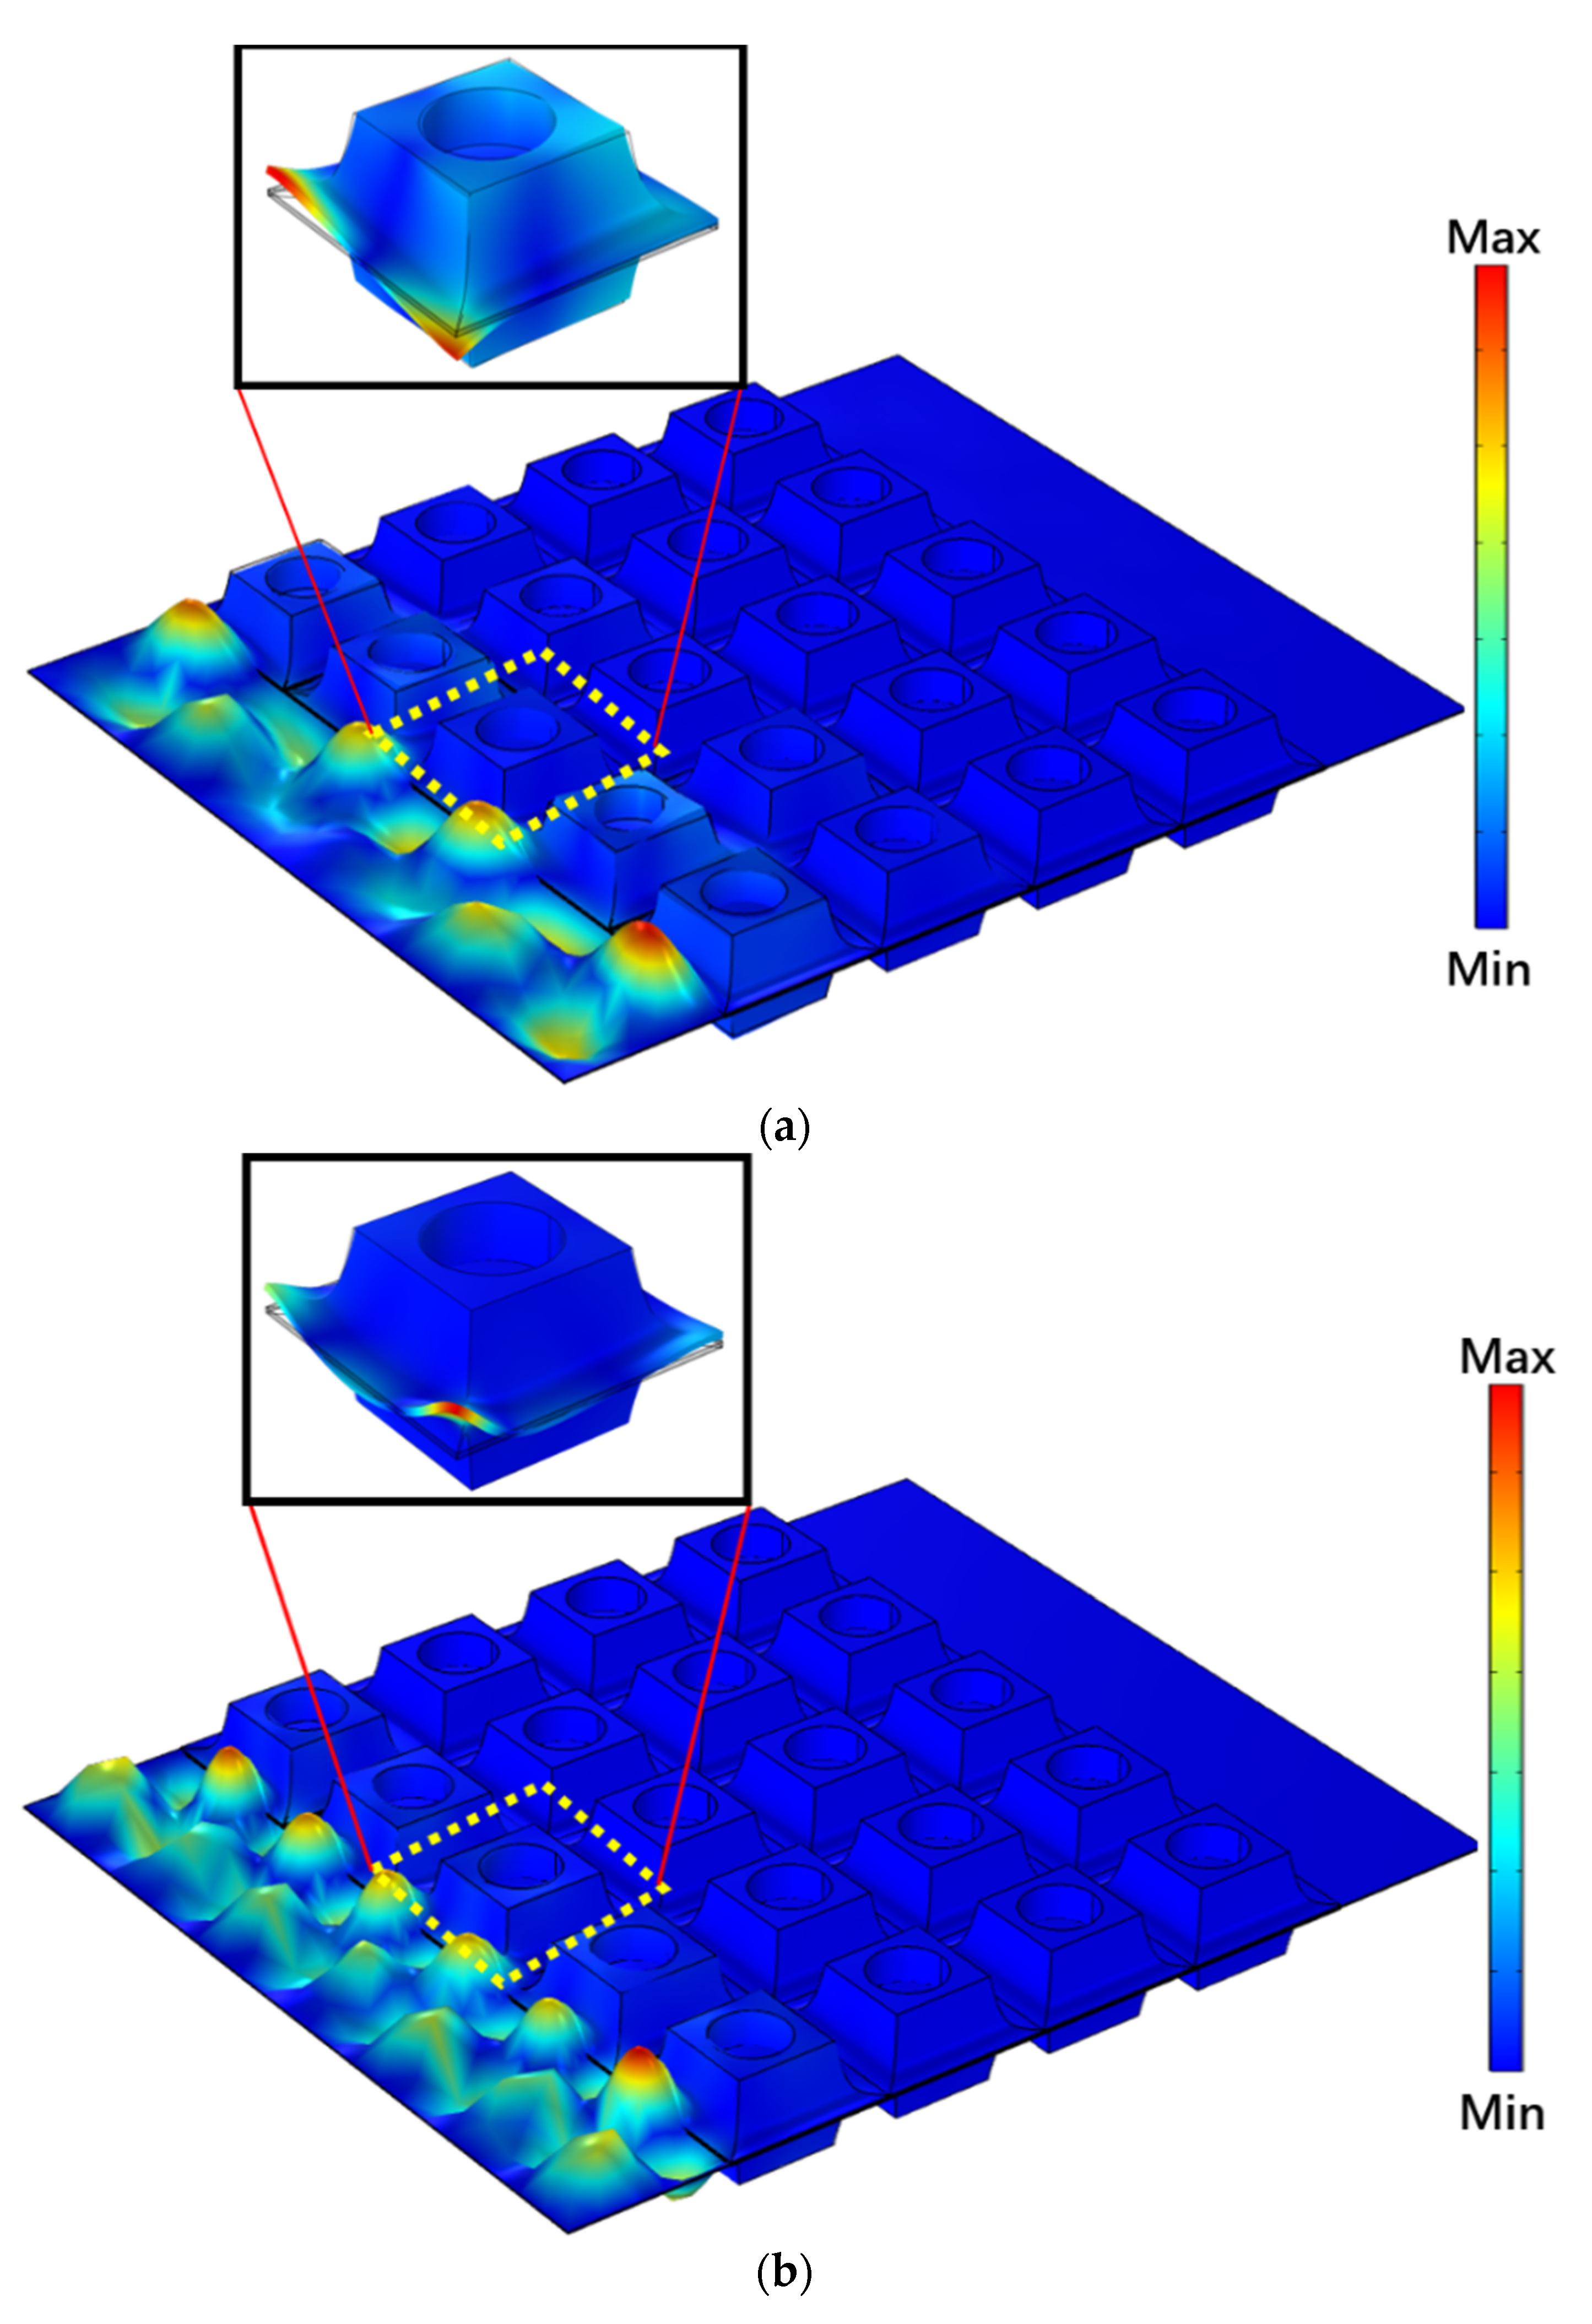
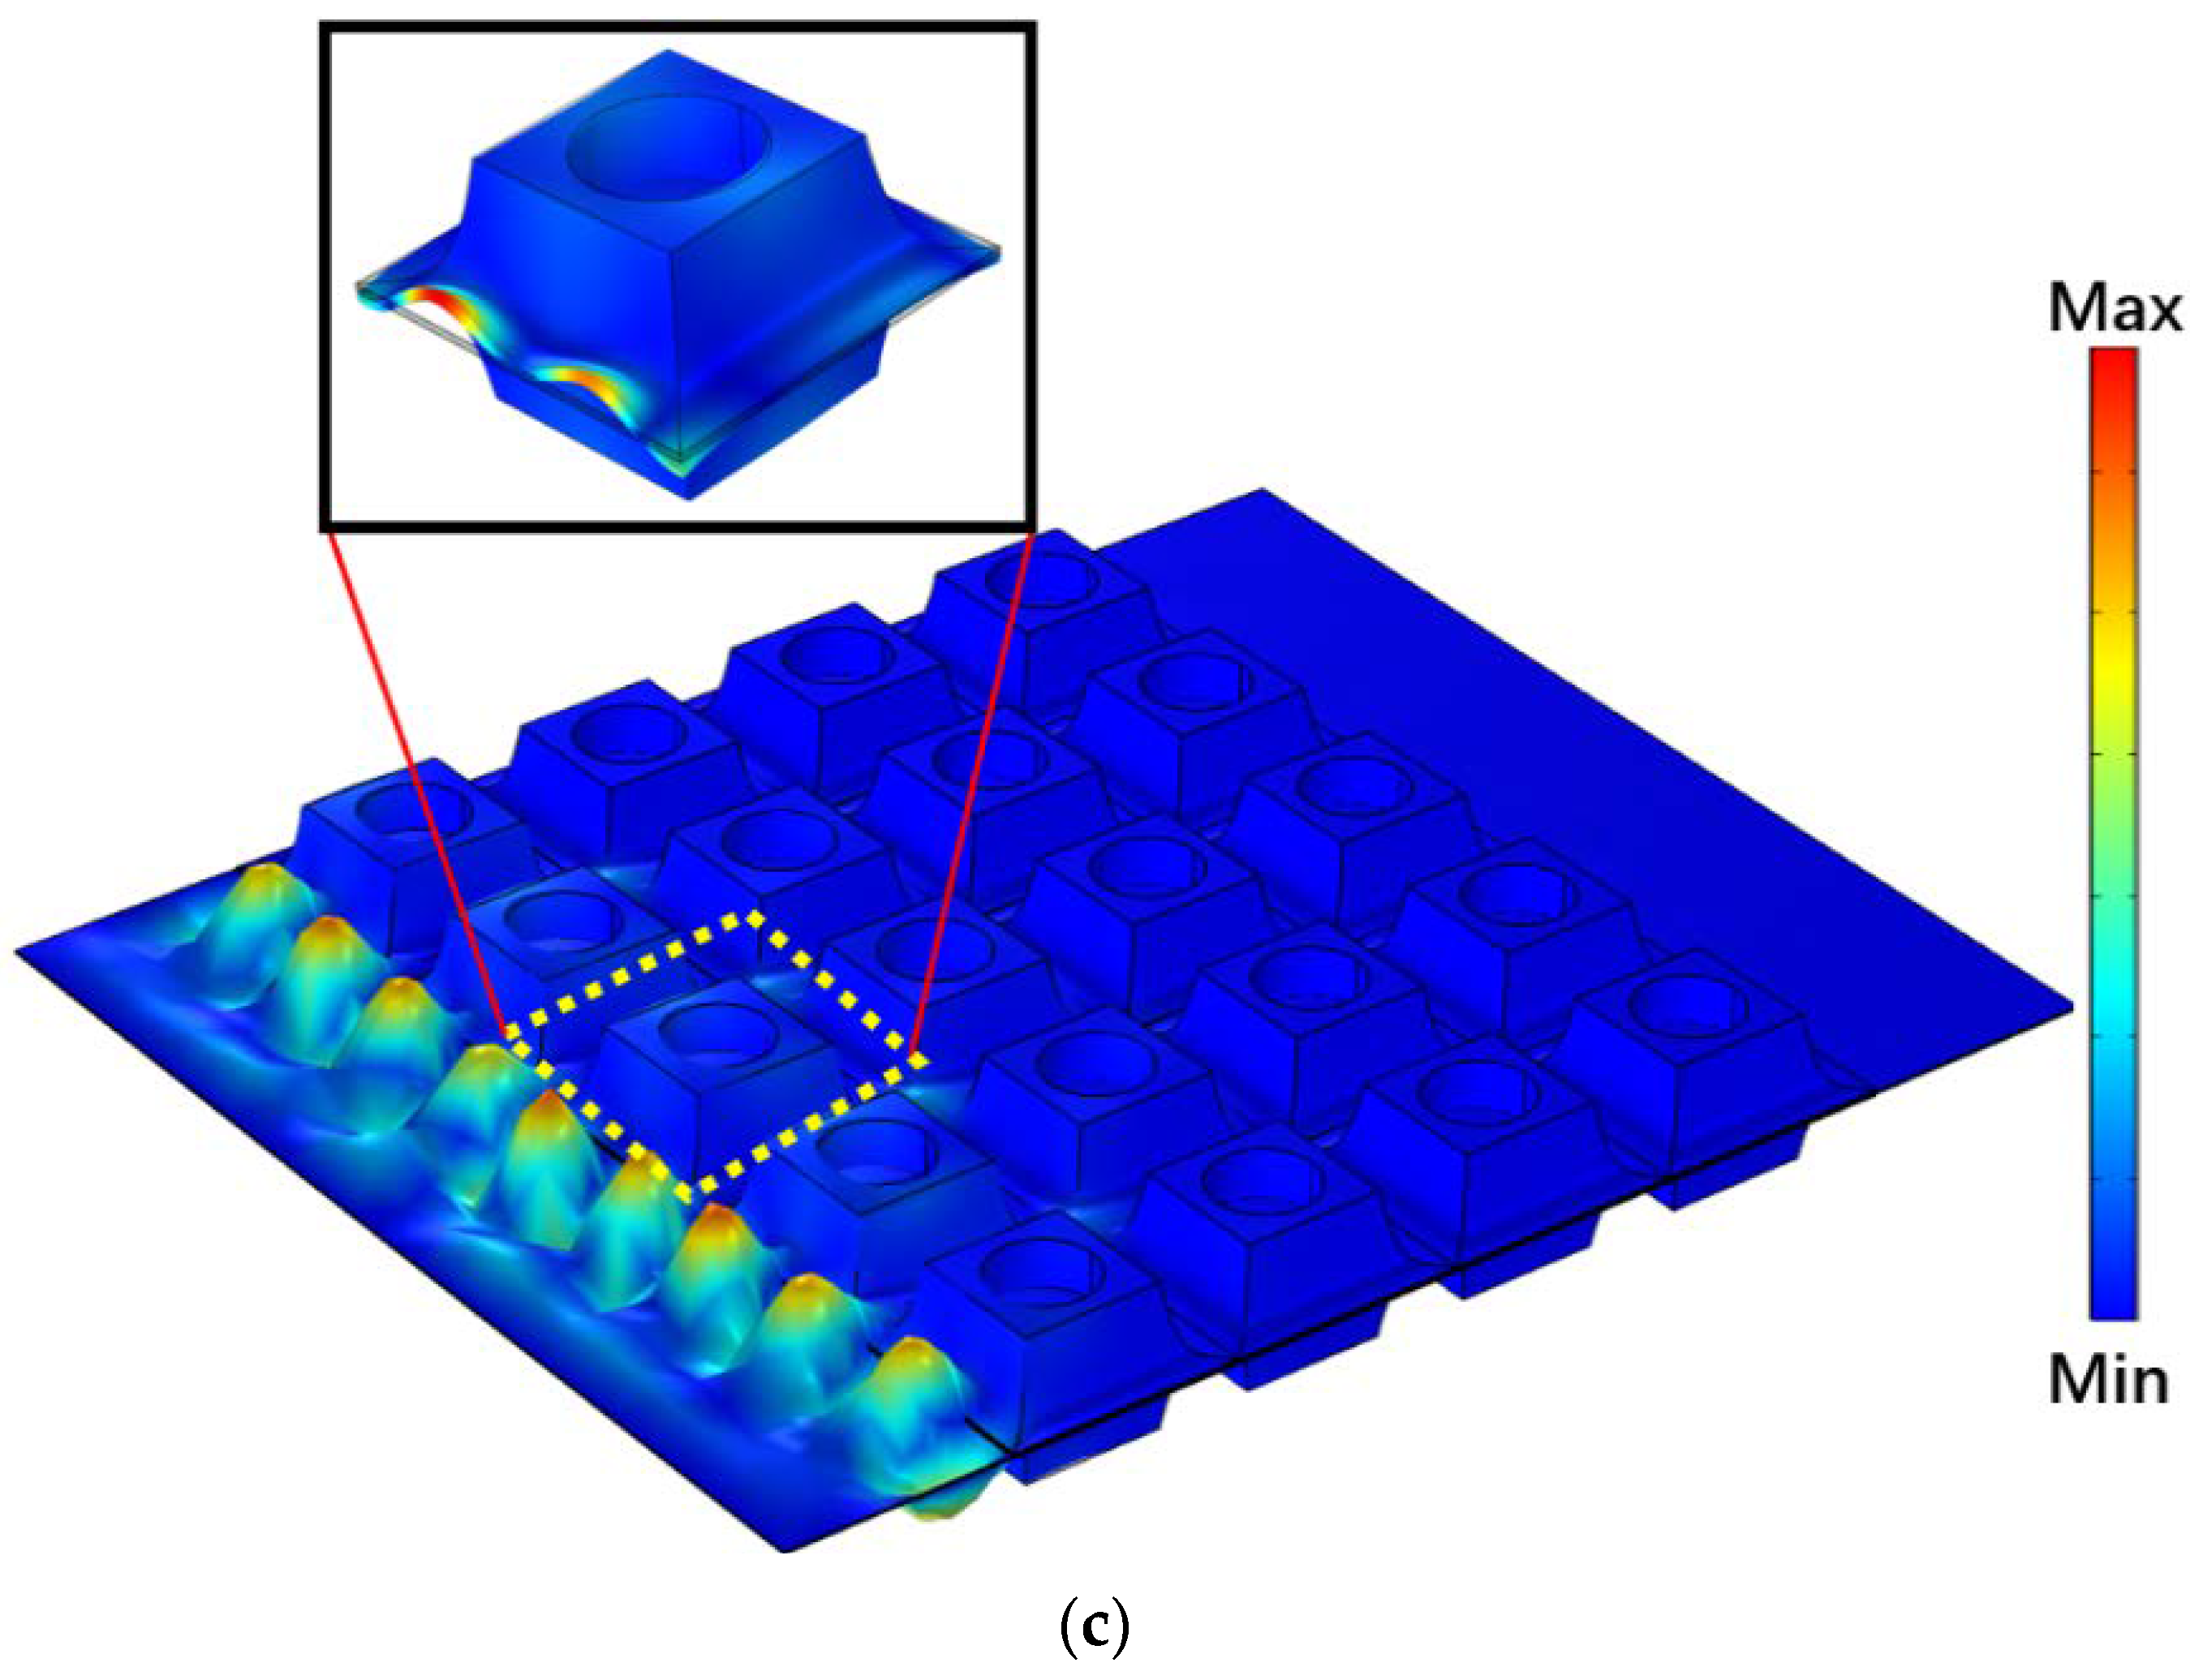
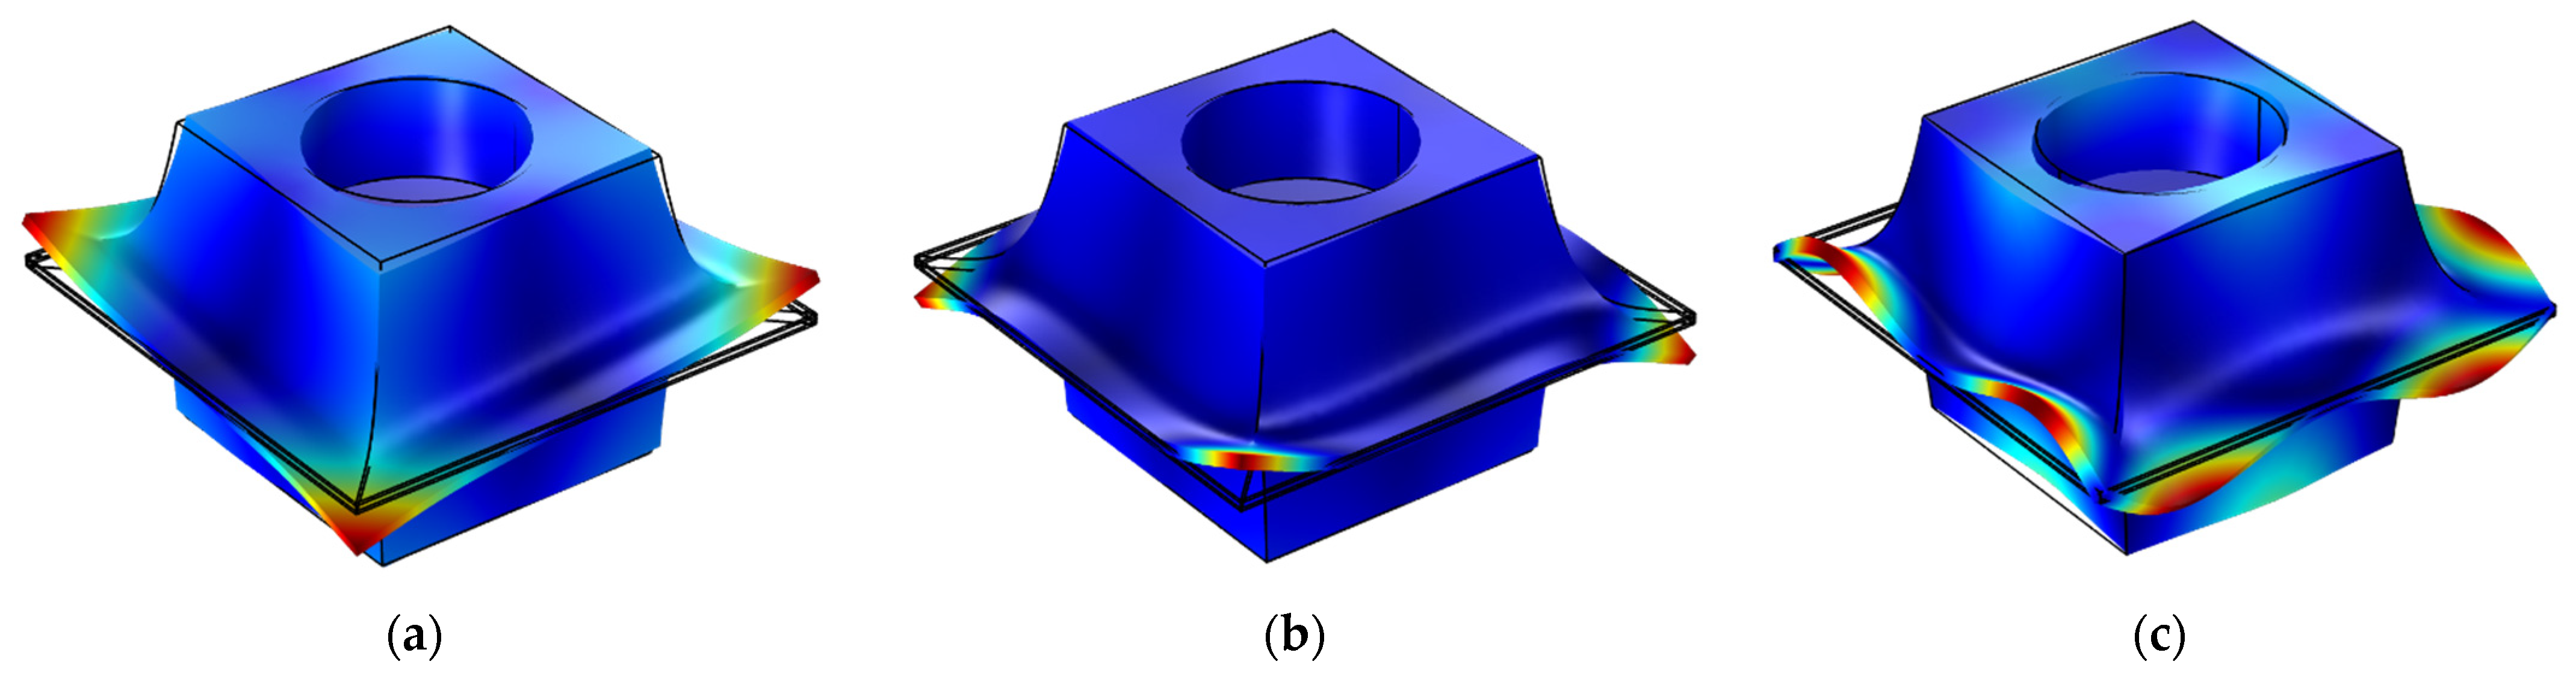
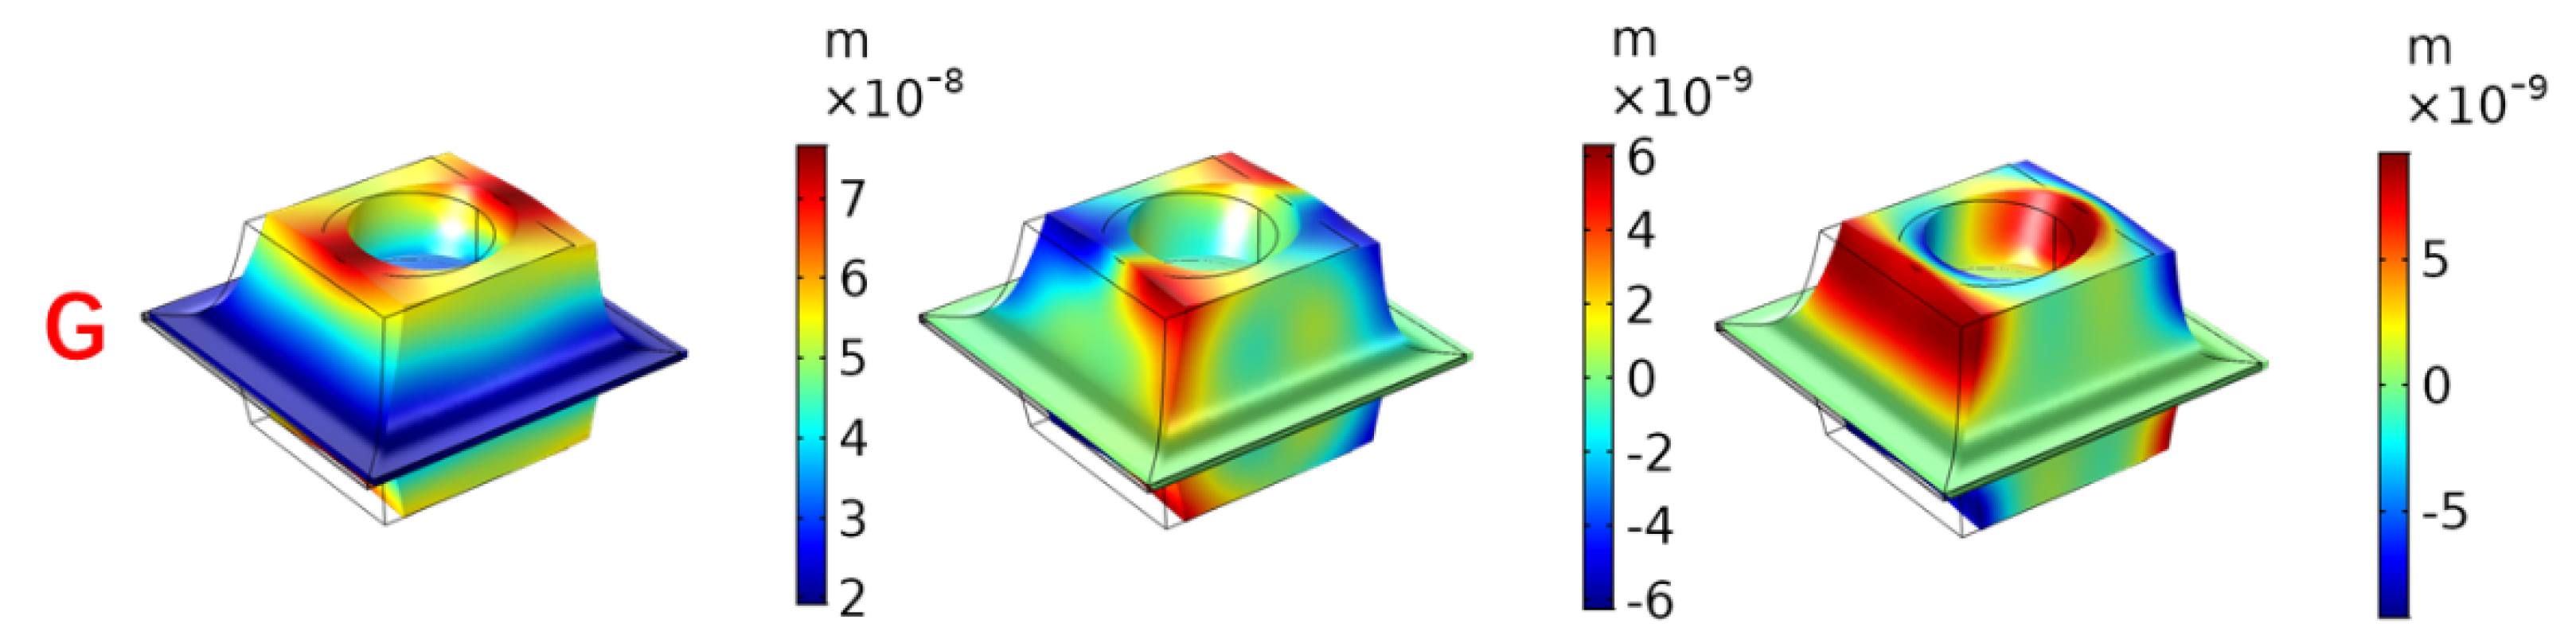
3.2. Vibration-Reduction Mechanism Analysis of the Symmetric Power-Exponent Prismatic Photonic Crystal
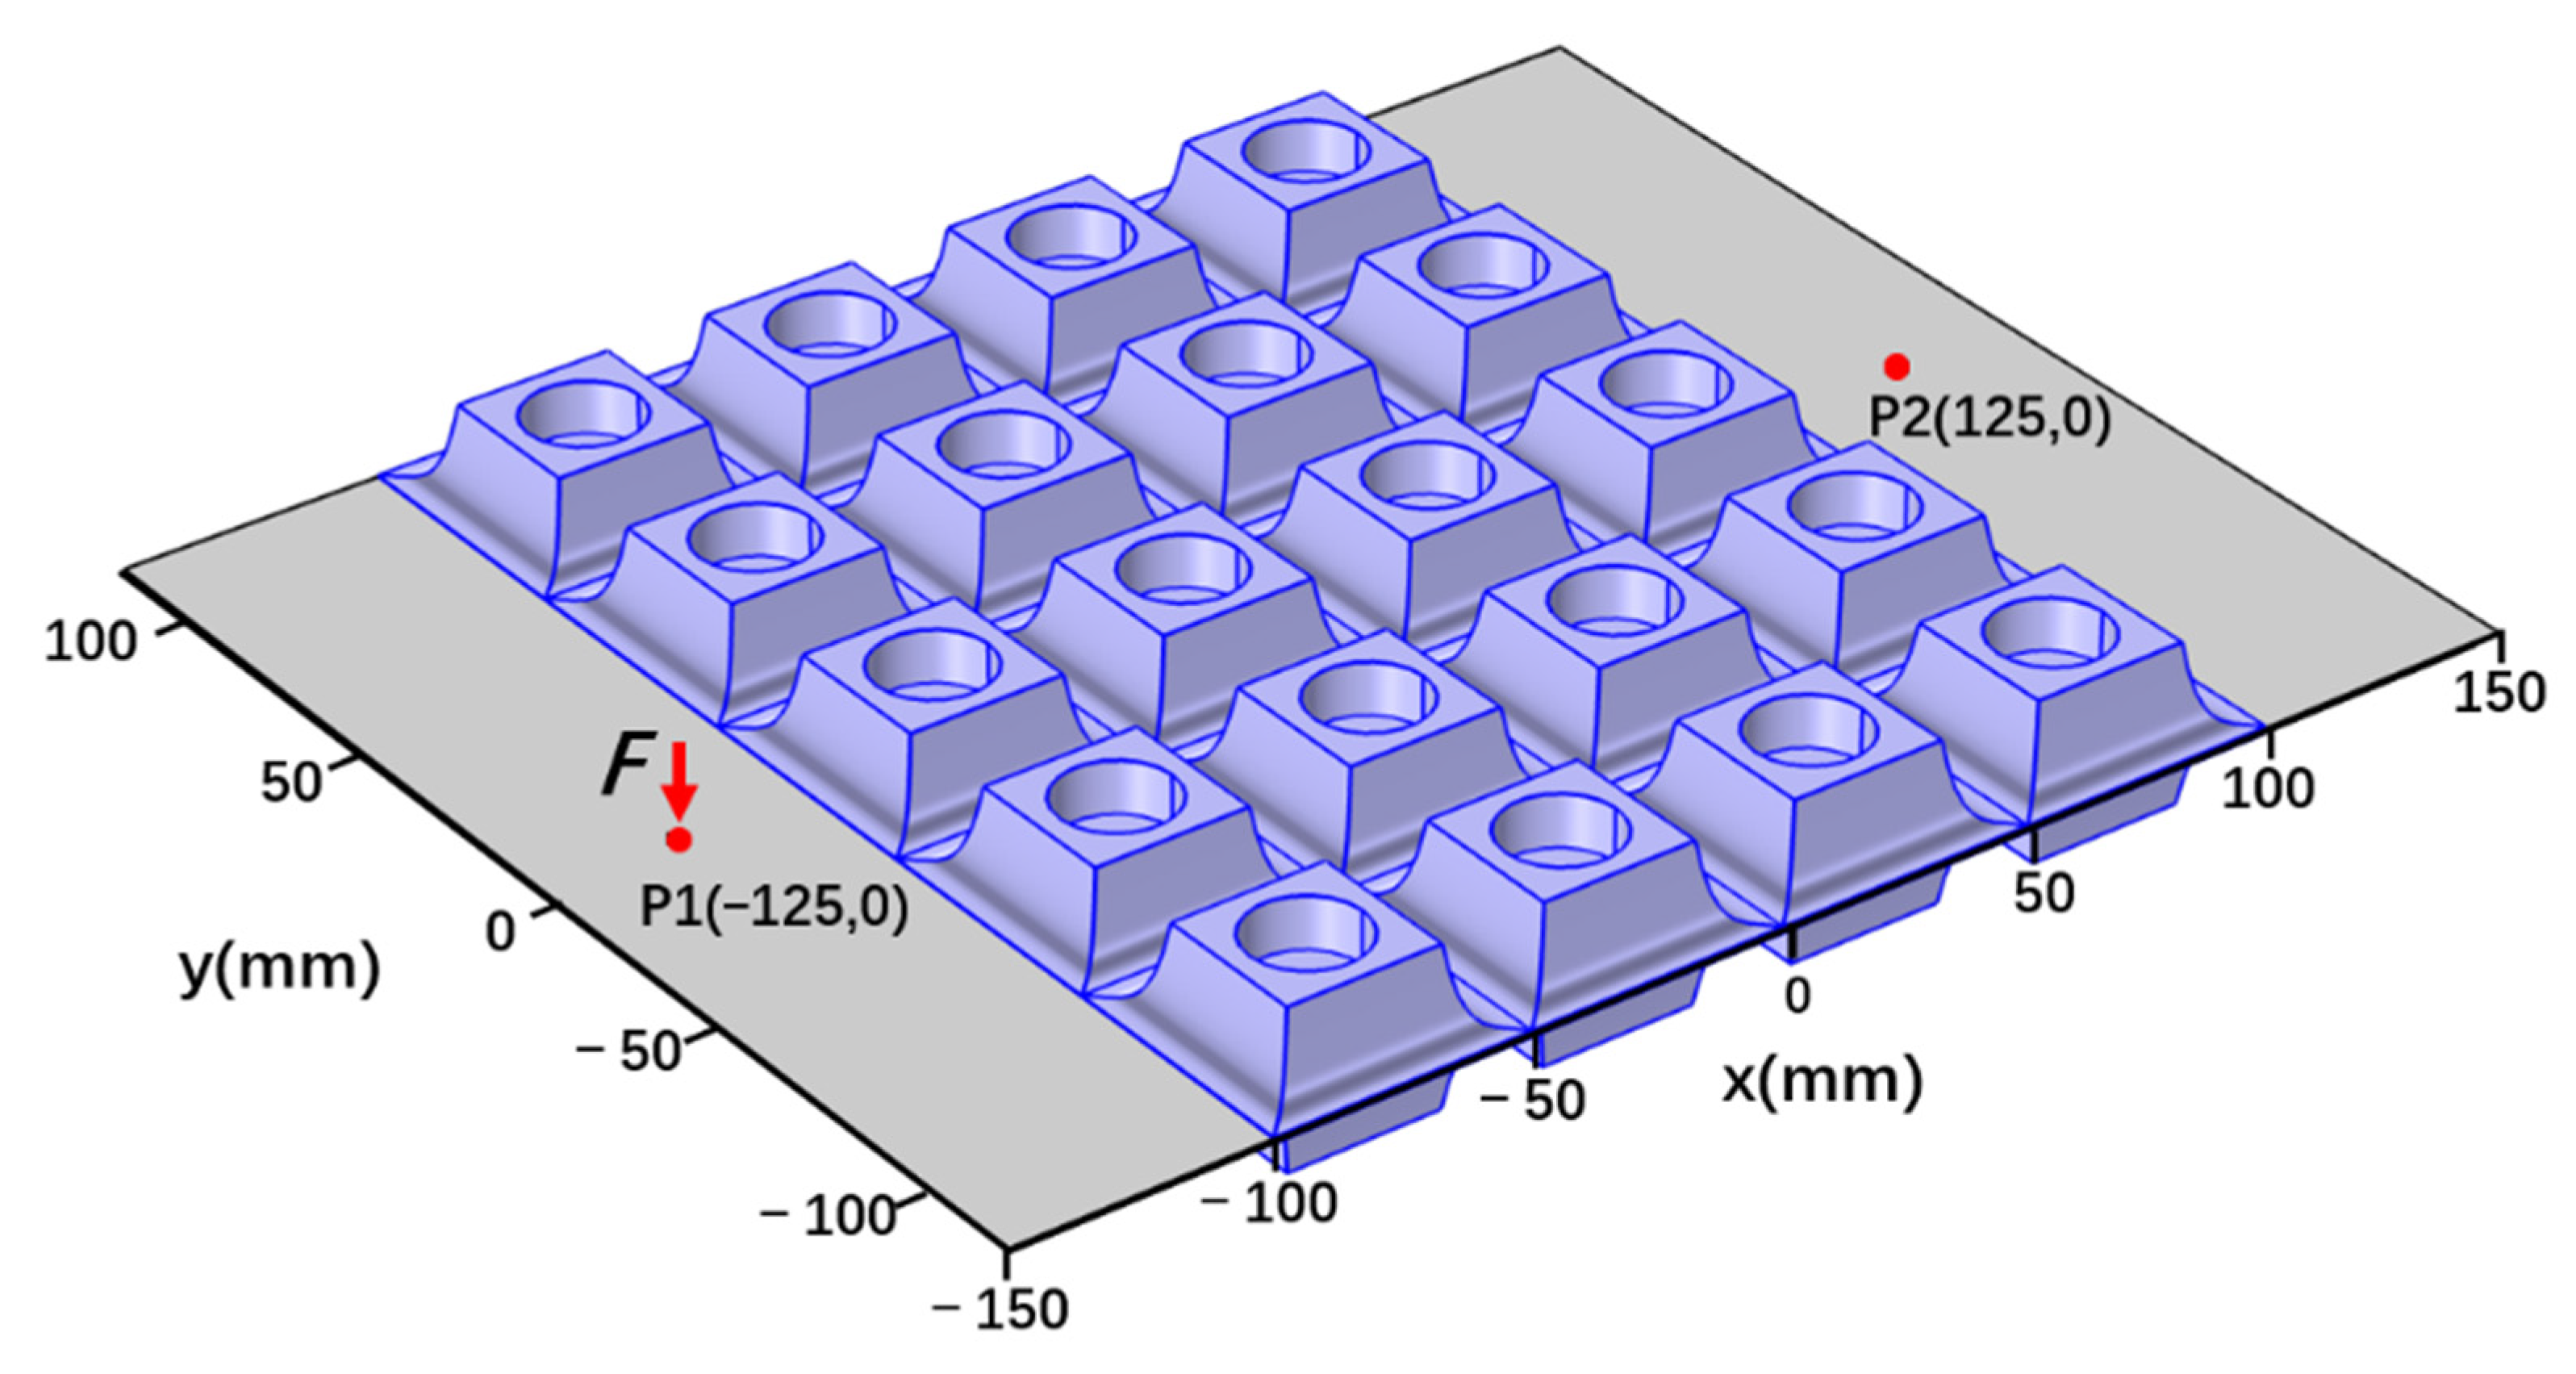
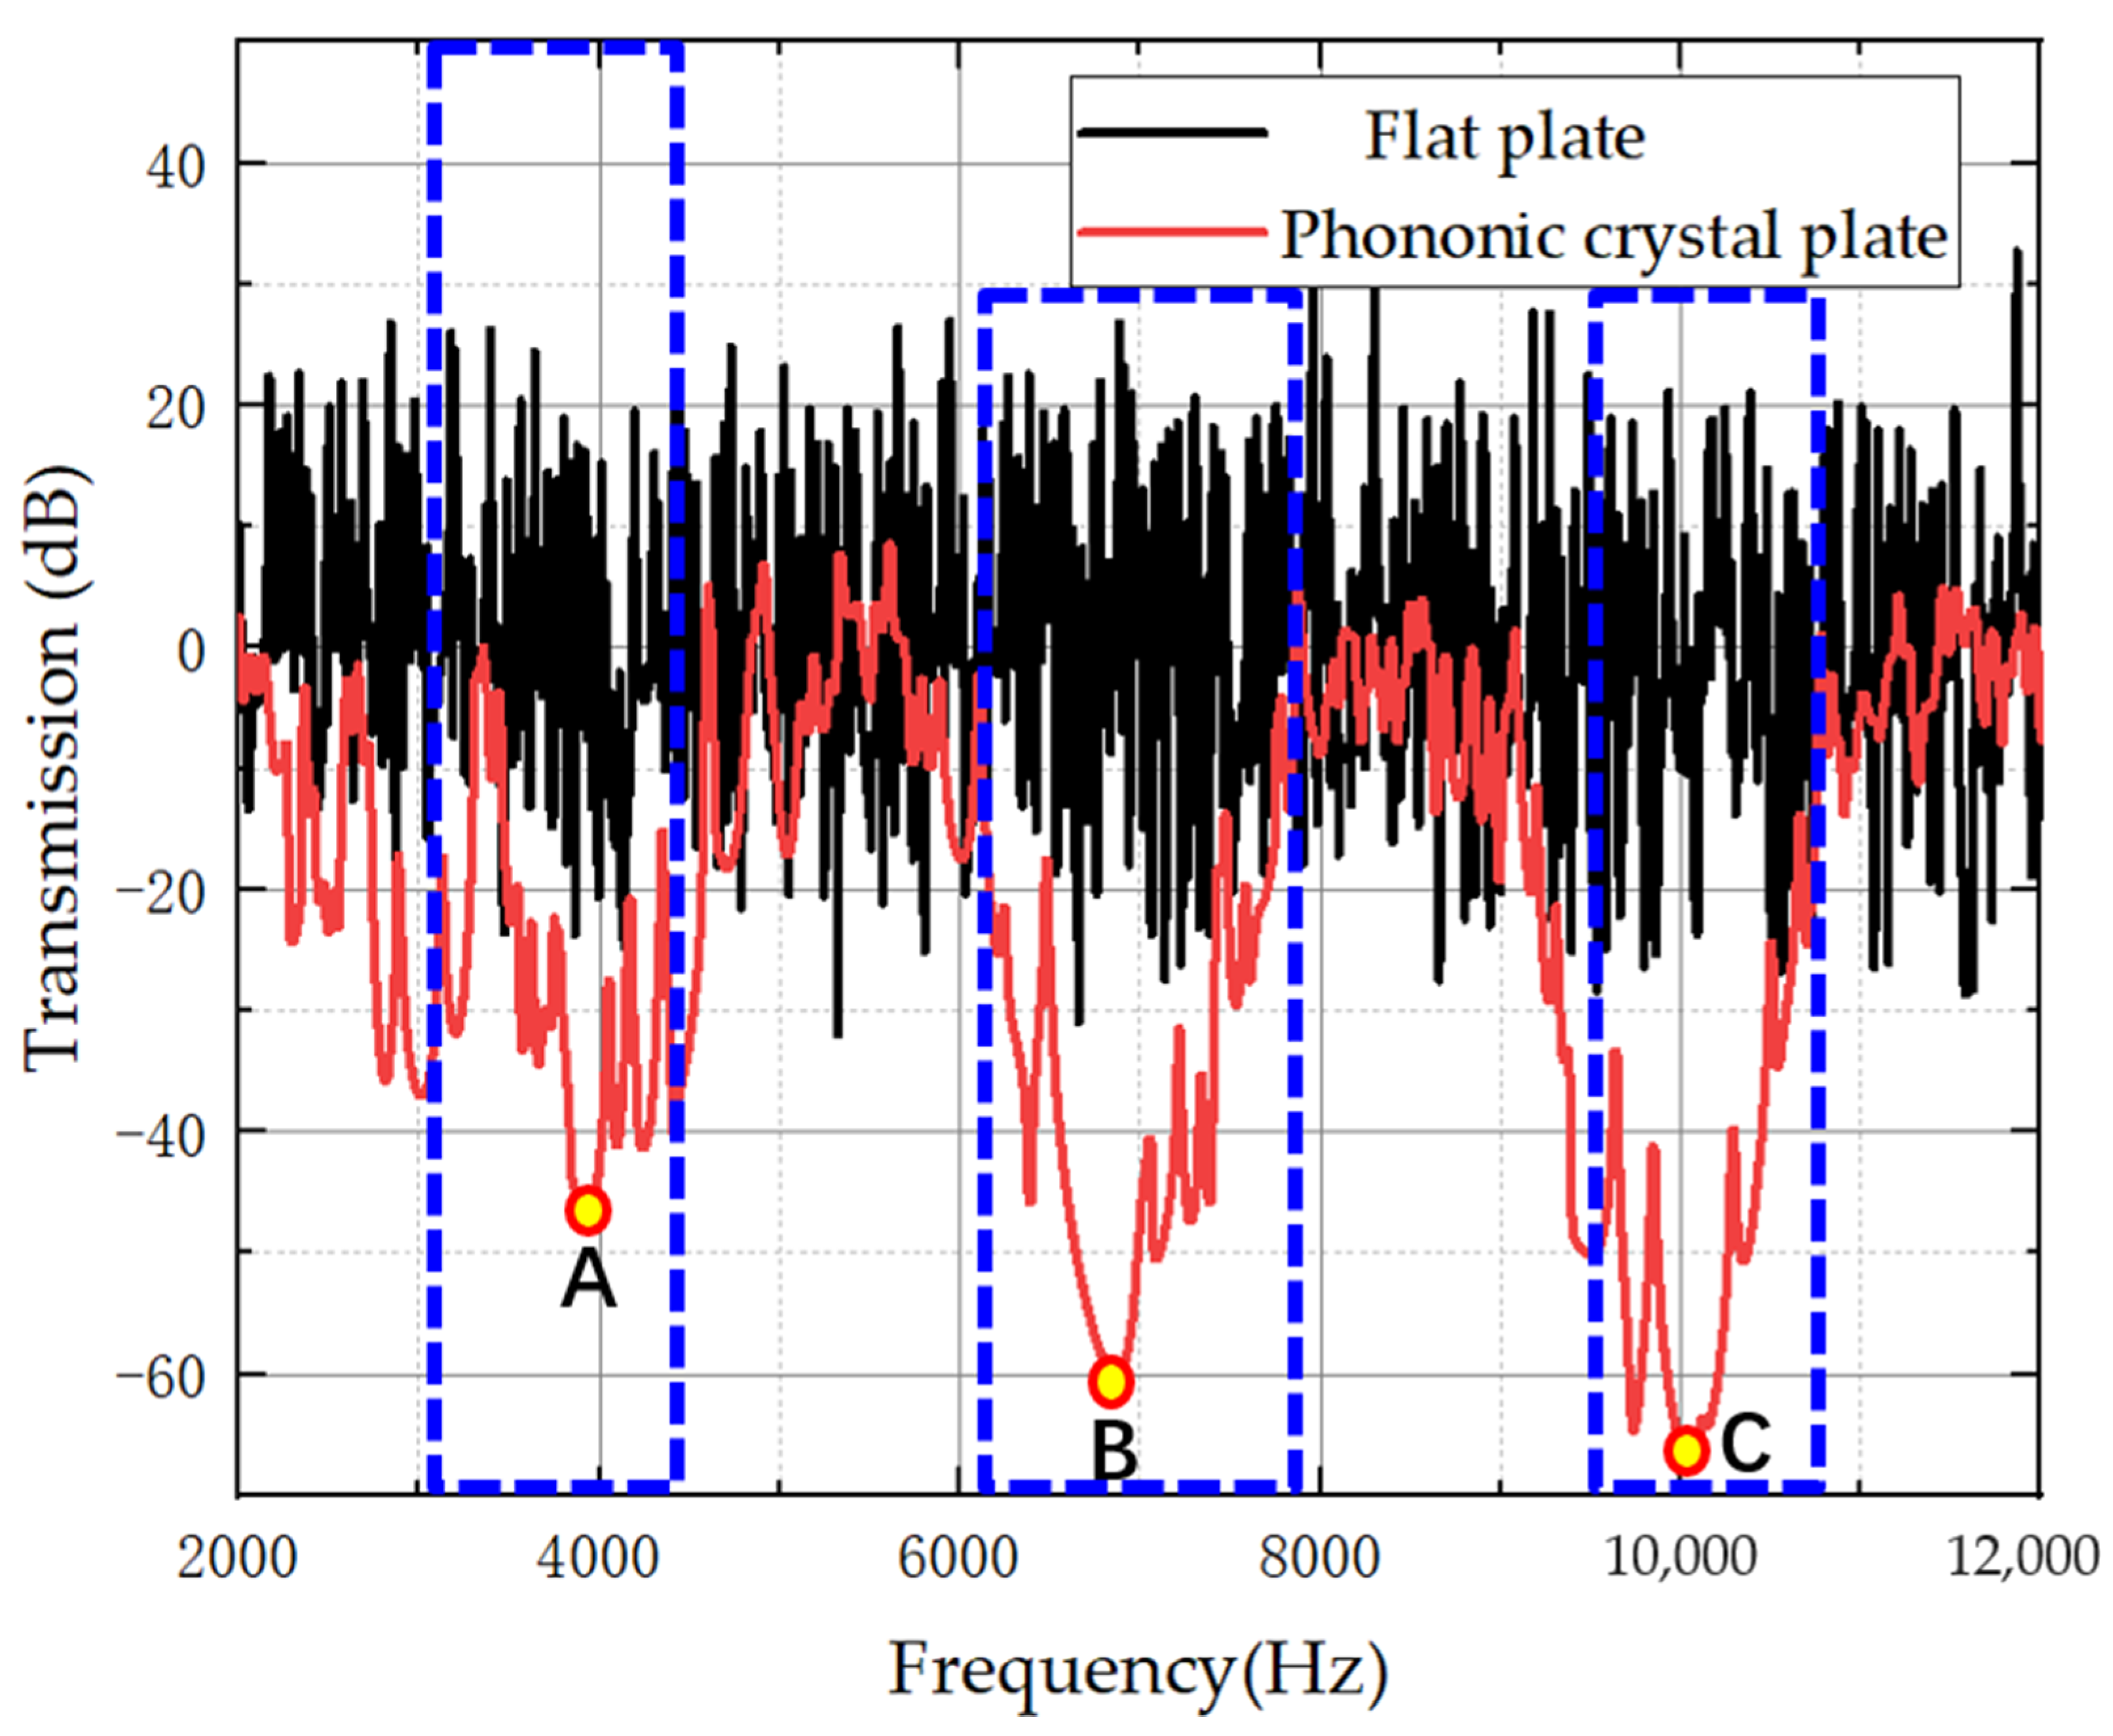
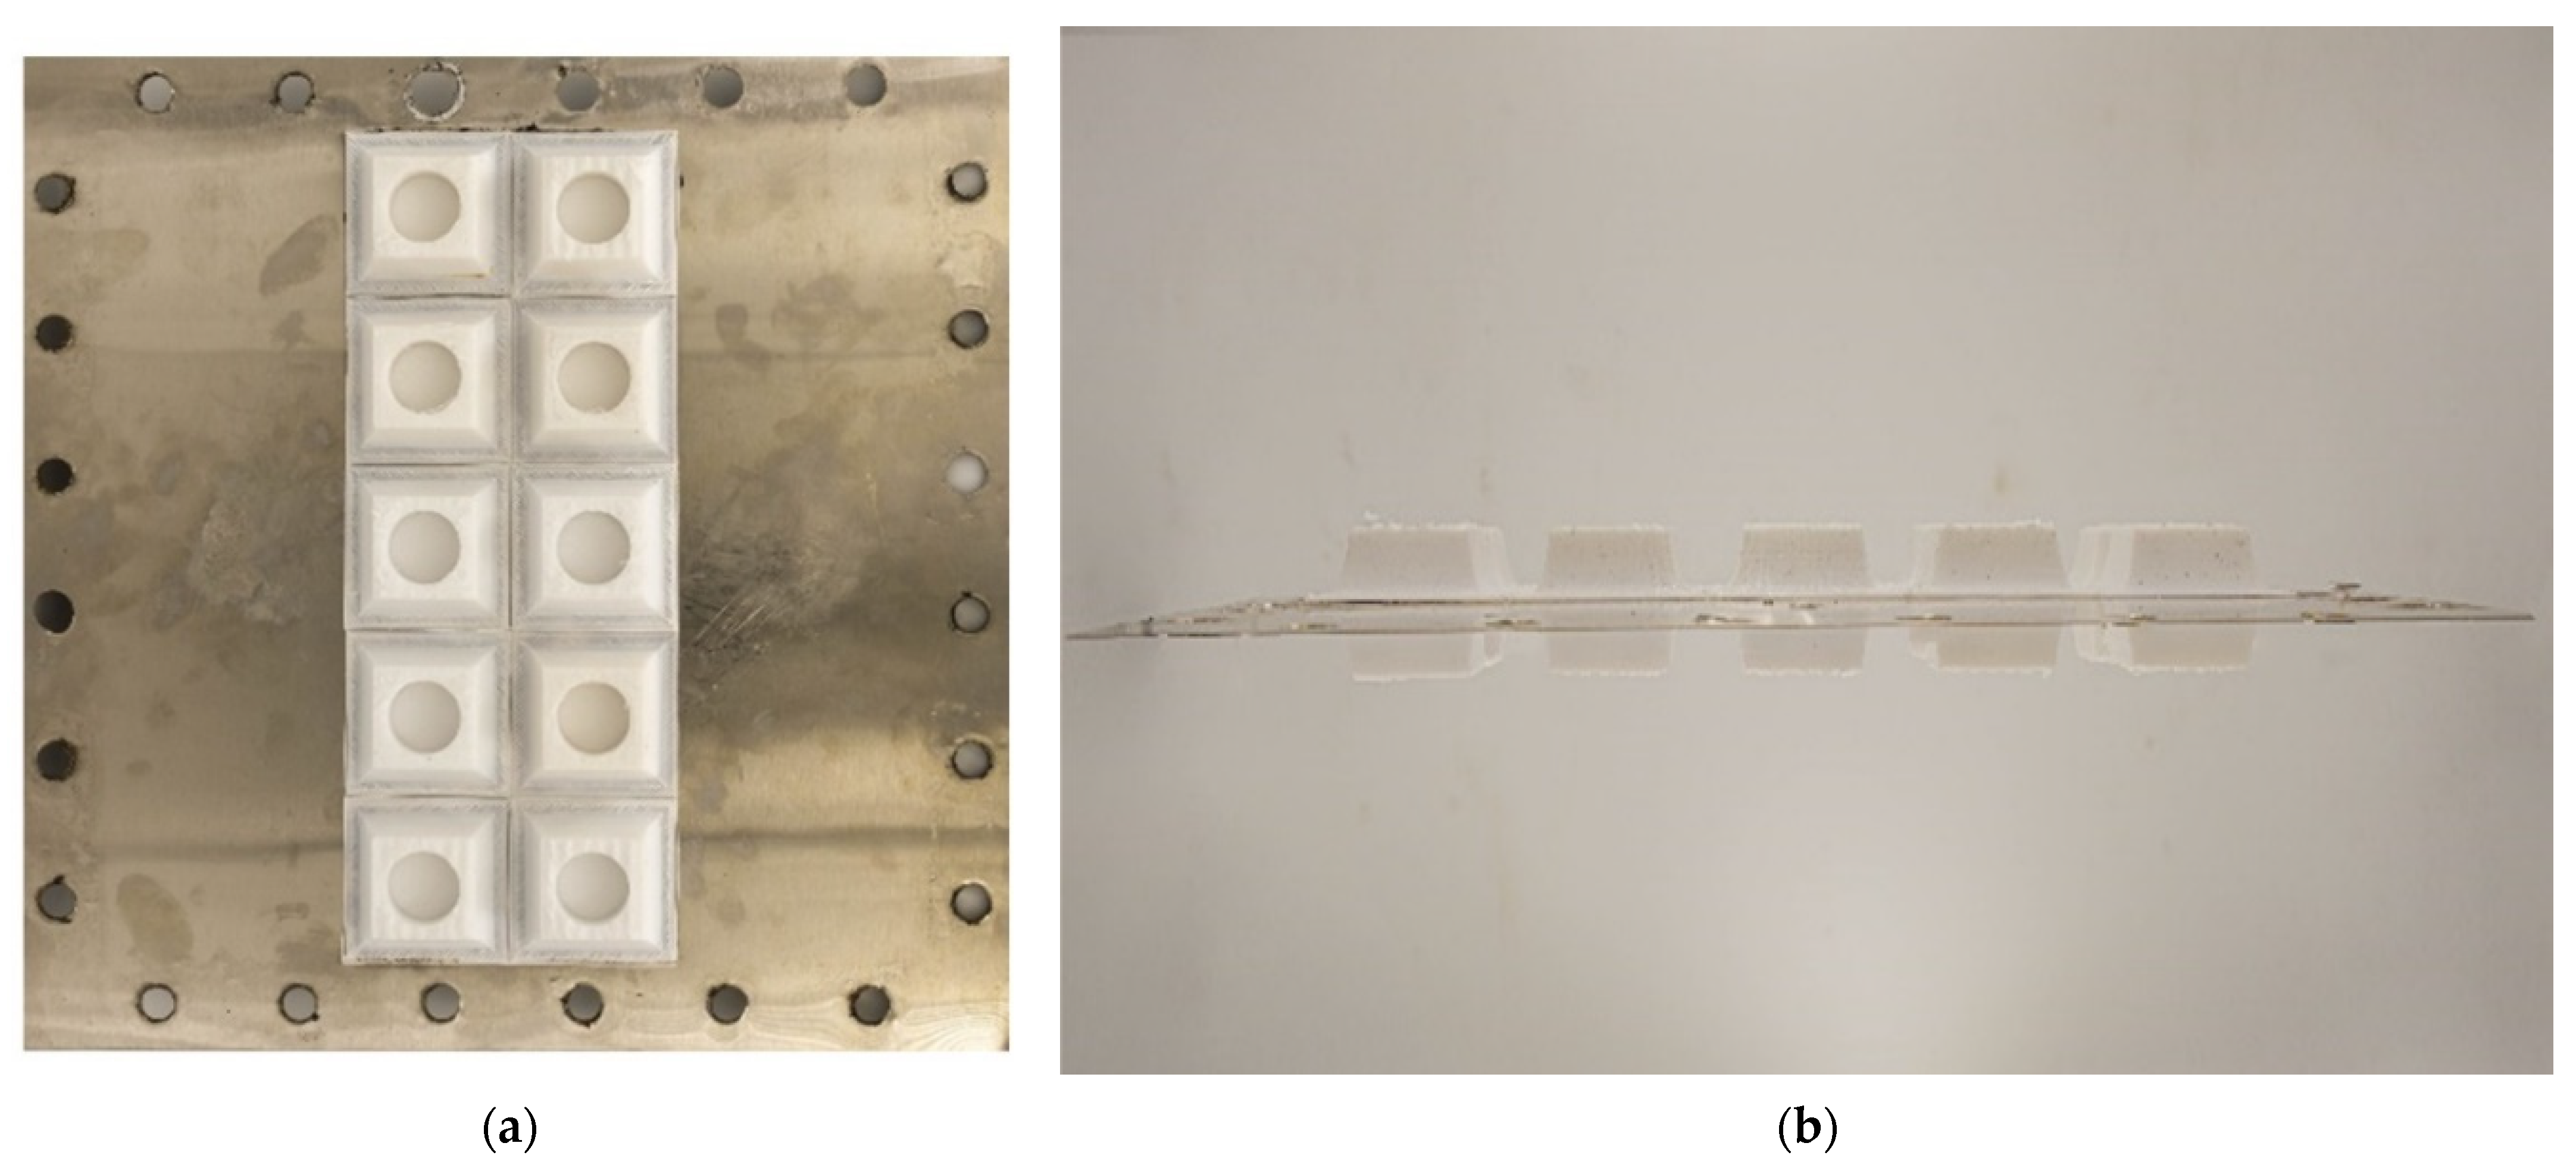
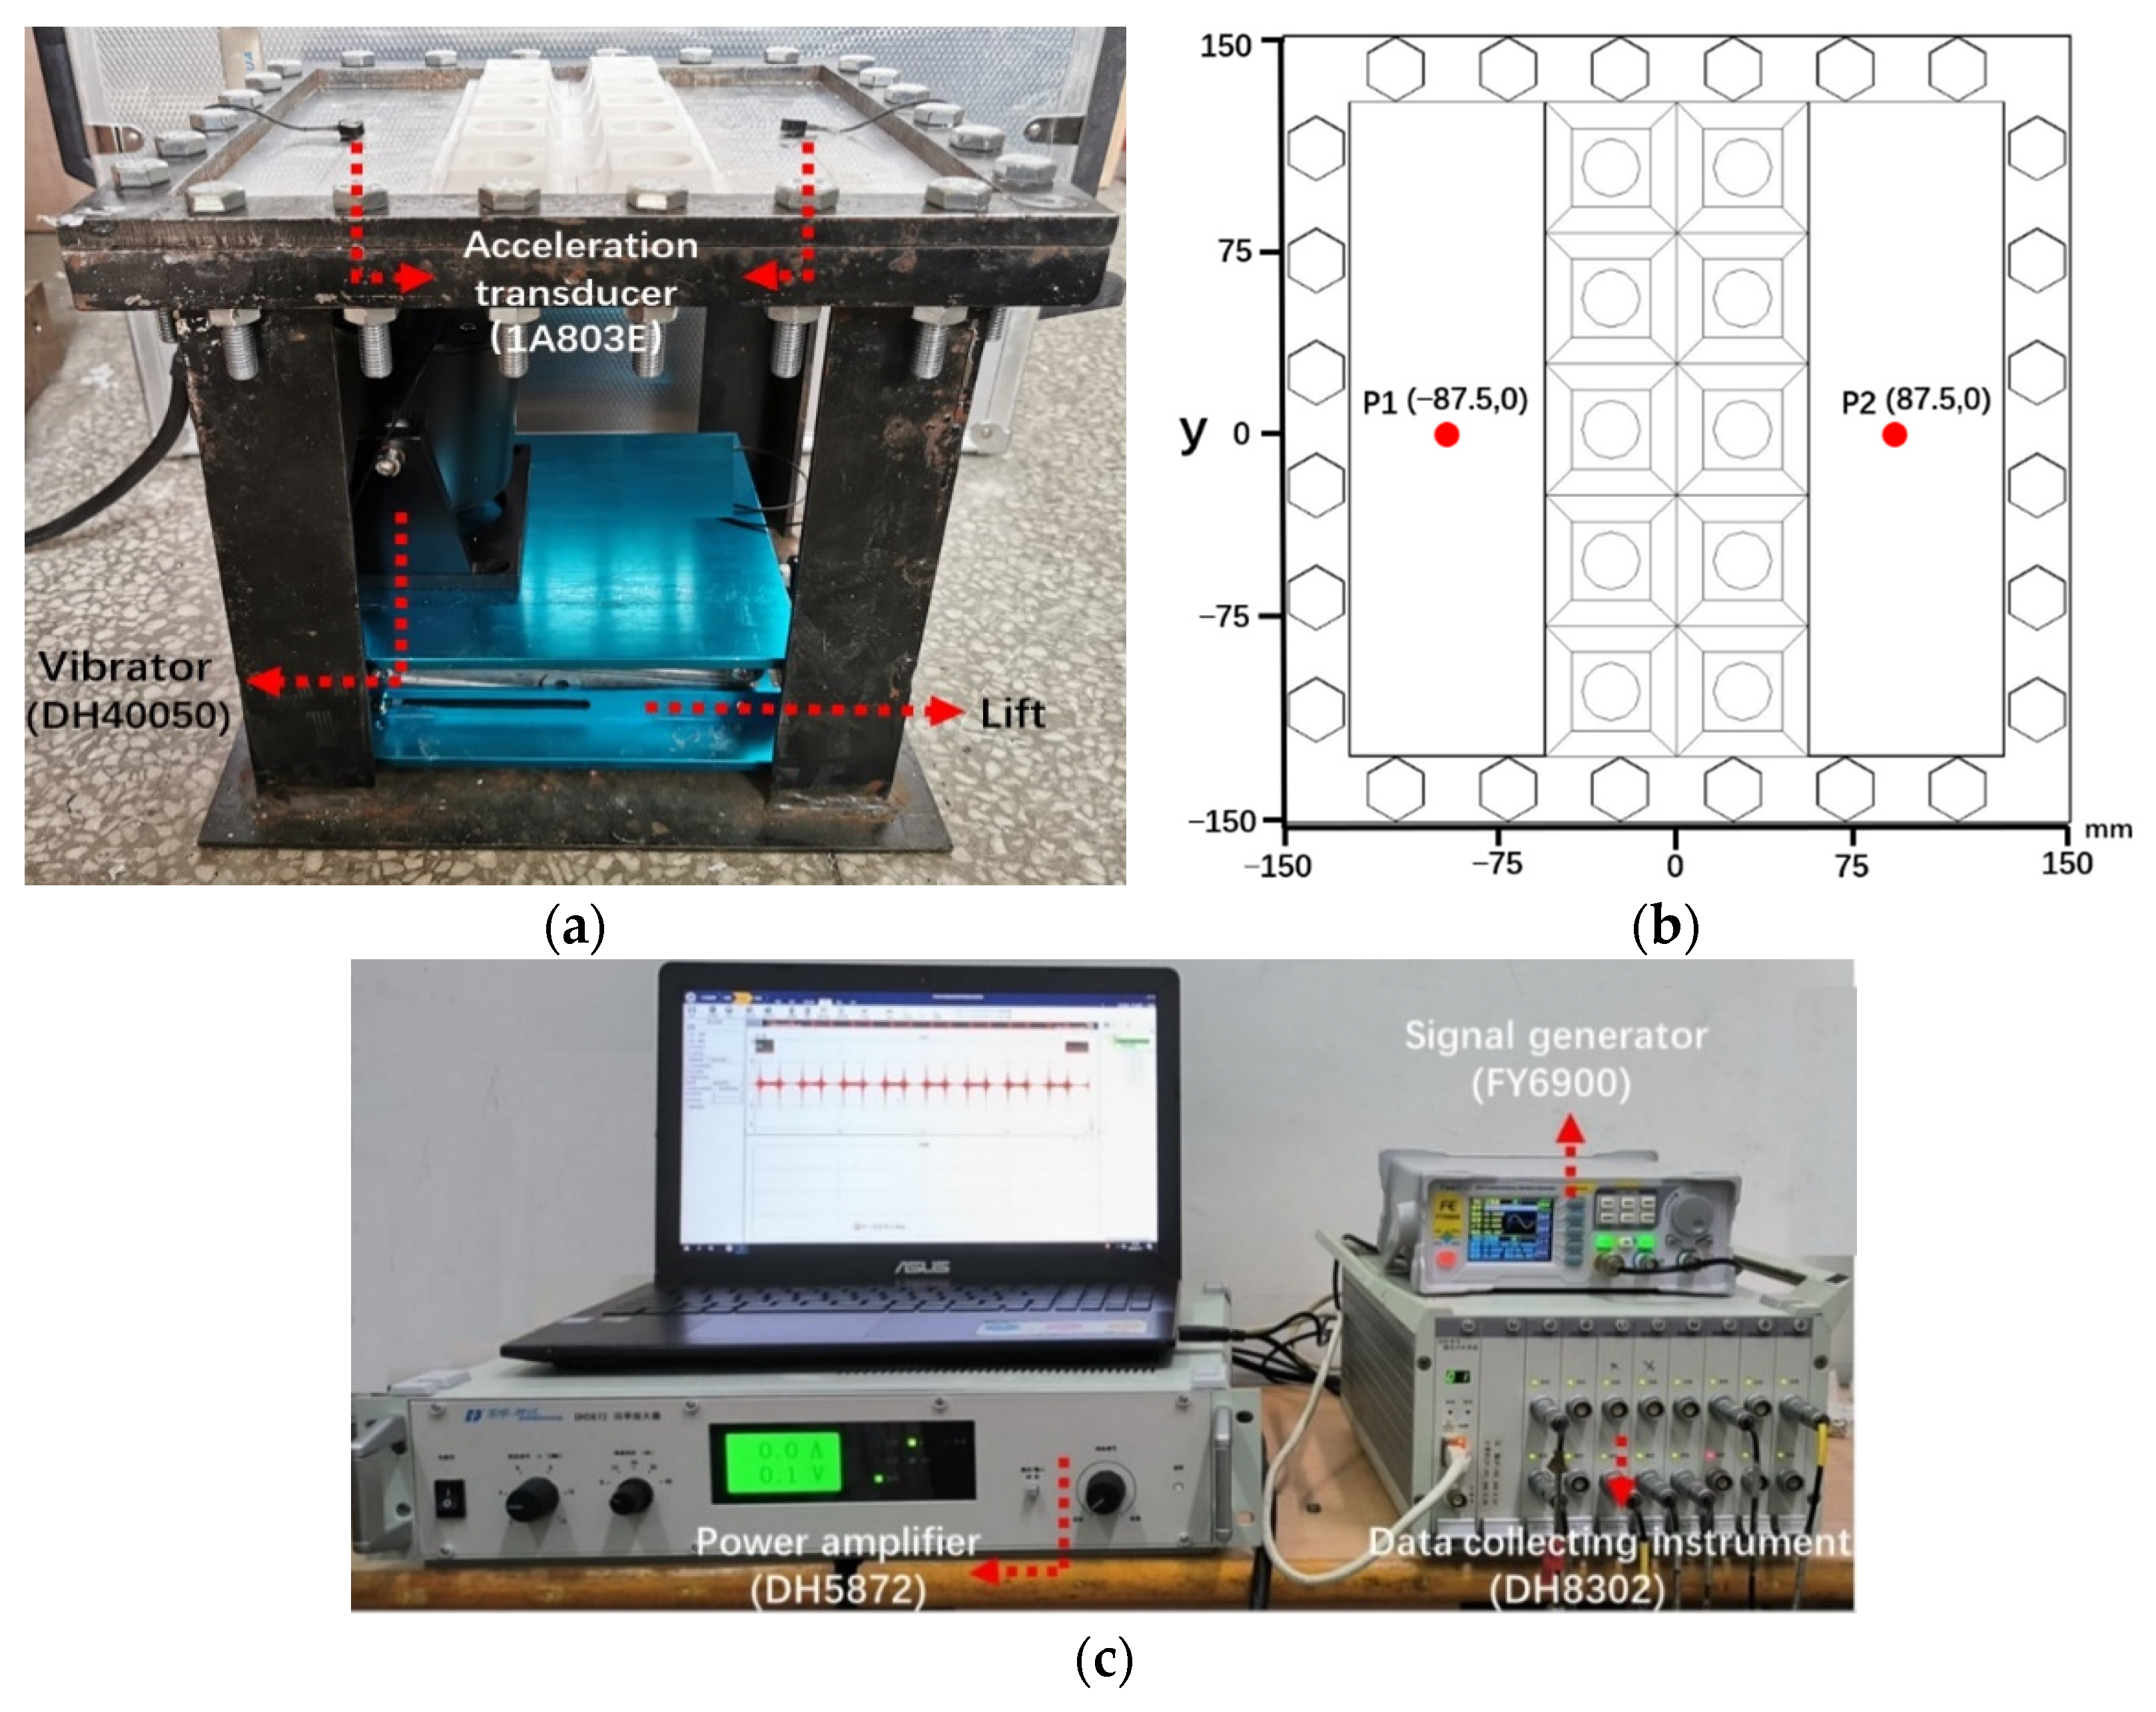
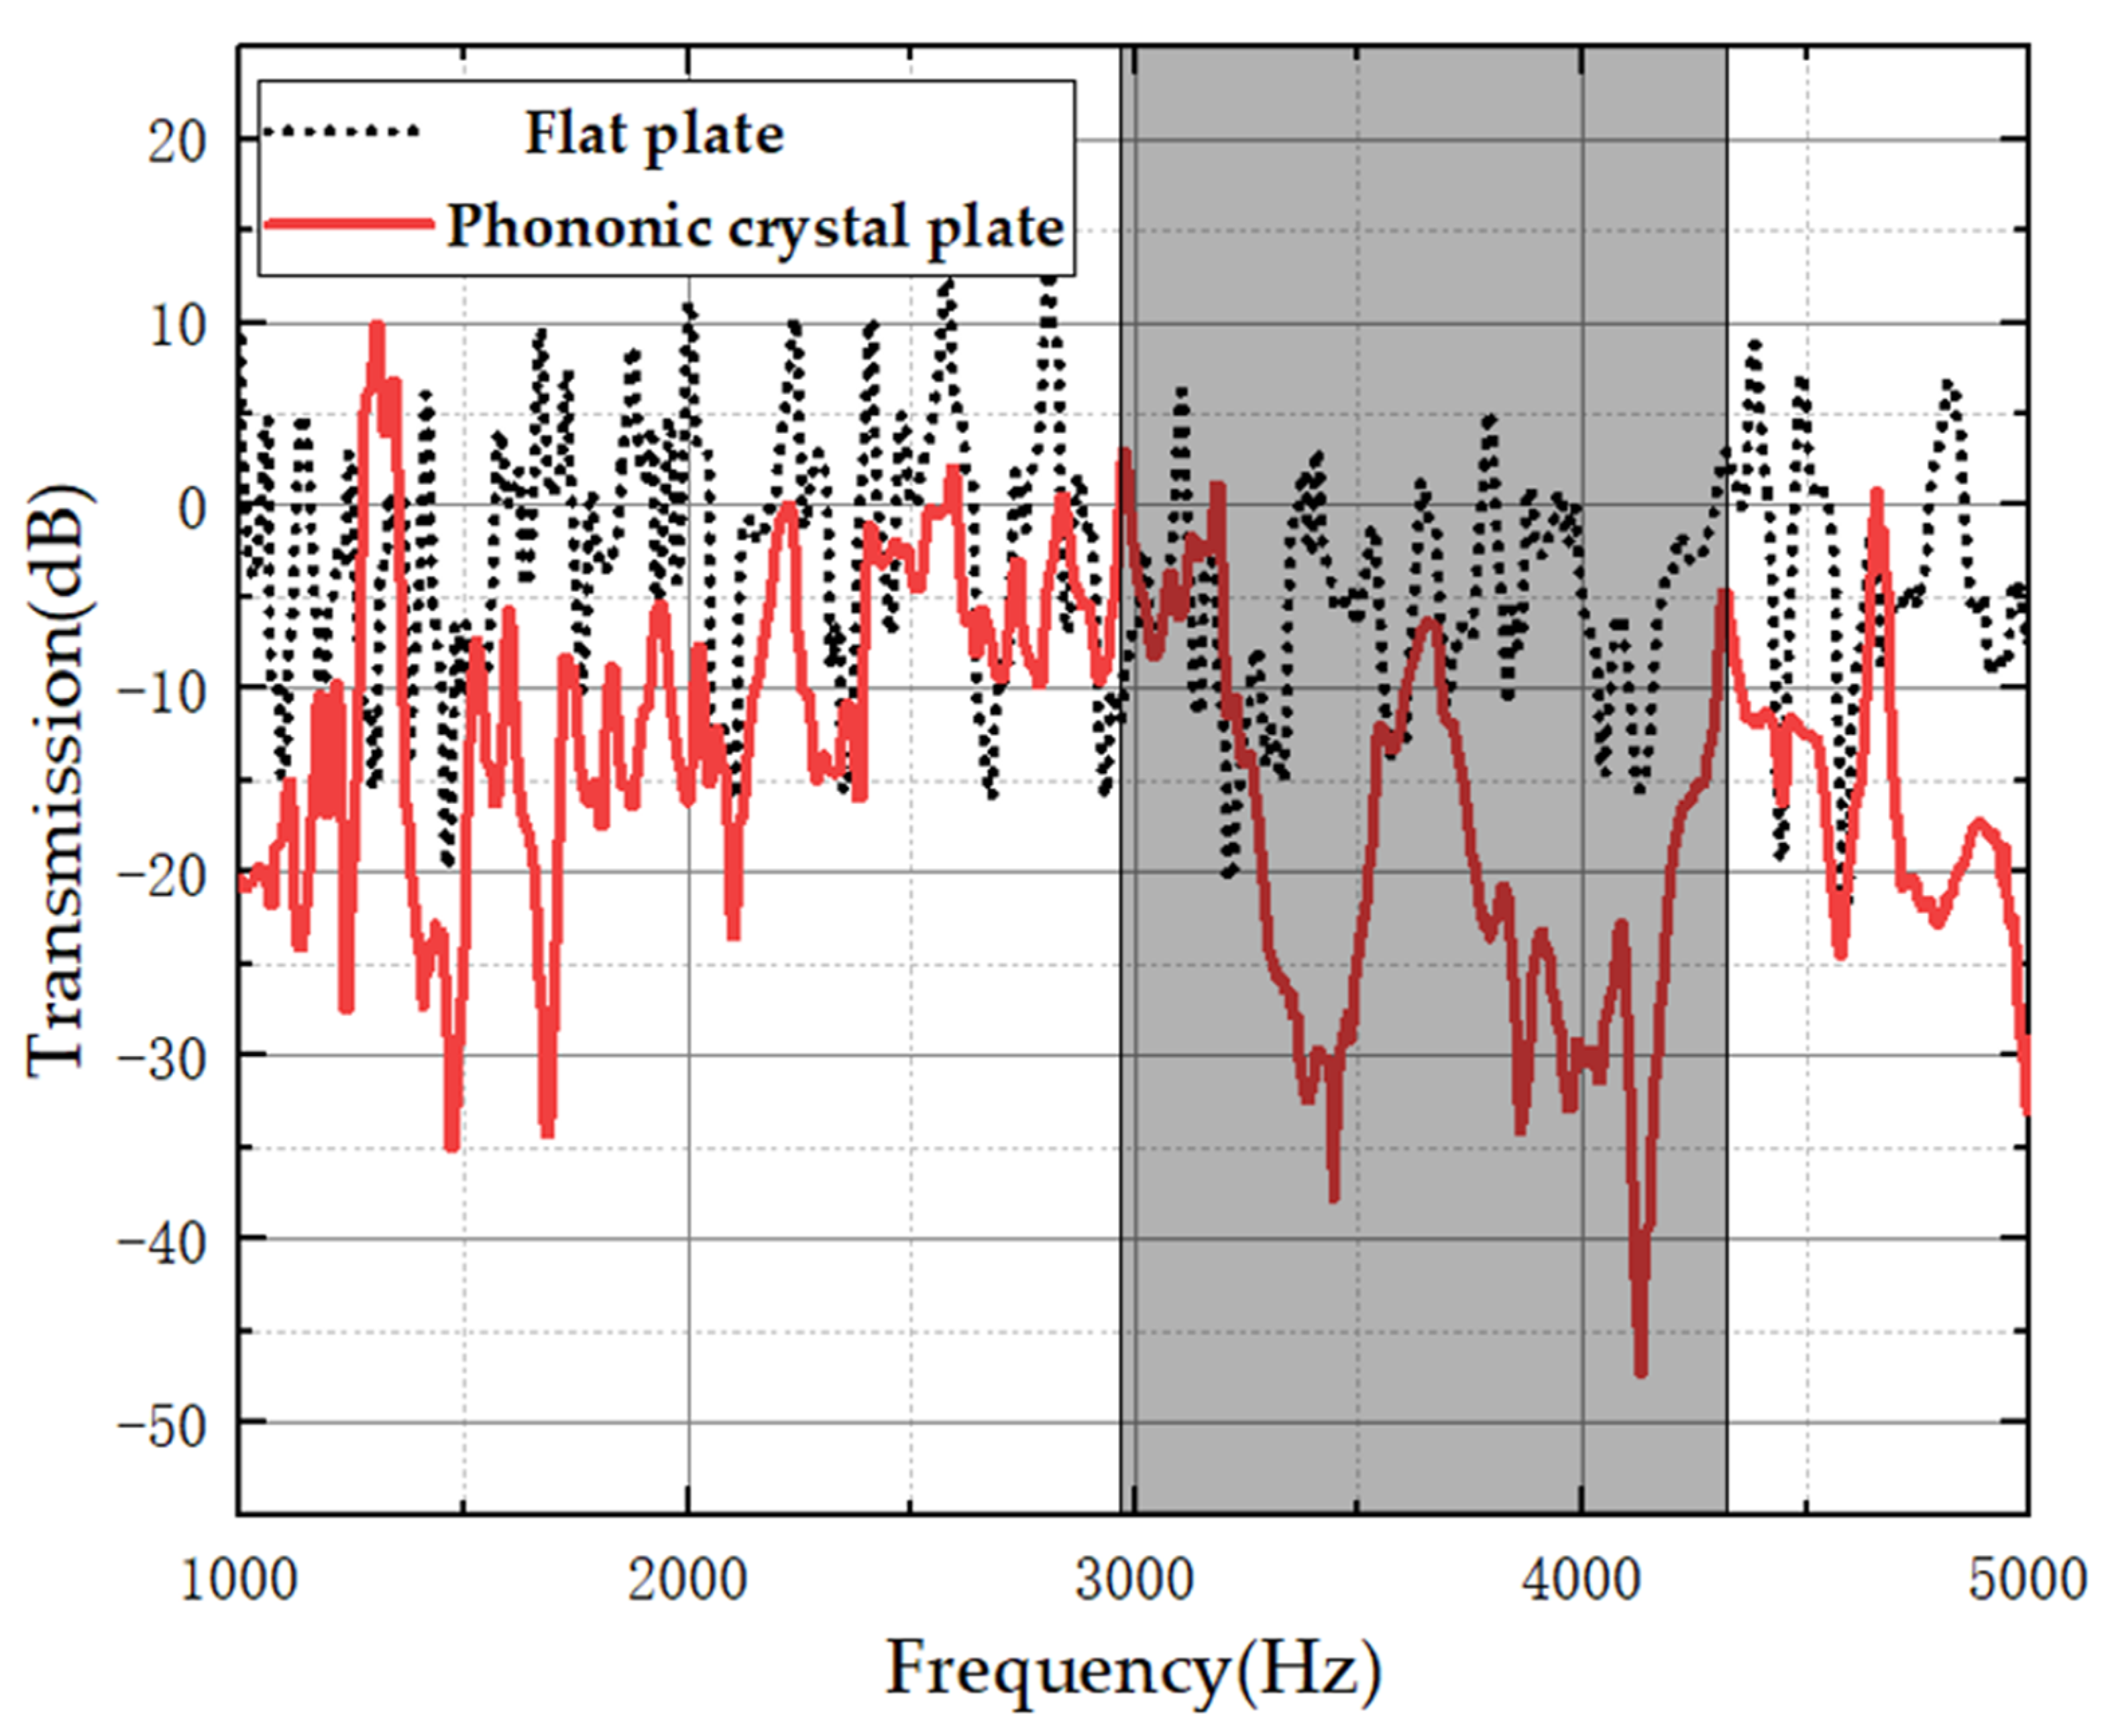
3.3. Experimental Verification
4. Influencing Factors of Band Gaps of the Symmetric Power-Exponent Prismatic Phononic Crystal
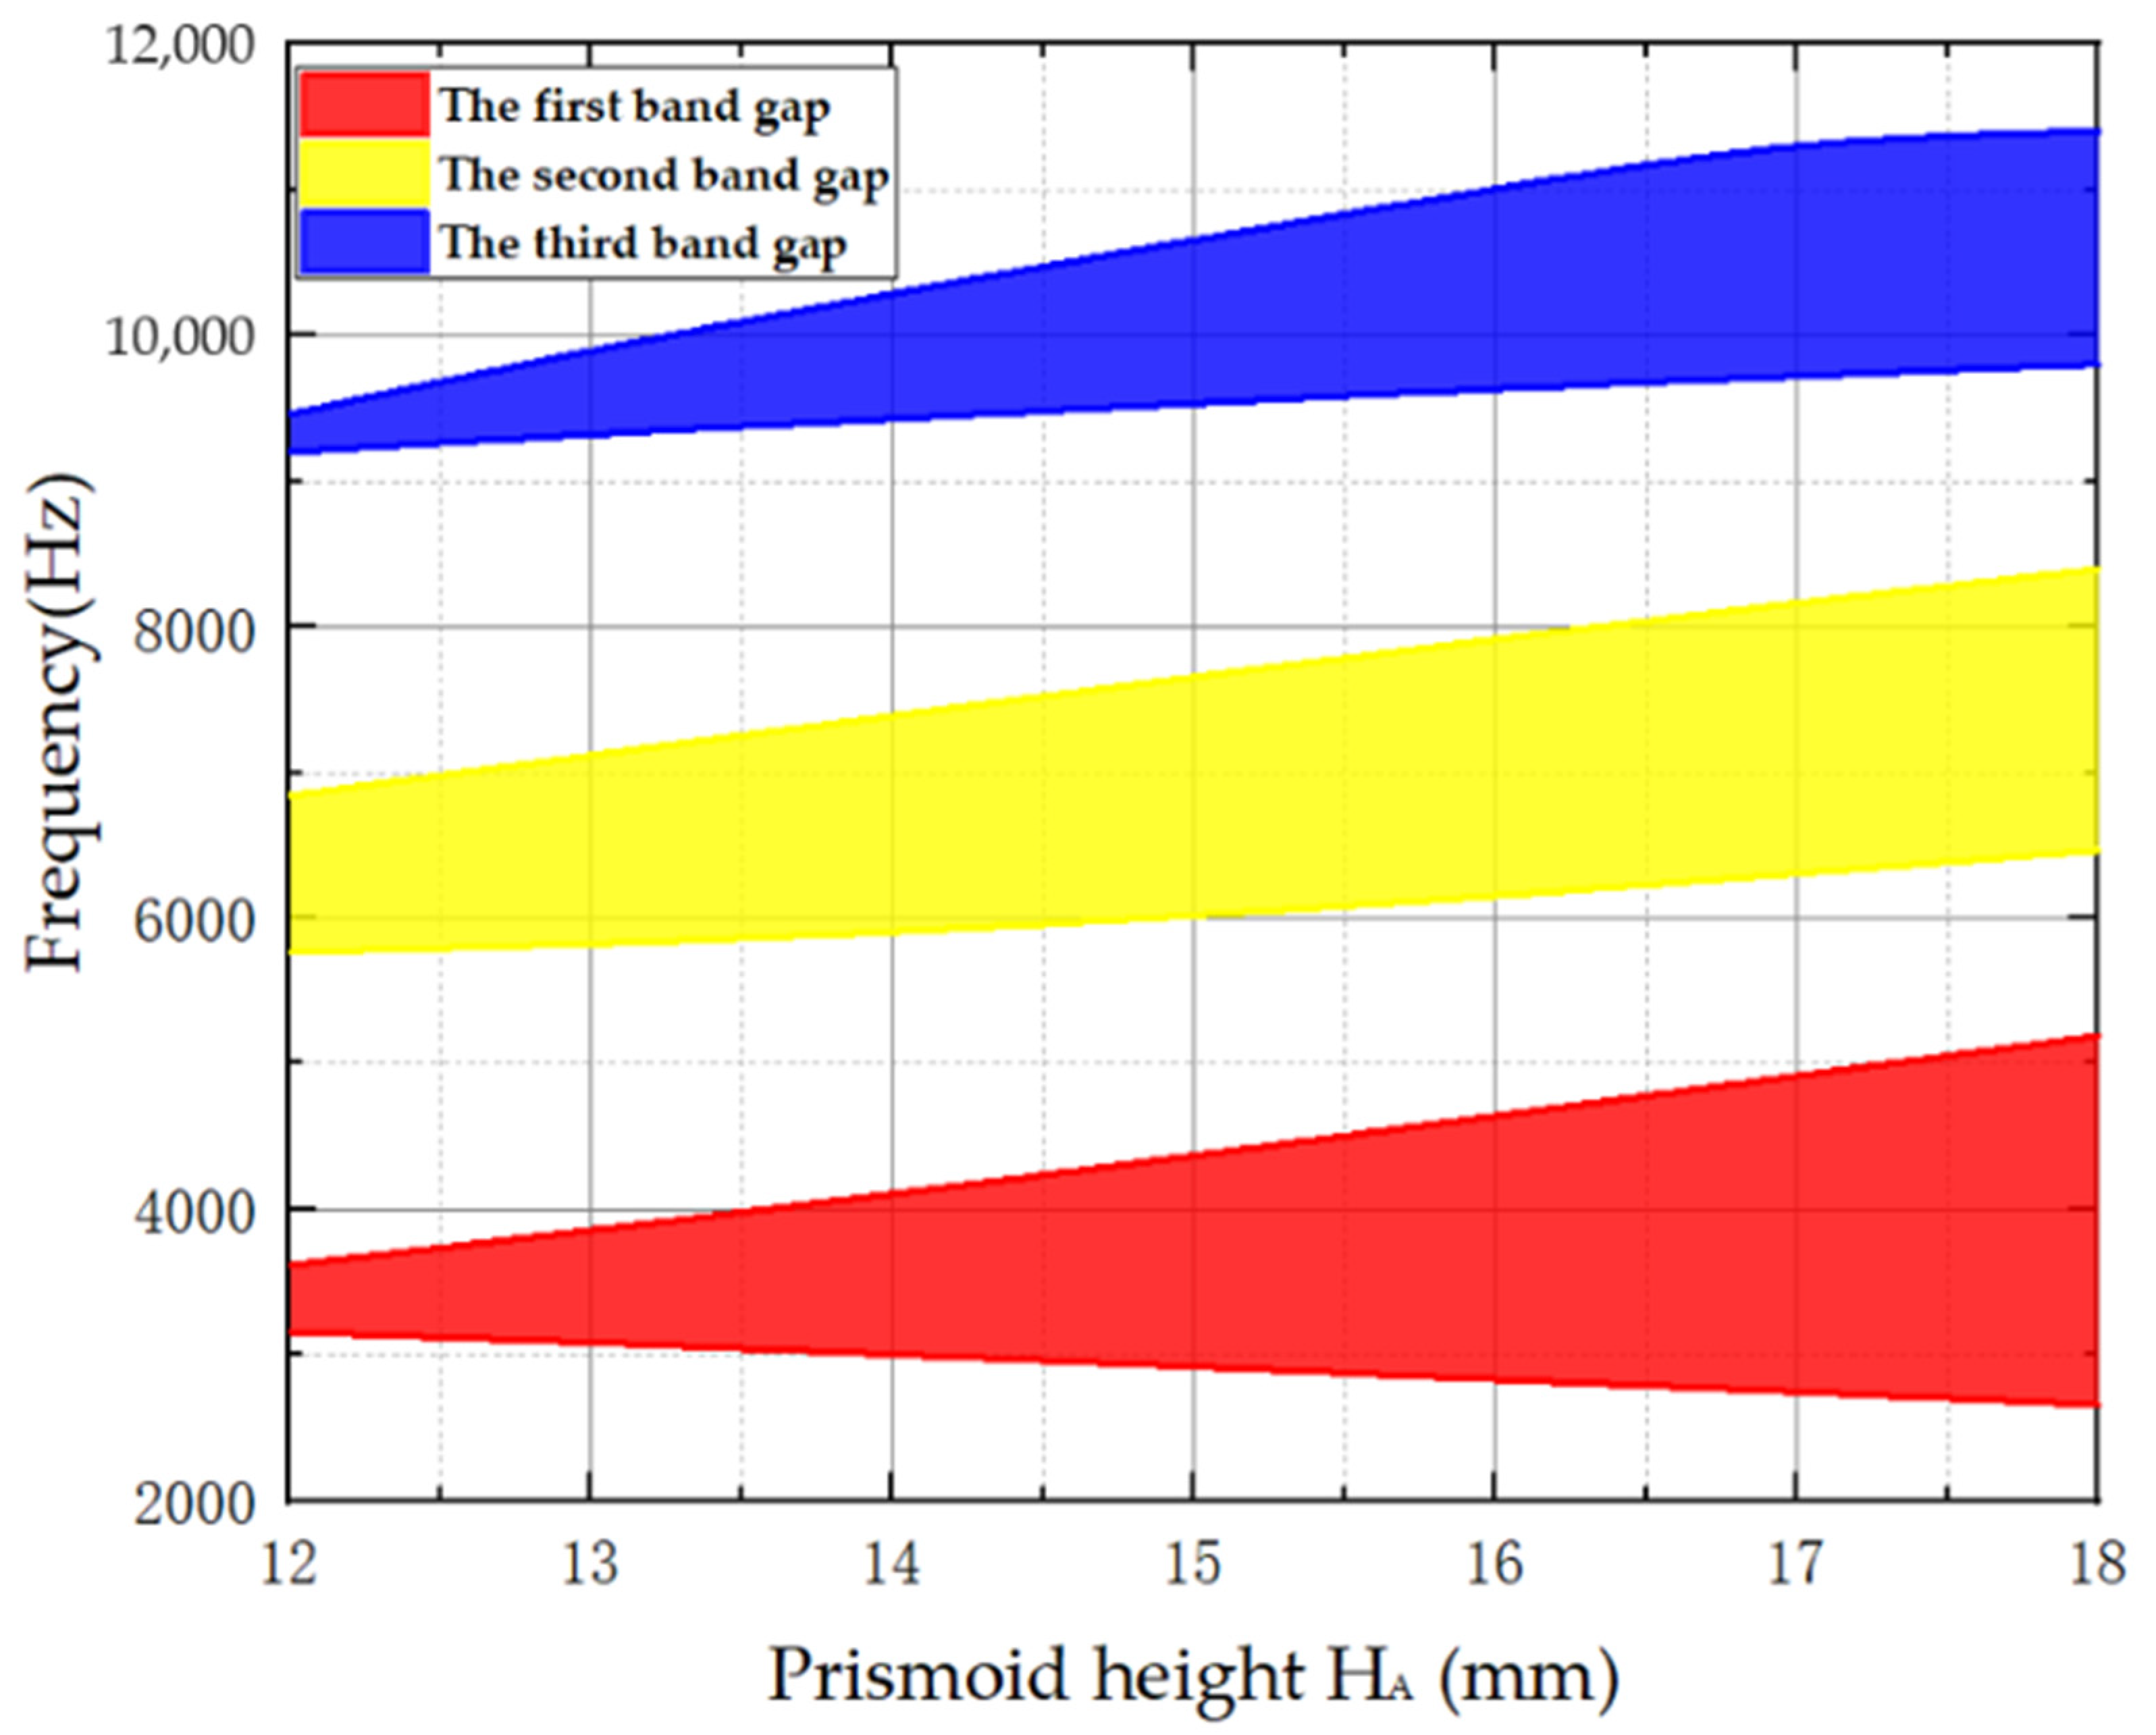
4.1. Influence of Power-Exponent Prismoid Height HA on the Band Gaps
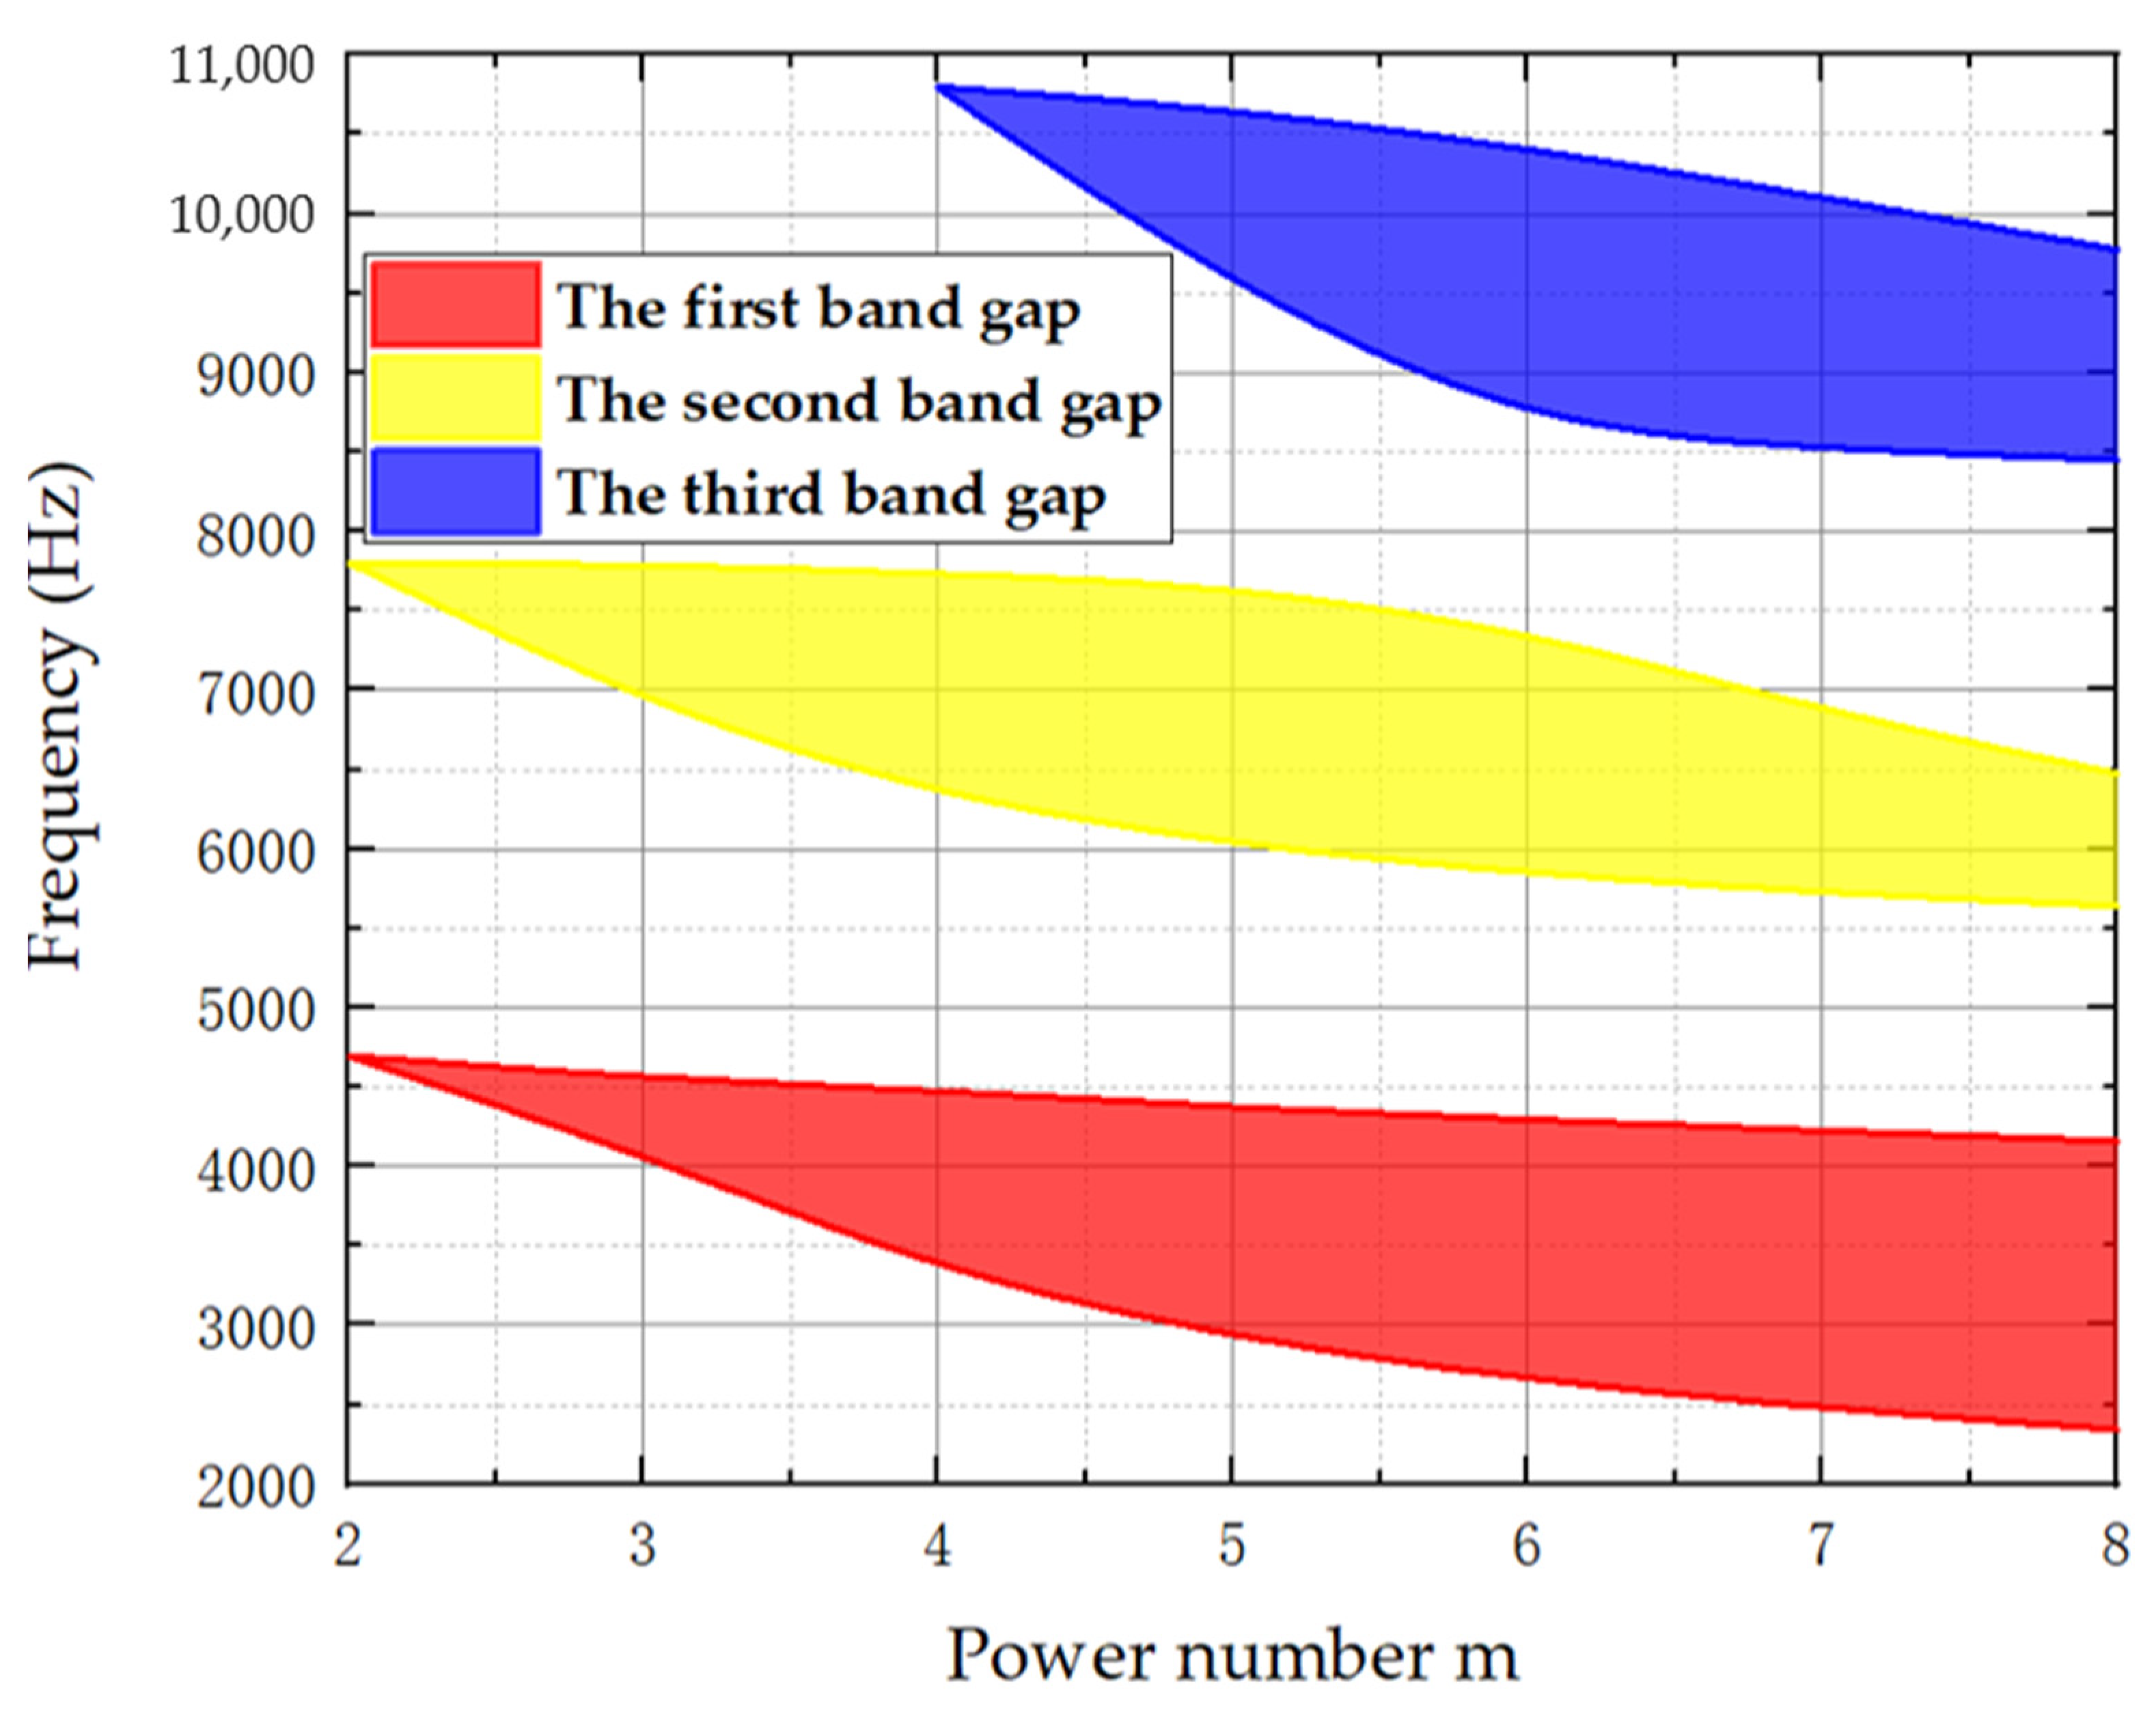
4.2. Influence of Power Number m of the Power-Exponent Prismoid Edge on Band Gaps
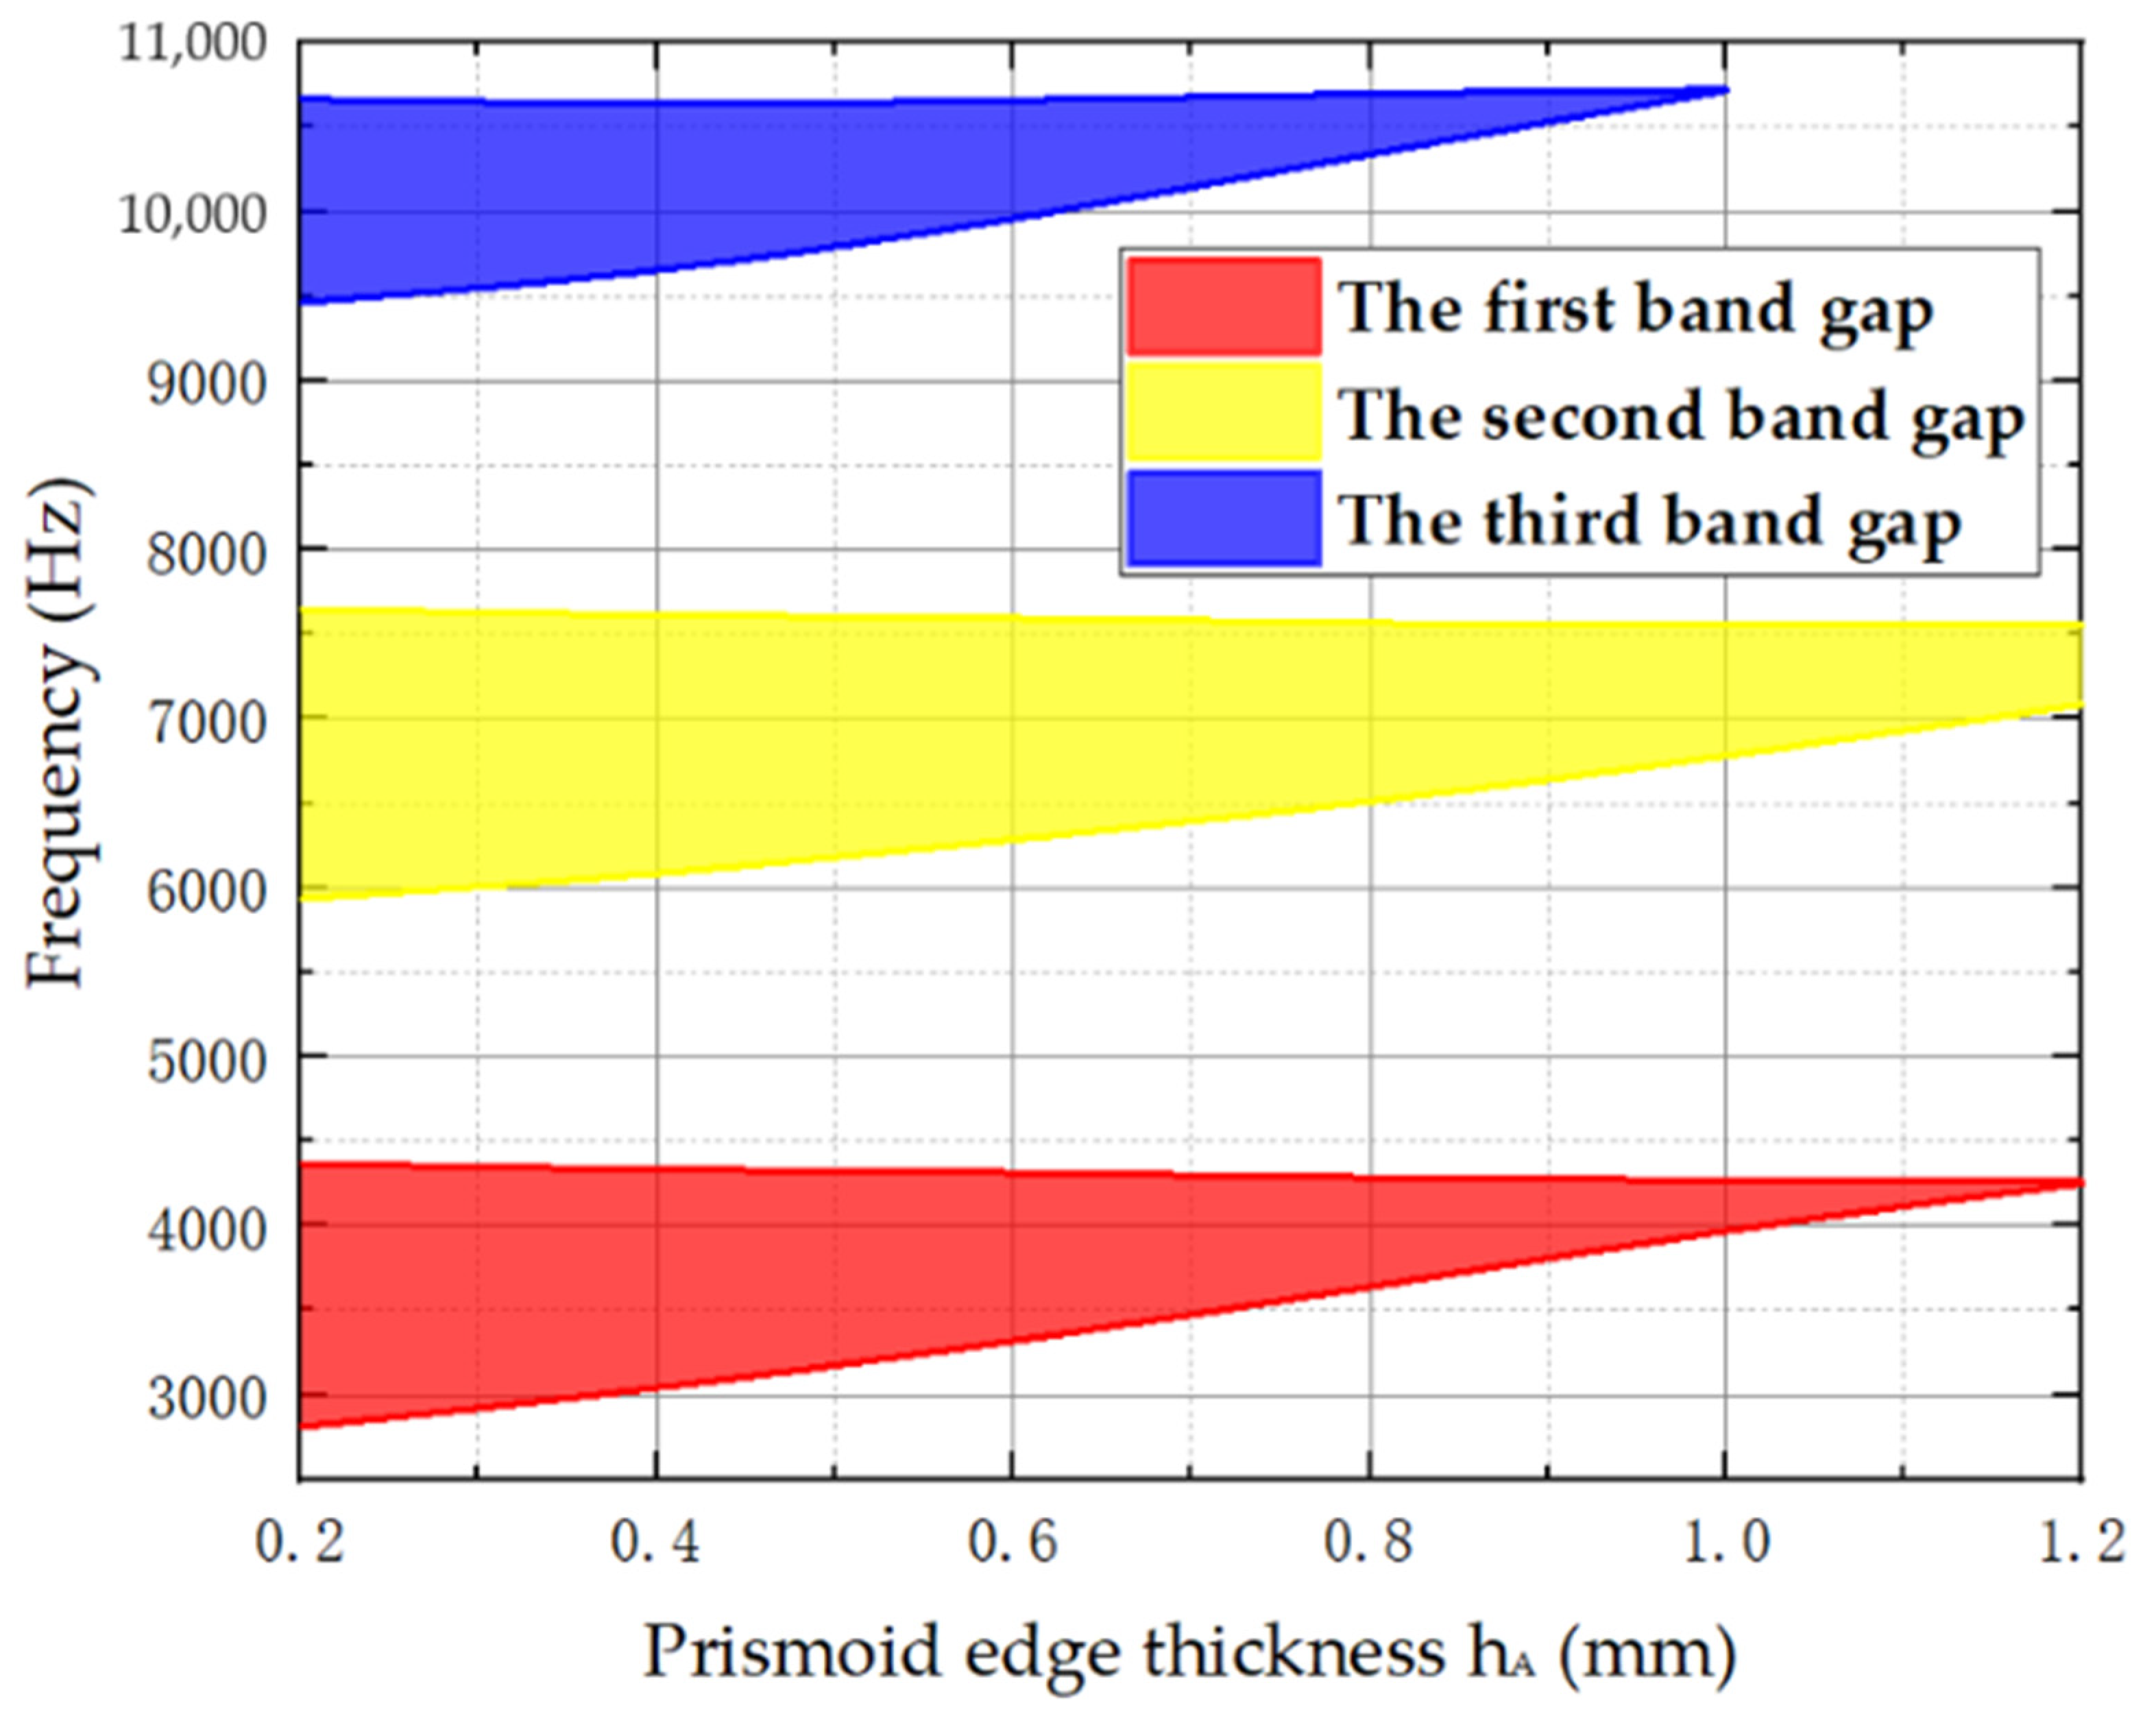
4.3. Influence of Prismoid Edge Thickness hA on the Band Gaps
5. Conclusions
- (1)
- The proposed symmetric power-exponent prismatic phononic crystal structure has three wide-band bending-wave band gaps. The calculation results demonstrate that the 1st, 5th, and 10th natural frequencies of the phononic crystal protocell correspond to the frequency bands of the 1st, 2nd, and 3rd band gaps, respectively. In addition, the modal shapes show that the energy-focusing phenomenon occurs at the bevel faces of the prismoid. Therefore, the band gaps of the phononic crystals are generated by the local resonance caused by the energy-focusing effect. The bandgap characteristics of the symmetric phononic crystal are verified by numerical simulation and experimental test, and it can be concluded that the bending vibration of a thin plate can be effectively suppressed via the energy-focusing effect and the bandgap characteristics of the phononic crystal.
- (2)
- With an increasing height, HA, of the power-exponent prismoid, the bandwidths of all three band gaps become wider; the starting frequency of the first band gap begins to decrease, while that of the other two band gaps gradually increases. Moreover, the increase in power number m of the prismoid can lead to a decrease in the starting frequencies of the band gaps. In addition, the increase of prismoid edge thickness can weaken the energy-focusing effect, and thus the band gaps gradually narrow down. On the premise of ensuring sufficient structural strength of the plate, the edge thickness, hA, can be reduced to obtain band gaps with a lower starting frequency and wider bandwidth.
Author Contributions
Funding
Institutional Review Board Statement
Informed Consent Statement
Data Availability Statement
Conflicts of Interest
References
- Pelat, A.; Gautier, F.; Conlon, S.C.; Semperlotti, F. The acoustic black hole: A review of theory and applications. J. Sound Vib. 2020, 476, 115316. [Google Scholar] [CrossRef]
- Ji, H.; Luo, J.; Qiu, J.; Cheng, L. Investigations on flexural wave propagation and attenuation in a modified one-dimensional acoustic black hole using a laser excitation technique. Mech. Syst. Signal Processing 2018, 104, 19–35. [Google Scholar] [CrossRef]
- Zhou, T.; Cheng, L. A resonant beam damper tailored with acoustic black hole features for broadband vibration reduction. J. Sound Vib. 2018, 430, 174–184. [Google Scholar] [CrossRef]
- Zhao, L. Low-frequency vibration reduction using a sandwich plate with periodically embedded acoustic black holes. J. Sound Vib. 2019, 441, 165–171. [Google Scholar] [CrossRef]
- Deng, J.; Guasch, O.; Zheng, L. Reconstructed Gaussian basis to characterize flexural wave collimation in plates with periodic arrays of annular acoustic black holes. Int. J. Mech. Sci. 2021, 194, 106179. [Google Scholar] [CrossRef]
- Huang, W.; Tao, C.; Ji, H.; Qiu, J. Enhancement of wave energy dissipation in two-dimensional acoustic black hole by simultaneous optimization of profile and damping layer. J. Sound Vib. 2021, 491, 115764. [Google Scholar] [CrossRef]
- Bayod, J.J. Experimental study of vibration damping in a modified elastic wedge of power-law profile. J. Vib. Acoust. 2011, 133, 061003. [Google Scholar] [CrossRef]
- Zhu, H.; Semperlotti, F. Phononic thin plates with embedded acoustic black holes. Phys. Rev. B 2015, 91, 104304. [Google Scholar] [CrossRef]
- Zhao, L.; Lai, C.; Yu, M. Modified structural Luneburg lens for broadband focusing and collimation. Mech. Syst. Signal Processing 2020, 144, 106868. [Google Scholar] [CrossRef]
- Zhou, X.; Yu, D. Elastic wave propagation energy dissipation characteristics analysis on the viscoelastic damping material structures embedded with acoustic black hole based on semi-analytical homogeneous asymptotic method. Appl. Math. Model. 2019, 70, 221–245. [Google Scholar] [CrossRef]
- Du, X.; Liao, X.; Fu, Q.; Zong, C. Vibro-Acoustic Analysis of Rectangular Plate-Cavity Parallelepiped Coupling System Embedded with 2D Acoustic Black Holes. Appl. Sci. 2022, 12, 4097. [Google Scholar] [CrossRef]
- Tang, L.; Cheng, L. Broadband locally resonant band gaps in periodic beam structures with embedded acoustic black holes. J. Appl. Phys. 2017, 121, 194901. [Google Scholar] [CrossRef]
- Gao, N.-S.; Guo, X.-Y.; Cheng, B.-Z.; Zhang, Y.-N.; Wei, Z.-Y.; Hou, H. Elastic wave modulation in hollow metamaterial beam with acoustic black hole. IEEE Access 2019, 7, 124141–124146. [Google Scholar] [CrossRef]
- Deng, J.; Guasch, O.; Maxit, L.; Zheng, L. Reduction of Bloch-Floquet bending waves via annular acoustic black holes in periodically supported cylindrical shell structures. Appl. Acoust. 2020, 169, 107424. [Google Scholar] [CrossRef]
- Deng, J.; Zheng, L.; Gao, N. Broad band gaps for flexural wave manipulation in plates with embedded periodic strip acoustic black holes. Int. J. Solids Struct. 2021, 224, 111043. [Google Scholar] [CrossRef]
- Tang, L.; Cheng, L. Ultrawide band gaps in beams with double-leaf acoustic black hole indentations. J. Acoust. Soc. Am. 2017, 142, 2802–2807. [Google Scholar] [CrossRef]
- Zhou, T.; Tang, L.; Ji, H.; Qiu, J.; Cheng, L. Dynamic and static properties of double-layered compound acoustic black hole structures. Int. J. Appl. Mech. 2017, 9, 1750074. [Google Scholar] [CrossRef]
- O’Boy, D.; Krylov, V.V. Vibration of a rectangular plate with a central power-law profiled groove by the Rayleigh–Ritz method. Appl. Acoust. 2016, 104, 24–32. [Google Scholar] [CrossRef]
- Ji, H.; Wang, N.; Zhang, C.; Wang, X.; Cheng, L.; Qiu, J. A vibration absorber based on two-dimensional acoustic black holes. J. Sound Vib. 2021, 500, 116024. [Google Scholar] [CrossRef]
- Liu, Z.; Chan, C.T.; Sheng, P.; Goertzen, A.L.; Page, J.H. Elastic wave scattering by periodic structures of spherical objects: Theory and experiment. Phys. Rev. B 2000, 62, 2446. [Google Scholar] [CrossRef]
- Ma, X.; Li, Z.; Xiang, J.; Wang, C. Optimization of a ring-like phononic crystal structure with bonding layers for band gap. Mech. Syst. Signal Processing 2022, 173, 109059. [Google Scholar] [CrossRef]
- An, S.; Shu, H.; Liang, S.; Shi, X.; Zhao, L. Band gap characteristics of radial wave in a two-dimensional cylindrical shell with radial and circumferential periodicities. AIP Adv. 2018, 8, 035110. [Google Scholar] [CrossRef]
- Oudich, M.; Senesi, M.; Assouar, M.B.; Ruzenne, M.; Sun, J.-H.; Vincent, B.; Hou, Z.; Wu, T.-T. Experimental evidence of locally resonant sonic band gap in two-dimensional phononic stubbed plates. Phys. Rev. B 2011, 84, 165136. [Google Scholar] [CrossRef]
- Ruan, Y.; Liang, X.; Hua, X.; Zhang, C.; Xia, H.; Li, C. Isolating low-frequency vibration from power systems on a ship using spiral phononic crystals. Ocean. Eng. 2021, 225, 108804. [Google Scholar] [CrossRef]
- Xiao, Y.; Wen, J.; Huang, L.; Wen, X. Analysis and experimental realization of locally resonant phononic plates carrying a periodic array of beam-like resonators. J. Phys. D Appl. Phys. 2013, 47, 045307. [Google Scholar] [CrossRef]
- Sun, Y.; Yu, Y.; Zuo, Y.; Qiu, L.; Dong, M.; Ye, J.; Yang, J. Band gap and experimental study in phononic crystals with super-cell structure. Results Phys. 2019, 13, 102200. [Google Scholar] [CrossRef]
- Han, J.; Tang, S.; Wang, R.; Wang, W. Acoustic wave transmission channel based on phononic crystal line defect state. AIP Adv. 2019, 9, 065201. [Google Scholar] [CrossRef]
- Ji, H.; Han, B.; Cheng, L.; Inman, D.J.; Qiu, J. Frequency attenuation band with low vibration transmission in a finite-size plate strip embedded with 2D acoustic black holes. Mech. Syst. Signal Processing 2022, 163, 108149. [Google Scholar] [CrossRef]
- Structural Mechanics Module User’s Guide; COMSOL Multiphysics® v. 5.5; COMSOL AB: Stockholm, Sweden, 2019; pp. 337–338.
- Zhang, Y.; Han, L.; Jiang, L.H. Phononic Crystal Calculation Method and Band Gap Properties; Science Press: Beijing, China, 2015; pp. 19–21. [Google Scholar]
- Tang, L.; Cheng, L. Periodic plates with tunneled acoustic-black-holes for directional band gap generation. Mech. Syst. Signal Processing 2019, 133, 106257. [Google Scholar] [CrossRef]
- Wu, J.; Zhang, S.; Shen, L. Low-frequency vibration characteristics of periodic spiral resonators in phononic crystal plates. Chin. J. Mech. Eng. 2013, 49, 62–69. [Google Scholar] [CrossRef]
- Mironov, M. Propagation of a flexural wave in a plate whose thickness decreases smoothly to zero in a finite interval. Sov. Phys. Acoust. -USSR 1988, 34, 318–319. [Google Scholar]


| Parameters | Values |
|---|---|
| Square side length of the prismoid a | 50 mm |
| Edge thickness hA | 0.3 mm |
| Edge height HA | 15 mm |
| Defect width rA | 10 mm |
| Power of the power-exponent function m | 5 |
| Radius of the cylindrical hole rA1 | 11 mm |
| Depth of the cylindrical hole HA1 | 10 mm |
| Thin plate thickness hB | 0.5 mm |
| Young’s modulus of the prismoid EA | 2.048 GPa |
| Density of the prismoid ρA | 1200 kg/m3 |
| Poisson’s ratio of the prismoid υA | 0.45 |
| Young’s modulus of the thin plate EB | 210 GPa |
| Density of the thin plate ρB | 7800 kg/m3 |
| Poisson’s ratio of the thin plate υB | 0.3 |
| Band Gap Name | Starting Frequency | Ending Frequency | Bandgap Width |
|---|---|---|---|
| The first band gap | 2903 Hz | 4329 Hz | 1426 Hz |
| The second band gap | 5971 Hz | 7610 Hz | 1639 Hz |
| The third band gap | 9511 Hz | 10,642 Hz | 1131 Hz |
Publisher’s Note: MDPI stays neutral with regard to jurisdictional claims in published maps and institutional affiliations. |
© 2022 by the authors. Licensee MDPI, Basel, Switzerland. This article is an open access article distributed under the terms and conditions of the Creative Commons Attribution (CC BY) license (https://creativecommons.org/licenses/by/4.0/).
Share and Cite
Jin, X.; Zhang, Z. Study on the Bandgap Characteristics and Vibration-Reduction Mechanism of Symmetric Power-Exponent Prismatic Phononic Crystal Plates. Crystals 2022, 12, 1125. https://doi.org/10.3390/cryst12081125
Jin X, Zhang Z. Study on the Bandgap Characteristics and Vibration-Reduction Mechanism of Symmetric Power-Exponent Prismatic Phononic Crystal Plates. Crystals. 2022; 12(8):1125. https://doi.org/10.3390/cryst12081125
Chicago/Turabian StyleJin, Xing, and Zhenhua Zhang. 2022. "Study on the Bandgap Characteristics and Vibration-Reduction Mechanism of Symmetric Power-Exponent Prismatic Phononic Crystal Plates" Crystals 12, no. 8: 1125. https://doi.org/10.3390/cryst12081125
APA StyleJin, X., & Zhang, Z. (2022). Study on the Bandgap Characteristics and Vibration-Reduction Mechanism of Symmetric Power-Exponent Prismatic Phononic Crystal Plates. Crystals, 12(8), 1125. https://doi.org/10.3390/cryst12081125