Article

Sonochemical Synthesis of Nanostructured Ni-Fe-C System and Its Catalytic Activity Based on Decolorization of Reactive Black 5 Dye

by
Vicente Garibay Febles
1,
Dulce Viridiana Melo-Máximo
2,
Isaías Hernández Perez
3,
Raúl Suárez Parra
4,
Julio César Espinoza-Tapia
5,
Ricardo Luna Paz
3,
Lucia Diaz-Barriga Arceo
6,
Jesús Noé Rivera Olvera
7,
Lizbeth Melo-Máximo
8 and
Leonardo González-Reyes
3,*
1
Instituto Mexicano del Petróleo, Eje Central Lázaro Cárdenas Norte 152 Col. San Bartolo Atepehuacan, México City 07730, Mexico
2
Escuela de Ingeniería y Ciencias, Tecnológico de Monterrey, México City 52926, Mexico
3
Departamento de Ciencias Básicas, Universidad Autónoma Metropolitana-A, Av. Sn. Pablo No. 180, México City 02200, Mexico
4
Instituto de Energías Renovables, IER-UNAM. Priv. Xochicalco S/N, Temixco 62580, Mexico
5
Nanociencias y Nanotecnología, Cinvestav–IPN, Col. San Pedro Zacatenco, México City 07360, Mexico
6
Departamento de Ingeniería en Metalurgia y Materiales, Instituto Politécnico Nacional (UPALM-ESIQIE-IPN), México City 07738, Mexico
7
Tecnológico de Estudios Superiores de Ixtapaluca, Tecnológico Nacional de México, Km. 7 de la Carretera Ixtapaluca-Coatepec S/N, Ixtapaluca 56580, Mexico
8
Instituto Tecnológico de Tlalnepantla, Tecnológico Nacional de México, Av. Instituto Tecnológico, S/N, Col. La Comunidad, México City 54070, Mexico
*
Author to whom correspondence should be addressed.
Crystals 2022, 12(8), 1123; https://doi.org/10.3390/cryst12081123
Submission received: 15 June 2022 / Revised: 26 July 2022 / Accepted: 2 August 2022 / Published: 11 August 2022
(This article belongs to the Section Inorganic Crystalline Materials)

Abstract

:
This study investigates the thermal decomposition of acetyl acetonates of Ni(II) and Fe(III) via a sonochemical process at 20 kHz for 50 min. In the absence of magnetic fields the reactions of Ni(II) and Fe(III) acetyl acetonates under ultrasonic treatment produce Ni(OH)2 and FeO(OH) nanoparticles coated with carbon. The synthesized materials with different Ni-Fe stoichiometries, Ni90-Fe10, Ni80-Fe20, and Ni50-Fe50 wt%, were subjected to catalytic activity for dye decolorization of Reactive Black 5 (RB5, 100 mg/L) at room temperature using visible radiation. The correlation between the structural and optoelectronic properties and the catalytic performance of the Ni-Fe system with different stoichiometries is reported.

1. Introduction

In recent years, low-dimensional transition metal oxides/hydroxides have demonstrated outstanding potential in a wide range of scientific and technological applications due to their valuable catalytic, magnetic, and electronic properties [1,2]. The material size reduction to nanometric scale usually exhibits novel properties compared to their bulk or discrete counterparts. These phenomena fundamentally arise from the finite size and surface defects of a material and because its electronic properties start to change by the so-called quantum size effect. Therefore, a key objective of contemporary materials research is the capacity to control nanocrystals in a systematic manner. In particular, the fabrication of nanometer-ordered structures is the key to photocatalytic technology and the treatment of dyes in synthetic and real graywater effluents [3]. Specifically, to promote the surface charge separation of photocatalysts, various transition metal oxides have been synthesized with potentially improved photocatalytic performance. The employed synthesis techniques include photodeposition [4], impregnation [5], adsorption [6,7], and sonochemistry [8]. Among the synthesis methods mentioned, sonochemistry has proven to be an efficient method for the synthesis of nanometric materials. The chemical effects of ultrasound derives principally from acoustic cavitation: the formation, growth, and implosive collapse of bubbles in a liquid. The collapse of bubbles generates localized hot spots with transient temperatures of ∼5000 K and cooling rates in excess of 1010 K/s. It is the underlying phenomenon responsible for sonochemistry [9,10].
Recently, reports have indicated that materials like sulfides and oxyhydroxides when used as photocatalytic materials, produce a greater photocurrent than metal oxides. Ni(OH)2 and FeO(OH) are widely used in the field of photoelectric water splitting for hydrogen and oxygen evolution [11]. FeO(OH) is a semiconductor with a band gap of 2.12 eV, which can be excited under visible-light irradiation [12]. A large tunnel structure is the main feature of this iron oxohydroxide material; it also possesses good electron conduction and can effectively promote carrier generation and improve water oxidation kinetics due to the richness of OH functional groups provided to the surface [13]. On the other hand, Ni(OH)2 shows excellent electrochemical properties due to it containing nickel ions in a Ni3+ oxidation state, and the average oxidation state of nickel in this phase is 3.3–3.7 [14], which implies a higher oxidation activity [15]. However, studies on the use of Ni(OH)2 as a photocatalyst are rare. There are also few reports on exploiting the catalytic activity Ni(OH)2 and FeO(OH) as photocatalytic materials in dye degradation.
Therefore, in the present work, Ni(OH)2 and FeO(OH) nanostructures with different Ni-Fe stoichiometries were synthesized by thermal decomposition of Ni and Fe acetylacetonates via sonochemical synthesis. The synthesized materials were evaluated as photocatalysts based on decoloration of RB5 dye (100 ppm). Based on the obtained results, a probable mechanism of carbon structure formation is also suggested.

2. Materials and Methods

2.1. Sonochemical Synthesis of Ni-Fe Samples

All chemicals used in this work were of analytical grade and used as received without further purification. As iron and nickel sources, Fe(C5H7O2)3 (97%) and Ni(C4H7O2) (98%) were used, respectively. To obtain different stoichiometries of Ni-Fe, the following procedure was used: 11.94 g of nickel precursor was mixed with acetone (50 mL) and methanol (50 mL); the mixture was stirred using a magnetic stirrer for 15 min at room temperature until a suspension was formed, which was then sonicated using an ultrasonic processor (20 kHz) for 40 min. After this time, 1.86 g of iron source was injected into the system, followed by additional sonication as before. Finally, the precipitate was collected and washed with ethanol and deionized water several times, and then dried in the air at 60 °C using magnetic stirring. The as-prepared samples correspond to Ni90-Fe10 wt%. The same procedure was followed for Ni80-Fe20 wt%, and Ni50-Fe50 wt%.

2.2. Characterization Tools

The X-ray powder diffraction (XRD) patterns were collected using a Bruker diffractometer D8 Focus with a monochromatic Cu Kα (λ = 1.5418 Å) radiation source (30 keV and 35 mA), which was used in Debye–Scherrer geometry to acquire the diffraction profile over a 2θ range between 5 and 50° with an angular step of 0.050 (2θ). The morphology of the materials was investigated by a field emission scanning electron microscope (FESEM, FEI-Nova 200 NanoLab, Hillsboro, OR, USA) operated at 10 kV. Crystallographic analysis was performed using high-resolution transmission electron microscopy (HRTEM, FEI-Titan, 300 kV and Cs = 1.2 nm). HRTEM samples were prepared by dropping the sample solution onto a carbon-coated Cu grid and drying at room temperature. The sample solutions were prepared by dispersing the synthesized samples in ethanol. Fourier-transform infrared (FTIR) spectra over the spectra range of 400–4000 cm−1 were recorded using a Perkin-Elmer Spectrum GX infrared spectrometer. Every spectrum was the average of 64 scans taken at 2 cm−1 resolution. X-ray photoelectron spectroscopy (XPS) measurements were performed under ultra-high vacuum (2 × 10⁻⁹ mbar) using a Thermo Fisher Scientific ESCALAB 250 equipped with a monochromatic Al Kα X-ray source (hv = 1486.6 eV). The energy resolution was set to 1.2 eV to minimize data acquisition time while maximizing the signal-to-noise ratio, and the photoelectron take-off angle was 37° with respect to the surface normal. All binding energies were referenced to the C 1s core level photoemission line at 285.0 eV [16]. To ensure the consistency of the results, all measurements for freshly prepared samples were recorded. To test for reproducibility, three different sites were assessed on each sample.

2.3. Dye Decolorization Evaluation

Reactive Black 5 (RB5) was chosen as the synthetic dye of industrial and ecological interest to study the decolorization ability of the as-prepared samples. The initial RB5 dye concentration was 100 mg/L of RB5 and 100, 150, and 200 mg of the Ni-Fe catalyst in a mixture of 200 mL. The mixture was stirred for 10 min at room temperature to achieve full and stable dispersion of the as-prepared samples—RB5 solution. Samples were taken from each reaction mixture, and the decrease in absorbance at λ = 596 nm was recorded at specific time intervals. The percentage of dye decolorization was calculated using Equation (1):
Decolorization (%) = [(Ai − At)/Ai] × 100
where Ai is the initial absorbance of the dye, and At is the absorbance of the dye at any time interval. Each decolorization experiment was performed in triplicate according to [17], and the mean decolorization percentage was reported [18]. Based on the absorption sideband wavelength of the as-prepared samples obtained by UV-Vis diffuse reflectance spectroscopy, the forbidden bandwidths of the corresponding samples were calculated and combined in the Kubelka–Munk formula [19].
(αhν)2 = K () − Eg
where: α, h, v, Eg, and K are the absorption coefficient, Planck’s constant, light frequency, bandgap, and proportionality constant, respectively.

3. Results and Discussion

The diffraction patterns of the sonochemically as-prepared samples (Figure 1) indicate that all three samples are polycrystalline, which confirms the success of the sonochemical synthesis.

3.1. Ni50-Fe50 wt% Sample

The powder XRD pattern, as seen in Figure 1a, reveals that the formation of Ni(OH)2 and FeO(OH) structures is a mixture of two oxide hydroxides FeO(OH) and Ni(OH)2·2H2O. The diffraction peaks observed at 2θ ≅ 16.97 and 25.24° are assigned as (200) and (130) reflection lines of the FeO(OH) phase and match well with JCPDS No. 04-016-5487. The peaks observed at 2θ ≅ 12. 84, 23.67, 33.11, and 35.61° are assigned as (001), (002), (110), and (111) reflection lines, respectively, of the α-Ni(OH)2 phase and match well with JCPDS No. 22-0444. Certainly, the additional diffraction peaks draw attention to the three samples due to the presence of a carbon structure such as C60 fullerene, which is seen at 2θ ≅ 10.83, 21.68, and 28.28°, which agree with (111), (222), and (420) reflection lines, respectively, and match well with JCPDF file 044-0558. We assume that the carbon structure was formed during ultrasonic irradiation (20 kHz). The sonochemical conditions can create extreme conditions inside a cavitating bubble, and high local temperatures (up to ~5000 °C) and pressures (up to ~1000 atm) can be generated. These violent bubble formations grow and collapse and can provide the driving force required for the thermal dissociation of Fe(C5H7O2)3, (Ni(C4H7O2)), acetone, and methanol, which in turn leads to the thermal dissociation and formation of carbon structures such as C60. According to the scenario put forth by Smalley et al., tiny carbon atoms would combine to form linear species, which would then interact with other linear species to build rings. The rings would get bigger until they reached the 25–35 atom range, when more short linear chains were added. According to the party line theory, polycyclic networks that resemble open graphitic sheets become the size domain’s thermodynamically most advantageous structure.

3.2. Ni80-Fe20 wt% Sample

The XRD pattern is presented in Figure 1b. The diffraction peaks confirm the presence of a phase mixture corresponding to FeO(OH) and Ni(OH)2·2H2O. The diffraction peaks at 2θ ≅ 16.97 and 25.24° are assigned as (200) and (130) reflection lines of the FeO(OH) phase and match well with JCPDS No. 04-016-5487. The peaks observed at 2θ ≅ 12.84, 23.67, 33.11, 35.61, and 48.62° are assigned as (001), (002), (110), (111), and (103) reflection lines of the α-Ni(OH)2 phase. These values agree well with the crystalline α-Ni(OH)2 diffraction peaks (JCPDS No. 22-0444). Additional diffraction peaks at 2θ ≅ 10.83°, 21.68°, and 28.28° confirm the presence of carbon structure (C60) and agree with (111), (222), and (420) reflection lines and match well with JCPDF file 044-0558. Additionally, diffraction peaks which appear at 2θ < 7° could be attributed to the systematic assembly of nanoscale constituents into highly ordered heterogeneous superlattices of Ni-Fe-C.

3.3. Ni90-Fe10 wt% Sample

The XRD pattern is presented in Figure 1c. The diffraction pattern corresponds to a mixture of FeO(OH) and Ni(OH)2·2H2O phases. It shows additional peaks, relative to the Ni50-Fe50 wt% and Ni80-Fe20 wt% diffractograms, at 2θ ≅ values of 12.06, 25.12, 31.24, 37.09, 44.97, and 45.83° are assigned as (100), (130), (101), (211), (310), and (411) reflection lines of the FeO(OH) phase, respectively, and match well with JCPDS No. 04-016-5487. The peaks observed at 2θ ≅ 12.84, 23.67, 33.11, 39.20, 41.38, 35.61, and 48.620 are assigned as (001), (002), (110), (111), (200), (103), and (004) reflection lines of the α-Ni(OH)2 phase, respectively. These values are in good agreement with the diffraction peaks of crystalline α-Ni(OH)2 (JCPDS No. 22-0444). The additional diffraction peaks confirming the presence of carbon structure (C60) at 2θ ≅ 10.83, 21.68, and 28.28° agree with (111), (222), and (420) reflection lines and match well with JCPDF file 044-0558. The diffractogram shows the reflections at values 2θ < 7° that are attributed to the systematic assembly of nanoscale constituents into highly ordered heterogeneous superlattices of Ni-Fe-C.
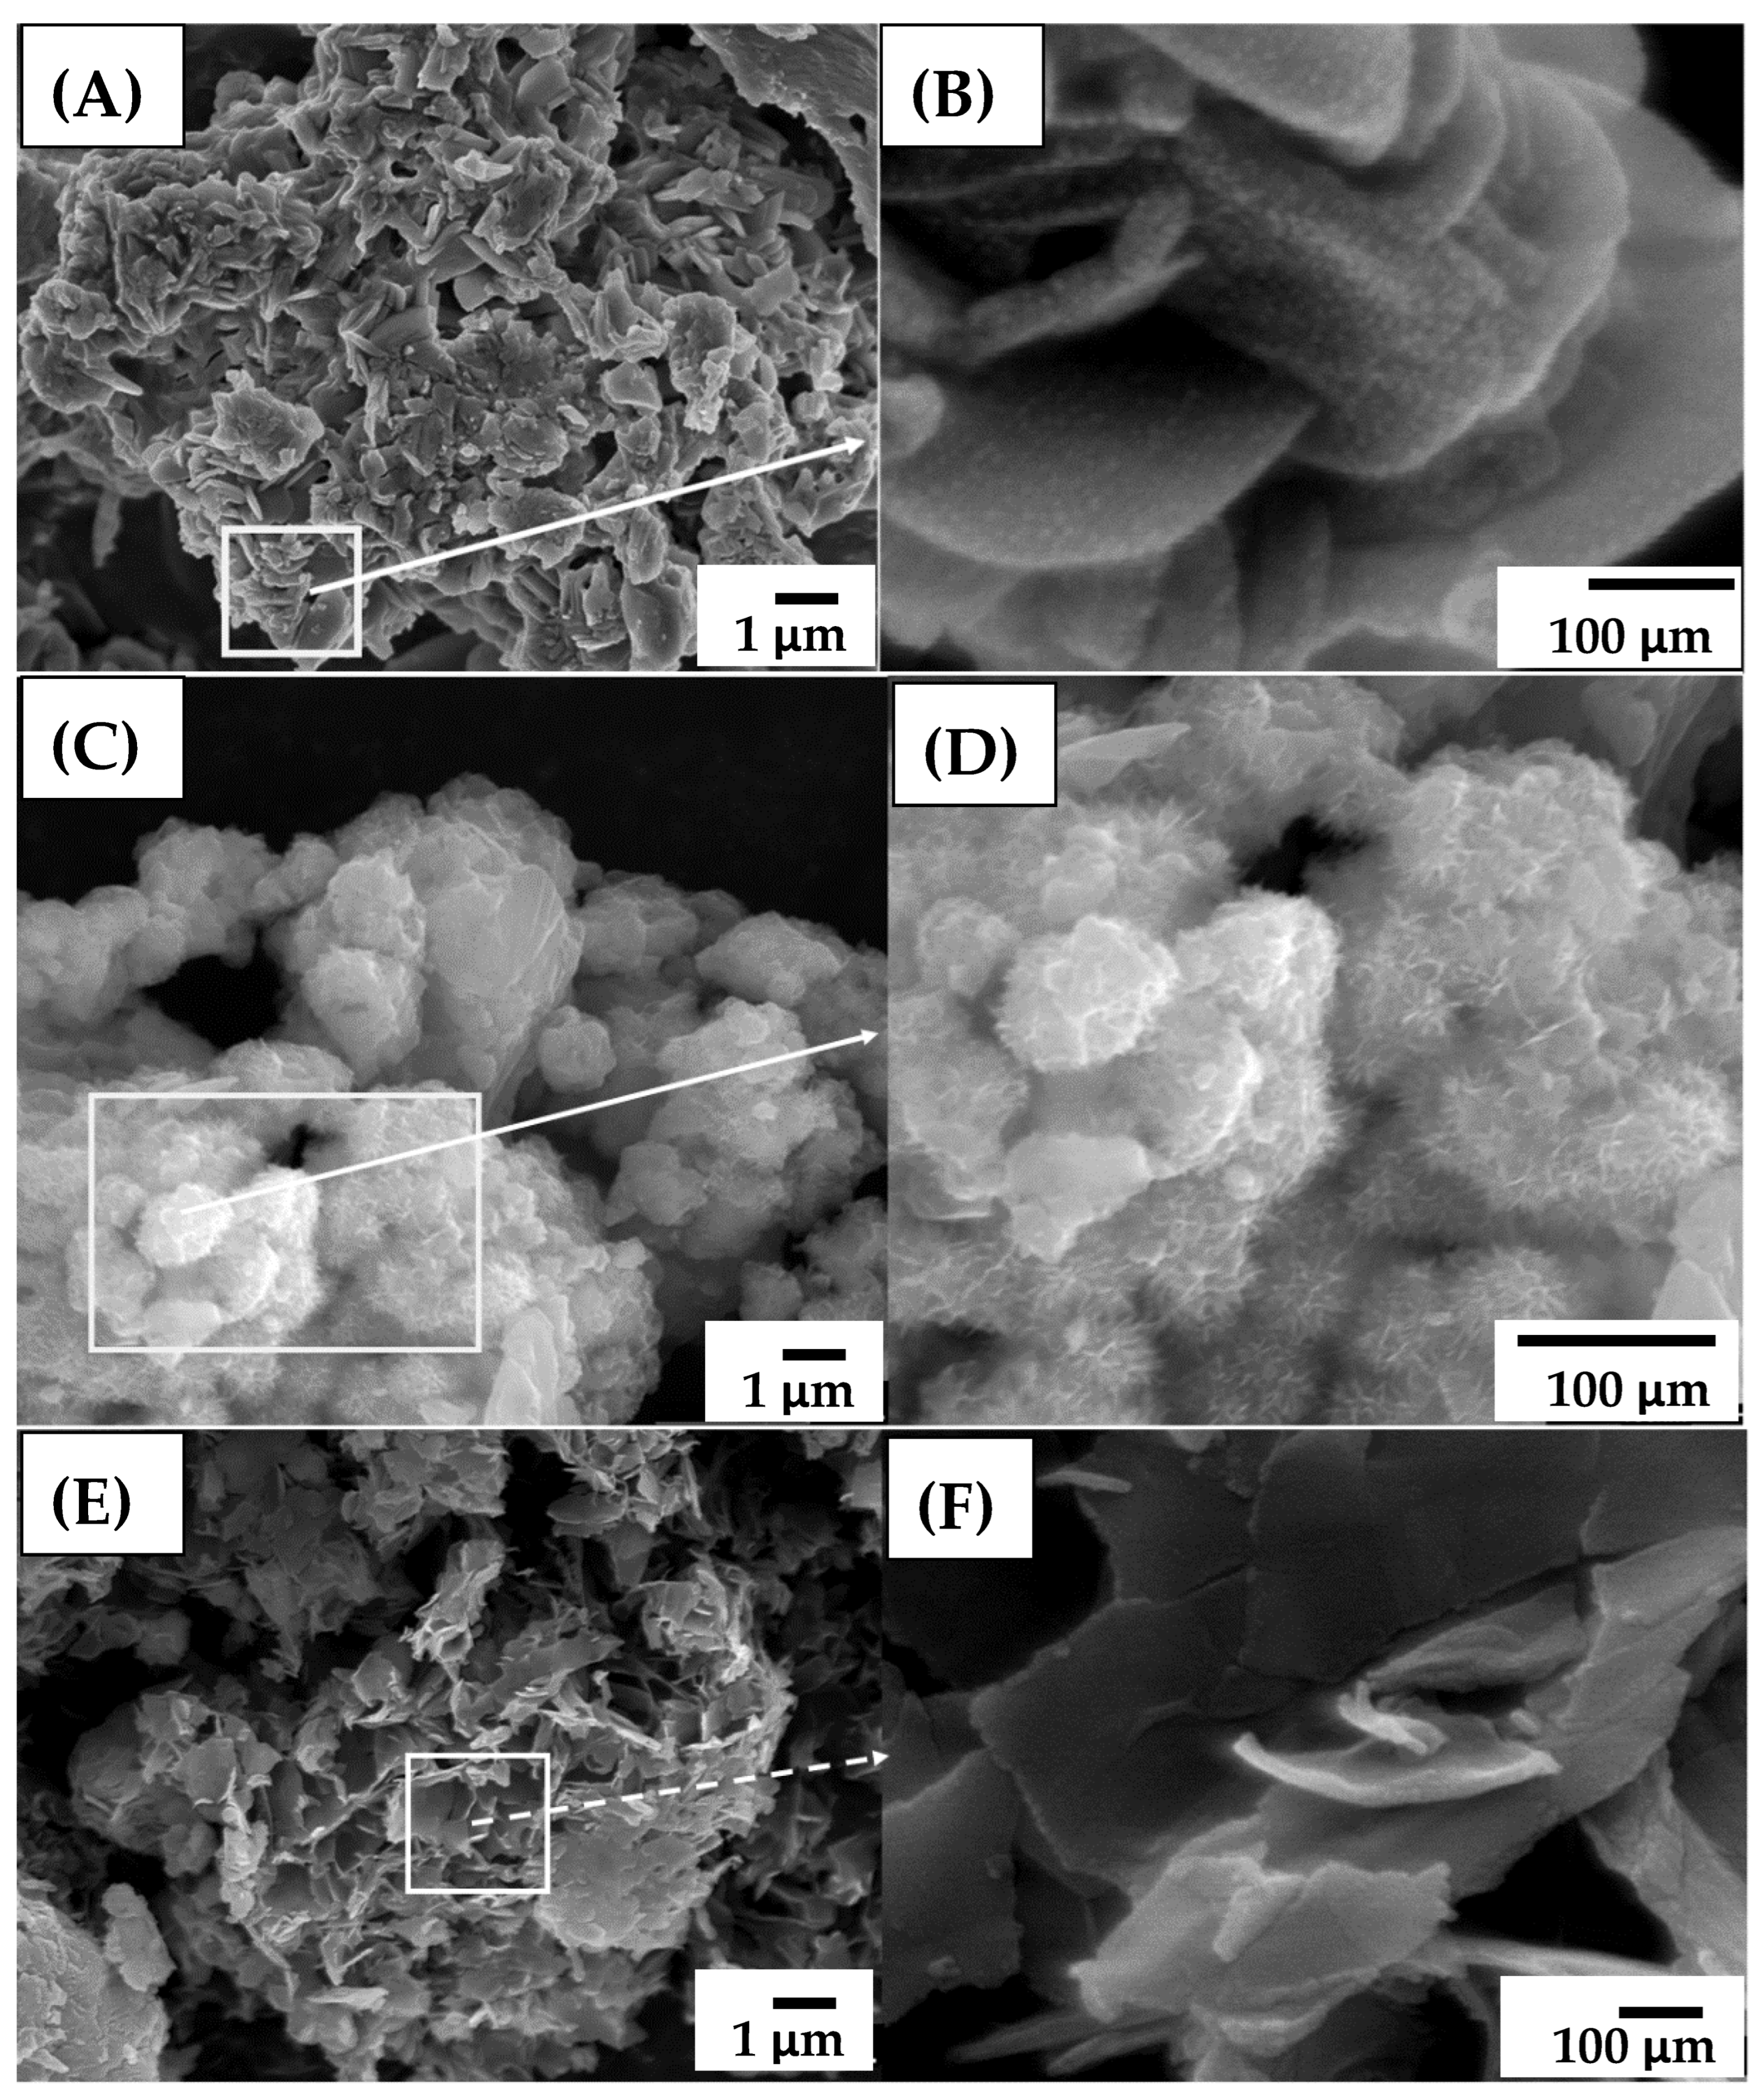
The SEM image shown in Figure 2A presents the laminar morphology of the sample Ni50-Fe50 wt%. The sample tends to form agglomerates of 2D laminar structures. The formed Ni50-Fe50 wt% lamellar is several micrometers long (Figure 2B). Similar 2D arrangements are observed for Ni80-Fe20 wt% sample sonochemically synthesized applying 20 kHz (Figure 2C). Several layers piled up, and the outline of their 2D arrangements is shown in Figure 2D. For the sample Ni90-Fe10 wt%, laminar morphology of several micrometers (Figure 2E) was observed at 20 kHz. Even the smallest broken part of the Ni90-Fe10 wt% sample showed laminar morphology of the comprised particles. The SEM image in Figure 2F shows that ~5–7 μm long particles piled up together and formed a layered morphology. It can be observed that the morphology of all three samples was similar to typical flower-like structures of nanosheets with uniform morphology observed at the micron scale. Furthermore, the agglomeration observed in the three samples could be attributed to their magnetic nature.
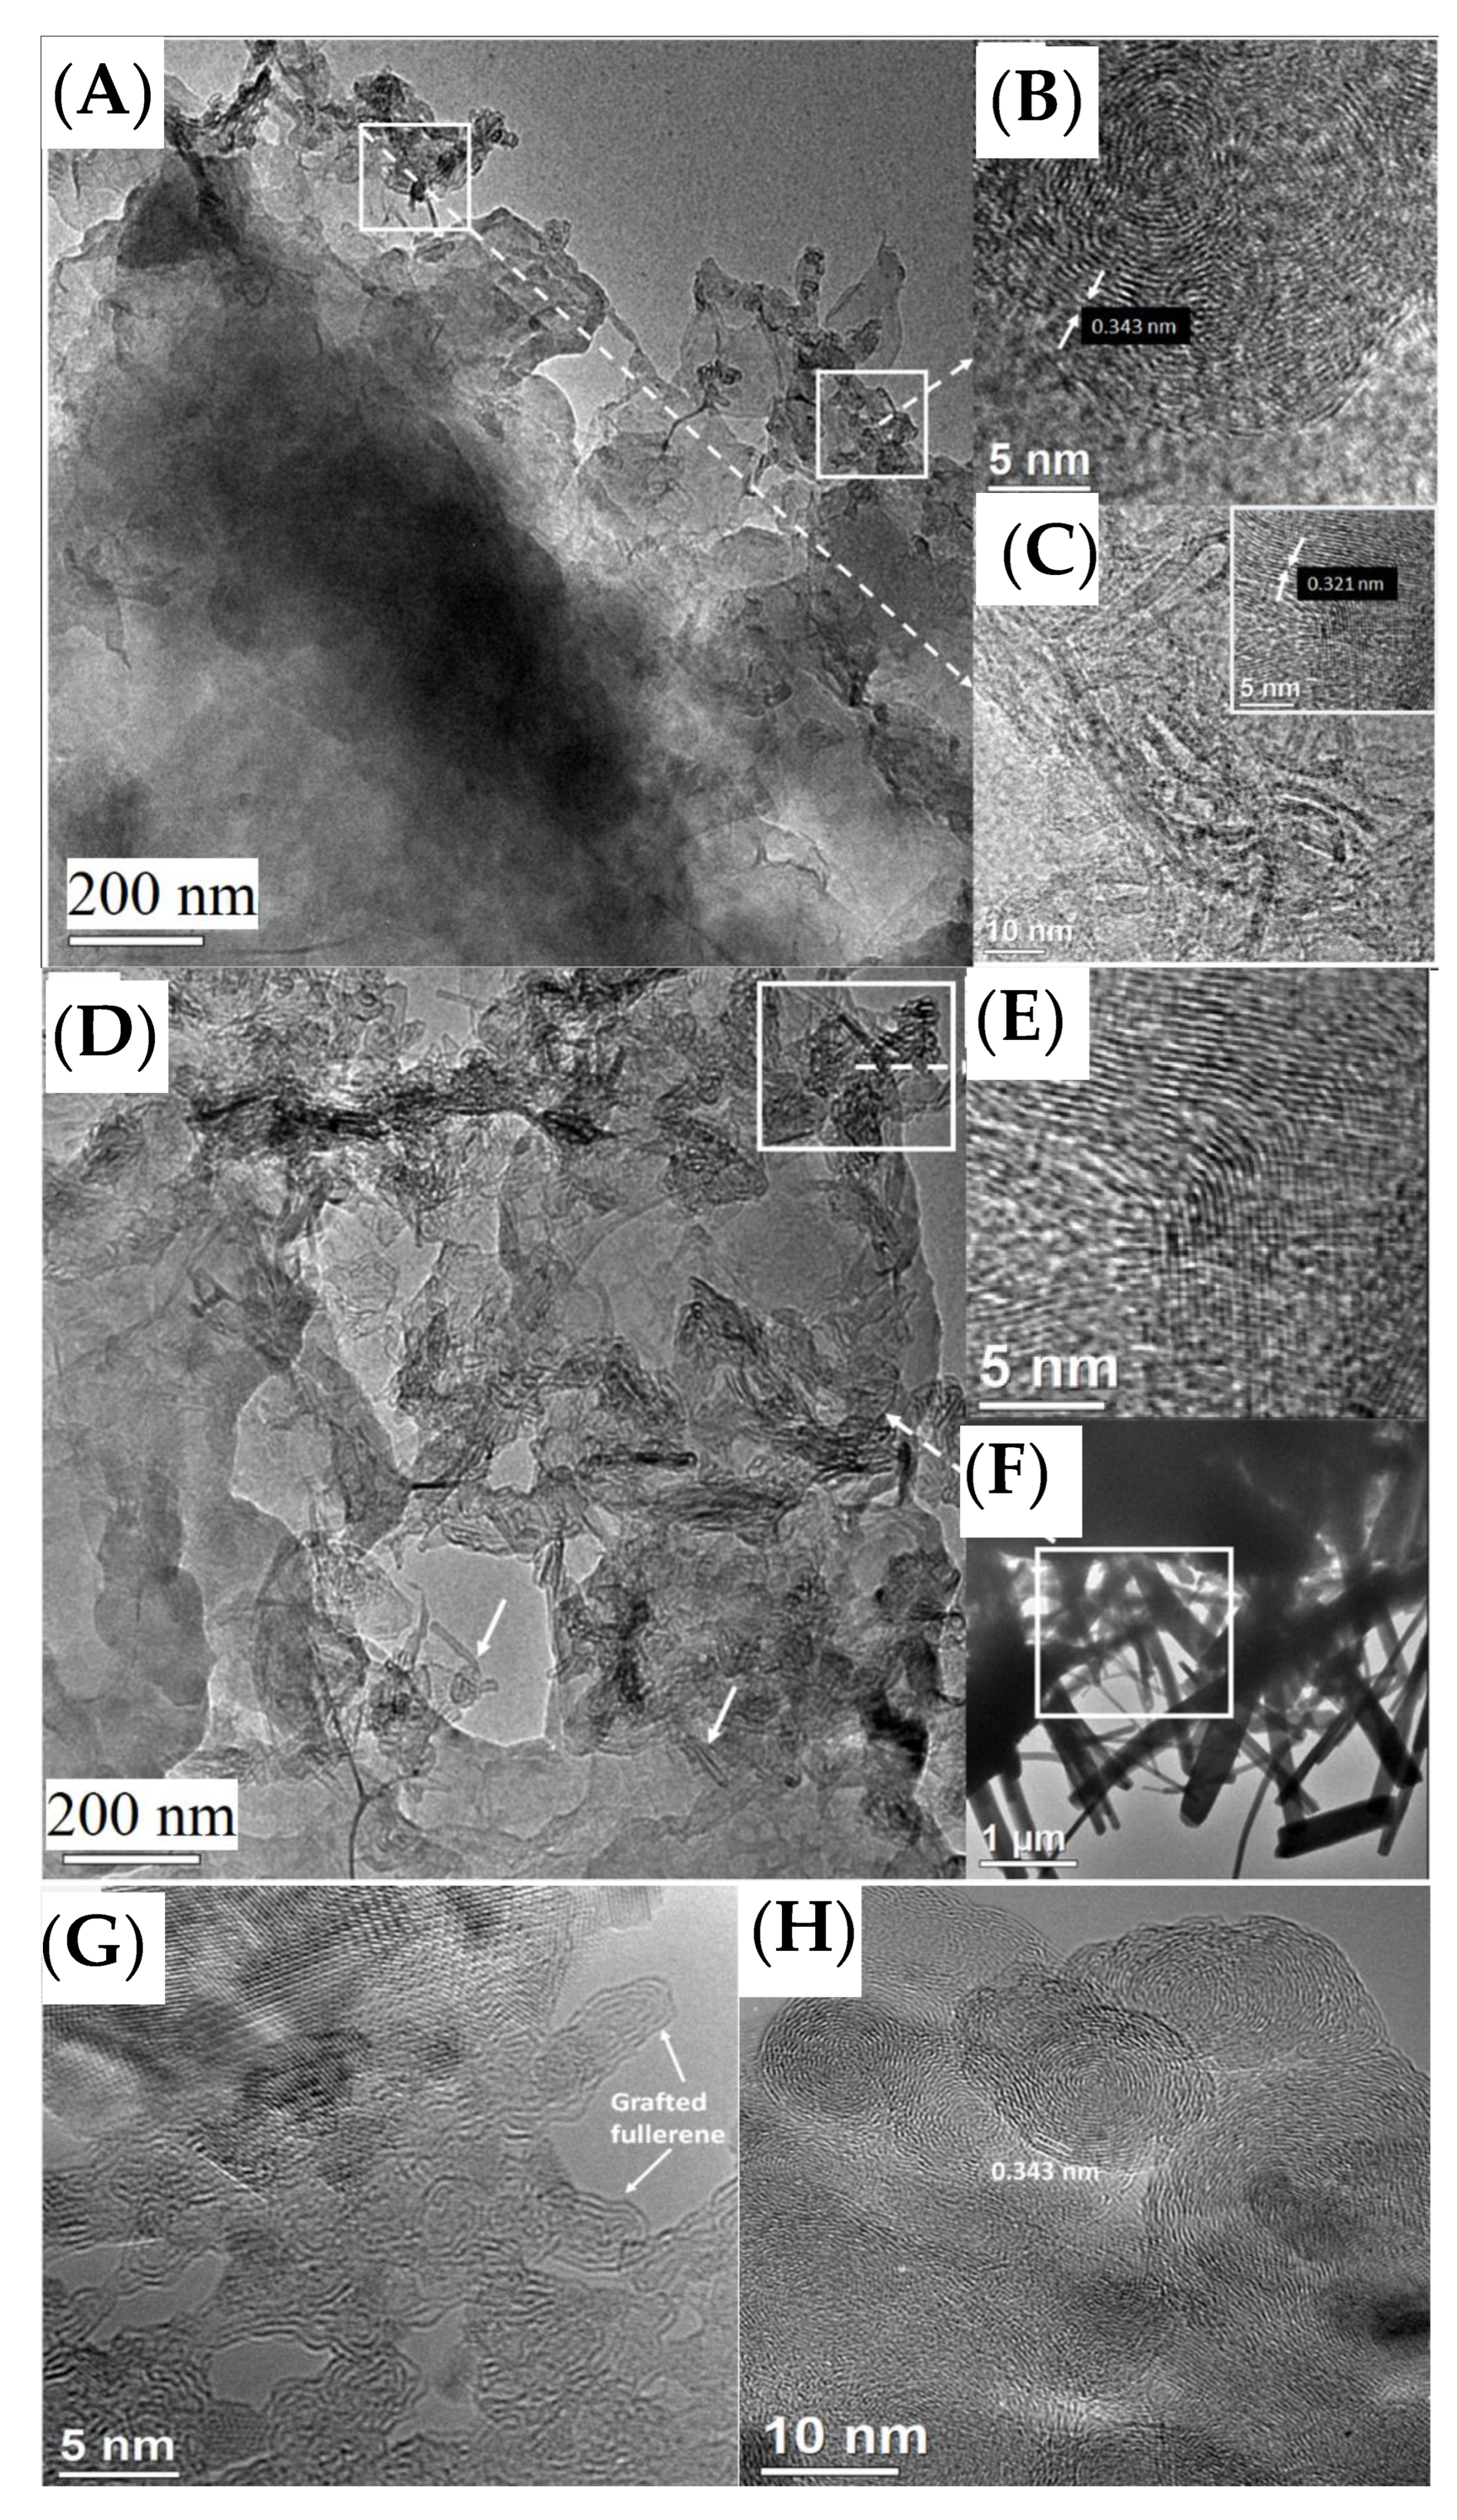
In order to understand the graphitization of carbon structures formed around the as-prepared samples, HRTEM measurements were carried out for the Ni50-Fe50, Ni80-Fe20, and Ni90-Fe10 wt% samples. The ultrasonic synthesis for the Ni50-Fe50 wt% sample resulted in the formation of laminar structures as observed in Figure 3A. Additionally, HRTEM micrograph revealed dark spots (white box) on their surface in a range of 5–8 nm, implying the presence of nano-onions with an average diameter of 5–8 nm, as illustrated in Figure 3B. The measured interlayer spacing between these graphitic planes was ~0.343 and 0.321 nm (Figure 3B,C), which is in accordance with the distance of the layers in bulk graphite. The formation of nano-onions suggests that nucleation occurs near the edges of the laminar structure. The structure of the nano-onions appears very defective, as seen in the HRTEM image in Figure 3D, indicating that graphene particles automatically assemble onto C60 as a result of π–π stacking interactions. The following is an explanation of this mechanism: small graphene fragments are created when graphene sheets are sliced near their edges during the ultrasonication process [19,20,21]. These pieces exhibit various morphologies (Figure 3C), which alter in response to thermal fluctuations, resulting in modifications to their geometry. The atomic structure of graphene is significantly deformed by edge dislocations, leading to bond compression or elongation, shear strain, and lattice rotation [22]. As a result, the graphene pieces self-assemble through a variety of energetic processes, demonstrating that van der Waals interactions between overlapping regions of small graphene sheets increase the stability, as has been reported, for instance, in the folding and rolling up of a graphene nanoribbon [20,21,22,23,24,25,26,27]. These factors explain the formation of defective nano-onions. The HRTEM images are taken from the Ni80-Fe20 wt% sample. When the same synthetic procedure was performed for Ni50-Fe50 wt%, very similar images are recorded, and a similar laminar structure is obtained, Figure 3D. The laminar structure is surrounded by ~10 nm carbon layers, Figure 3E. In some places, a large number of carbon nanotubes and nanofibers are grown, as shown by the white arrows in Figure 3D,F, on the surface. For the Ni90-Fe10 wt% sample, the HRTEM micrographs were intentionally focused on the carbon structures (arrows), Figure 3G,H. The measured interlayer spacing between these carbon planes was ~0.343 nm; these values are very close to those of the graphitic (0.34 nm) layers. Moreover, the interplanar distance of about 1.50 Å corresponds to the (003) plane, indicating that the Ni(OH)2 has a preferential [1] growth direction, and the interplanar distance of about 7.41 Å corresponds to the FeO(OH) with (110) plane growth direction consistent with the result of XRD also shown in Figure 1. From the HRTEM images, shown in Figure 3A–H, one can see that the laminar structures were synthesized by sonochemical means, and carbon structures were formed by the thermal dissociation of Fe(C5H7O2)3 and Ni(C4H7O2) into carbon, hydrogen, oxygen, iron, and nickel atoms under sonochemical conditions. We assume that cavitational implosion is very localized and transient during ultrasonication, with a temperature of ∼5000 K and a pressure of ∼100 MPa [8]. These extreme conditions created during acoustic cavitation can easily lead to the formation of nano-onion and carbon structures in addition to laminar structures.
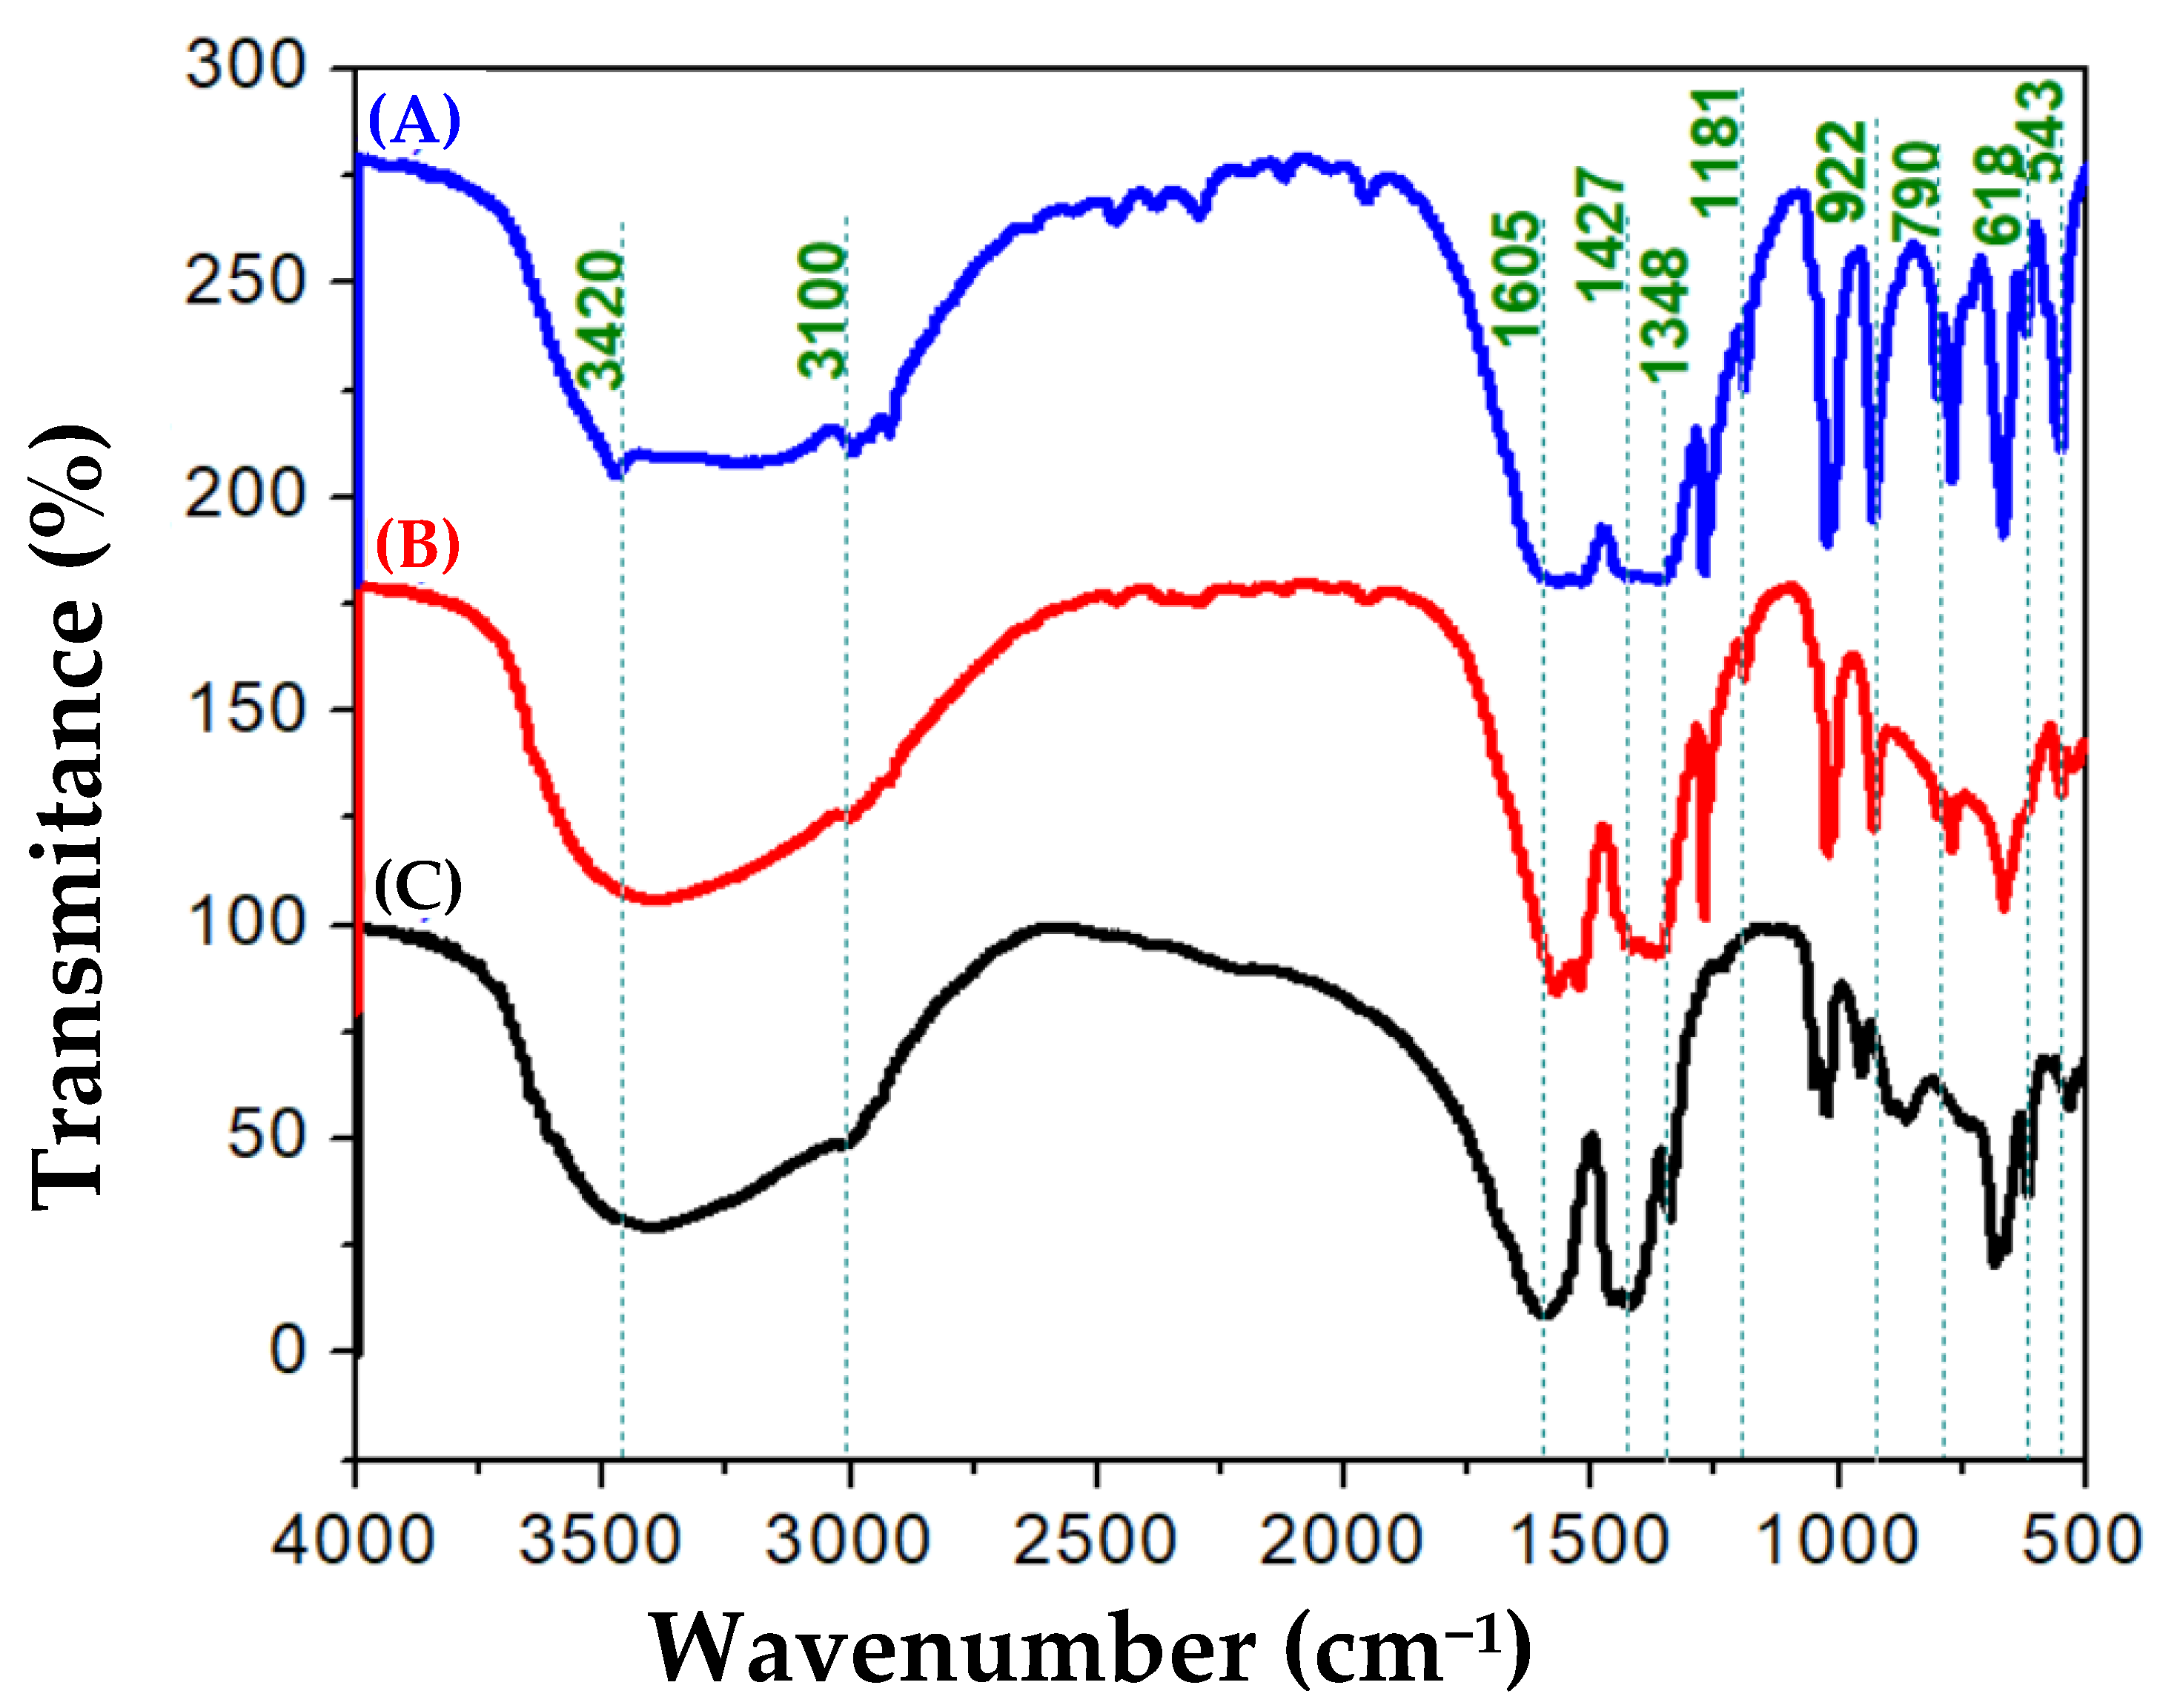
The FTIR spectral measurements were carried out for Ni50-Fe50 wt%, Ni80-Fe20 wt%, and Ni90-Fe10 wt% samples as shown in Figure 4A–C. The absorption bands, centered at 1348, 922, and 618 cm−1, correspond to the Fe–O vibrational modes [28]. The band at 790 cm−1 is assigned to the characteristic Fe–O–OH bending vibration mode in FeO(OH) [29,30], indicating that the surfaces of the samples are hydroxylated. The hydroxylated surface can adsorb water molecules, which has been confirmed due to the existence of the bands at 3420 and 1636 cm−1 in the spectra, which correspond to the H2O stretching and bending modes, respectively [31]. Figure 4A–C shows the FTIR spectrum of Ni(OH)2 and a hydroxyl stretch from the Ni(OH)2 lattice at 3420 cm−1 and –O–H stretching of the intercalated hydroxyl group from water between 3100 and 3420 cm−1 [32,33]. Furthermore, H–O–H bending is observed at 1605 cm−1 due to the vibration of free water molecules [34]. The spectrum also shows a sharp peak of O–H at 618 cm−1, corresponding to stretching due to hydroxyl lattice vibration, and a weak peak at 543 cm−1, indicating a Ni–O lattice vibration [35]. Fullerene peaks were observed at 543, 1181, and 1427 cm−1 by FTIR spectroscopy (Figure 4A–C). The 543 cm−1 mode is primarily associated with radial displacements of the carbon atoms for the two lowest wavenumber bands and the two modes above 1000 cm−1 [36], at 1181 and 1427 cm−1, essentially associated with a tangential motion of the carbon atoms. The absorption peaks indicate the three IR-active modes at 543, 572, 1181, and 1427 cm−1, showing very good agreement with quantum chemical calculations for the vibrational spectrum reported in [37,38].
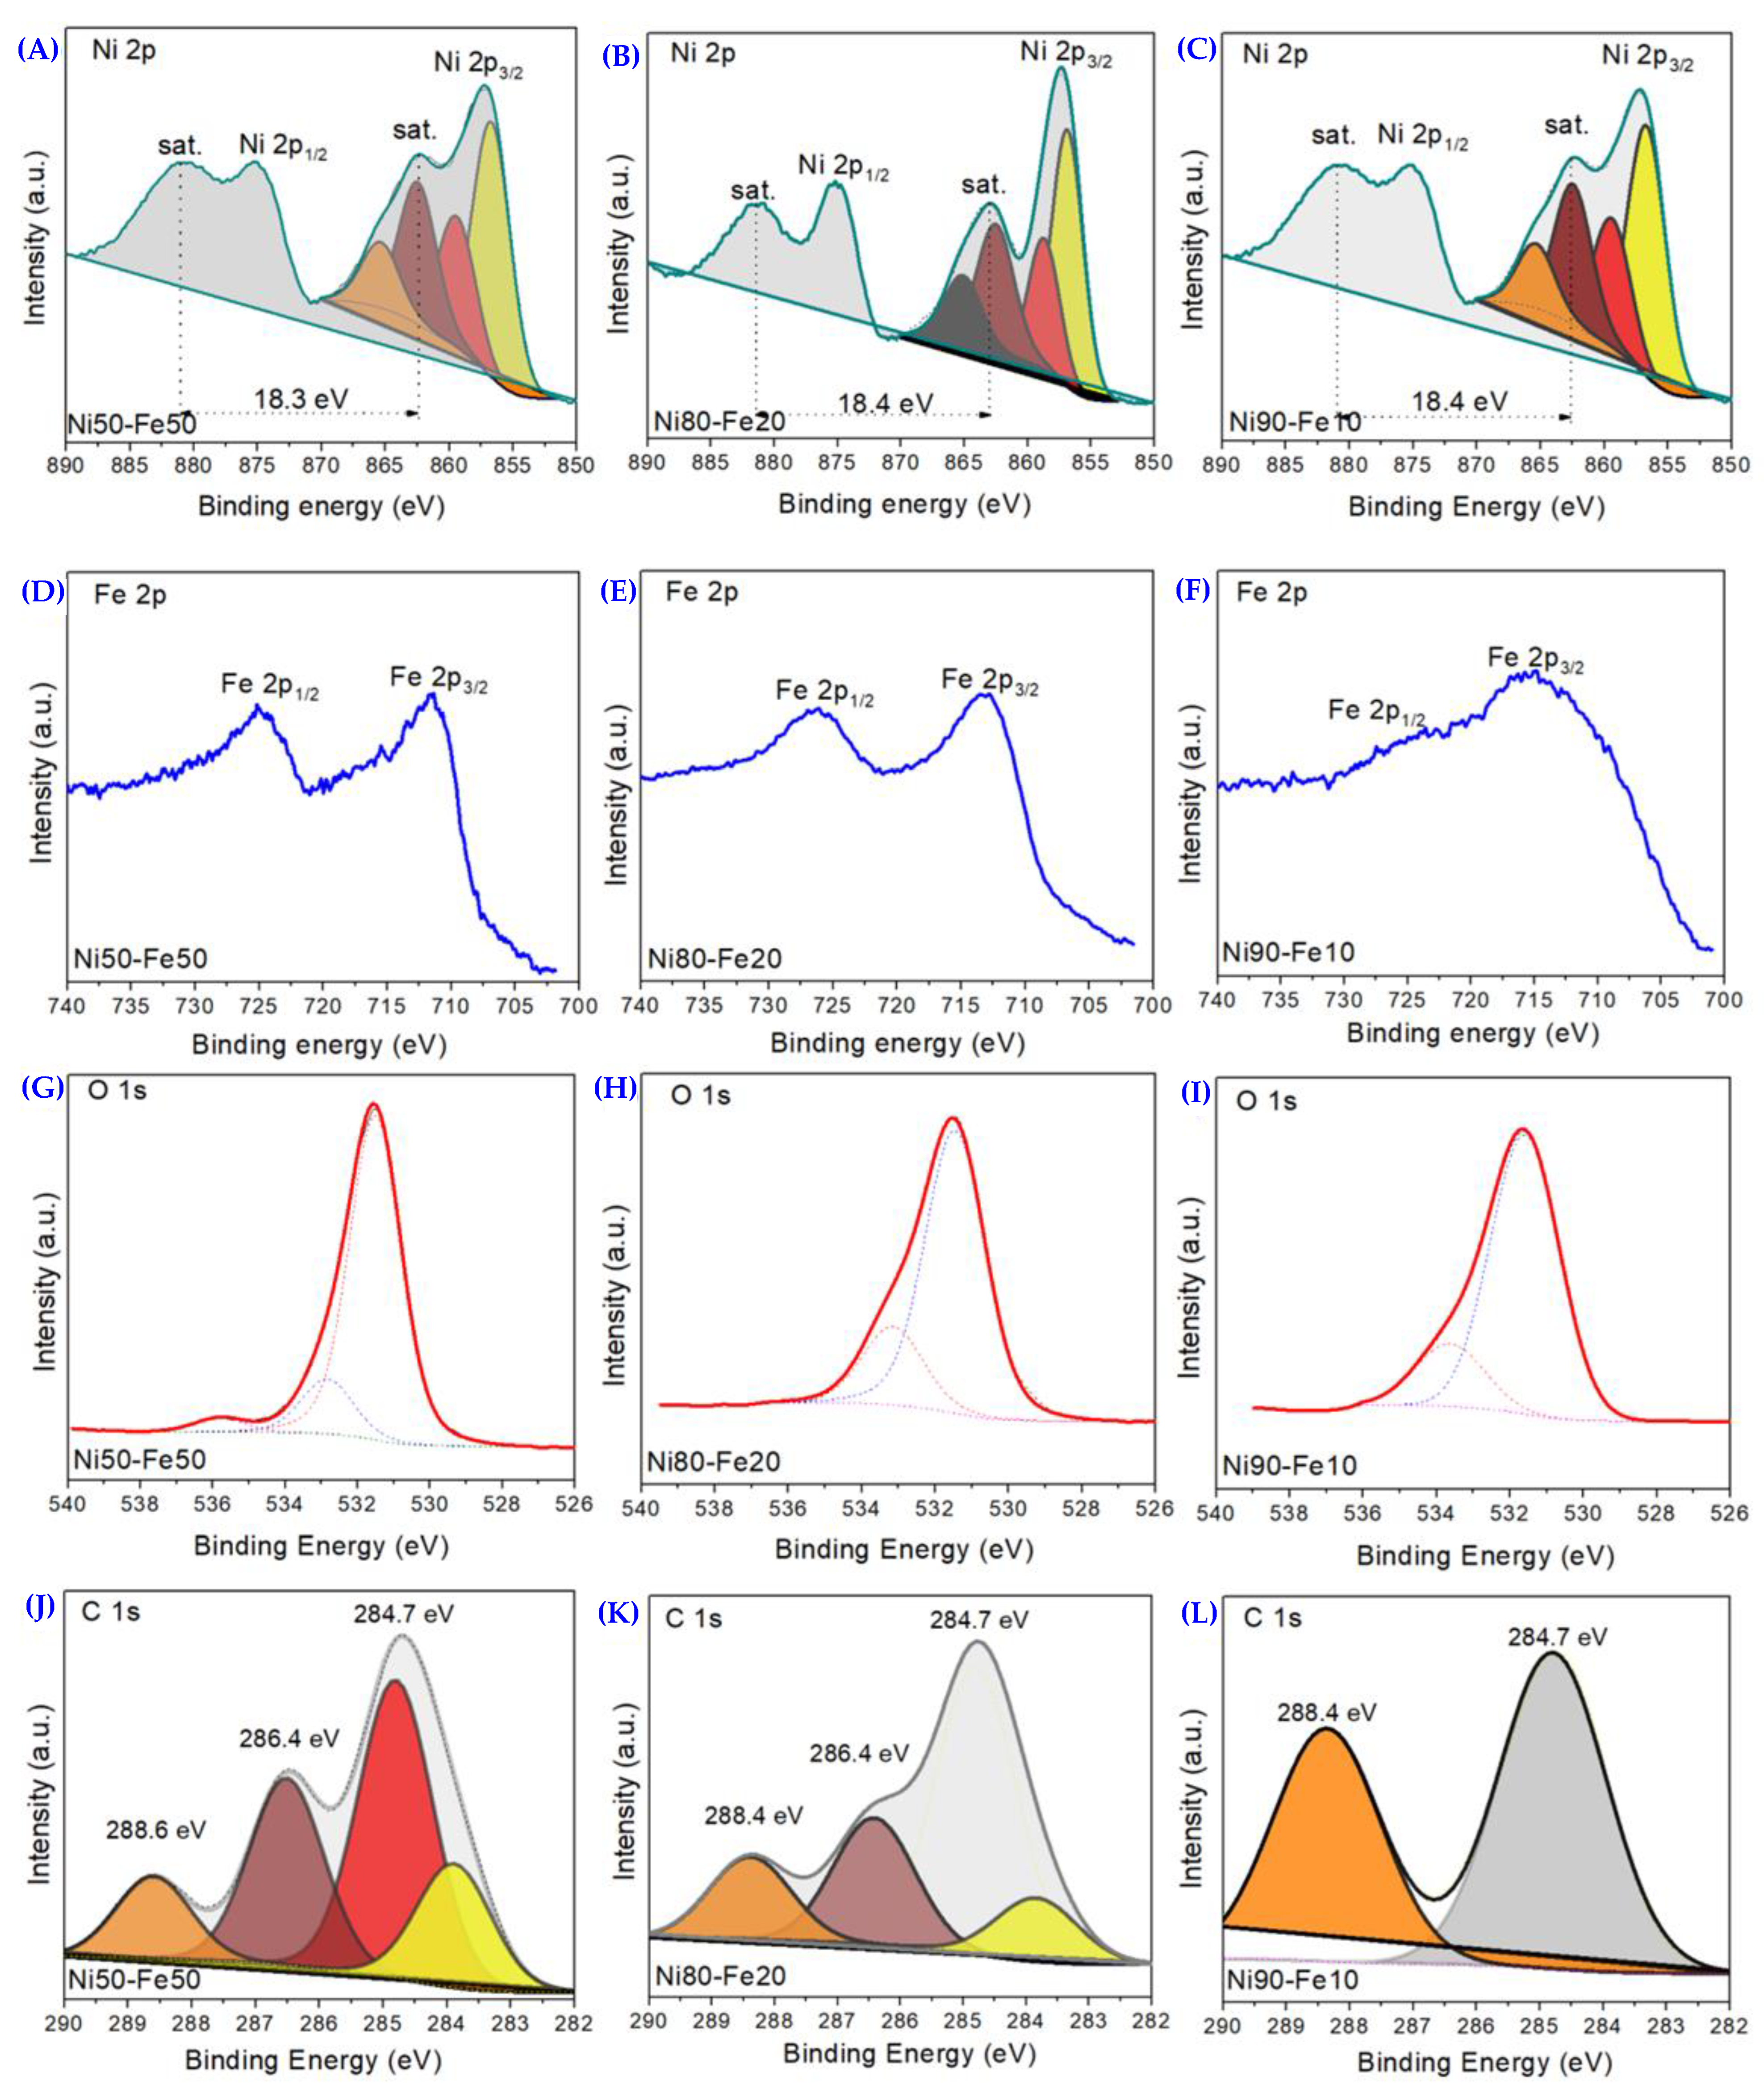
XPS analysis was performed to investigate the surface’s chemical state, and the results are shown in Figure 5. For the sample Ni50-Fe50 wt%, the typical Ni 2p3/2 (857.1 eV) and 2p1/2 (875.2 eV) peaks of Ni(OH)2 with two shake-up satellites (denoted as “sat.”) obtained at 880.7 eV and 862.3 eV, respectively (Figure 5A). The spin-energy separation of 18.4 eV indicates the characteristics of the Ni(OH)2 phase, which are in good agreement with previously reported results [39,40]. A similar procedure was followed for the sample Ni80-Fe20 wt%, (Figure 5B), and the peaks assigned to Ni 2p3/2 and 2p1/2 peaks were obtained at 857.1 and 875.2 eV, respectively. The shake-up satellites were obtained at 881.3 and 862.9 eV. The spin-energy separation is 18.4 eV. For the sample Ni90-Fe10 wt%, (Figure 5C), the Ni 2p3/2 peak was obtained at 857.2 eV and 2p1/2 peak was obtained at 875.2 eV. The shake-up satellites were obtained at 880.4 and 862.1 eV. The spin-energy separation was 18.3 eV. Figure 5D–F shows the Fe 2p spectra. For all three samples, Ni50-Fe50 wt%, Ni80-Fe20 wt%, and Ni90-Fe10 wt%, the peaks were Fe 2p3/2 and Fe 2p1/2, indicating the presence of FeO(OH) [41,42]. For the sample Ni50-Fe50 wt%, the peaks of Fe 2p3/2 and Fe 2p1/2 were located at a binding energy of 711.4 and 725.1 eV, respectively [43]. The spectrum for the Ni80-Fe20 wt% sample provides evidence of the Fe 2p3/2 peak at 712.2 eV and Fe 2p1/2 at 725.7 eV. The XPS spectra of the Ni90-Fe10 wt% sample show the peaks of Fe 2p3/2 and Fe 2p1/2 at a binding energy of 712.4 eV and 726.6 eV, respectively. Thus, it can be concluded from the spectral XPS that FeO(OH) has been obtained, and the results are in excellent agreement with those of XRD. Figure 5G–I present O 1s XPS spectra for Ni50-Fe50 wt%, Ni80-Fe20 wt%, and Ni90-Fe10 wt% samples. For the Ni50-Fe50 wt% sample, the peak at 531.7 eV was assigned to O 1s photoelectrons (Figure 5G), consisting of two oxygen bonds (533.4 and 531.6 eV), which could be associated with physi- and chemi-absorbed molecular water of Ni(OH)2 [44,45]. The O 1s region, at 533.4 and 531.6 eV could be assigned to Fe–O and Fe–OH bonds in the FeO(OH) structure [43,46], respectively. For the sample Ni80-Fe20 wt%, in Figure 5H, the peak at 531.5 eV was assigned to O 1s photoelectrons and for the sample Ni90-Fe10 wt% the peak at 531.6 eV was assigned to O 1s. This result is also consistent with the XRD analysis, confirming the formation of a Ni(OH)2–FeO(OH) mixture. As shown in Figure 5J, the main peak at 284.7 eV is ascribed to sp2-hybridized carbon and adventitious carbon from C60. Defect-containing sp2-hybridized carbon and carboxyl carbon (O = C = O) led to the peaks located at 286.4 and 288.6 eV, respectively, for the Ni50-Fe50 wt% sample [47]. For the XPS spectrum of the C 1s core level region of the Ni80-Fe20 wt% sample, a relative decrease at 286.4 eV, corresponding to C–O–C, was observed. The dominant peak contribution most probably comes from sp2-hybridized carbon and adventitious carbon from the C60 with correlated binding energy at ∼284.7 eV. The magnified view of C 1s for the Ni90-Fe10 wt% sample, shows a pronounced peak at 284.7 eV, which is attributed to the sp2 carbon (C–C bond). The contribution at 288.4 eV is assigned to C = O double bonds and/or C–O–C epoxy moieties [48,49].
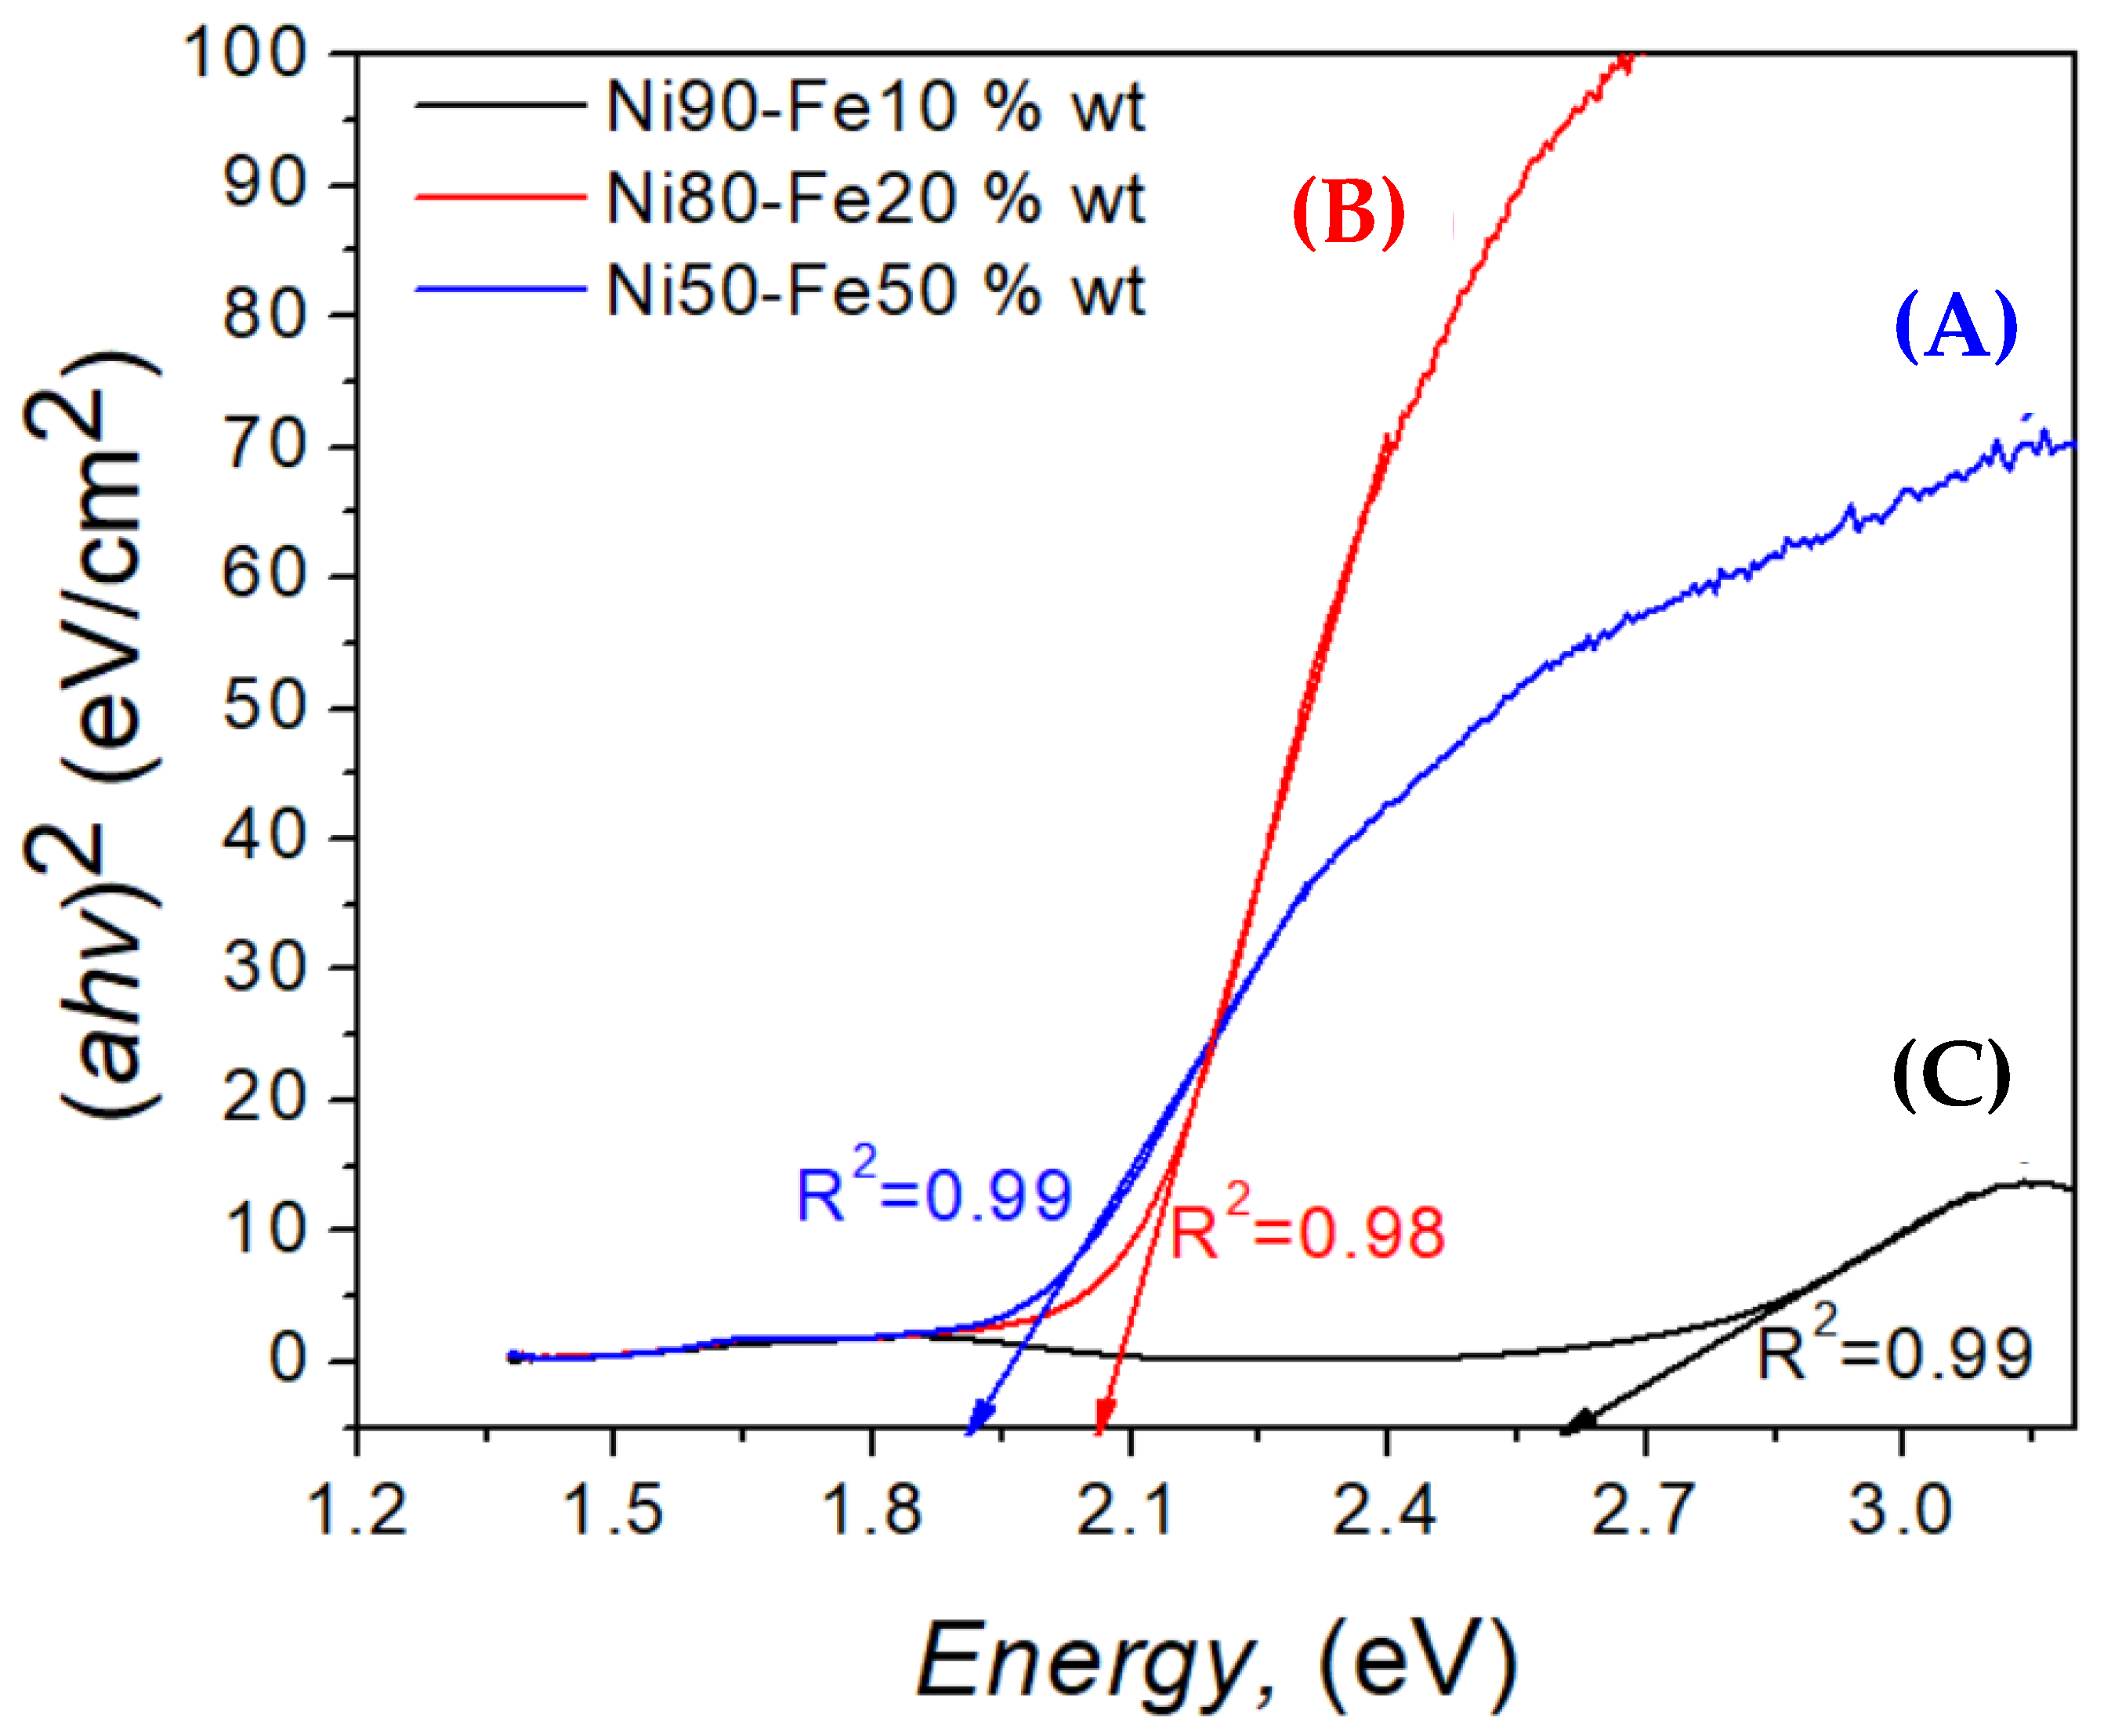
UV-Vis diffuse reflectance (DR) spectroscopy was used to investigate the optical properties of the as-prepared samples. The band gap energy (Eg) of the as-prepared samples was calculated using the Kubelka–Munk formula [19]. To discover the band gap energy of the material in eV, a graph between (αhν)2 and on the y-axis and x-axis, respectively, was plotted. The curve from the graph was extrapolated from a straight path toward its energy axis to obtain the band gap value. Kubelka–Munk plots of the as-prepared samples are shown in Figure 6. Moreover, the coefficients of R2 are shown in the graph. The band gap energies for the Ni50-Fe50 wt%, Ni80-Fe20 wt%, and Ni90-Fe10 wt% samples were 1.91, 2.06, and 2.61 eV, respectively, indicating that the as-prepared samples could be used as potential highly efficient visible-light photocatalysts. In addition, examination of the band gap energies demonstrates that higher band gap energies widen the valence-conduction band gap and aid in preventing the reunion of the electron and hole pairs. This element may encourage oxidation and reduction reactions on the photocatalyst surface.
To investigate the catalytic ability of the as-prepared samples, an organic dye, Reactive Black 5 (RB5), was selected to be decolored. The catalytic reaction was carried out in a 200 mL glass flask containing 100 mg/L of RB5. The aqueous mixture was adjusted to pH 3 using HCl (0.1 M). The aqueous mixture was stirred for 10 min in the dark to maintain adsorption-desorption equilibrium at room temperature. Then, the solution was exposed to a 13 W halogen lamp with a wavelength of 463 nm (E = 2.678 eV). The decrement in the concentration of RB5 was examined by UV-Vis spectroscopy, measuring the maximum light absorbance at λmax = 596 nm after specific intervals of time (0, 10, 20, 40, 60, 80, 100, 120, 140, 160, and 180 min).
Figure 7A–I depicts the evolution of RB5 UV-Vis absorption spectra as a function of photoreaction time with the catalyst and catalyst concentration for 100, 150, and 200 mg of Ni50-Fe50 wt% (a–c), Ni80-Fe20 wt% (d–f), and Ni90-Fe10 wt% (g–i).
In all studied cases, the as-prepared samples appeared to efficiently decolorize the RB5 dye to a large extent. More specifically, the downward shifting of peak intensities for different samples can be clearly observed in the absorption spectra shown in Figure 7A–I. Indeed, the RB5 typical color disappeared as a function of photoreaction time, and the decline of the absorbance intensity at 596 nm confirmed the elimination of chromophore groups.
Furthermore, the blue shifting of the peak at 596 nm indicates the catalytic decolorization of the RB5. The resulting transparent color of the Reactive Black 5 solution indicates complete dye decolorization. A large degree of decolorization is observed at 180 min in the experiments with 200 mg load of catalyst; this result can be explained by a higher hydroxyl radical formation due to the highest catalyst concentration. Certainly, hydroxyl radicals are capable of rapidly attacking organic pollutants and can cause chemical decomposition of these compounds, producing their chemical decomposition [50]. In this sense, the RB5 dye photodecoloration by the Ni-Fe nanocatalysts demonstrates their ability to generate charge carrier species and vigorous oxidizing agents such as •O2 and OH [51,52]. The obtained results indicate that this novel catalytic system shows great efficiency for dye decolorization, and the beneficial impact of carbon-based nanostructures on the catalytic characteristics of a Ni-Fe-C system has already been demonstrated.
The general mechanism of photocatalytic activity under the Ni-Fe-C system is outlined in the following formulae [53,54]:
Ni-Fe-C + hν→e (CB) + h+ (VB)
h+ (VB) + H2O→H+ + OH
e (CB) + O2O2
h+(CB) + OHOH
OH + RB5 (dye)→CO2 + H2O (degradation products)
O2 + RB5 (dye) → CO2 + H2O (degradation products)
Figure 8A–C show the plots of decolorization (%) versus reaction time (t) for the different as-prepared samples. The RB5 dye decolorization efficiency (%) at specific intervals of 0, 10, 20, 40, 60, 80, 100, 120, 140, 160, and 180 mins irradiation with Ni-Fe-C loading from 100 to 200 mg are presented. Data from these figures reveals that the decolorization efficiency increases when increasing the Ni-Fe-C loading, especially up to 200 mg, for the Ni50-Fe50 wt% sample. This behavior can be attributed to the fact that FeO(OH) addition increases the active sites for dye adsorption on the photocatalyst surface as well as the free hydroxyl radical (•OH) generation; see Equations (4) and (6). To support these results, the observed band gap of the Ni50-Fe50 wt% sample, as shown in Figure 6A, decreases with an increase in the FeO(OH) in the sample. Because electrons from the valance band can be easily promoted to the conduction band by a drop in Eg, there is a stronger electrical contact between H2O2 and FeO(OH). This makes it simpler for electrons to move from the catalyst to the Fermi level of nearby molecules, which in turn results in the formation of the negatively charged hydroxyl group (OH-), which then transforms into hydroxyl radicals (OH), which attack the adsorbed dye molecules on the catalyst surface. [54]. Therefore, an increase in FeO(OH) and a decrease in the band gap of the catalyst enhance the catalytic degradation of RB5. However, a synergistic effect between Ni and Fe and C is necessary to optimize photocatalytic performance.
The kinetics model that is the best fit for RB5 decolorization was a zero-order model [55], according to Equation (9):
Ct = k0t + C
where Ct is the initial concentration of RB5 at time t (mg/L), t is the contact time in minutes, and k0 is zero-order rate constant.
Figure 9A–C show the plots corresponding to the kinetics model fitted for zero-order with Ni-Fe-C loading from 100, 150, and 200 mg as well as the regression coefficient, respectively. The removal rate of RB5 decolorization follows the zero-order kinetic model. Therefore, the reaction rate is independent of the concentration of RB5, and the adsorption-desorption process can be neglected due to being faster.
The comparison of materials used for dye degradation using the photocatalyst is summarized in Table 1. This case shows the system’s novelty and the application of decoloring the RB5.

4. Conclusions

In conclusion, two magnetically susceptible precursors (acetyl acetonates) were dissociated by sonochemistry, allowing the formation of allotropic forms of carbon such as CNOs. Similarly, the formation of laminar structures was observed, which is attributed to the magnetic nature of the precursors. These laminar structures tend to become ordered and form superstructures, where it was determined that there are sites occupied by CNOs. The photocatalysis studies for dye RB5 show that the three products obtained at the different Ni-Fe ratios have a removal potential greater than 99% within 180 min and for a catalyst load of 200 mg. The kinetics model that best fit for RB5 decolorization was a zero-order model. These results serve as a reference for future in-depth studies aimed at establishing the application of these materials for the removal, from wastewater, of colorants with energies within the visible spectrum.

Author Contributions

Conceptualization, L.G.-R., V.G.F. and D.V.M.-M.; Methodology, I.H.P., R.S.P. and R.L.P.; HR-TEM visualization, V.G.F.; Investigation, J.N.R.O., R.S.P. and L.M.-M.; XRD analysis, J.C.E.-T. and L.D.-B.A.; Writing—review and editing, L.G.-R., R.S.P., I.H.P. and L.M.-M. All authors have read and agreed to the published version of the manuscript.

Funding

The research was funded by the Project CB003-20. “Anisotropía en Nanoestructuras de Dióxido de Titanio (TiO2) con Impurezas de Óxidos de Metal y su Influencia en las Propiedades Optoelectrónicas”. Universidad Autonoma Metropolitana Azacapotzalco, Area de Quimica de Materiales and the Tecnologico Nacional de México Campus Ixtapaluca, project TECNM-14050.22-PD.

Institutional Review Board Statement

Not applicable.

Informed Consent Statement

Not applicable.

Data Availability Statement

Not applicable.

Acknowledgments

The authors thank CONACyT for its distinction and encouragement as a national researcher program SNI.

Conflicts of Interest

The authors declare no conflict of interest.

References

  1. Guan, M.; Wang, Q.; Zhang, X.; Bao, J.; Gong, X.; Liu, Y. Two-Dimensional Transition Metal Oxide and Hydroxide-Based Hierarchical Architectures for Advanced Supercapacitor Materials. Front. Chem. 2020, 8, 390. [Google Scholar] [CrossRef]
  2. Hu, Z.; Xiao, X.; Jin, H.; Li, T.; Chen, M.; Liang, Z.; Guo, Z.; Li, J.; Wan, J.; Huang, L.; et al. Rapid mass production of two-dimensional metal oxides and hydroxides via the molten salts method. Nat. Commun. 2017, 8, 15630. [Google Scholar] [CrossRef] [PubMed] [Green Version]
  3. Ma, N.; Xu, J.; Bian, Z.; Yang, Y.; Zhang, L.; Wang, H. BiVO4 plate with Fe and Ni oxyhydroxide cocatalysts for the photodegradation of sulfadimethoxine antibiotics under visible-light irradiation. Chem. Eng. J. 2019, 389, 123426. [Google Scholar] [CrossRef]
  4. Wenderich, K.; Mul, G. Methods, mechanism, and applications of photodeposition in photocatalysis: A review. Chem. Rev. 2016, 116, 14587–14619. [Google Scholar] [CrossRef] [PubMed]
  5. Kim, J.Y.; Youn, D.H.; Kang, K.; Lee, J.S. Highly Conformal Deposition of an Ultrathin FeOOH Layer on a Hematite Nanostructure for Efficient Solar Water Splitting. Angew. Chem. Int. Ed. 2016, 55, 10854–10858. [Google Scholar] [CrossRef] [PubMed]
  6. Andersen, N.I.; Serov, A.; Atanassov, P. Metal oxides/CNT nano-composite catalysts for oxygen reduction/oxygen evolu-tion in alkaline media. Appl. Catal. B Environ. 2015, 163, 623–627. [Google Scholar] [CrossRef]
  7. Iwashina, K.; Iwase, A.; Ng, Y.H.; Amal, R.; Kudo, A. Z-schematic water splitting into H2 and O2 using metal sulfide as a hy-drogen-evolving photocatalyst and reduced graphene oxide as a solid-state electron mediator. J. Am. Chem. Soc. 2015, 137, 604–607. [Google Scholar] [CrossRef] [PubMed]
  8. Hernández-Perez, I.; Maubert, A.M.; Rendón, L.; Santiago, P.; Herrera-Hernández, H.; Díaz-Barriga Arceo, L.; Garibay Febles, V.; González, E.P.; González-Reyes, L. Ultrasonic synthesis: Structural, optical and electrical cor-relation of TiO2 nanoparticles. Int. J. Electrochem. Sci. 2012, 7, 8832–8847. [Google Scholar]
  9. Suslick, K.S. Sonochemistry. Science 1990, 247, 1439–1445. [Google Scholar] [CrossRef] [PubMed]
  10. Bang, J.H.; Suslick, K.S. Applications of Ultrasound to the Synthesis of Nanostructured Materials. Adv. Mater. 2010, 22, 1039–1059. [Google Scholar] [CrossRef]
  11. Ye, K.-H.; Wang, Z.; Gu, J.; Xiao, S.; Yuan, Y.; Zhu, Y.; Zhang, Y.; Mai, W.; Yang, S. Carbon quantum dots as a visible light sensitizer to significantly increase the solar water splitting performance of bismuth vanadate photoanodes. Energy Environ. Sci. 2017, 10, 772–779. [Google Scholar] [CrossRef]
  12. Chowdhury, M.; Ntiribinyange, M.; Nyamayaro, K.; Fester, V. Photocatalytic activities of ultra-small β-FeOOH and TiO2 heterojunction structure under simulated solar irradiation. Mater. Res. Bull. 2015, 68, 133–141. [Google Scholar] [CrossRef]
  13. Rawal, S.B.; Chakraborty, A.K.; Lee, W.I. Heterojunction of FeOOH and TiO2 for the formation of visible light photo-catalyst. Bull. Kor. Chem. Soc. 2009, 30, 2613–2616. [Google Scholar] [CrossRef] [Green Version]
  14. Chen, H.; Wang, J.M.; Pan, T.; Zhao, Y.L.; Zhang, J.Q.; Cao, C.N. The structure and electrochemical performance of spherical Al-substituted α-Ni(OH)2 for alkaline rechargeable batteries. J. Power Sour. 2005, 143, 243–255. [Google Scholar] [CrossRef]
  15. Zhang, L.; Zhong, Y.; He, Z.; Wang, J.; Xu, J.; Cai, J.; Zhang, N.; Zhou, H.; Fan, H.; Shao, H.; et al. Surfactant-assisted photochemical deposition of three-dimensional nanoporous nickel oxyhydroxide films and their energy storage and conversion properties. J. Mater. Chem. A 2013, 1, 4277. [Google Scholar] [CrossRef]
  16. Lotya, M.; Hernandez, Y.; King, P.J.; Smith, R.J.; Nicolosi, V.; Karlsson, L.S.; Blighe, F.M.; De, S.; Wang, Z.; McGovern, I.T.; et al. Liquid Phase Production of Graphene by Exfoliation of Graphite in Surfactant/Water Solutions. J. Am. Chem. Soc. 2009, 131, 3611–3620. [Google Scholar] [CrossRef] [PubMed] [Green Version]
  17. Basavarajappa, P.S.; Seethya, B.N.H.; Ganganagappa, N.; Eshwaraswamy, K.B.; Kakarla, R.R. Enhanced Photocatalytic Activity and Biosensing of Gadolinium Substituted BiFeO3 Nanoparticles. ChemistrySelect 2018, 3, 9025–9033. [Google Scholar] [CrossRef]
  18. Abdellah, A.R.; Abdelhamid, H.N.; El-Adasy, A.-B.A.; Atalla, A.A.; Aly, K.I. One-pot synthesis of hierarchical porous covalent organic frameworks and two-dimensional nanomaterials for selective removal of anionic dyes. J. Environ. Chem. Eng. 2020, 8, 104054. [Google Scholar] [CrossRef]
  19. Tauc, J.; Grigorovici, R.; Vancu, A. Optical Properties and Electronic Structure of Amorphous germanium. Phys. Status Solidi B 1966, 15, 627–637. [Google Scholar] [CrossRef]
  20. Suarez-Martinez, I.; Grobert, N.; Ewels, C.P. Nomenclature of sp2 carbon nanoforms. Carbon 2012, 50, 741–747. [Google Scholar] [CrossRef] [Green Version]
  21. Quintana, M.; Grzelczak, M.; Spyrou, K.; Kooi, B.; Bals, S.; Van Tendeloo, G.; Rudolf, P.; Prato, M. Production of large graphene sheets by exfoliation of graphite under high power ultrasound in the presence of tiopronin. Chem. Commun. 2012, 48, 12159–12161. [Google Scholar] [CrossRef] [PubMed] [Green Version]
  22. Calvaresi, M.; Quintana, M.; Rudolf, P.; Zerbetto, F.; Prato, M. Rolling up a Graphene Sheet. ChemPhysChem 2013, 14, 3447–3453. [Google Scholar] [CrossRef]
  23. Quintana, M.; Grzelczak, M.; Spyrou, K.; Calvaresi, M.; Bals, S.; Kooi, B.; Van Tendeloo, G.; Rudolf, P.; Zerbetto, F.; Prato, M. A Simple Road for the Transformation of Few-Layer Graphene into MWNTs. J. Am. Chem. Soc. 2012, 134, 13310–13315. [Google Scholar] [CrossRef] [PubMed] [Green Version]
  24. Warner, J.H.; Margine, E.R.; Mukai, M.; Robertson, A.W.; Giustino, F.; Kirkland, A.I. Dislocation-Driven Deformations in Graphene. Science 2012, 337, 209–212. [Google Scholar] [CrossRef] [PubMed] [Green Version]
  25. Chuvilin, A.; Bichoutskaia, E.; Lopez, M.D.C.G.; Chamberlain, T.; Rance, G.; Kuganathan, N.; Biskupek, J.; Kaiser, U.; Khlobystov, A. Self-assembly of a sulphur-terminated graphene nanoribbon within a single-walled carbon nanotube. Nat. Mater. 2011, 10, 687–692. [Google Scholar] [CrossRef] [PubMed]
  26. Chuvilin, A.; Kaiser, U.; Bichoutskaia, E.; Besley, N.; Khlobystov, A. Direct transformation of graphene to fullerene. Nat. Chem. 2010, 2, 450–453. [Google Scholar] [CrossRef] [PubMed]
  27. Wang, S.; Tang, L.A.L.; Bao, Q.; Lin, M.; Deng, S.; Goh, B.M.; Loh, K.P. Room-Temperature Synthesis of Soluble Carbon Nanotubes by the Sonication of Graphene Oxide Nanosheets. J. Am. Chem. Soc. 2009, 131, 16832–16837. [Google Scholar] [CrossRef] [PubMed]
  28. Tong, G.; Guan, J.; Zhang, Q. Goethite hierarchical nanostructures: Glucose-assisted synthesis, chemical conversion into hematite with excellent photocatalytic properties. Mater. Chem. Phys. 2011, 127, 371–378. [Google Scholar] [CrossRef]
  29. Kang, S.; Wang, G.; Fang, M.; Wang, H.; Wang, X.; Cai, W. Water bath synthesis and enhanced photocatalytic performances of urchin-like micro/nanostructured α-FeOOH. J. Mater. Res. 2015, 30, 1629–1638. [Google Scholar] [CrossRef]
  30. Namduri, H.; Nasrazadani, S. Quantitative analysis of iron oxides using Fourier transform infrared spectrophotometry. Corros. Sci. 2008, 50, 2493–2497. [Google Scholar] [CrossRef]
  31. Pinto, P.; Lanza, G.; Ardisson, J.; Lago, R. Controlled Dehydration of Fe(OH)3 to Fe2O3: Developing Mesopores with Complexing Iron Species for the Adsorption of β-Lactam Antibiotics. J. Braz. Chem. Soc. 2018, 30, 307–371. [Google Scholar] [CrossRef]
  32. Cheng, M.-Y.; Hwang, B.-J. Control of uniform nanostructured α-Ni(OH)2 with self-assembly sodium dodecyl sulfate templates. J. Colloid Interface Sci. 2009, 337, 265–271. [Google Scholar] [CrossRef] [PubMed]
  33. Saghatforoush, L.A.; Hasanzadeh, M.; Sanati, S.; Mehdizadeh, R. Ni(OH)2and NiO Nanostructures: Synthesis, Characterization and Electrochemical Performance. Bull. Korean Chem. Soc. 2012, 33, 2613–2618. [Google Scholar] [CrossRef] [Green Version]
  34. Vidotti, M.; Salvador, R.P.; Ponzio, E.; de Torresi, S.C. Mixed Ni/Co hydroxide nanoparticles synthesized by sonochemical method. J. Nanosci. Nanotechnol. 2007, 7, 3221–3226. [Google Scholar] [CrossRef] [PubMed]
  35. Bantignies, J.L.; Deabate, S.; Righi, A.; Rols, S.; Hermet, P.; Sauvajol, J.L.; Henn, F. New Insight into the Vibrational Behavior of Nickel Hydroxide and Oxyhydroxide Using Inelastic Neutron Scattering, Far/Mid-Infrared and Raman Spectroscopies. J. Phys. Chem. C 2008, 112, 2193–2201. [Google Scholar] [CrossRef]
  36. Cataldo, F.; García-Hernández, D.A.; Manchado, A. Sonochemical Synthesis of Fullerene C60/Anthracene Diels-Alder Mono and Bis-adducts. Full-Nanotub. Carbon Nanostruct. 2014, 22, 565–574. [Google Scholar] [CrossRef]
  37. Hare, J.P.; Dennis, T.J.; Kroto, H.W.; Taylor, R.; Allaf, A.W.; Balm, S.; Walton, D.R.M. The IR spectra of fullerene-60 and -70. J. Chem. Soc., Chem. Commun. 1991, 6, 412–413. [Google Scholar] [CrossRef]
  38. Alves, G.C.; Ladeira, L.O.; Righi, A.; Krambrock, K.; Calado, H.D.; Gil, R.P.D.F.; Pinheiro, M. Synthesis of C60(OH)18-20 in aqueous alkaline solution under O2-atmosphere. J. Braz. Chem. Soc. 2006, 17, 1186–1190. [Google Scholar] [CrossRef] [Green Version]
  39. Yan, J.; Fan, Z.; Sun, W.; Ning, G.; Wei, T.; Zhang, Q.; Zhang, R.; Zhi, L.; Wei, F. Advanced Asymmetric Supercapacitors Based on Ni(OH)2/Graphene and Porous Graphene Electrodes with High Energy Density. Adv. Funct. Mater. 2012, 22, 2632–2641. [Google Scholar] [CrossRef]
  40. Lee, J.W.; Ahn, T.; Soundararajan, D.; Ko, J.M.; Kim, J.-D. Non-aqueous approach to the preparation of reduced graphene oxide/α-Ni(OH)2 hybrid composites and their high capacitance behavior. Chem. Commun. 2011, 47, 6305–6307. [Google Scholar] [CrossRef]
  41. Abdel-Samad, H.; Watson, P.R. An XPS study of the adsorption of lead on goethite (α-FeOOH). Appl. Surf. Sci. 1998, 136, 46–54. [Google Scholar] [CrossRef]
  42. Zheng, Y.; Zhang, Z.; Li, C. Beta-FeOOH-supported graphitic carbon nitride as an efficient visible light photocatalyst. J. Mol. Catal. A Chem. 2016, 423, 463–471. [Google Scholar] [CrossRef]
  43. Chagas, P.; Da Silva, A.C.; Passamani, E.C.; Ardisson, J.D.; De Oliveira, L.C.A.; Fabris, J.D.; Paniago, R.M.; Monteiro, D.S.; Pereira, M.C. δ-FeOOH: A superparamagnetic material for controlled heat release under AC magnetic field. J. Nanoparticle Res. 2013, 15, 1544. [Google Scholar] [CrossRef]
  44. Jiang, H.; Guo, Y.; Wang, T.; Zhu, P.-L.; Yu, S.; Yu, Y.; Fu, X.-Z.; Sun, R.; Wong, C.-P. Electrochemical fabrication of Ni(OH)2/Ni 3D porous composite films as integrated capacitive electrodes. RSC Adv. 2015, 5, 12931–12936. [Google Scholar] [CrossRef]
  45. Sherman, D.M. Electronic structures of iron(III) and manganese(IV) (hydr)oxide minerals: Thermodynamics of photochemical reductive dissolution in aquatic environments. Geochim. Cosmochim. Acta 2005, 69, 3249–3255. [Google Scholar] [CrossRef]
  46. Liu, J.; Zheng, M.; Shi, X.; Zeng, H.; Xia, H. Amorphous FeOOH Quantum Dots Assembled Mesoporous Film Anchored on Graphene Nanosheets with Superior Electrochemical Performance for Supercapacitors. Adv. Funct. Mater. 2015, 26, 919–930. [Google Scholar] [CrossRef]
  47. Cao, T.; Huang, P.; Zhang, K.; Sun, Z.; Zhu, K.; Yuan, L.; Chen, K.; Chen, N.; Li, Y. Interfacial engineering via inserting functionalized water-soluble fullerene derivative interlayers for enhancing the performance of perovskite solar cells. J. Mater. Chem. A 2018, 6, 3435–3443. [Google Scholar] [CrossRef]
  48. Zheng, J.-P.; Zhen, M.-M.; Ge, J.-C.; Liu, Q.-L.; Jiang, F.; Shu, C.-Y.; Alhadlaq, H.A.; Wang, C.-R. Multifunctional gadofulleride nanoprobe for magnetic resonance imaging/fluorescent dual modality molecular imaging and free radical scavenging. Carbon 2013, 65, 175–180. [Google Scholar] [CrossRef]
  49. Song, T.; Zhang, P.; Zeng, J.; Wang, T.; Ali, A.; Zeng, H. Boosting the photocatalytic H2 evolution activity of Fe2O3 polymorphs (α-, γ- and β-Fe2O3) by fullerene [C60]-modification and dye-sensitization under visible light irradiation. RSC Adv. 2017, 7, 29184–29192. [Google Scholar] [CrossRef] [Green Version]
  50. Shaheen, N.; Yousuf, M.A.; Shakir, I.; Zulfiqar, S.; Agboola, P.O.; Warsi, M.F. Wet chemical route synthesis of spinel oxide nano-catalysts for photocatalytic applications. Phys. B Condens. Matter 2019, 580, 411820. [Google Scholar] [CrossRef]
  51. Yu, C.; Li, G.; Wei, L.; Fan, Q.; Shu, Q.; Yu, J. Fabrication, characterization of β-MnO2 microrod catalysts and their performance in rapid degradation of dyes of high concentration. Catal. Today 2014, 224, 154–162. [Google Scholar] [CrossRef]
  52. Reddy, C.V.; Reddy, I.N.; Reddy, K.R.; Jaesool, S.; Yoo, K. Template-free synthesis of tetragonal Co-doped ZrO2 nanoparticles for applications in electrochemical energy storage and water treatment. Electrochim. Acta 2019, 317, 416–426. [Google Scholar] [CrossRef]
  53. Warsi, M.F.; Shaheen, N.; Sarwar, M.I.; Agboola, P.O.; Shakir, I.; Zulfiqar, S. A comparative study on photocatalytic activities of various transition metal oxides nanoparticles synthesized by wet chemical route. Desalination Water Treat 2021, 211, 181–195. [Google Scholar] [CrossRef]
  54. Rauf, M.; Meetani, M.; Hisaindee, S. An overview on the photocatalytic degradation of azo dyes in the presence of TiO2 doped with selective transition metals. Desalination 2011, 276, 13–27. [Google Scholar] [CrossRef]
  55. Kumar, R.; Barakat, M.; Al-Mur, B.A.; Alseroury, F.A.; Eniola, J. Photocatalytic degradation of cefoxitin sodium antibiotic using novel BN/CdAl2O4 composite. J. Clean. Prod. 2019, 246, 119076. [Google Scholar] [CrossRef]
  56. Potle, V.D.; Shirsath, S.R.; Bhanvase, B.A.; Saharan, V.K. Sonochemical preparation of ternary rGO-ZnO-TiO2 nanocomposite photocatalyst for efficient degradation of crystal violet dye. Optik 2020, 208, 164555. [Google Scholar] [CrossRef]
  57. Tabatabaeinejad, S.M.; Amiri, O.; Ghanbari, M.; Salavati-Niasari, M. Dy2Cu2O5 nanostructures: Sonochemical fabrication, characterization, and investigation of photocatalytic ability for elimination of organic contaminants. J. Mol. Liq. 2021, 344, 117883. [Google Scholar] [CrossRef]
  58. Kaur, H.; Singh, J.; Rani, P.; Kaur, N.; Kumar, S.; Rawat, M. A novel and one-pot synthesis of Punica granatum mediated copper oxide having flower-like morphology as an efficient visible-light driven photocatalyst for degradation of textile dyes in waste water. J. Mol. Liq. 2022, 355, 118966. [Google Scholar] [CrossRef]
  59. Tabatabaeinejad, S.M.; Ghanbari, M.; Najm, Z.M.; Abdul-Fattah, M.N.; Hameed, N.M.; Salavati-Niasari, M. Facile sonochemical preparation of La2Cu2O5 nanostructures, characterization, the evaluation of performance, mechanism, and kinetics of photocatalytic reactions for the removal of toxic pollutants. J. Mol. Liq. 2022, 362, 119718. [Google Scholar] [CrossRef]
  60. Zinatloo-Ajabshir, S.; Baladi, M.; Salavati-Niasari, M. Sono-synthesis of MnWO4 ceramic nanomaterials as highly efficient photocatalysts for the decomposition of toxic pollutants. Ceram. Int. 2021, 47, 30178–30187. [Google Scholar] [CrossRef]
  61. Rajabi, H.R.; Karimi, F.; Kazemdehdashti, H.; Kavoshi, L. Fast sonochemically-assisted synthesis of pure and doped zinc sulfide quantum dots and their applicability in organic dye removal from aqueous media. J. Photochem. Photobiol. B Biol. 2018, 181, 98–105. [Google Scholar] [CrossRef] [PubMed]
  62. Zinatloo-Ajabshir, S.; Mortazavi-Derazkola, S.; Salavati-Niasari, M. Simple sonochemical synthesis of Ho2O3-SiO2 nanocomposites as an effective photocatalyst for degradation and removal of organic contaminant. Ultrason. Sonochem. 2017, 39, 452–460. [Google Scholar] [CrossRef] [PubMed]
  63. Shende, T.; Bhanvase, B.; Rathod, A.; Pinjari, D.; Sonawane, S. Sonochemical synthesis of Graphene-Ce-TiO2 and Graphene-Fe-TiO2 ternary hybrid photocatalyst nanocomposite and its application in degradation of crystal violet dye. Ultrason. Sonochem. 2017, 41, 582–589. [Google Scholar] [CrossRef] [PubMed]
  64. Talebzadeh, Z.; Masjedi-Arani, M.; Amiri, O.; Salavati-Niasari, M. La2Sn2O7/g-C3N4 Nanocomposites: Rapid and Green Sonochemical Fabrication and Photo-Degradation Performance for Removal of Dye Contaminations. Ultrason. Sonochem. 2021, 77, 105678. [Google Scholar] [CrossRef]
  65. Singh, A.R.; Dhumal, P.S.; Bhakare, M.A.; Lokhande, K.D.; Bondarde, M.P.; Some, S. In-situ synthesis of metal oxide and polymer decorated activated carbon-based photocatalyst for organic pollutants degradation. Sep. Purif. Technol. 2022, 286, 120380. [Google Scholar] [CrossRef]
  66. Al Kausor, M.; Chakrabortty, D. Graphene oxide based semiconductor photocatalysts for degradation of organic dye in waste water: A review on fabrication, performance enhancement and challenges. Inorg. Chem. Commun. 2021, 129, 108630. [Google Scholar] [CrossRef]
  67. Mahdavi, K.; Salavati-Niasari, M.; Amiri, O.; Ghanbari, M. Synthesis of La9.33Si6O26 nano-photocatalysts by ultrasonically accelerated method for comparing water treatment efficiency with changing conditions. Arab. J. Chem. 2021, 15, 103481. [Google Scholar] [CrossRef]
  68. Abkar, E.; Izadi, E.; Amiri, O.; Ghanbari, M.; Salavati-Niasari, M. Sonochemical synthesis and characterization of Cu2HgI4 nanostructures photocatalyst with enhanced visible light photocatalytic ability. Arab. J. Chem. 2021, 15, 103536. [Google Scholar] [CrossRef]
  69. Uma, K.; KrishnaKumar, B.; Pan, G.-T.; Yang, T.C.-K.; Lin, J.-H. Enriched silver plasmon resonance activity on the sonochemical synthesis of ZnO flowers with α-Fe2O3 as an efficient catalyst for photo-Fenton reaction and photo-oxidation of ethanol. J. Water Process Eng. 2019, 34, 101089. [Google Scholar] [CrossRef]
  70. Nur, A.S.; Sultana, M.; Mondal, A.; Islam, S.; Robel, F.N.; Islam, A.; Sumi, M.S.A. A review on the development of elemental and codoped TiO2 photocatalysts for enhanced dye degradation under UV–vis irradiation. J. Water Process Eng. 2022, 47, 102728. [Google Scholar] [CrossRef]
  71. Purkayastha, M.D.; Sil, S.; Singh, N.; Ray, P.P.; Darbha, G.K.; Bhattacharyya, S.; Mallick, A.I.; Majumder, T.P. Sonochemical synthesis of nanospherical TiO2 within graphene oxide nanosheets and its application as a photocatalyst and a Schottky diode. FlatChem. 2020, 22, 100180. [Google Scholar] [CrossRef]
  72. Dhivya, A.; Rakhi Yadav Stella Packiam, C. An Eco-approach synthesis of undoped and Mn doped ZnO nano-photocatalyst for prompt decoloration of methylene blue dye. Mater. Today Proc. 2021, 48, 494–501. [Google Scholar] [CrossRef]
  73. Karuppasamy, P.; Nisha, N.R.N.; Pugazhendhi, A.; Kandasamy, S.; Pitchaimuthu, S. An investigation of transition metal doped TiO2 photocatalysts for the enhanced photocatalytic decoloration of methylene blue dye under visible light irradiation. J. Environ. Chem. Eng. 2021, 9, 105254. [Google Scholar] [CrossRef]
  74. Lerici, L.C.; Marchena, C.L.; Torres, C.C.; Campos, C.H.; Pierella, L.B. Fe-doped Al2O3 nanoplatforms as efficient and recyclable photocatalyst for the dyes remediation. J. Photochem. Photobiol. A Chem. 2021, 426, 113733. [Google Scholar] [CrossRef]
  75. Goto, T.; Cho, S.H.; Ohtsuki, C.; Sekino, T. Selective adsorption of dyes on TiO2-modified hydroxyapatite photocatalysts morphologically controlled by solvothermal synthesis. J. Environ. Chem. Eng. 2021, 9, 105738. [Google Scholar] [CrossRef]
  76. Kara, G.K.; Moshari, M.; Rabbani, M.; Rahimi, R. A novel and green heterogeneous photocatalytic system (Ca0.01Fe2.99O4/CaTiO3 nanocomposite): Protocol synthesis, characterization, and study of photo-decoloration activity. Mater. Chem. Phys. 2020, 259, 124062. [Google Scholar] [CrossRef]
  77. Chauhan, P.S.; Kumar, K.; Singh, K.; Bhattacharya, S. Fast decolorization of rhodamine-B dye using novel V2O5-rGO photocatalyst under solar irradiation. Synth. Met. 2021, 283, 116981. [Google Scholar] [CrossRef]
  78. Rajaitha, P.; Hajra, S.; Sahu, M.; Mistewicz, K.; Toroń, B.; Abolhassani, R.; Panda, S.; Mishra, Y.; Kim, H. Unraveling highly efficient nanomaterial photocatalyst for pollutant removal: A comprehensive review and future progress. Mater. Today Chem. 2021, 23, 100692. [Google Scholar] [CrossRef]
  79. Monsef, R.; Ghiyasiyan-Arani, M.; Amiri, O.; Salavati-Niasari, M. Sonochemical synthesis, characterization and application of PrVO4 nanostructures as an effective photocatalyst for discoloration of organic dye contaminants in wastewater. Ultrason. Sonochemistry 2019, 61, 104822. [Google Scholar] [CrossRef]
  80. Haghighi, P.; Alijani, S.; Bazyari, A.; Thompson, L.T. Visible light dye degradation over fluorinated mesoporous TiO2− WO3− Bi2O3/SiO2 nanocomposite photocatalyst-adsorbent using immersion well reactor. J. Photochem. Photobiol. A Chem. 2022, 426, 113790. [Google Scholar] [CrossRef]
  81. Deepak, N.; Pandey, A.; Shukla, S.; Saxena, S. Siloxene: A novel 2D photocatalyst for degradation of dye molecules. Nano-Struct. Nano-Objects 2021, 26, 100721. [Google Scholar] [CrossRef]
  82. Krishnegowda, J.; Ramesh, A.M.; Gangadhar, A.; Shivanna, S. Hydrothermal processing of interfacial BiCeO3/MWCNTs photocatalyst for rapid dye degradation and its biological interest. J. Environ. Chem. Eng. 2021, 9, 105774. [Google Scholar] [CrossRef]
  83. Ge, Y.; Luo, H.; Huang, J.; Zhang, Z. Visible-light-active TiO2 photocatalyst for efficient photodegradation of organic dyes. Opt. Mater. 2021, 115, 111058. [Google Scholar] [CrossRef]
  84. Wu, Q.; Wang, H.; Yi, C. Preparation of photo-Fenton heterogeneous catalyst (Fe-TS-1 zeolite) and its application in typical azo dye decoloration. J. Photochem. Photobiol. A Chem. 2018, 356, 138–149. [Google Scholar] [CrossRef]
  85. Qutub, N.; Singh, P.; Sabir, S.; Sagadevan, S.; Oh, W.-C. Enhanced photocatalytic degradation of Acid Blue dye using CdS/TiO2 nanocomposite. Sci. Rep. 2022, 12, 5759. [Google Scholar] [CrossRef]
  86. Kumar, M.R.A.; Abebe, B.; Nagaswarupa, H.P.; Murthy, H.C.A.; Ravikumar, C.R.; Sabir, F.K. Enhanced photocatalytic and electrochemical performance of TiO2-Fe2O3 nanocomposite: Its applications in dye decolorization and as supercapacitors. Sci. Rep. 2020, 10, 1249. [Google Scholar] [CrossRef] [Green Version]
  87. Biglar, F.; Talaiekhozani, A.; Aminsharei, F.; Park, J.; Barghi, A.; Rezania, S. Application of ZnO-Nd Nano-Photocatalyst for the Reactive Red 198 Dye Decolorization in the Falling-Film Photocatalytic Reactor. Toxics 2021, 9, 254. [Google Scholar] [CrossRef]
  88. Raj, S.; Singh, H.; Trivedi, R.; Soni, V. Biogenic synthesis of AgNPs employing Terminalia arjuna leaf extract and its efficacy towards catalytic degradation of organic dyes. Sci. Rep. 2020, 10, 9616. [Google Scholar] [CrossRef]
  89. Wu, Q.; Wang, H.; Jia, Y.; Zhou, G. Kinetics of the acid orange 7 degradation in the photocatalytic system of UV/H2O2/TS-1. J. Water Process Eng. 2017, 19, 106–111. [Google Scholar] [CrossRef]
  90. Monsef, R.; Soofivand, F.; Alshamsi, H.A.; Al-Nayili, A.; Ghiyasiyan-Arani, M.; Salavati-Niasari, M. Sonochemical synthesis and characterization of PrVO4/CdO nanocomposite and their application as photocatalysts for removal of organic dyes in water. J. Mol. Liq. 2021, 336, 116339. [Google Scholar] [CrossRef]
  91. Krishnakumar, B.; Ravikumar, S.; Pandiyan, V.; Nithya, V.; Sylvestre, S.; Sivakumar, P.; Surya, C.; John, N.A.A.; Sobral, A.J. Synthesis, characterization of porphyrin and CdS modified spherical shaped SiO2 for Reactive Red 120 degradation under direct sunlight. J. Mol. Struct. 2020, 1210, 128021. [Google Scholar] [CrossRef]
  92. Krishnakumar, B.; Hariharan, R.; Pandiyan, V.; Aguiar, A.; Abilio, S.J.F.N. Gelatin-assisted g-TiO2/BiOI heterostructure nanocomposites for azo dye degradation under visible light. J. Environ. Chem. Eng. 2018, 6, 4282–4288. [Google Scholar] [CrossRef]
  93. Alghamdi, Y.G.; Krishnakumar, B.; Malik, M.A.; Alhayyani, S. Design and Preparation of Biomass-Derived Activated Carbon Loaded TiO2 Photocatalyst for Photocatalytic Degradation of Reactive Red 120 and Ofloxacin. Polymers 2022, 14, 880. [Google Scholar] [CrossRef] [PubMed]
  94. Krishnakumar, B.; Swaminathan, M. Solar Photocatalytic Degradation of Acid Black 1 with ZnO. Indian J. Chem. 2010, 49, 1035–1040. [Google Scholar] [CrossRef] [Green Version]
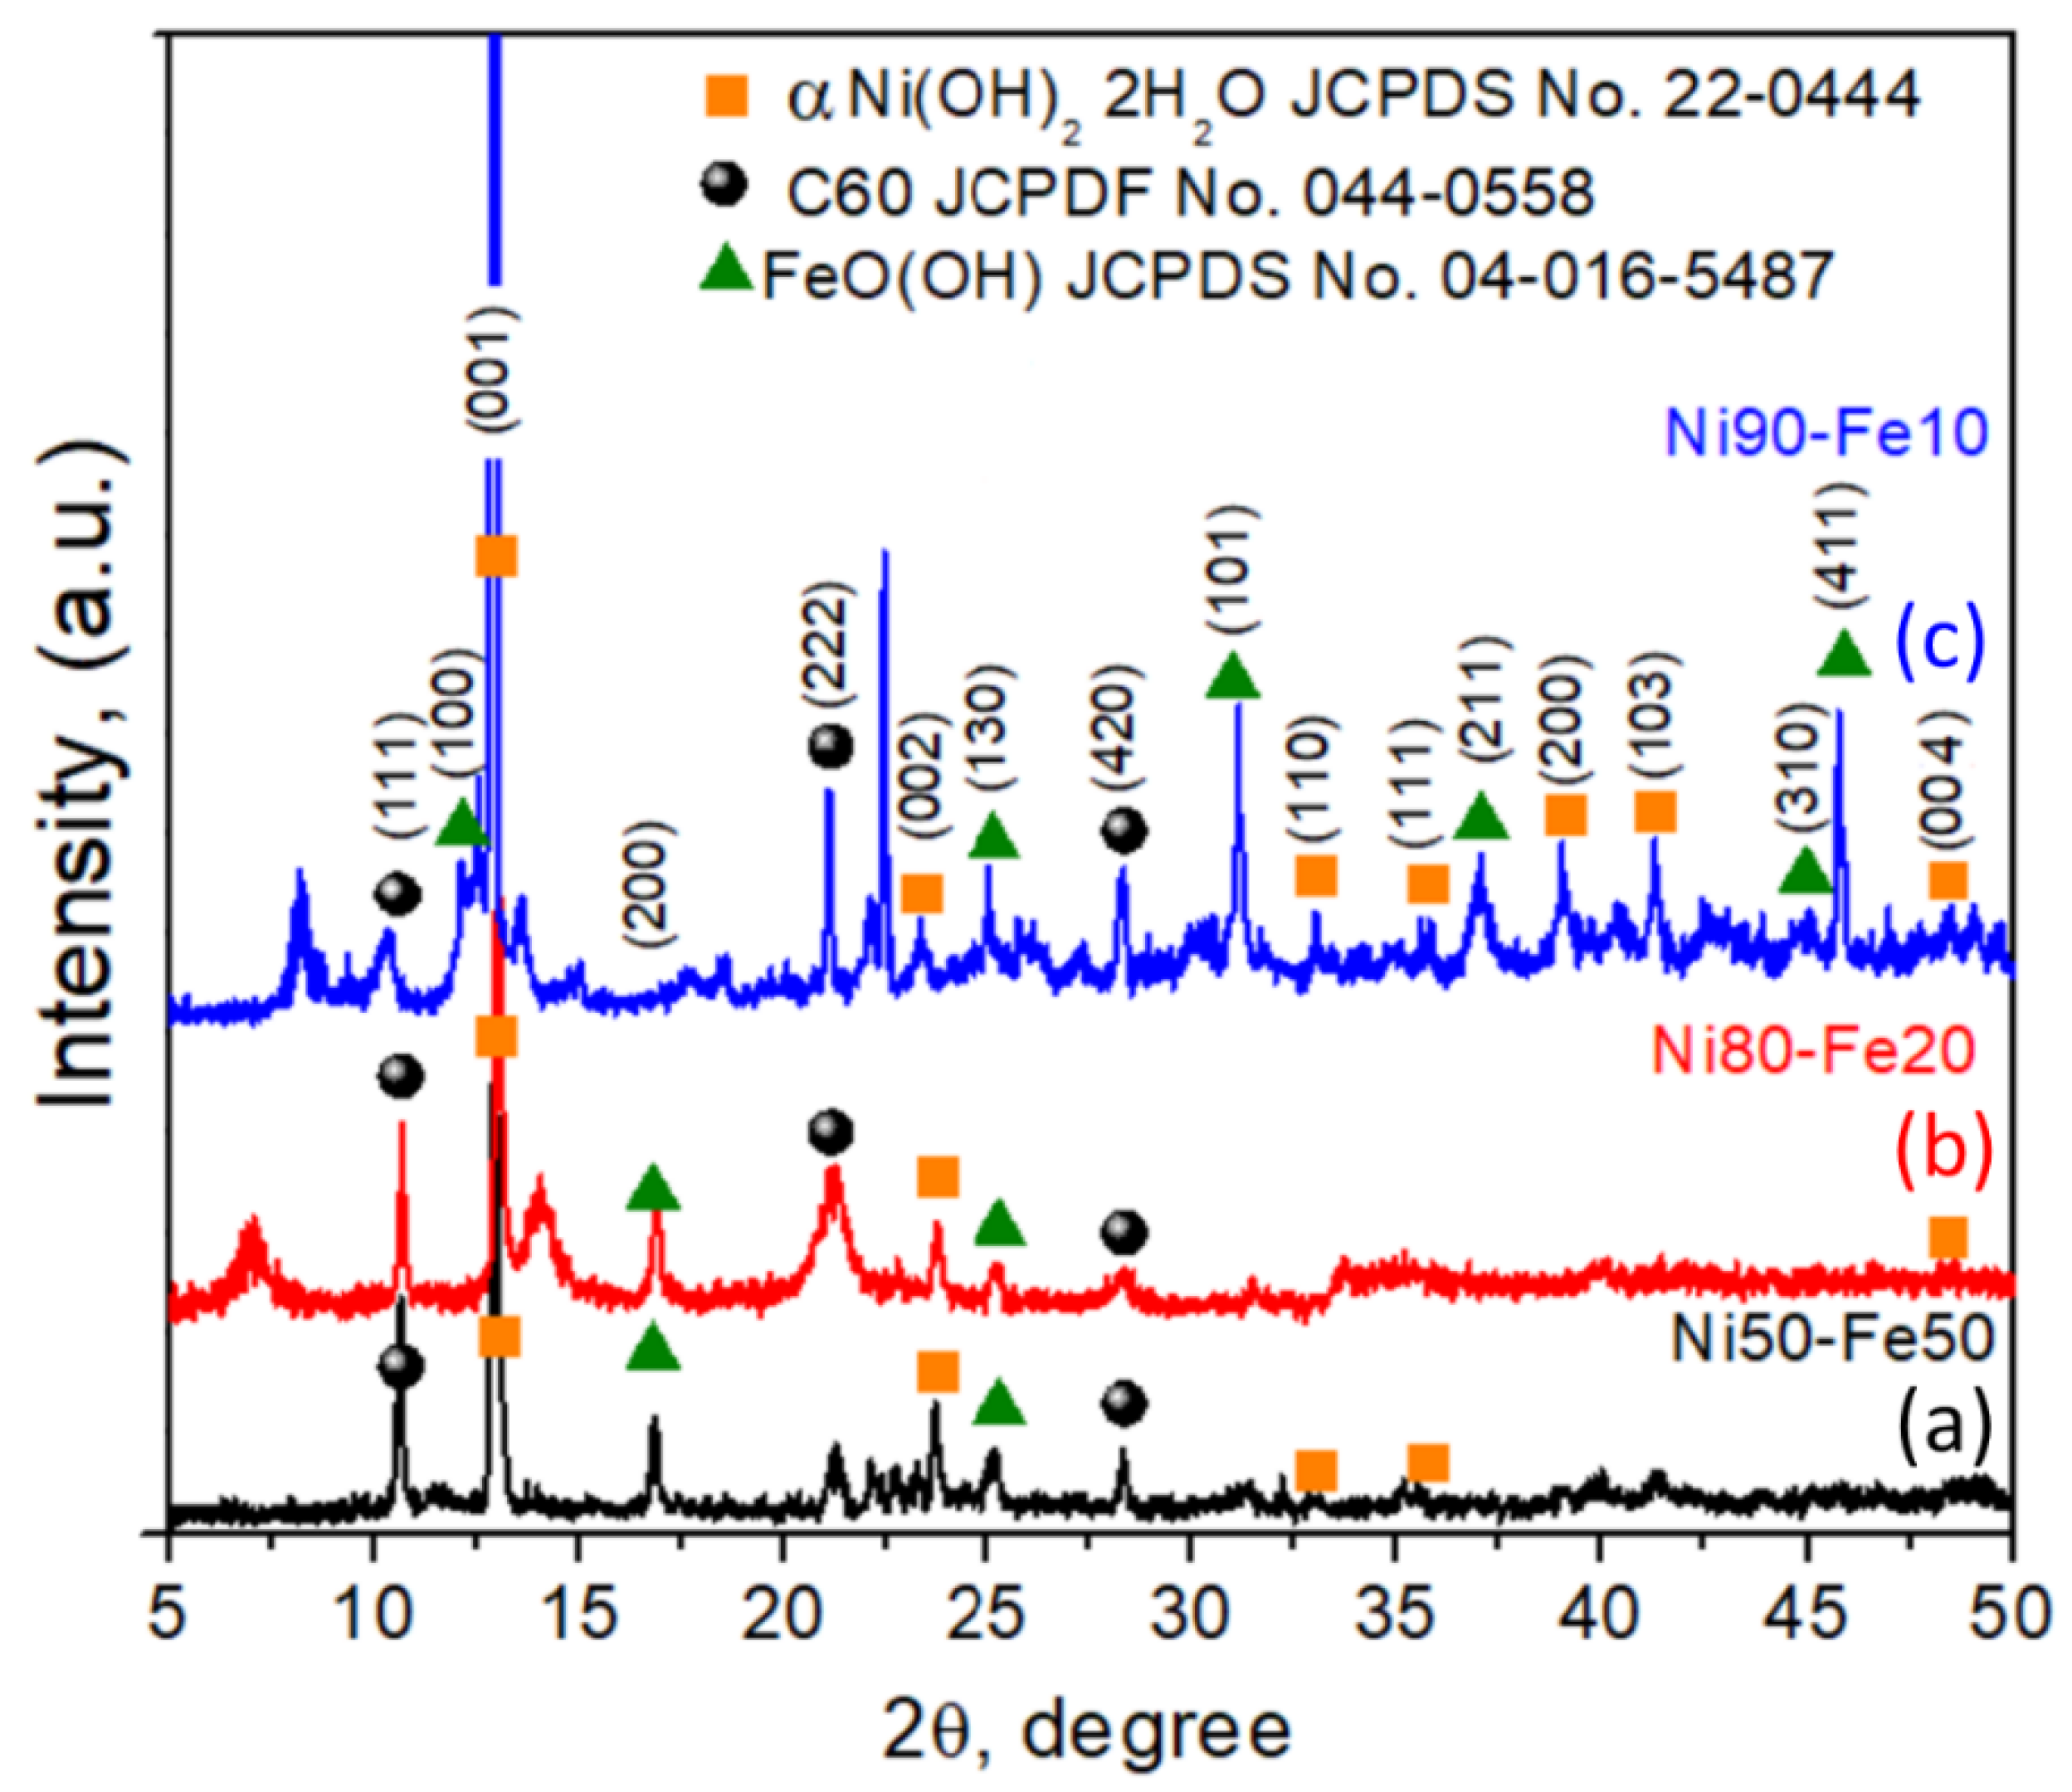
Figure 1. XRD patterns of as-prepared Ni50-Fe50 wt%, Ni80-Fe20 wt%, and Ni90-Fe10 wt% samples (a) Ni50-Fe50; (b) Ni80-Fe20; (c) Ni90-Fe10.
Crystals 12 01123 g001
Figure 2. Scanning electron micrographs of (A,B) Ni50-Fe50 wt%, (C,D) Ni80-Fe20 wt%, and (E,F) Ni90-Fe10 wt% samples at two different scales and zones as indicated by arrows. All samples are the products obtained from the application of 20 kHz ultrasonic irradiation.
Crystals 12 01123 g002
Figure 3. Transmission electron micrograph of (AC) Ni50-Fe50 wt%, (DF) Ni80-Fe20 wt%, and (G,H) Ni90-Fe10 wt% samples.
Crystals 12 01123 g003
Figure 4. FTIR spectra of (A) Ni50-Fe50 wt%, (B) Ni80-Fe20 wt%, and (C) Ni90-Fe10 wt% samples.
Crystals 12 01123 g004
Figure 5. XPS spectra for (AC) Ni 2p, (DF) Fe 2p, (GI) O 1s, and (JL) C 1s of the samples as indicated.
Crystals 12 01123 g005
Figure 6. Plots of (αhv)2 versus hv showing the band gap energies for Ni50-Fe50 wt% (A), Ni80-Fe20 wt% (B), and Ni90-Fe10 wt% (C) samples.
Crystals 12 01123 g006
Figure 7. Absorption spectra of RB5 catalyzed by (AC) Ni50-Fe50 wt%, (DF) Ni80-Fe20 wt%, and (GI) Ni90-Fe10 wt% samples.
Crystals 12 01123 g007
Figure 8. Percentage decolorization of RB5 at specific time intervals under different loads of Ni-Fe samples for (A) Ni50-Fe50wt%, (B) Ni80-Fe20wt%, and (C) Ni90-Fe10wt%.
Crystals 12 01123 g008
Figure 9. Kinetic plot for RB5 decolorization (A) Ni50-Fe50 wt%, (B) Ni80-Fe20 wt%, and (C) Ni90-Fe10 wt% samples.
Crystals 12 01123 g009
Table 1. Dye decolorization with photocatalytic materials.
MaterialSynthesisMorphologyDyeRef.
Ni-Fe-CSonochemicalLaminar morphologyRB5PW
rGO-ZnO-TiO2SonochemicalNanocomposite particlesMV[56]
Dy2Cu2O5SonochemicalNanostructuresPR[57]
Copper oxideGreen synthesisFlowersRO4, RY86[58]
La2Cu2O5SonochemicalSpherical Porous nanostructuresAB[59]
MnWO4SonochemicalNanostructuresAY23, MV[60]
ZnS QDs Cu2+, Mn2+, Ag+ doppedSonochemicalSphereVBR[61]
Ho2O3-SiO2 nanocompositesSonochemicalNanocompositesMB[62]
Graphene-Ce-TiO2, Graphene-Fe-TiO2SonochemicalNanosheetsMV[63]
La2Sn2O7/g-C3N4SonochemicalNanostructuresE, MV[64]
ZnO NPs, activated carbon and polypyrrole (ZCP)In situ synthesisNanocompositeMB[65]
Graphene oxide based semiconductorSeveral methodsNanostructuresSeveral dyes[66]
La9.33Si6O26SonochemicalNanoparticlesAR14[67]
Cu2HgI4SonochemicalNanostructuresAB1, MO, EO, MB, MV, RB[68]
ZnO-α-Fe2O3SonochemicalFlowersMB[69]
Metal doped TiO2Several methodsSeveral shapeSeveral dyes[70]
graphene oxide- TiO2SonochemicalNanosheets + nanospheresMO, CR, PN[71]
Mn doped ZnOGreen synthesisSpherical flakesMB[72]
Transition metal doped TiO2Sol-gelSeveral shapesMB[73]
Fe-doped Al2O3HydrothermalNanoplatformsMO[74]
TiO2-modified hydroxyapatiteSolvothermalNeedle-shaped structuresMB, AF[75]
Ca0.01Fe2.99O4/
CaTiO3 (CF/CT NC)
SolvothermalNanocomposite, nanospheres, rectangular prismMB[76]
V2O5-rGOHydrothermalNanocompositeRB[77]
Metal oxides, chalcogenides, and chalcohalides, Perovskite materials, Carbon based materials, Metal-Organic Frameworks (MOFs)Several methodsSeveral shapesSeveral dyes[78]
PrVO4Several methodsNanoparticlesEBT, E, MV[79]
TiO2 − WO3
Bi2O3/SiO2
HydrothermalSphere-like mesoporous nanoparticlesRB[80]
siloxeneChemical exfoliationNanosheetsMB, AA, AB, MG[81]
BiCeO3/MWCNTs (BCM)HydrothermalNanotubesMR[82]
TiO2SolvothermalNanostructuresRB, MB, EY[83]
Fe-TS-1 zeoliteQuick synthesisNanospheresAO7[84]
CdS/TiO2PrecipitationSpherical nanoclustersAB[85]
TiO2-Fe2O3Green synthesisNanospheresTY, MO[86]
ZnO-NdSolution combustionNanoporous particlesRR198[87]
AgNPsGreen synthesisNanospheresMO, MB, CR, 4N[88]
UV/H2O2/TS-1Quick synthesisPowderAO7[89]
PrVO4/CdOSonochemicalNanostructuresMB, E[90]
CdS/SiO2 compositeSol-gelNanospheresRR120[91]
g-TiO2/BiOISol-gelNanospheresAB 1[92]
AC-TiO2Sol-gelNanostructuresRR120[93]
ZnOPurchsed MerckMicrostructuresAB 1[94]
Description: PW Present work, RB5 Reactive Black 5, PR Phenol red, RO4 Reactive Orange-4, RY86 Reactive Yellow-86, AB Acid black, AY23 Acid Yellow 23, VBR Victoria blue R, MB Methylene blue, E Erythrosine, MV Methyl violet, AR14 Acid red 14, AB1 Acid Black 1, MO Methyl Orange, EO Eosin, RB Rhodamine B, CR Congo red, P-N p-nitrophenol, AF Acid fuchsin, EBT Eriochrome, black T, AA Azure A, AB Azure B, MG Malachite green, MR Mordant red, EY Eosin Y, AO7 Acid orange 7, AB Acid Blue, TY Titan Yellow, RR198 Reactive red 198, 4N 4-nitrophenol, RR120 Reactive Red 120, AB 1 Acid black 1.
Publisher’s Note: MDPI stays neutral with regard to jurisdictional claims in published maps and institutional affiliations.